Article

Cold Chain Energy Analysis for Sustainable Food and Beverage Supply

1
Department of Mechanical and Industrial Engineering, Università degli Studi di Brescia, Via Branze 38, 25123 Brescia, Italy
2
Department of Civil, Environmental, Architectural Engineering and Mathematics, Università degli Studi di Brescia, Via Branze 43, 25123 Brescia, Italy
*
Author to whom correspondence should be addressed.
Sustainability 2022, 14(18), 11137; https://doi.org/10.3390/su141811137
Submission received: 22 July 2022 / Revised: 23 August 2022 / Accepted: 26 August 2022 / Published: 6 September 2022
(This article belongs to the Section Economic and Business Aspects of Sustainability)

Abstract

:
Perishable goods, such as chilled and frozen foods, have a short shelf life and high sensitivity to their surrounding environment (e.g., temperature, humidity, and light intensity). For this reason, they must be distributed within a specific time and require special equipment and facilities (e.g., refrigeration and dehumidification systems) throughout the entire chain from farm to fork to ensure slow deterioration and to deliver safe and high-quality products to consumers. Cold chains can last for short periods, such as a few hours, or for several months or even years (e.g., frozen food products) depending on the product and the target market. A huge amount of energy is required to preserve quality by maintaining the desired temperature level over time. The required energy is also affected by inventory management policies (e.g., warehouse filling levels affect the cooling demand per unit of a product) and the behavior of the operators (e.g., number and duration of door openings). Furthermore, waste entails the loss of energy and other resources consumed for processing and storing these products. The aim of the present study is to propose a quantitative approach in order to map the energy flows throughout the cold chain in the food and beverage sector and to evaluate the overall energy performance. The results of the energy flow mapping give decisionmakers insights into the minimum energy required by the cold chain and allow them to prioritize energy efficiency measures by detecting the most energy consuming stages of the cold chain. The implementation of a holistic approach, shifting from a single-company perspective to chain assessment, leads to a global optimum and to an increased implementation rate of energy efficiency measures due to the reduced barriers perceived by different actors of the cold chain.

1. Introduction

The food supply chain involves a series of processes for the production and distribution of foodstuff, starting from raw materials’ processing until the final goods are available to the final customer (i.e., “from farm to fork”). These processes are managed by a set of companies operating with different purposes and at different stages, thus creating a network. Among food products, two main categories can be identified: deteriorating and ameliorating (or aging) items [1]. Both present a high sensitivity to the surrounding environment (e.g., temperature, humidity, and light intensity). For this reason, they should be properly stored at the different stages of the supply chain in order to guarantee the desired quality to consumers. A majority of the food supply chain deals with slowing down the deterioration of chilled and frozen foods. Cold chains refer to the various stages that a refrigerated product passes through and are responsible for the preservation and transportation of perishable goods and for delivering safe and high-quality products to consumers. At the EU and national levels, regulations that define the maximum temperature levels to preserve food and to ensure environmental safety have been introduced. For instance, in 2006, the European Commission revised the regulation on the hygiene of foodstuffs (EC No. 852/2004), requiring manufacturers to have proper monitoring, control, and a record of temperatures during handling and storage activities. The Agreement for Transport of Perishable (ATP) introduced by the Inland Transport Committee of the United Nations Economic Committee for Europe in 1970 regulates the transport of this category of products, defining shared standards for temperature-controlled vehicles that are internationally recognized.
However, currently, up to 30% of foodstuff is lost before it reaches domestic refrigerators due to incorrect refrigeration [2], leading to economic, environmental, and ethical issues. Food waste refers to an unacceptable level in the quality of the food or to useless food being discarded by retailers or consumers due to microbial decay, disease, or insect damage. Failure to keep perishable items in a suitable environment or failure to ensure on-time delivery to customers leads to a huge waste of resources. Many causes can be identified, such as an unsuitable temperature for storage and transportation activities and interruptions in the cold chain (e.g., door openings and uncovered last-mile deliveries) [3,4]. In cold chains, temperature abuse and fluctuations above or below the optimal product-specific temperature range frequently occur, which reduces the efficiency of the cold chain and the product quality offered to consumers. This significantly increases resource waste if not enough refrigeration is supplied, and it results in an increase in the energy used by the refrigeration systems and vice versa. Product quality and energy consumption tackle a trade-off: lower temperatures, due to a higher refrigeration load, increases the quality preservation of perishable foodstuff; however, at the same time, increases energy consumption, with a consequent increase in costs and GHG emissions.
A key element within cold chains is energy in its different forms, as it is a necessary source to guarantee the quality of the products. Furthermore, the use of energy implies the consumption of resources (frequently, non-renewable ones), which directly influences the sustainability of the supply chain considered, in addition to its economic performance. A total of 78% of the adverse environmental effects of refrigeration are due to the indirect emissions produced by fossil fuel power plants for the generation of the energy required to power the systems (about 60% for refrigeration equipment and 18% for the diesel used for refrigerated transport [5]). The remaining 22% of the global-warming impact is caused by direct emissions from the leakages of fluorocarbons (i.e., CFCs, HCFCs, and HFCs) [6,7].
Energy efficiency improvements in refrigeration systems represent a noteworthy solution for reducing environmental impacts, and they can be obtained by investing in new and more efficient technologies or by implementing simple and less expensive maintenance [8] and/or management practices [9]. For instance, the distribution network design and the routing of refrigerated transport affect storage and transportation activities and the related energy consumption of refrigeration equipment [10]. Operational practices (e.g., lot-sizing decisions and temperature monitoring and control) have been scarcely investigated in the literature, and the focus has mainly been on the technological ones. For instance, Chen et al. [11] proposed a model for a cold chain operated among a single-product manufacturer and multiple retailers to minimize the total cost while considering the quality degradation of the product as a function of storage temperature and time. Specifically, they considered a global stability index as a measure of the overall product’s quality.
The activities at different stages of the cold chain can affect the impacts at a specific stage, and improvement measures of environmental and economic performances (such as energy efficiency measures, or EEMs) might involve changes that result in larger savings and benefits to the supply chain rather than for the single company [12]. A cold chain of perishable products should be investigated with a multidisciplinary and integrated view since the integration of competences, issues, and decisions represents the most important future challenge for the food supply chain. This integration involves the processes of design, planning, management, and control of the logistic system [13]. In addition, the supply chain perspective supports companies in the overcoming of the main barriers to the implementation of EEMs, which are usually the access to capital for the initial investment and the lack of awareness and knowhow; for instance, by providing additional savings and non-energy benefits to a cold chain’s partners [12,14].
The management of cold chains and inventory policies for these products have already been discussed in the literature. However, the two-stage supply chain (i.e., single vendor single buyer) and the single company perspectives have been mainly considered while minimizing the overall costs. The focus on costs leads to economic sustainability, but not necessarily sustainability for the environmental and social dimensions, which are the mostly affected by the trade-off between energy and quality.
The aim of the present study is to propose a simplified and general model based on a holistic point of view (i.e., multiple stages from farm to fork) for the assessment of the energy performance of the cold chains in the food and beverage industry while considering the quality losses due to an inappropriate refrigeration. The focus will be on the stages of the chain with temperature control requirements and on logistic activities (e.g., refrigerated transport and cold warehouses), since temperature abuses occur notably in storage (such as display cabinets), transport activities, and domestic refrigeration [3,15]. This approach also allows one to increase the applicability of the model since it does not consider the energy consumptions of production processes which are strictly dependent on the specific product. The developed methodology also allows us to evaluate the impact that operational practices can have on the improvement of the cold chain sustainability in terms of specific energy consumption. Hence, the main novelties introduced are:
-
Multi stages perspective: A multidisciplinary and integrated view has been considered. For instance, inventory levels have been modelled for each stage of the cold chain, since they affect each other and impact on the specific energy consumption;
-
Methodology for the assessment of cold chain energy performance: A practical approach is proposed for the evaluation of the cold chain energy performance for supporting decisionmakers. Specifically, the described approach has also been used for the development of benchmarking datasets for food and beverage cold chains;
-
Methodology for the prioritization of energy efficiency measures: The potential of energy efficiency measures (especially, of the maintenance and operational ones) in reducing the overall specific energy consumption of the cold chain depends on the stage at which they are implemented. The most benefits are obtained if measures are implemented at stages with the poorest energy performance;
-
Real case study for the dairy sector: one of the main literature gaps is the absence of practical case studies providing real managerial insights.
To this end, the paper is organized as follows. Section 2 defines the methodology for the proposed approach and provides the mathematical model. Section 3 proposes a case study on the dairy sector devoted to investigating the behavior of the methodology. Section 4 provides a discussion of the results and some managerial insights. Finally, some concluding remarks and foreseeable developments are given in Section 5.

2. Cold Chain Energy Analysis

This section is focused on the model definition for performing the trade-off analysis between energy and quality along the cold chain. Specifically, Section 2.1 defines the problem with the main assumptions. Section 2.2 and Section 2.3 provide details on the model for the energy consumptions of the storage activities and of the transportation activities, respectively. Finally, Section 2.4 presents the model for evaluating the quality losses along the cold chain and their impact on the overall specific energy consumption.

2.1. Problem Definition

The structure of the cold chain analyzed (Figure 1) is designed to be as general as possible. It considers a supplier that processes a raw material at a production rate P S and sells it to a producer who performs additional production processes at a rate P P to obtain the finished product. The finished product is then shipped to a distribution center which meets the demand of the retailer to firstly fill the display area and then, with the remaining amount of product, the backroom warehouse. Each actor of the cold chain purchases a quantity of material from the upstream stage equal to the exact need for n i production and/or ordering cycle, which are the integer multiple of the lot size ordered by the retailer to be placed in the display area, Q , to avoid unnecessary stock. For the delivery of each batch, it is not necessary to wait for the completion of the production lot: i.e., the transportation activity is enabled by the completion of the lot ordered by the downstream stage. The focus of the study is on the logistic activities; hence, transportations among the different stages of the supply chain are considered. Stages of the cold chain which are not relevant from an energetic point of view could be excluded from the analysis.
Other assumptions, relevant to the development of the models, are listed hereafter:
  • The time horizon is infinite;
  • The final demand rate D and the demand for raw material D r m are deterministic and constant over time;
  • The production rate P i is deterministic, constant, and greater than the demand rate ( P S > P P > D );
  • The replenishment cycle is the same, and it is repeated D / Q times in a year;
  • No stockout is allowed at the costumer ends;
  • The lead times are negligible and assumed as zero.
Table 1 defines all the data that should be gathered for the different stages of the cold chain. The general data are specific for the considered product. Storage activities’ data should be collected for the raw material supplier’s warehouse, the raw material and the finished product warehouses at the producer, the distribution center’s warehouse, and the backroom warehouse and the display area at the retailer. Moreover, the data related to the transportation activities should be collected for the single drop transport from the supplier to the producer, for the single drop transport from the producer to the distribution center, and for the multi drop transport from the distribution center to the retailer.

2.2. Storage Activities

The annual energy use for cooling and refrigeration purposes, which is the focus of the present study, is given by the contribution of different energy carriers, such as electricity, natural gas, and diesel. These contributions are normalized in equivalent energy use through the related kWh conversion factors. The specific energy consumption of warehouse i ( S E C S , i ) can be defined, in kWh/m3 year, as follows:
S E C S , i = E i S i
where S i represents the size of the cold warehouse (m3) and E i the annual energy use related to the refrigeration and cooling purposes in logistics (kWh/year).
The SEC of the storage activities per unit of product (kWh/kg) is then related to the specific volume of the product, ω k (kg/m3), and to the storage time, τ i (year).
S E C i ( S i ) = E i S i ω k τ i
In accordance with the shipment policy described in the problem setting, the following equations define, respectively, the average inventory levels in the raw material warehouse at the supplier (3), in the raw material and in the finished product warehouses at the producer (4) and (5), in the distribution center (6), in the backroom warehouse, and in the display area at the retailer (7) and (8). Specifically, the average inventory levels are calculated as the area below by the inventory level curves during the replenishment cycle (for instance, see Figure 2).
A I L S = α Q 2 ( D n P n D C n R ( 2 n S ) P S + n P n D C n R n S 1 )
A I L P _ R M = n P n D C n R α Q 2
A I L P _ F P = Q 2 ( D n R n D C ( 2 n P ) P P + n P n D C n R 1 )
A I L D C = ( n R 1 ) 2 ( n D C + 1 ) Q 2 n R
A I L R _ B = ( n R 1 ) Q 2
A I L R _ D A = Q 2
The storage time per each warehouse, τ i , can be defined through the days of inventory ratio (DSI), i.e., the inverse of the inventory turnover, which looks at the average time a company can turn its inventory into sales.
τ i = D S I   ( y e a r ) = A I L i X
where A I L i represents the average inventory level in the warehouse i (kg), while X defines the speed at which the inventory is consumed and varies accordingly to the considered actor (kg/year). Hence, the following equations define, respectively, the average storage time for the raw material warehouse at the supplier (10), the raw material and the finished product warehouses at the producer (11) and (12), the warehouse at the distribution center (13), the backroom warehouse and the display area at the retailer (14) and (15).
τ S = A I L S P S
τ P _ R M = A I L P _ R M P P
τ P _ F P = A I L P _ F P P P
τ D C = A I L D C D
τ R _ B = A I L R _ B D
τ R _ D A = A I L R _ D A D
However, Equation (2) does not consider the impact of the filling level of the refrigerated warehouse, I i ( x ) , on the SEC. Refrigerated warehouses should be kept as full as possible to perform more efficiently and to reduce specific energy consumption. Equation (16) defines how the filling level of the warehouse affects the SEC, and it is based on empirical data and observations [16].
S E C i ( I i ( x ) , S i ) = S E C i ( S i ) + δ i ( 1   I i ( x ) ω k S i ) γ i
where the first term corresponds to the specific energy consumption per unit of product defined in Equation (2), while the second term defines the increase in the SEC due to the partial utilization of the warehouse (i.e., when the filling level is lower than 1), which is a function of the two coefficients δ i and γ i . The filling level is evaluated as the ratio between the volume of the materials in the warehouse requiring refrigeration,   I i ( x ) / ω k , and the warehouse size.
Finally, the specific energy consumption should also be adjusted to consider the actual temperature set inside the warehouse, T w , i , which can differ from the reference temperature, T r , i , to which correspond the energy consumption gathered as an input data. Lower (higher) cooling temperatures increase (reduce) the SEC. T w , i allows to evaluate how the specific energy consumption varies if temperatures different from T r , i are set inside the warehouse.
S E C i ( T w , i , I i ( x ) , S i ) = S E C i ( I i ( x ) , S i ) ρ T w , i
where ρ T w , i = C O P T r , i C O P T w , i , and C O P T = T c o l d T h o t T c o l d [17]. Specifically, T h o t and T c o l d are the absolute temperatures of the hot and cold heat reservoirs, respectively. For sake of simplicity, it is possible to consider T h o t as the average outside environmental temperature at the locations of the cold chain actors in the hottest season, while T c o l d is the average temperature inside the warehouse.

2.3. Transport Activities

The energy consumption related to the transportation activities is linked to the power required by the cooling and ventilation equipment and the energy related to fuel consumption. Since, at each delivery cycle, Q i unit are transported, the specific energy consumption per unit of product (kWh/kg) is obtained as follows:
S E C T , j = V j ( W e , j t j + ε j f c j ) Q i
where V j represents the number of vehicles necessary to deliver the lot of size Q i , ε j the fuel conversion factor (kWh/L), t j the average travelling time requiring refrigeration (h/trip), W e , j the electrical power required to power on the equipment (kW),   f c j the fuel consumption per trip (l/trip), and Q i the lot size ordered that should be shipped. The number of vehicles per trip depends on the payload of the same vehicle and on the lot size to be transported.

2.4. Quality Losses

The storage time τ i , the storage temperature T w , i , and additional parameters depending on the storage atmosphere, also affect the quality of food products accelerating or decelerating its degradation. Peleg et al. (2002) [18] proposed a Weibull-power law model to describe the isothermal degradation of food quality, depending on the storage temperature and time which allows to overcome some limitation of the Arrhenius equation, which gives equal weight to rate deviations at the low- and high-temperature regions. Specifically, Equation (19) defines the quality level for stage i .
q i ( T w , i , τ i ) = q 0 , i e b i ( T w , i ) τ i η k ( T w , i )
where b i ( T w , i ) and η k ( T w , i ) are product- and temperature-dependent coefficients and q 0 , i represents the initial quality level for stage i . In particular, Peleg et al. [18] empirically found that b ( T ) can be described in the form of a log–logistic relationship:
b i ( T w , i ) = ln ( 1 + e m k ( T w , i T C , k ) )
where T w , i is the temperature (°C) and m k and T C , k are constants. The same formulas are valid for the definition of the quality level in transportation activities:
q j ( T w , j , t j ) = q 0 , j e b j ( T w , j ) t j η k ( T w , j )
The temperature along the cold chain is not uniform. Therefore, the total quality decrease may be determined by summing the percentage quality decrease at every step of the chain which depends on the temperature level set at each supply chain step, i [ q 0 , i q i ( T w , i , τ i ) ] + j [ q 0 , j q j ( T w , j , t j ) ] . Additionally to the well-known production of methane and other greenhouse gases during food degradation and the societal impact of wasting food in a world where the population is constantly growing and land resources are reaching the saturation point, a relevant consequence of food waste includes the loss of the energy consumed for food processing and storage [19]. Since the aim of the present study is the evaluation of the cold chain energy consumption, the impact of the quality losses occurring along the supply chain activities from farm to fork on the actual specific energy consumption ( S E C ) is valued as follows:
S E C = i S E C i + j S E C T , j i [ q 0 , i q i ( T w , i , τ i ) ] + j [ q 0 , j q j ( T w , j , t j ) ]
where i and j represent the step of the supply chain.

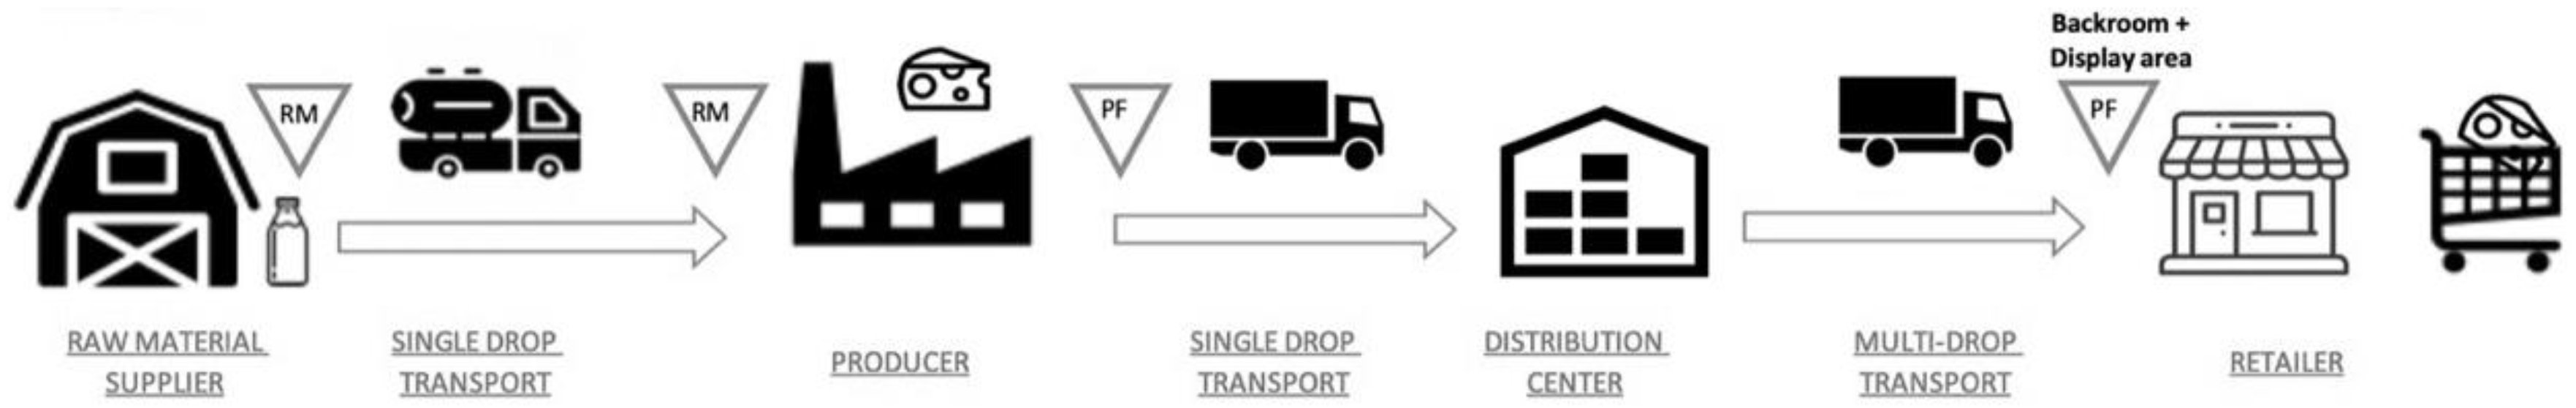
3. The Dairy Cold Chain Case Study

The present section offers a case study that refers to the dairy industry to illustrate the behavior of the proposed model and to provide insights on the assessment of the energy consumption along the cold chain. Specifically, the focus is on the production and distribution in chilled conditions. The input data necessary for the evaluation of the SEC were directly gathered through interviews to European companies of the dairy industry and/or logistic companies. The raw material is raw milk, while the finished product is a wedge of cheese requiring cooling for storage, which present a specific volume of about 780 kg/m3 and 78 kg/m3, respectively. We also consider that about 10 kg of milk is required for producing 1 kg of cheese, and the demand faced by the cold chain is equal to 86.8 ton/year. Due to the specific product considered, we assume that the raw material cannot be stored due to the high rate of degradation: in fact, generally, once enough milk is collected from the supplier to fill the vehicle, it is immediately shipped to the producer. The producer has a small warehouse for the incoming milk, which is emptied at a rate equal to its production rate. The warehouses and the transportation vehicles are not product-dedicated; hence, they can be oversized with respect to the lot sizes and the final demand. Other relevant parameters used for the storage and transportation activities are defined in Table 2 and Table 3, respectively. General parameters valid for each stage of the supply chain are defined in Table 4. For the ambient temperature, the average value in the hottest season has been considered, since it represents the most critical scenario for refrigeration requirements.
The results lead to a total specific energy consumption of 0.55 kWh/kg of cheese, while considering the logistic activities along the cold chain. From Figure 3, which shows the SEC for each stage of the cold chain, it can be seen that the producer is the actor with the highest SEC contribution (0.179 kWh/kg, covering about the 33% of the total SEC) followed by the transport from the producer to the distribution center (0.107 kWh/kg, 19%). Furthermore, 71.48% of the SEC is related to the electricity consumption of refrigeration systems, while the remaining 29% is related to diesel consumption for fueling the vehicles.
A critical aspect of the cold chain is due to the trade-off between energy consumption for preserving the foodstuffs and the quality losses along the chains, i.e., lower temperatures allow for a reduction in quality losses; however, they come at an increased energy consumption. Figure 4 shows the trend of quality losses evaluated as a function of the temperature and the storage time through the equations defined in Section 2.4, while, in Figure 5, the average storage time at each stage of the cold chain is shown. The highest losses occur at the producer site: 27% at the raw material warehouse was due to the higher degradation rate of the milk with respect to the cheese, and 16% at the finished product warehouse was due to the high average storage time (about 1 month). It is interesting also to observe that the amount of product given to the retailer is sized to cover the demand of half a week (while considering both the backroom and the display area). Since the resources spent for producing goods with inadequate organoleptic properties and nutrients along the chain are lost, the SEC should be adjusted, considering the effective production through Equation (22). The actual specific energy consumption (with quality considerations) results in 1.079 kWh/kg, which means that almost twice the estimated SEC related only to the logistic activities.
The three main management levers, impacting both on the specific energy consumption and on quality losses, which represent potential EEMs, are: (i) the temperature set for the raw material, (ii) the temperature set for the finished product, and (iii) the lot size for the display area at the retailer ( Q ). A sensitivity analysis is then performed to find the optimal combination of these three levers. Since the impact of the two temperature is independent, the sequence of optimization is not relevant. Figure 6 and Figure 7 shows that higher temperatures lead to higher quality losses and lower energy consumptions for refrigeration and that an optimal value exists. The optimal temperature (while minimizing the total specific energy consumption, with considerations on the quality losses) results were 273 K and 277 K, respectively, for the raw material and the finished product (Figure 8). By changing both the temperatures, the total SEC reaches a value of 0.641 kWh/kg of finished product, which means a reduction in the initial total SEC by 41%. While temperature impacts on the energy required for refrigeration (hence, on the SEC of the logistic activities) and on the quality losses, the lot size impacts on the storage time and on the quality losses. The lower the lot size, the lower the storage time and, hence, the lower the quality losses. Comparing Figure 6 and Figure 7 with Figure 9, it is possible to observe that, for the specific case study, the impact of the temperature on the quality losses is higher than the impact of the storage time. The results in Figure 9 also shows that the optimal lot size corresponds to the initial increase by about 40%. However, this lot size is not admissible due to the limited storage size of the display area. Hence, the optimal admissible size is 312 kg of finished product (as the initial one).

4. Discussion

The decision-supporting model developed allows us to assess the performance of the cold chain in terms of specific energy consumption while considering both the logistic activities (i.e., storage and transportation) and the quality degradation in terms of nutrient losses at different stages (namely “Total SEC”). The total SEC represents a significant indicator that should be monitored to optimize the sustainability of the cold chain and to evaluate the effects that energy efficiency measures have on it. Specifically, the focus is on the managerial measures that can reduce the total SEC, i.e., the monitoring and control of the storage temperature of different products (raw material and finished product) and the batch sizes which directly affect the storage time. These two measures impact both on the total SEC, since the temperatures and the storage time are the two parameters that mainly determine the quality degradation, and the refrigeration required. As can also be observed in the case study, the higher the storage temperature, the lower the energy consumption for the logistic activities but the higher the quality degradation. At the same time, the lower the batch size, the lower the storage time and, consequently, the lower the quality degradation that is given the same temperature of storage.
The model assesses the performance of the whole cold chain but also provides details for each stage in terms of specific energy consumptions per energy carrier, storage time, and quality losses. Hence, it is possible to identify the stage in which it is better to implement energy efficiency measures to have greater benefits. The holistic approach allows us to include in the assessment of the interaction between the different steps of the cold chain and to detect additional measures and benefits. For instance, it can reduce the barriers perceived (e.g., access to capital or lack of knowledge) to support weaker partners with the poorest energy efficiency performance to implement energy efficient practices [20]. In summary, the holistic view of the cold chain over the life cycle of the products could produce a substantial and positive outcome on sustainability. The life cycle perspective can spread costs and risks across supply chain actors, can decrease the concerns related to the diverging priorities of short- and medium-term financial targets, and enable the overcoming of the main barrier against the implementation of EEMs [9].
For instance, from the case study proposed, the following managerial insights can be obtained:
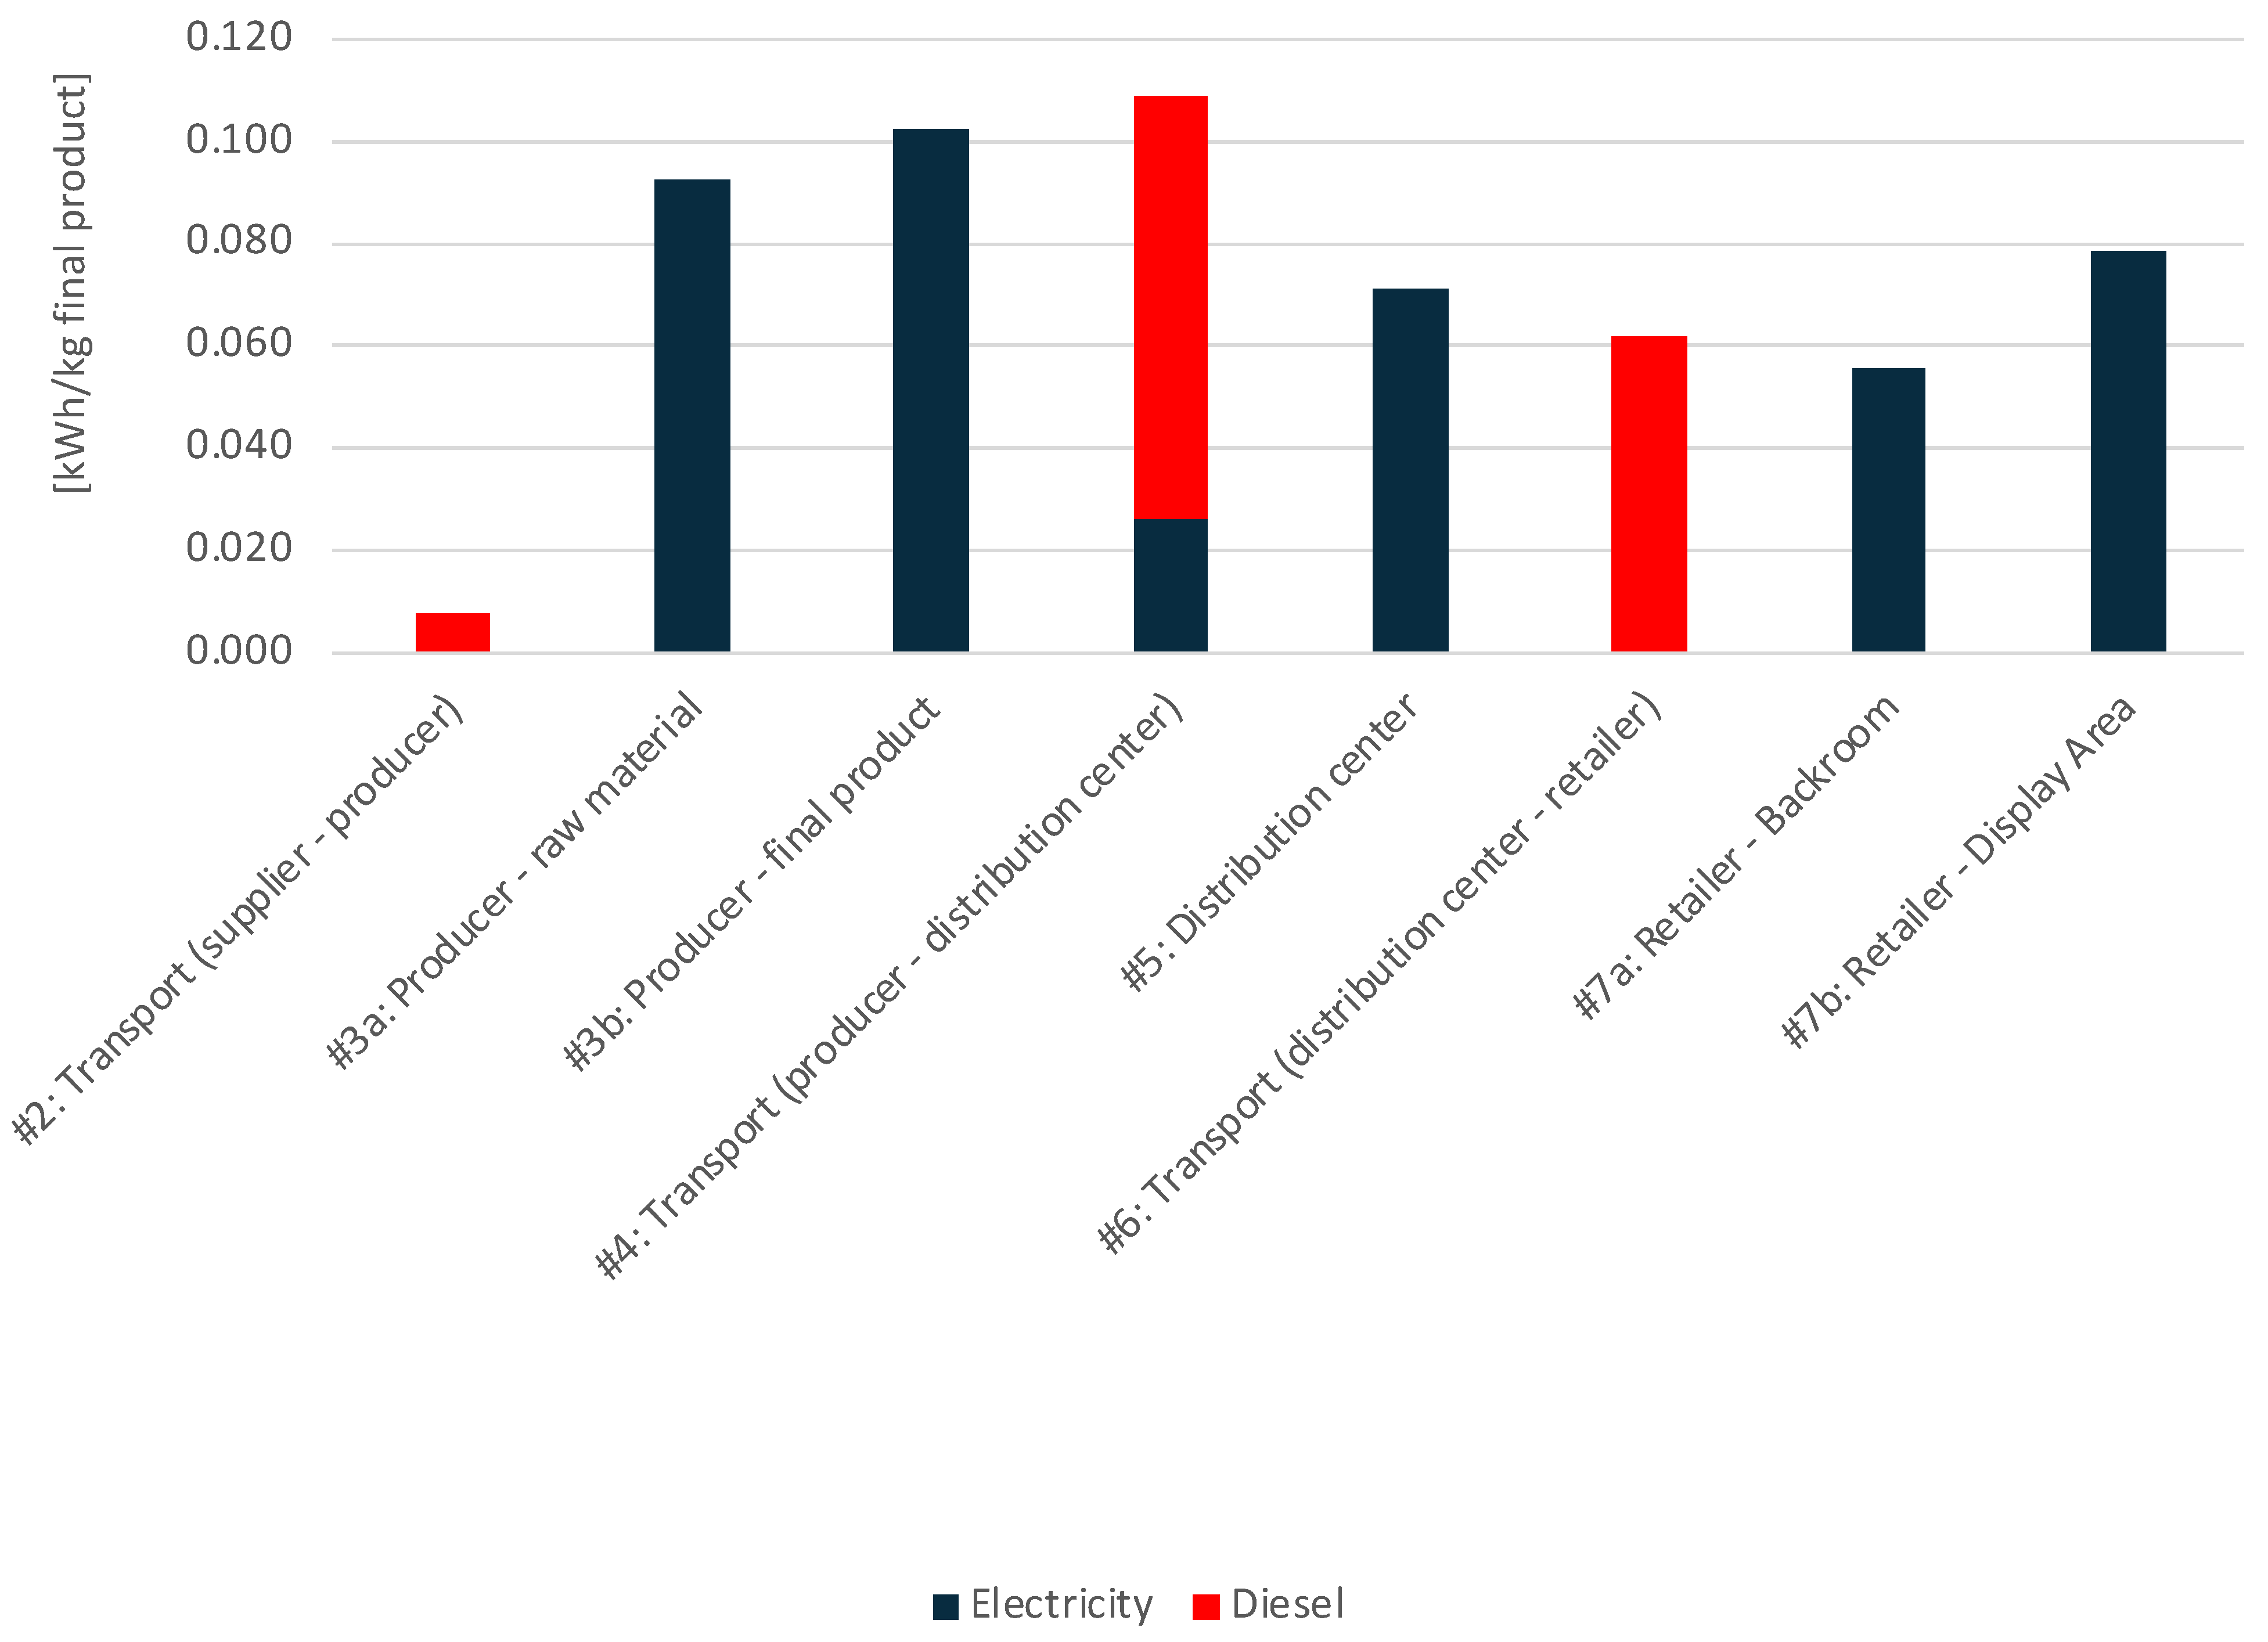
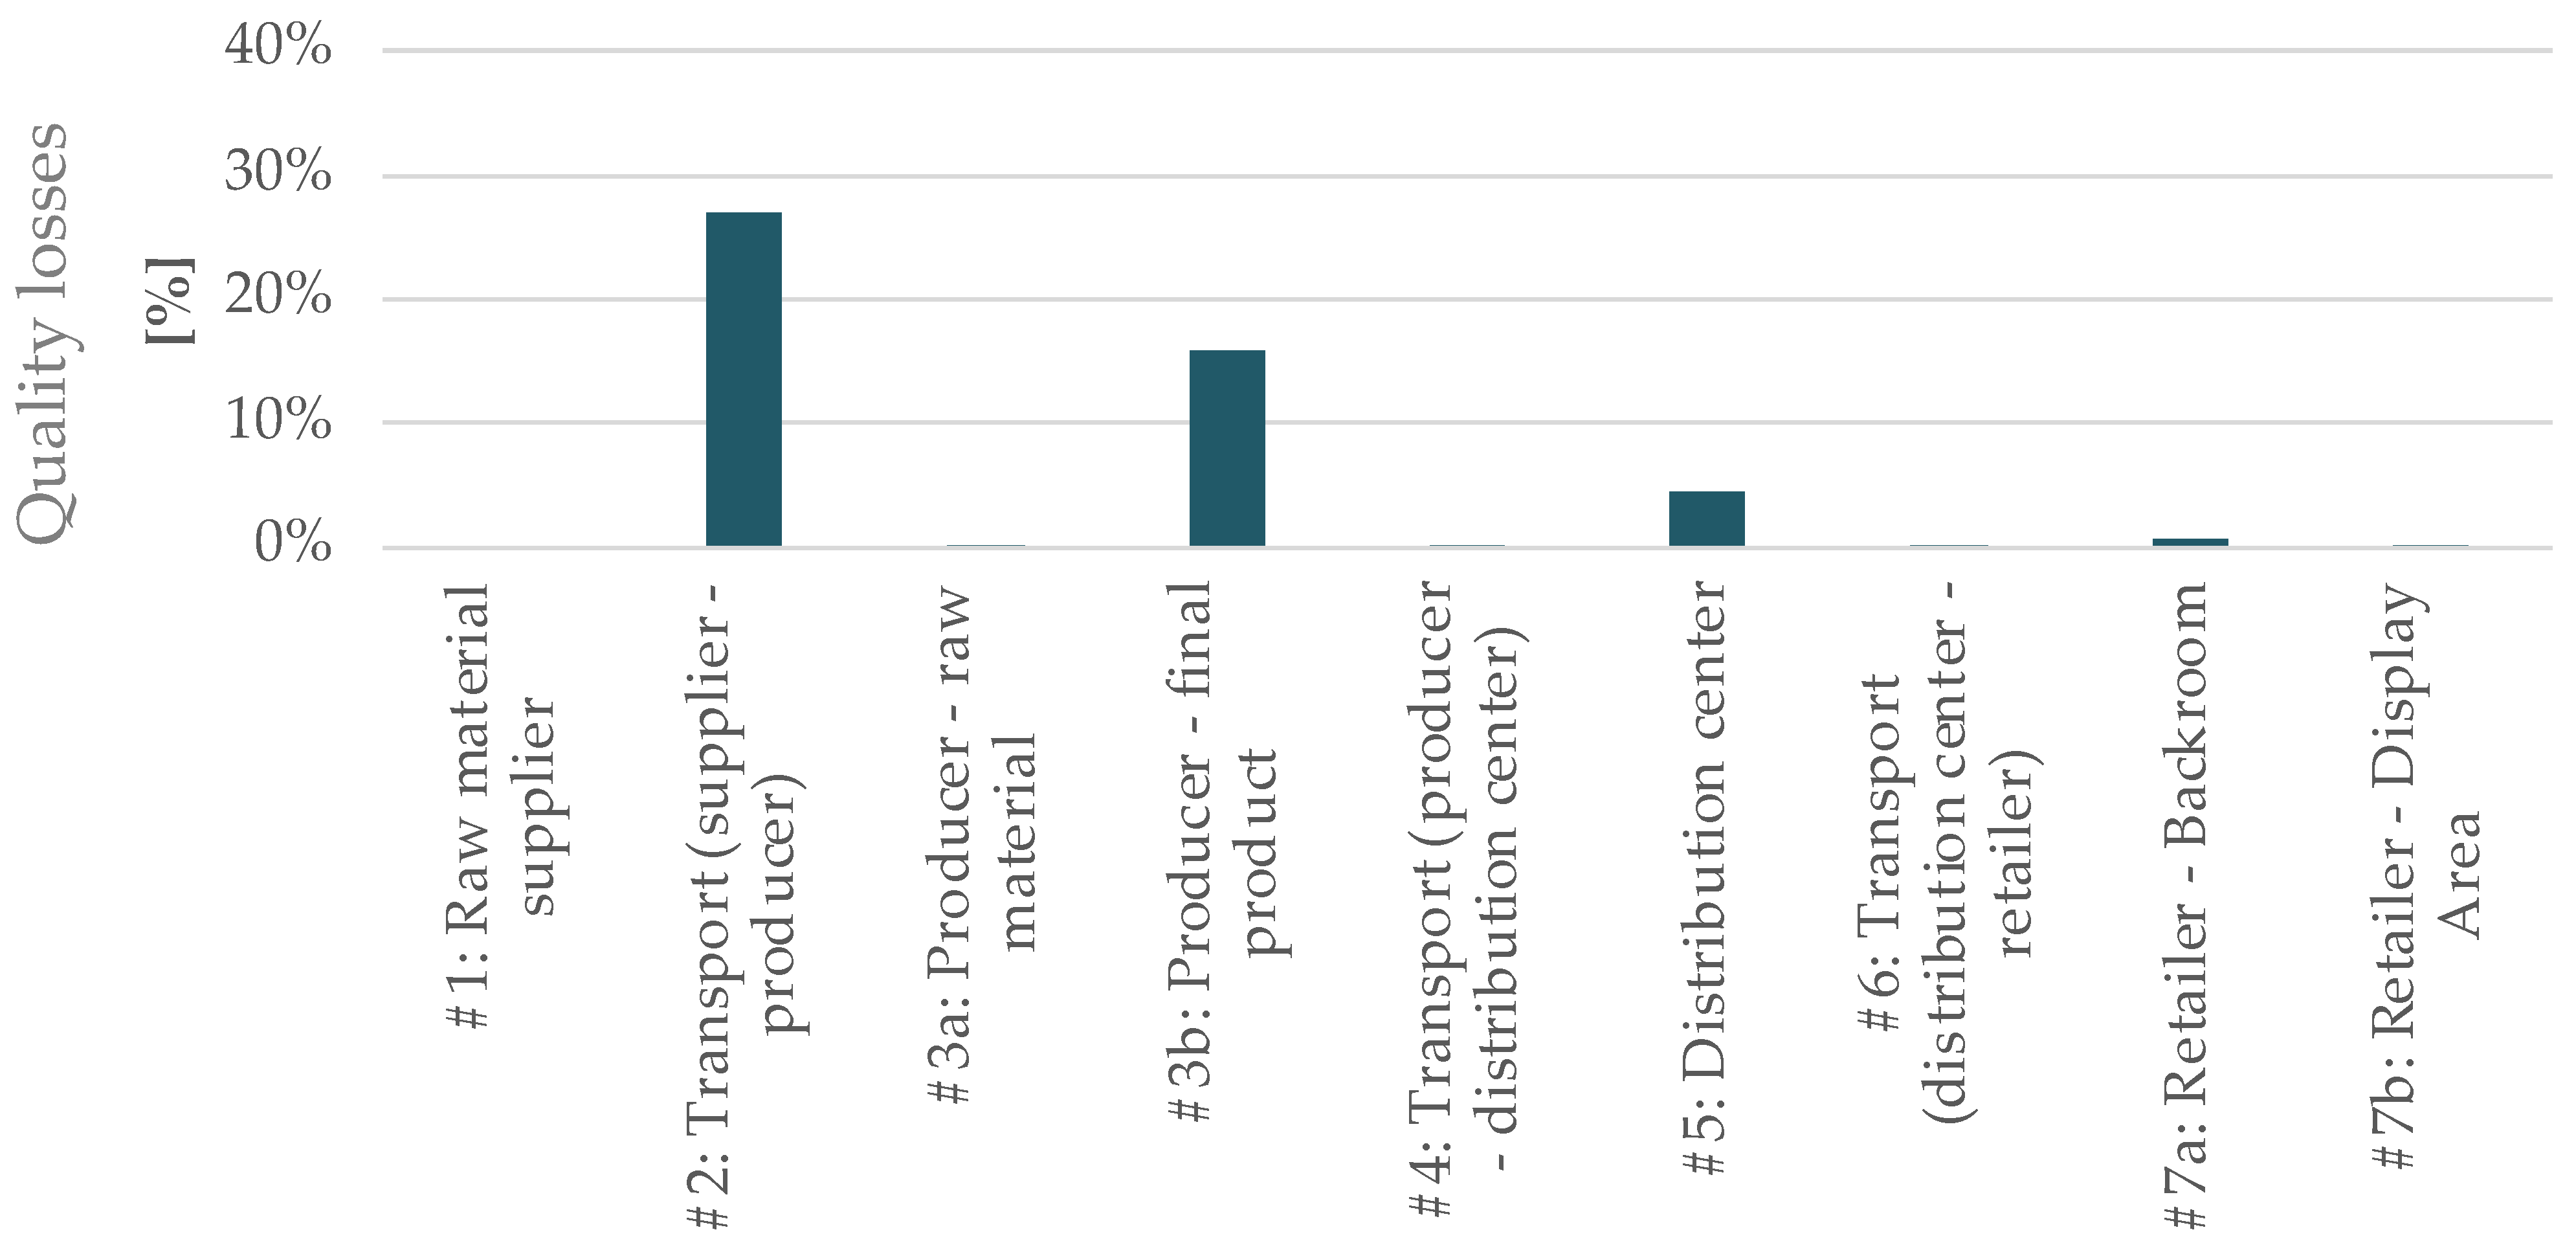
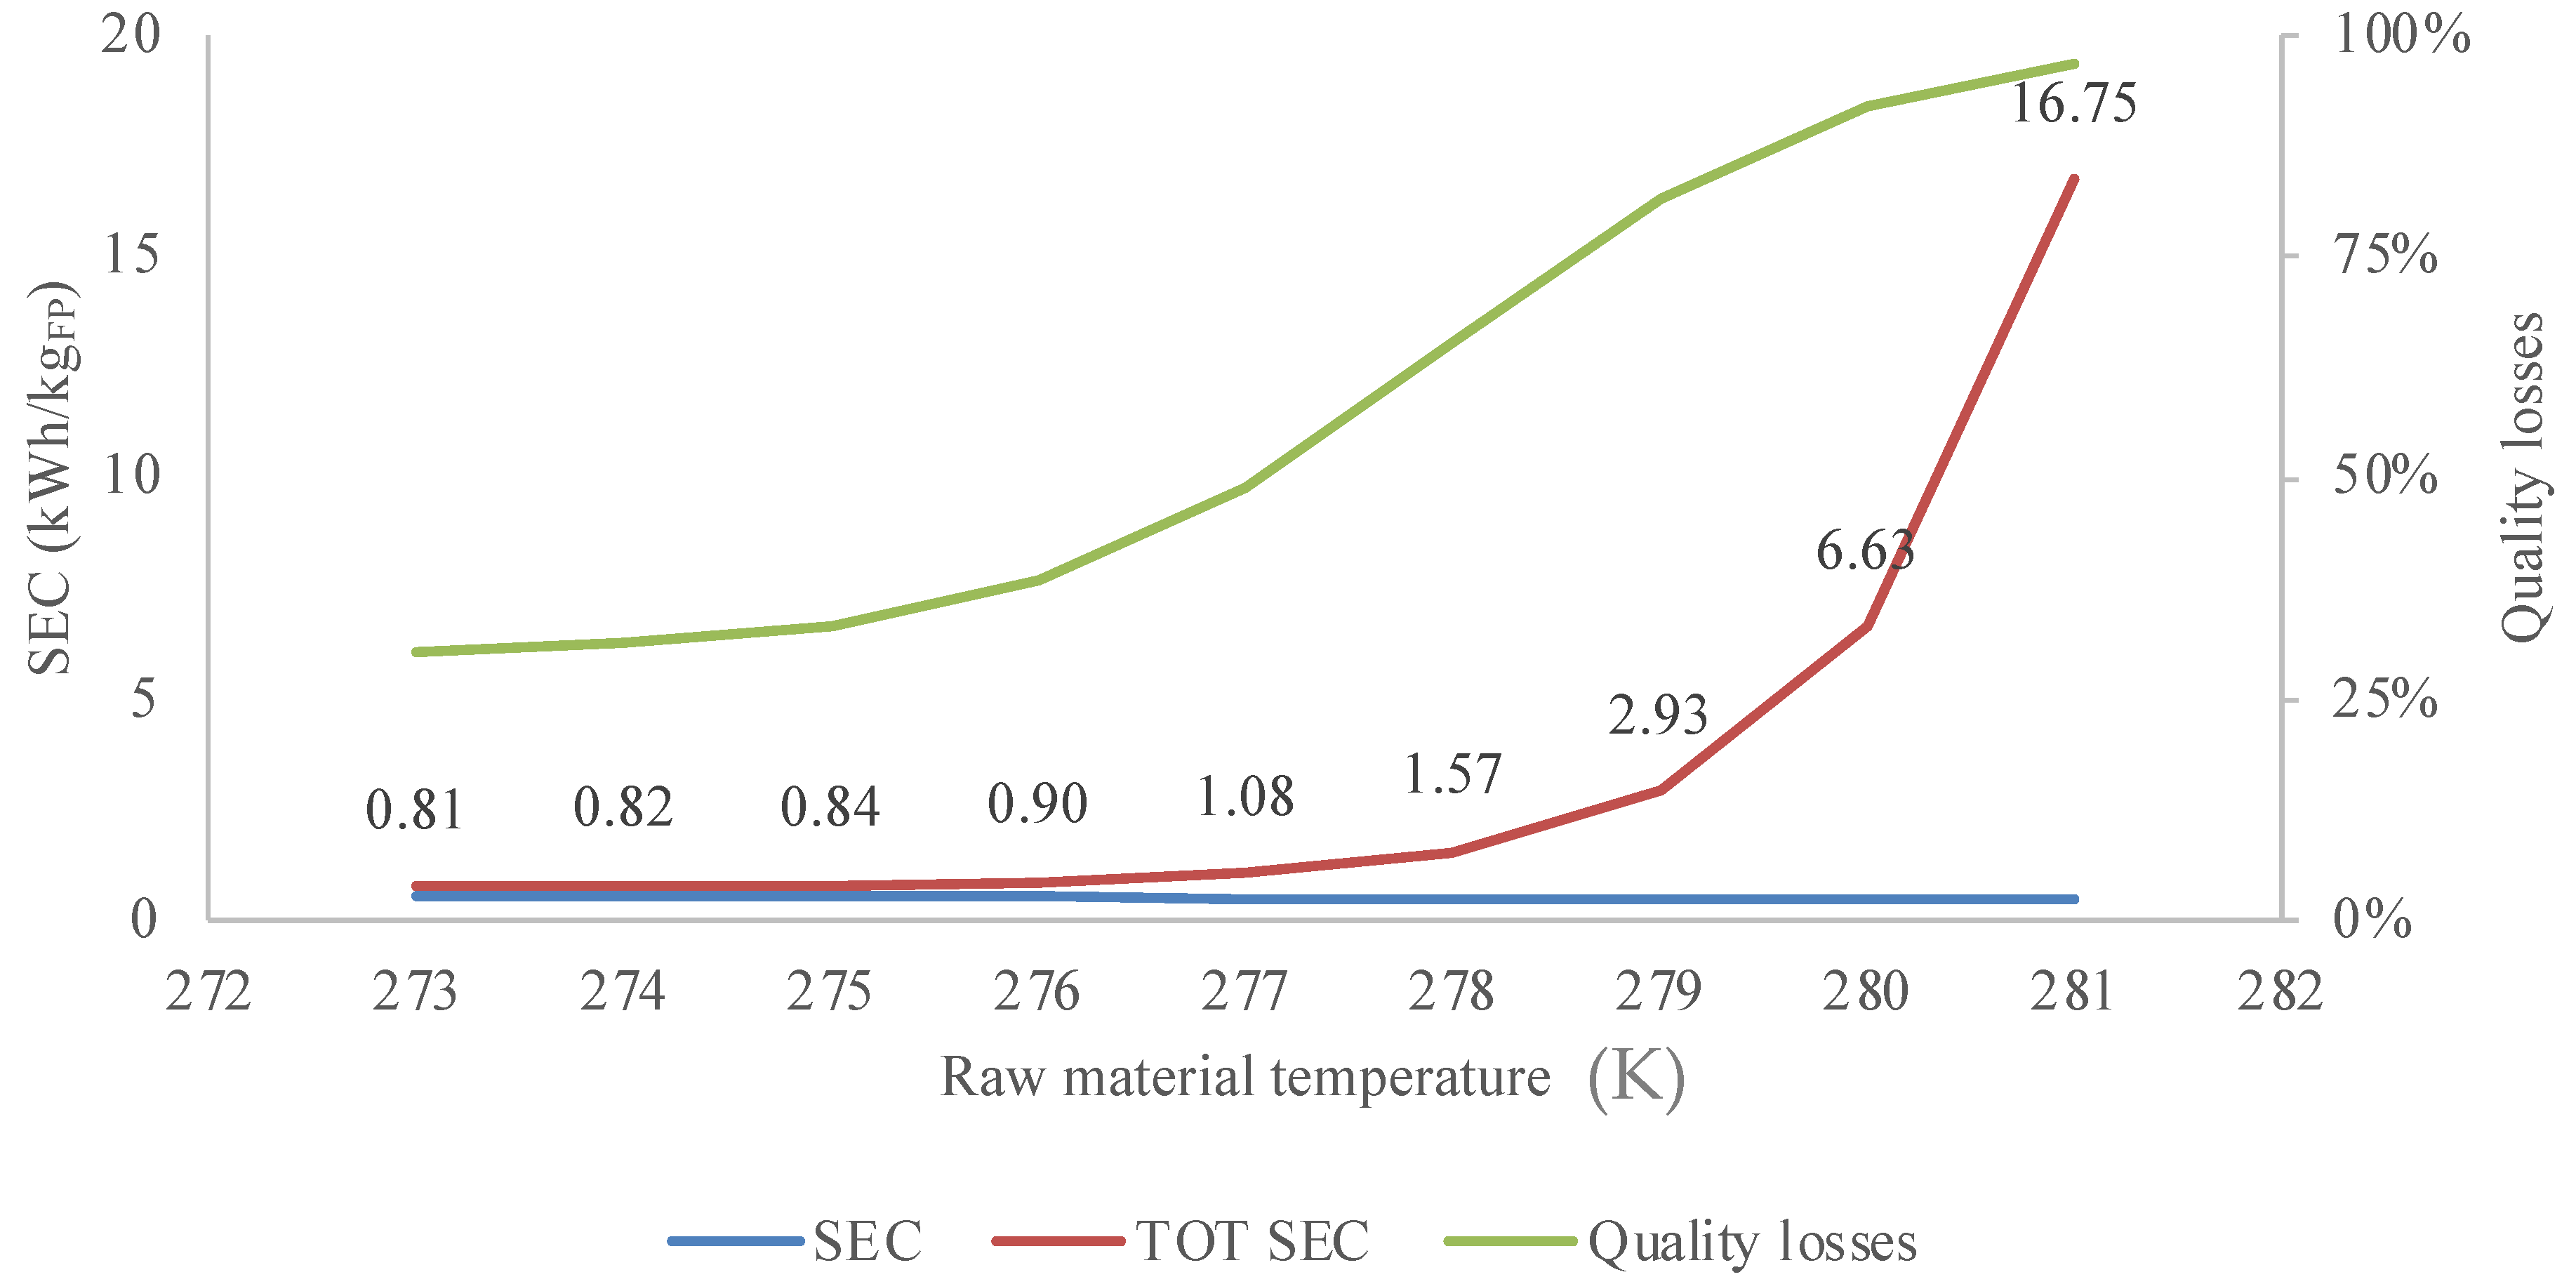
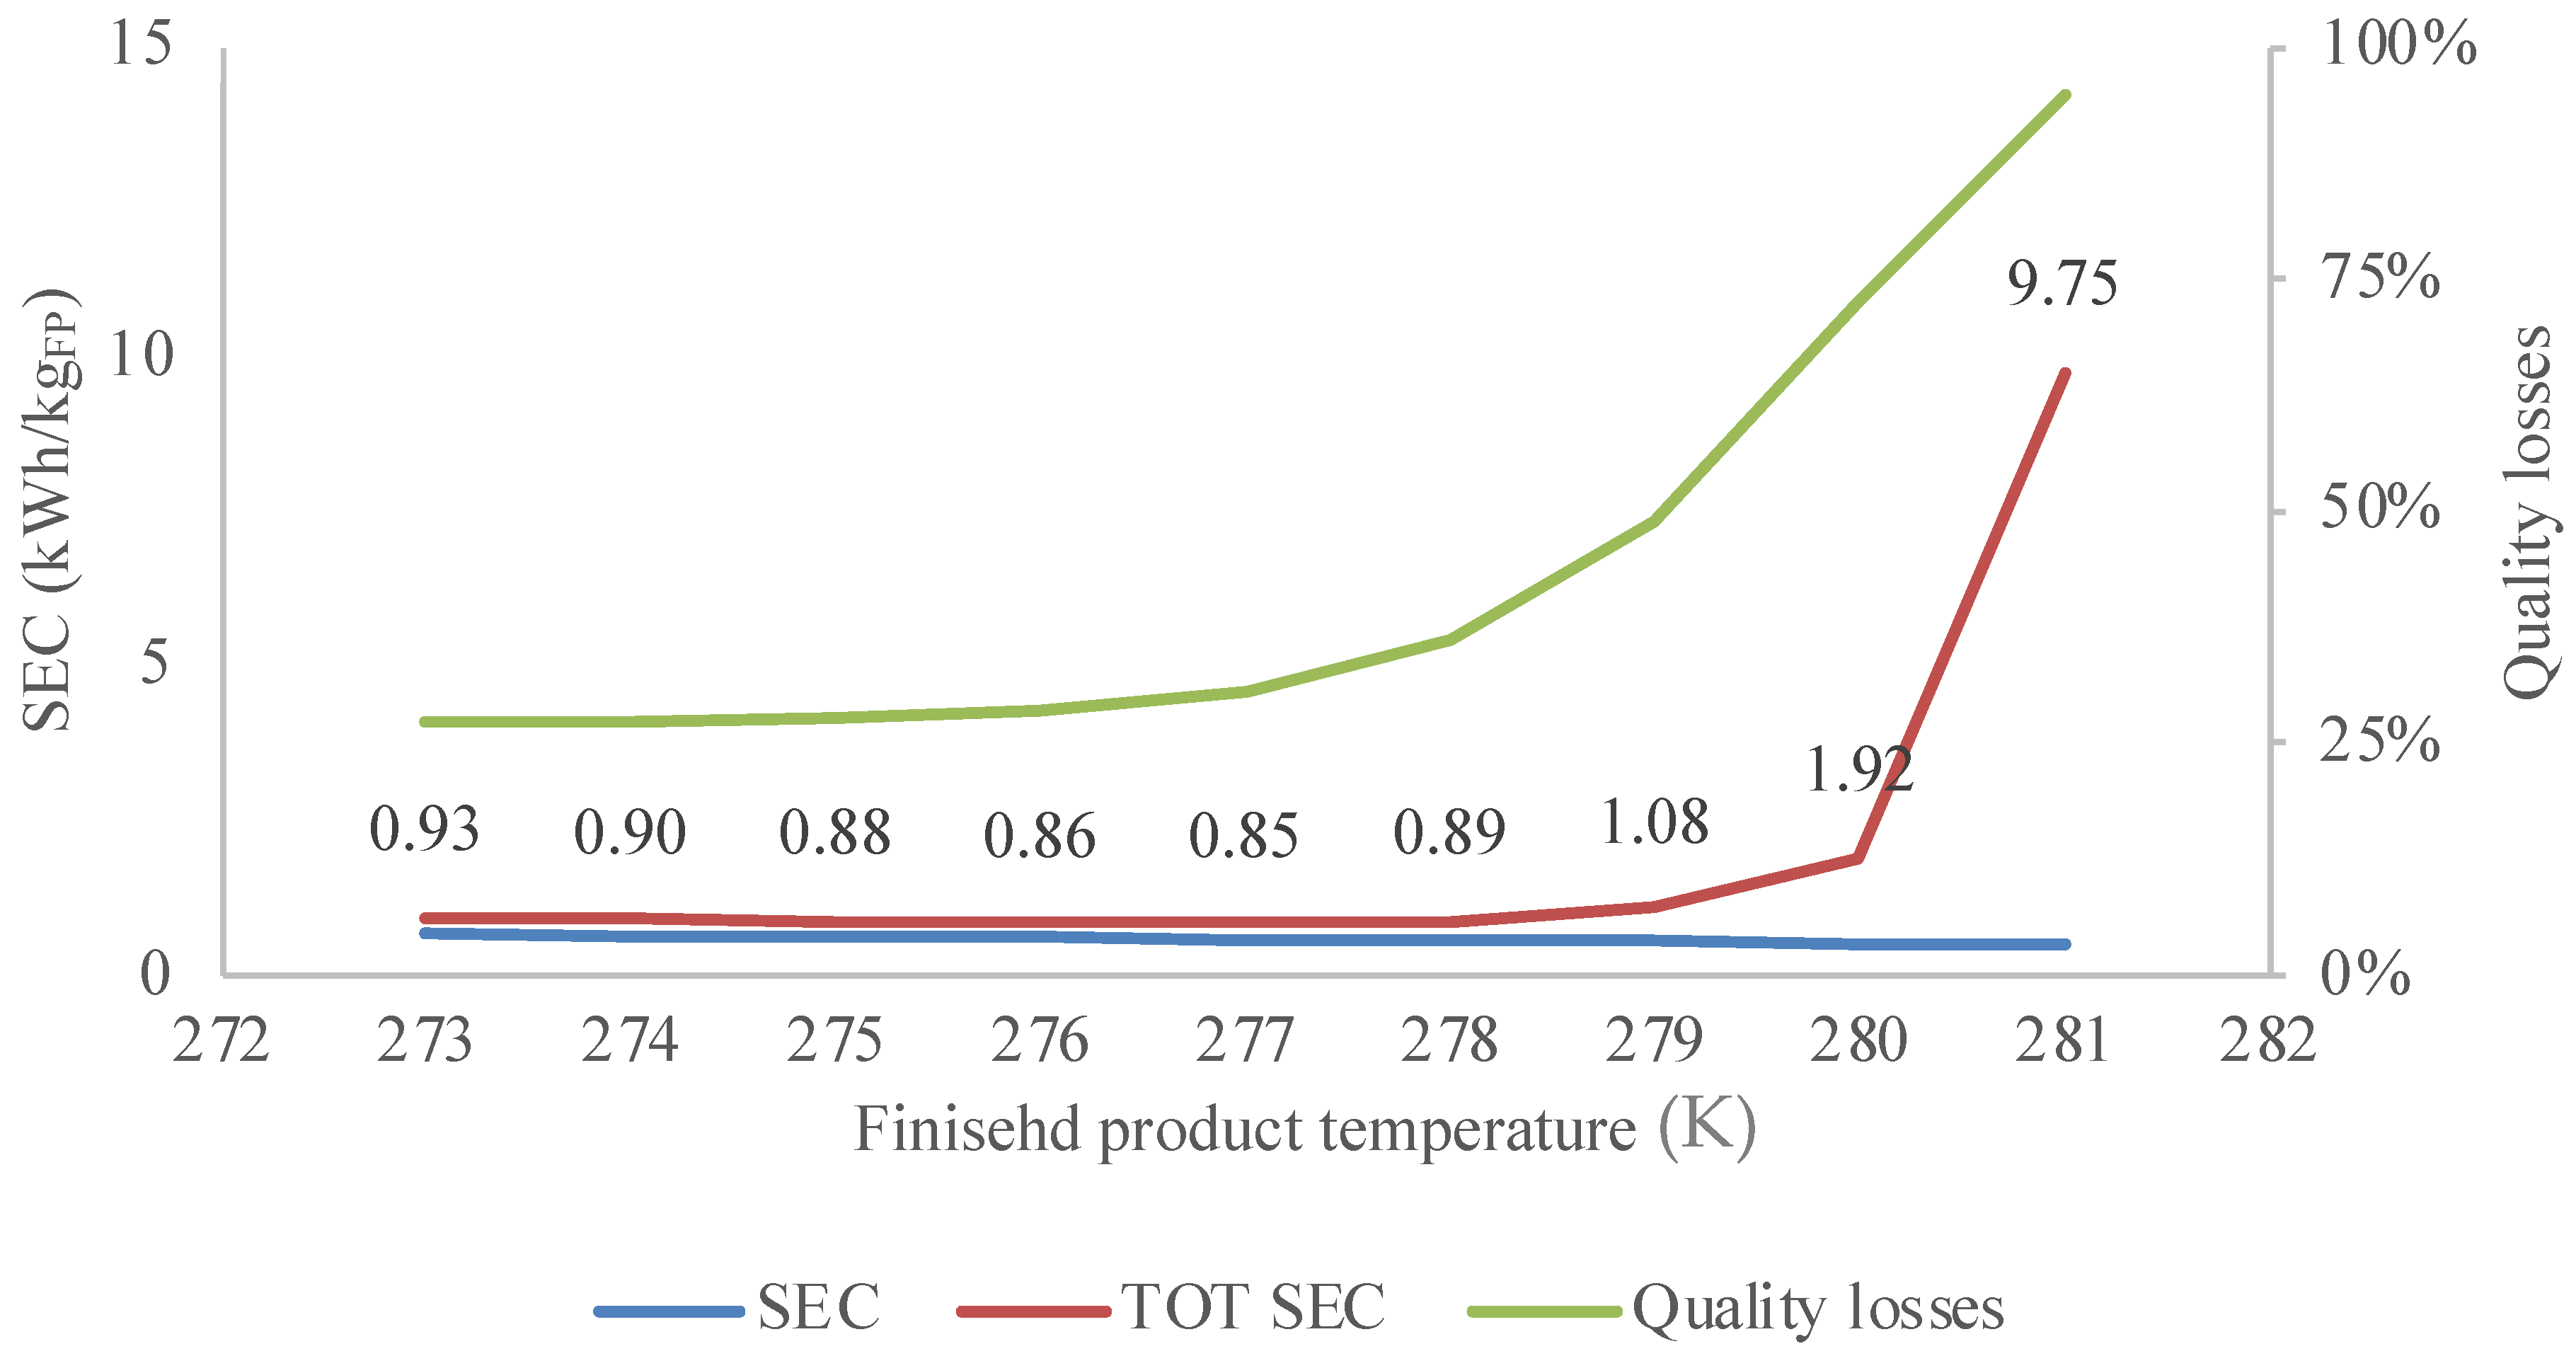
  • The producer represents the stage of the cold chain with the highest share of the SEC (about 33%, while considering both the warehouse of the raw material and the one of the finished products). However, the cooling and refrigeration of the goods is not sufficient since at this stage, in which 43% of quality degradation occurs;
  • Electricity is the main energy carrier (up to 71% of the SEC), but diesel consumption is also relevant for transportation activities (29% of the SEC);
  • The overall SEC, with consideration of the quality degradation, is almost twice the SEC related to the logistic activities;
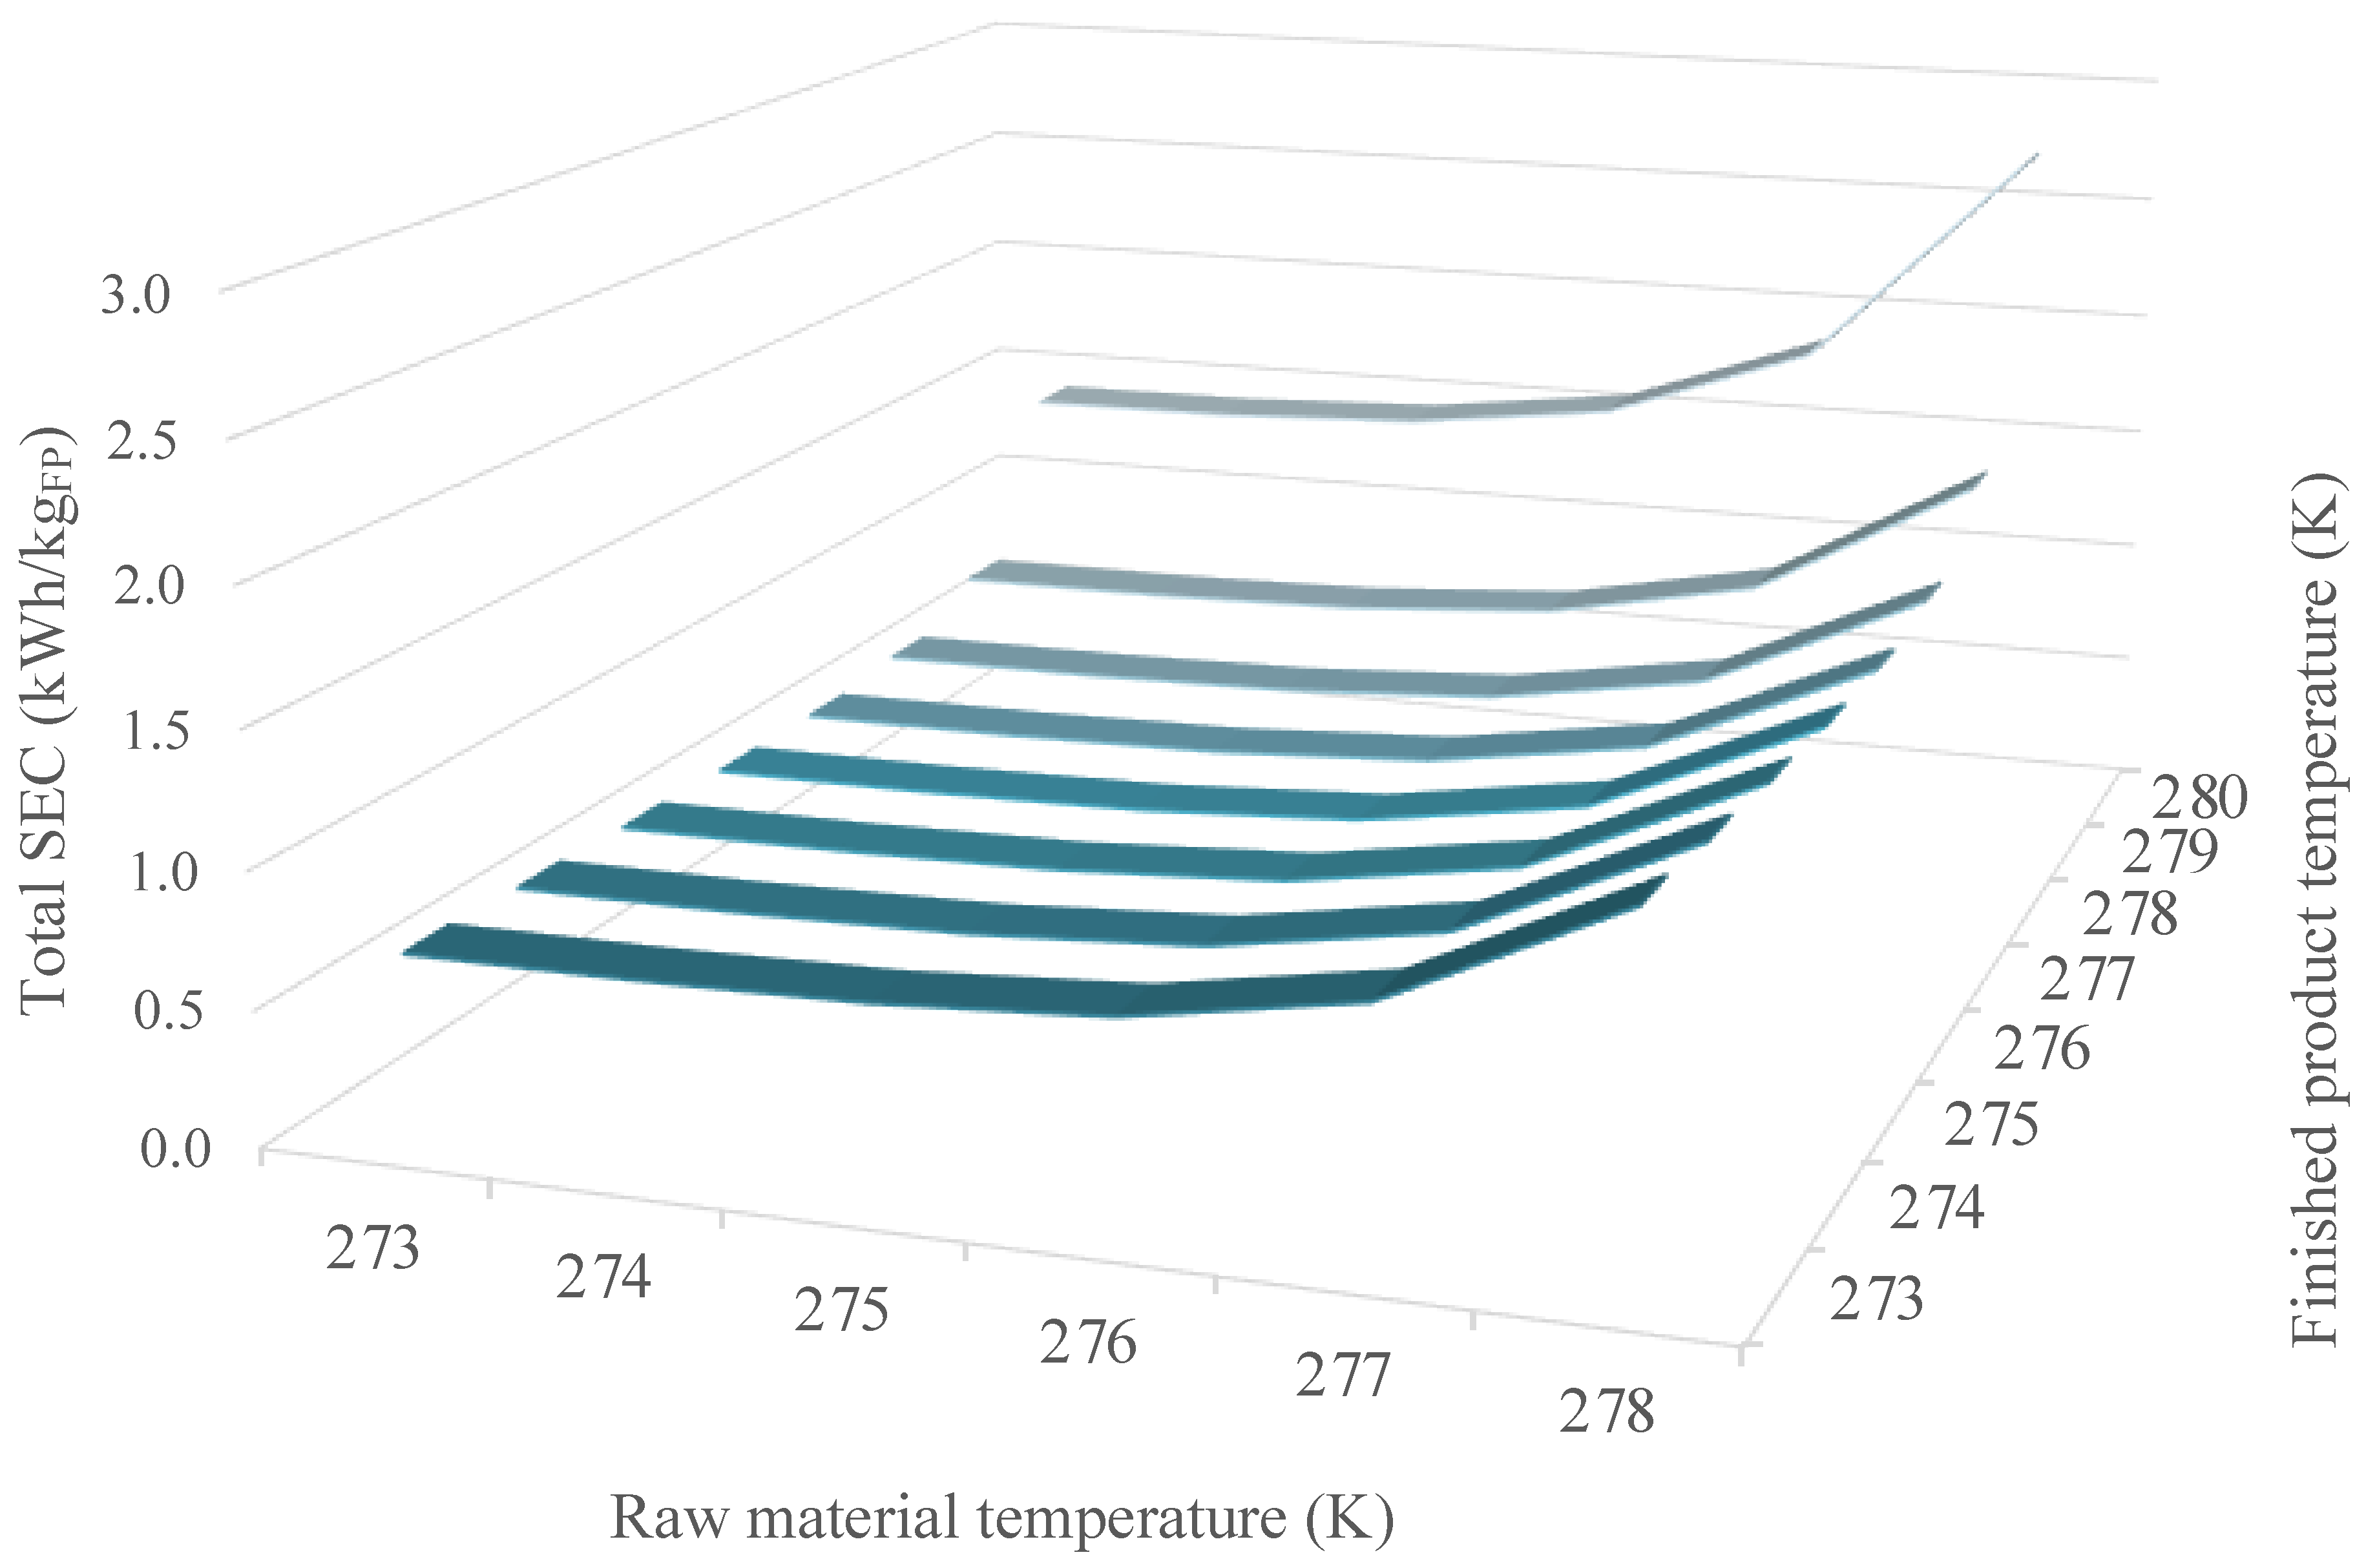
  • Setting lower temperatures to the raw material warehouses (which reduces quality losses) and higher temperatures to the finished product warehouses (which avoids temperature abuses), it is possible to reduce the overall SEC of about 41%;
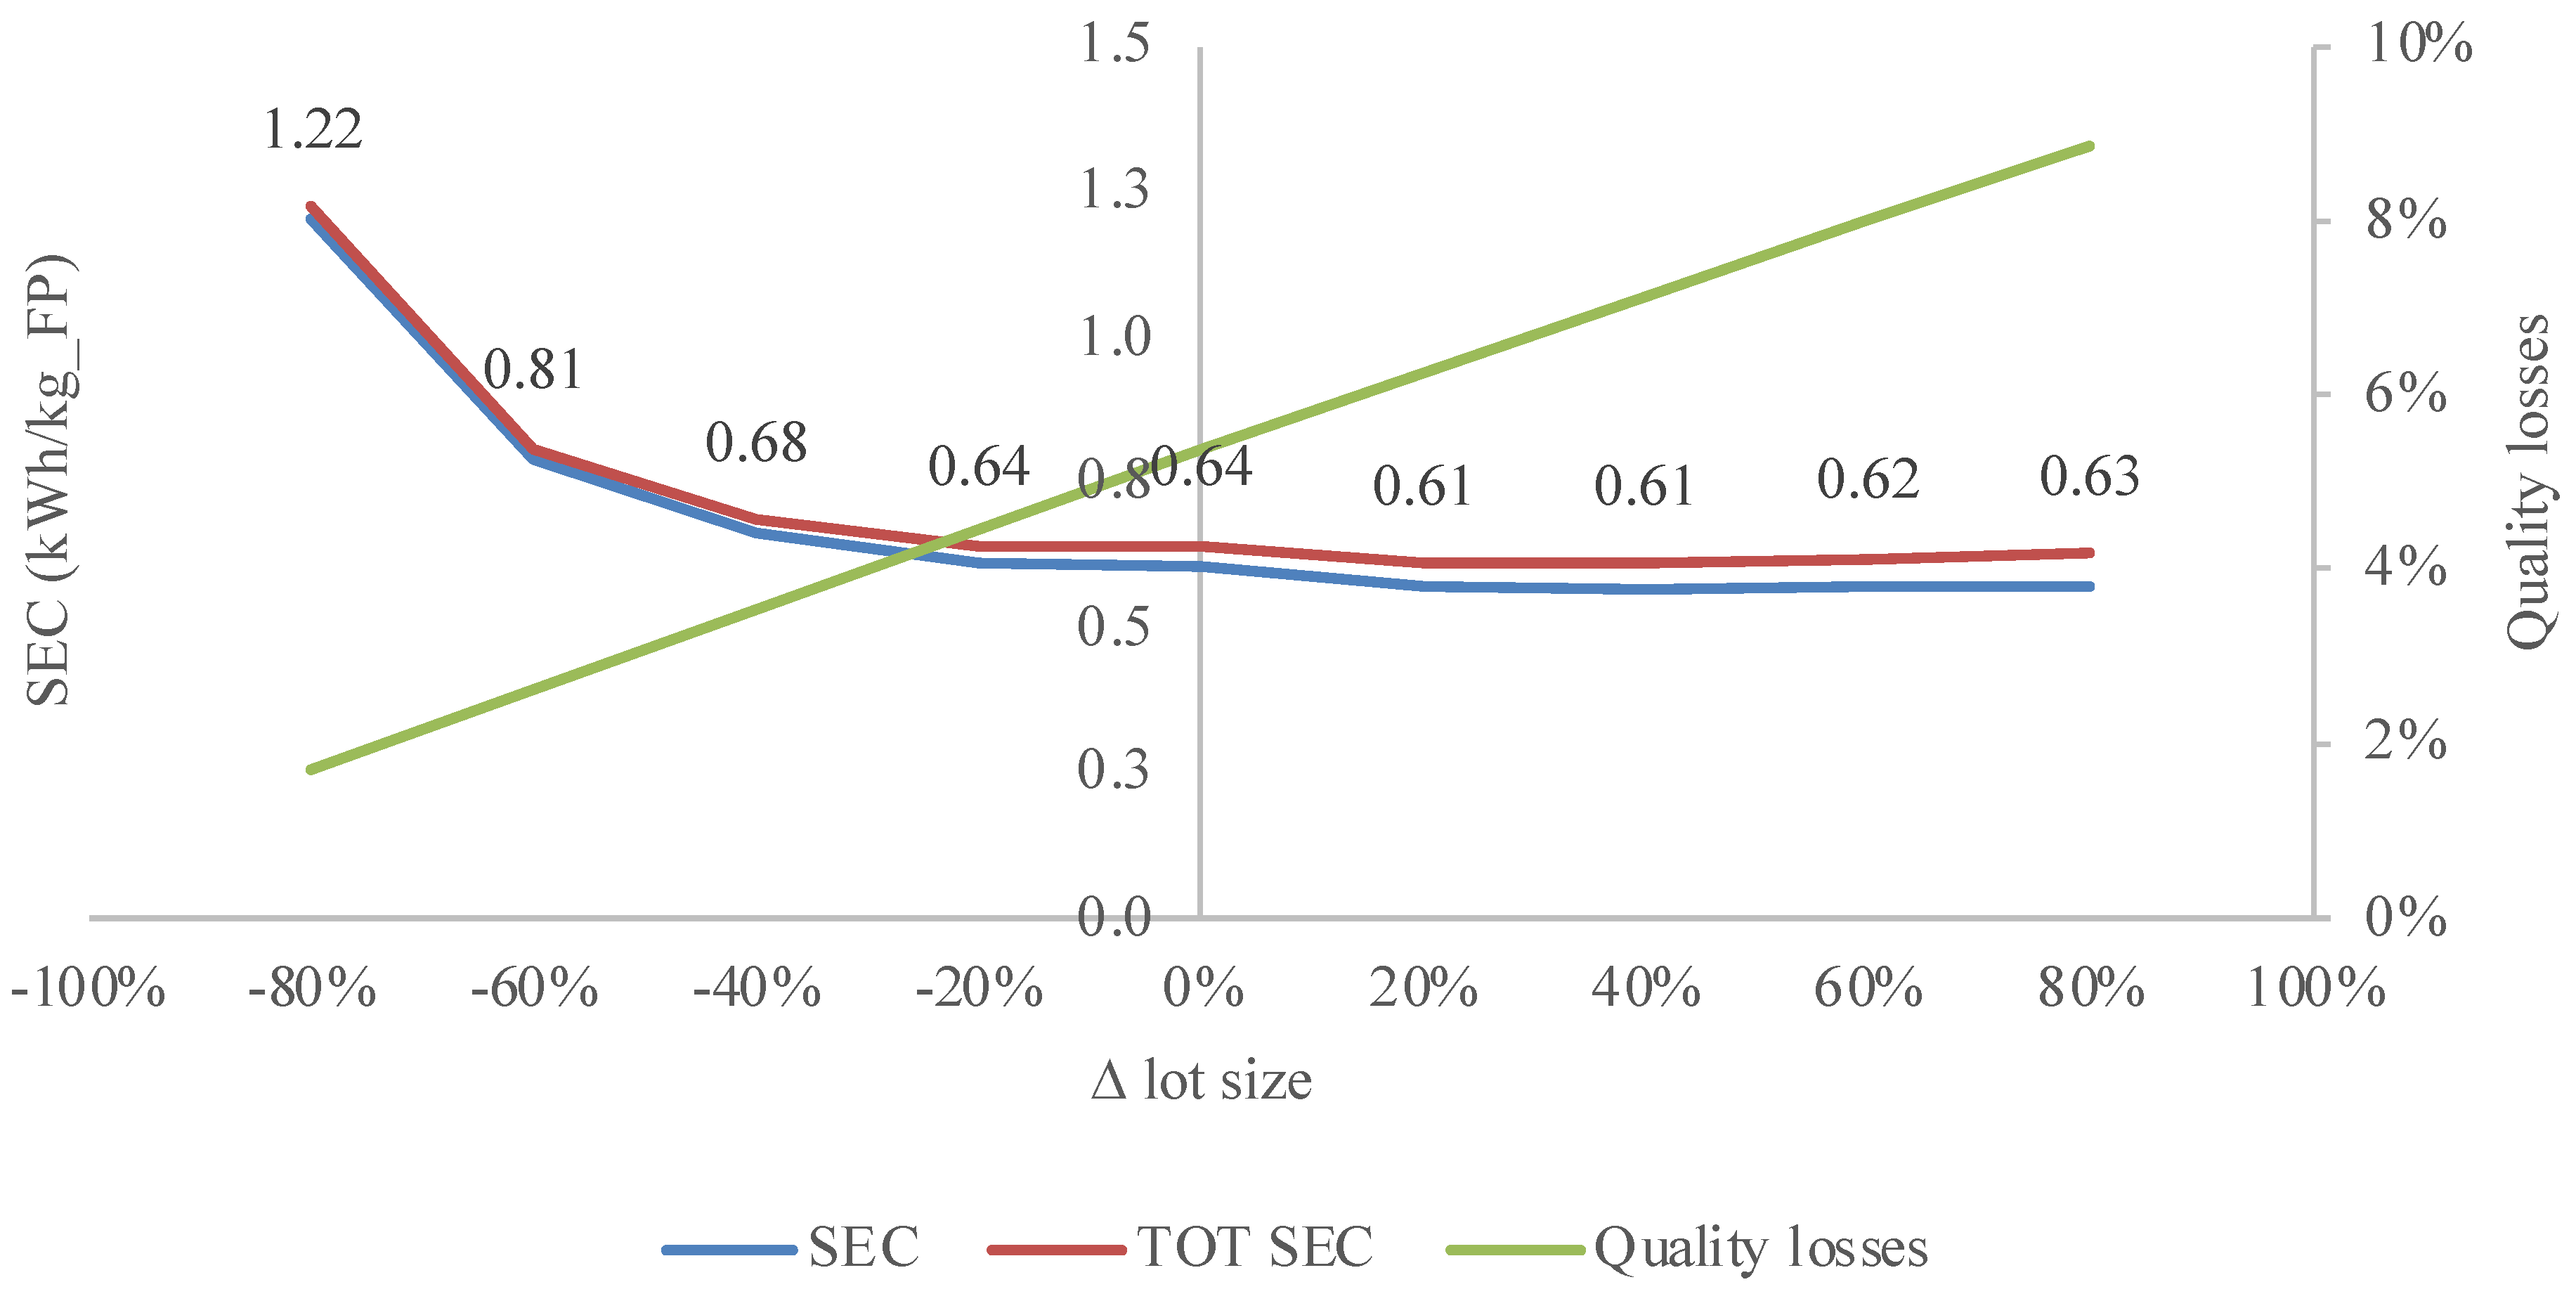
  • The lot size at the display area of the retailer represents another managerial lever for increasing the energy efficiency of the cold chain. However, in the case study proposed, the lot should be increased by 40%; however, this is not possible due to the limited space available;
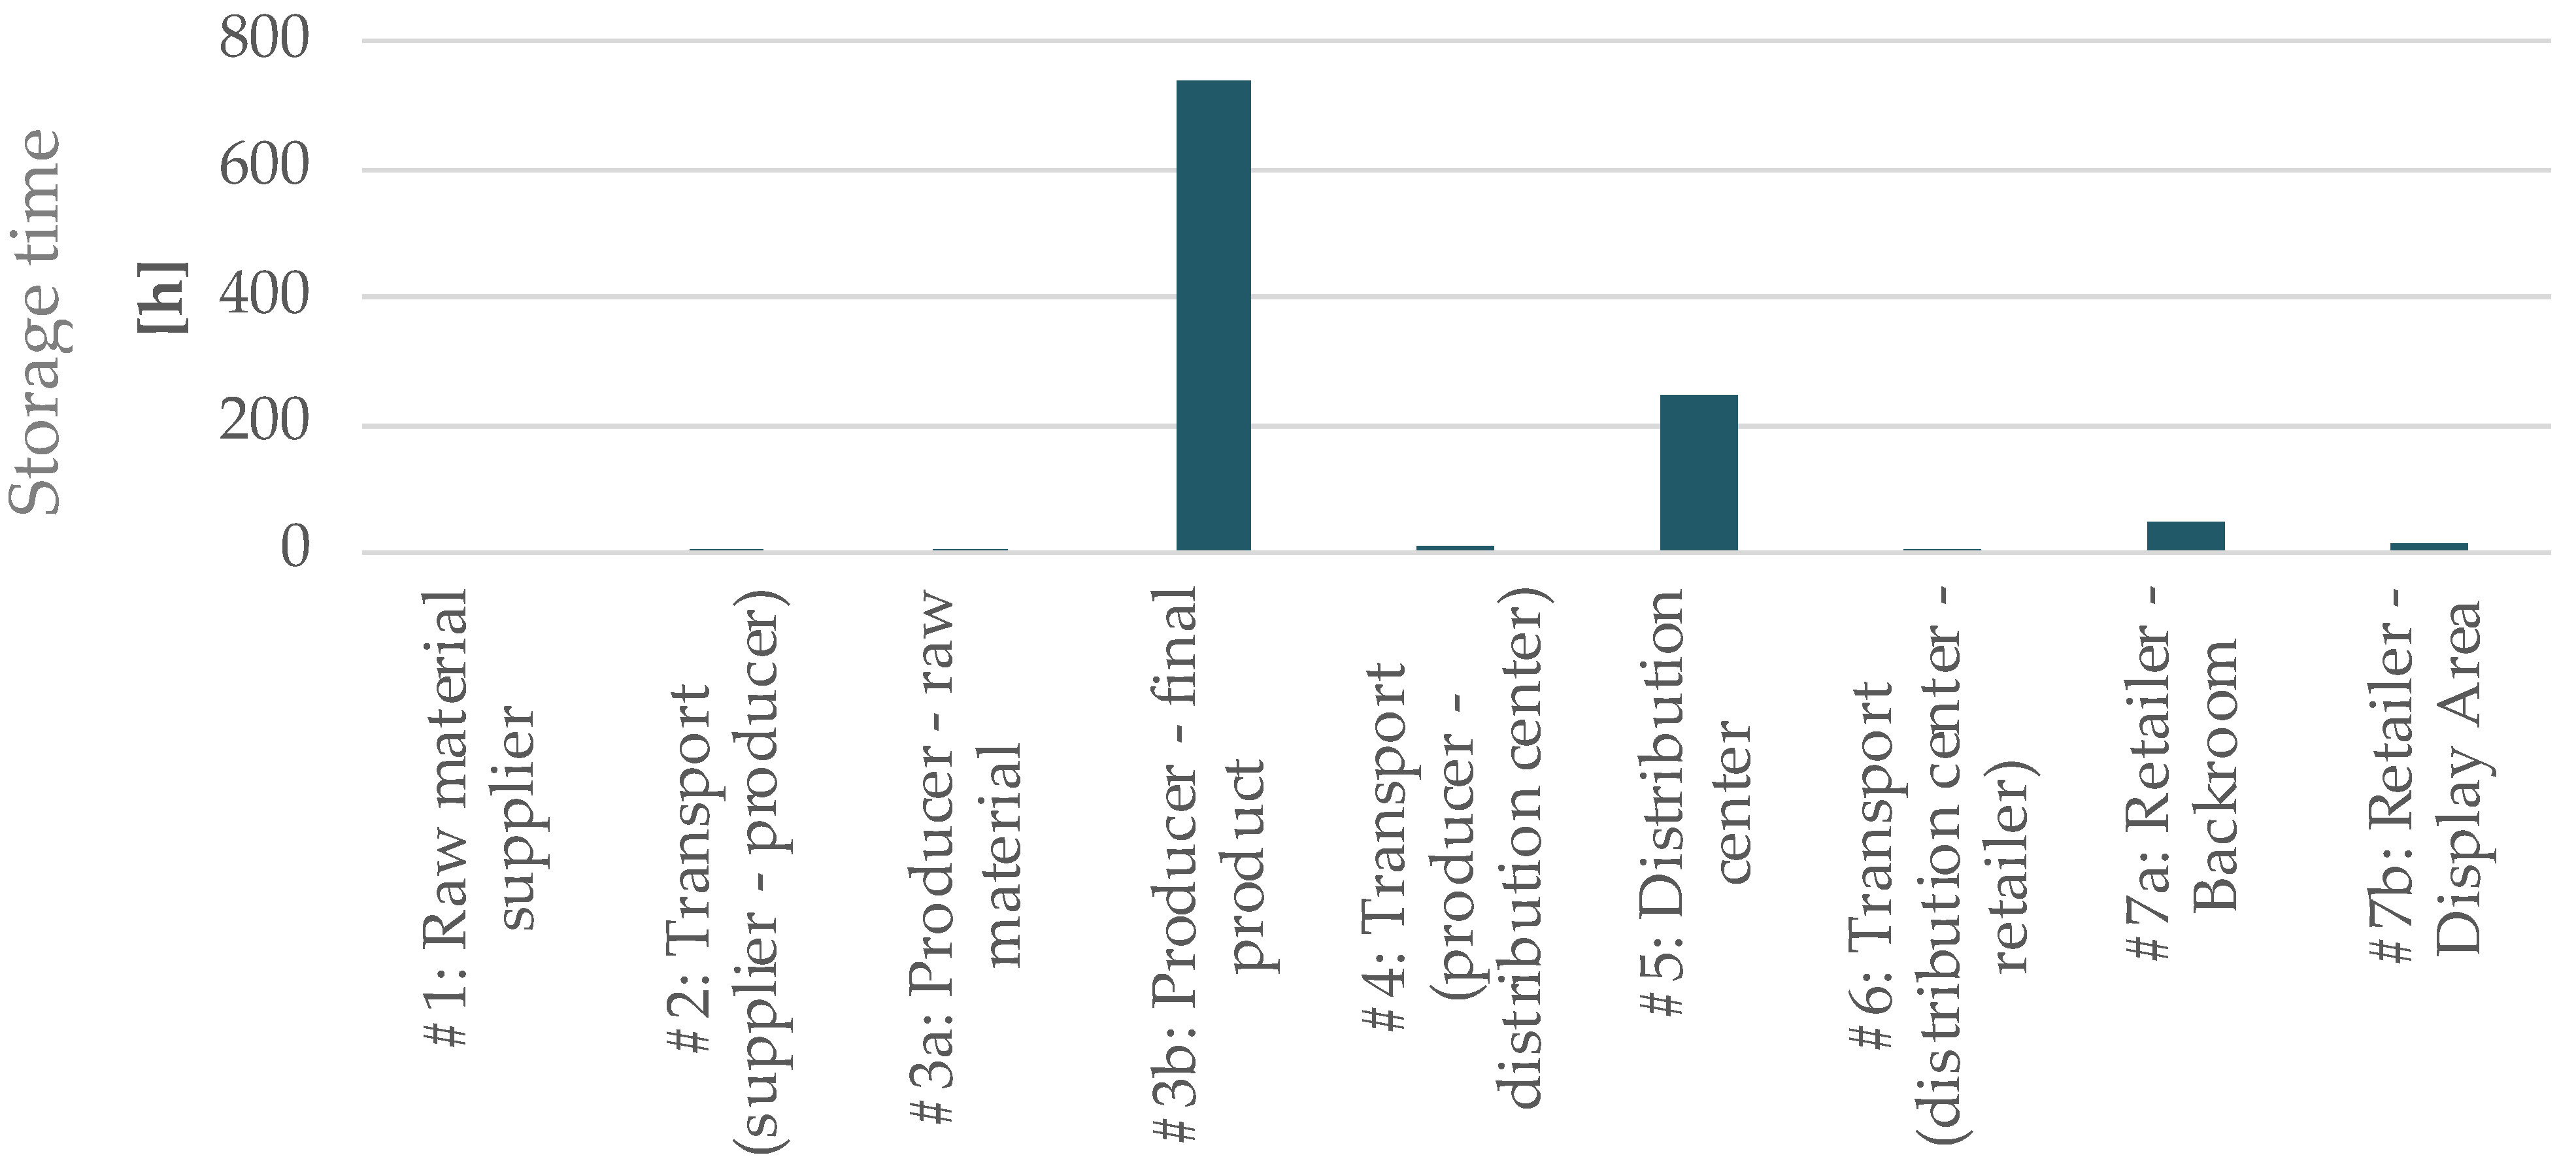
  • To improve the energy efficiency at the PF warehouse, the producer can fasten the replenishment cycles, which reduces the storage time. This means lower quality degradation and lower energy demand (i.e., refrigeration equipment operating for lower periods);
  • Other energy efficiency measures can be implemented at the transport stage from the producer to the distribution center since it is responsible of 19% of the SEC. Specifically, due to high diesel consumption and the long trip requiring refrigeration, improving the insulation of the vehicle, or increasing its saturation, allows for a reduction in the SEC.

5. Conclusions

This contribution presents a novel model for supporting the energy efficiency transition of cold chains in the food and beverage sector. The energy effort in keeping the quality of fresh and frozen products along the chain is only a part of the overall energy since the quality degradation at the end point of the chain implies a consequent waste of energy efforts of all upstream stages. To this aim, the contribution of different actors along the chain has been estimated in terms of specific energy consumption and quality losses. Moreover, the overall impact of single decisions on the main setting parameters of the actor’s chain have been highlighted (e.g., temperature of storage at different warehouses and batch sizes). With a numerical example, we have shown how the actual specific energy consumption with quality considerations can double the energy consumption related to the logistics activities. The methodology proposed acts as a decision support tool for an efficient energy management of the cold chain while defining an action plan for energy efficiency though a holistic perspective.
Further research could be focused on relaxing the assumptions previously mentioned to some extent to make the model more practical and meaningful and to address specificities of foods. In practice, products may possess different storage times, which in turn would affect the final quality and the optimal temperature of the warehouses. Moreover, this paper considers the problem of the optimization of energy requirements in cold supply chains of perishable products without consideration of the economic performance, which represents a relevant aspect in the decision-making process of industrial stakeholders. In fact, different energy carriers have different costs, which can impact on the prioritization of the energy efficiency measures at the different stages of the cold chain. The focus can be moved to an overall environmental impact assessment, for instance, through a life cycle assessment [21], or to a multi criteria analysis for considering all the dimensions of sustainability (i.e., economic, environmental, and social), which provides additional promising measures to be considered (e.g., alternative refrigerants, renewables [22,23]).

Author Contributions

Conceptualization, methodology, B.M. and S.Z.; writing—original draft preparation, B.M.; writing—review and editing, S.Z. All authors have read and agreed to the published version of the manuscript.

Funding

The contents of the paper are a part of the program of the project Improving Cold Chain Energy Efficiency (ICCEE). ICCEE has received founding from the European Union’s Horizon 2020 research and innovation program under grant agreement No. 847040.

Conflicts of Interest

The authors declare no conflict of interest.

Notation

α conversion factor of raw materials in finished products, α = D r m / D
A I L i average inventory level of raw material at stage i (kg)
b i , b j , η k product- and temperature-dependent coefficients for the evaluation of the quality level
γ i ,   δ i coefficients for the evaluation of the filling level impact on the specific energy consumption at stage i
D annual demand rate of finished product from final customers (kg/year)
D r m annual demand rate of raw material (kg/year)
ε j fuel conversion factor for stage j (kWh/L)
E i annual energy use of the warehouse for cooling purposes (kWh/year)
f c j fuel consumption per trip for stage j (L/trip)
i sub-index defining the considered warehouse of the supply chain (S: supplier, P_RM: raw material warehouse of the producer, P_FP: finished product warehouse of the producer, DC: distribution center, R_B: backroom warehouse of the retailer, R_DA: display area of the retailer)
j sub-index defining the considered transportation stage of the supply chain (S–P: from supplier to producer, P–DC: from producer to distribution center, DC-R: from distribution center to retailer)
k sub-index defining the considered product (RM: raw material, FP: finished product)
I i ( x ) inventory level of the stage i at time x (kg)
m k , T C , k product-dependent constant for the evaluation of b i and b j
n i number of shipments from stage i for each production and/or ordering cycle (-)
P i production rate of stage i (kg/year)
Q order lot size of the retailer (kg)
Q i order lot size of stage i (kg)
q i , q j quality level for stage i and j as a function of the temperature set and the storage time (%)
q 0 , i , q 0 , j initial quality level for stage i and j (%)
ρ T w , i coefficient defining the effect of different storage temperatures on the specific energy consumption
S i size of the cold warehouse at stage i (m3)
S E C i specific energy consumption of the storage activities per unit of product at stage i (kWh/kg)
S E C S , i Specific energy consumption of a warehouse at stage i (kWh/m3)
S E C T , j Specific energy consumption of the transportation activities per unit of product at stage j (kWh/kg)
τ i average storage time at stage i (year)
t j average travelling time requiring refrigeration at stage j (h/trip)
T r , i , T r , j reference temperature for energy consumption measures at stage i and j (°C)
T w , i , T w , j effective temperature set during storage and transportation activities at stage i and j (°C)
V j number of vehicles necessary to deliver a lot of size Q i at stage j
x specific storage time, in the interval 0 x τ (year)
W e , j electrical power required to power on cooling equipment on vehicles t stage j (kW)
ω k specific volume of the product k (kg/m3)

References

  1. Marchi, B.; Zavanella, L.E.; Zanoni, S. Supply chain finance for ameliorating and deteriorating products: A systematic literature review. J. Bus. Econ. 2022, 1–30. [Google Scholar] [CrossRef]
  2. Kefalidou, A.A. Sustainable Energy Solutions to ‘Cold Chain’ Food Supply Issues. Brief for GSDR–2016 Update. Available online: https://sustainabledevelopment.un.org/content/documents/968624_Kefalidou_Sustainable%20energy%20solutions%20to-cold%20chain-food%20supply%20issues.pdf (accessed on 22 July 2022).
  3. Ndraha, N.; Hsiao, H.; Vlajic, J.; Yang, M.; Lin, H.V. Time-temperature abuse in the food cold chain: Review of issues, challenges, and recommendations. Food Control 2018, 89, 12–21. [Google Scholar] [CrossRef]
  4. Winkworth-Smith, C.G.; Foster, T.J.; Morgan, W. The Impact of Reducing Food Loss in The Global Cold Chain; University of Nottingham: Nottingham, UK, 2015. [Google Scholar]
  5. Sarr, J.; Dupont, J.L.; Guilpart, J. The Carbon Footprint of the Cold Chain, 7th Informatory Note on Refrigeration and Food; International Institute of Refrigeration: Paris, France, 2021. [Google Scholar] [CrossRef]
  6. Coulomb, D. Refrigeration and cold chain serving the global food industry and creating a better future: Two key IIR challenges for improved health and environment. Trends Food Sci. Technol. 2008, 19, 413–417. [Google Scholar] [CrossRef]
  7. James, S.J.; James, C. The food cold-chain and climate change. Food Res. Int. 2010, 43, 1944–1956. [Google Scholar] [CrossRef]
  8. Knowles, M.; Baglee, D. The role of maintenance in energy saving in commercial refrigeration. J. Qual. Maint. Eng. 2012, 18, 282–294. [Google Scholar] [CrossRef]
  9. Zanoni, S.; Marchi, B. Environmental impacts of foods refrigeration. In Environmental Impact of Agro-Food Industry and Food Consumption; Academic Press: Cambridge, MA, USA, 2021; Chapter 11; pp. 239–259. ISBN 9780128213636. [Google Scholar] [CrossRef]
  10. Meneghetti, A.; Ceschia, S. Energy-efficient frozen food transports: The Refrigerated Routing Problem. Int. J. Prod. Res. 2020, 58, 4164–4181. [Google Scholar] [CrossRef]
  11. Chen, G.; Wahab, M.I.M.; Fang, L. Optimal replenishment strategy for a single-manufacturer multi-retailer cold chain considering multi-stage quality degradation. Appl. Math. Model. 2022, 104, 96–113. [Google Scholar] [CrossRef]
  12. Marchi, B.; Zanoni, S. Supply chain management for improved energy efficiency: Review and opportunities. Energies 2017, 10, 1618. [Google Scholar] [CrossRef] [Green Version]
  13. Manzini, R.; Accorsi, R. The new conceptual framework for food supply chain assessment. J. Food Eng. 2013, 115, 251–263. [Google Scholar] [CrossRef]
  14. Neusel, L.; Hirzel, S.; Zanoni, S.; Marchi, B. Energy efficiency from farm to fork ? On the relevance of non-energy benefits and behavioural aspects along the cold supply chain. ECEEE Ind. Summer Study Proc. 2020, 101–110. Available online: https://www.eceee.org/library/conference_proceedings/eceee_Industrial_Summer_Study/2020/2-sustainable-production-towards-a-circular-economy/energy-efficiency-from-farm-to-fork-on-the-relevance-of-non-energy-benefits-and-behavioural-aspects-along-the-cold-supply-chain/2020/2-084-20_Neusel.pdf/ (accessed on 22 July 2022).
  15. Laguerre, O.; Duret, S.; Hoang, H.M.; Flick, D.; Ing, U.M.R. Using simplified models of cold chain equipment to assess the influence of operating conditions and equipment design on cold chain performance. Int. J. Refrig. 2014, 47, 120–133. [Google Scholar] [CrossRef]
  16. Marchi, B.; Zanoni, S.; Jaber, M.Y. Energy Implications of Lot Sizing Decisions in Refrigerated Warehouses. Energies 2020, 13, 1739. [Google Scholar] [CrossRef]
  17. Zanoni, S.; Zavanella, L. Chilled or frozen? Decision strategies for sustainable food supply chains. Int. J. Prod. Econ. 2012, 140, 731–736. [Google Scholar] [CrossRef]
  18. Peleg, M.; Engel, R.; Gonzalez-martinez, C.; Corradini, M.G. Non-Arrhenius and non-WLF kinetics in food systems. J. Sci. Food Agric. 2002, 82, 1346–1355. [Google Scholar] [CrossRef]
  19. Mercier, S.; Mondor, M.; Villeneuve, S.; Marcos, B. The Canadian food cold chain: A legislative, scientific, and prospective overview. Int. J. Refrig. 2018, 88, 637–645. [Google Scholar] [CrossRef]
  20. Marchi, B.; Zanoni, S.; Ferretti, I.; Zavanella, L.E.L.E. Stimulating Investments in Energy Efficiency Through Supply Chain Integration. Energies 2018, 11, 858. [Google Scholar] [CrossRef]
  21. Diaz, F.; Vignati, J.A.; Marchi, B.; Paoli, R.; Zanoni, S.; Romagnoli, F. Effects of Energy Efficiency Measures in the Beef Cold Chain: A Life Cycle-based Study. Rigas Teh. Univ. Zinat. Raksti 2021, 25, 343–355. [Google Scholar] [CrossRef]
  22. Fikiin, K.; Stankov, B.; Evans, J.; Maidment, G.; Foster, A.; Brown, T.; Radcliffe, J.; Youbi-idrissi, M.; Alford, A.; Varga, L.; et al. Refrigerated warehouses as intelligent hubs to integrate renewable energy in industrial food refrigeration and to enhance power grid sustainability. Trends Food Sci. Technol. 2017, 60, 96–103. [Google Scholar] [CrossRef]
  23. Meneghetti, A.; Dal Magro, F.; Simeoni, P. Fostering Renewables into the Cold Chain: How Photovoltaics Affect Design and Performance of Refrigerated Automated Warehouses. Energies 2018, 11, 1029. [Google Scholar] [CrossRef] [Green Version]
Figure 1. Schematic representation of the cold chain.
Sustainability 14 11137 g001
Figure 2. Illustrative trend of the inventory level at the different warehouses over multiple replenishment cycles.
Sustainability 14 11137 g002
Figure 3. Specific energy consumption by energy carriers for the various actors of the supply chain.
Sustainability 14 11137 g003
Figure 4. Quality losses, as a function of the temperature and of the storage time, for the various actors of the supply chain, evaluated though the equations defined in Section 2.4.
Sustainability 14 11137 g004
Figure 5. Average storage time at the various actors of the supply chain.
Sustainability 14 11137 g005
Figure 6. Specific energy consumption and quality losses over raw material temperature.
Sustainability 14 11137 g006
Figure 7. Specific energy consumption and quality losses over finished product temperature.
Sustainability 14 11137 g007
Figure 8. Total specific energy consumption with quality consideration for different combination of raw material and finished product temperatures.
Sustainability 14 11137 g008
Figure 9. Specific energy consumption and quality losses over variation on the initial lot size.
Sustainability 14 11137 g009
Table 1. Data required related to the product and for the different logistic activities.
GeneralStorage ActivitiesTransportation Activities
-
Demand rate of finished product
-
Specific volume of raw material
-
Specific volume of finished product
-
Conversion factor of the raw material into finished product
-
Raw material product
-
Finished product
-
Ambient temperature
-
Reference temperature
-
Annual energy consumption per energy carrier
-
Storage size
-
Production rate (if any)
-
Average utilization
-
Average storage time
-
Ambient temperature
-
Reference temperature
-
Fuel type
-
Average distance (roundtrip)
-
Distance travelled per unit of fuel
-
Electrical power for refrigeration equipment
-
Payload
-
Average amount of product transported
Table 2. Parameters characteristics of the storage activities.
ActorProducerDistribution CenterRetailer
WarehouseRaw MaterialFinished ProductBackroomDisplay Area
Electricity consumption (MWh/year)34340.6552183.854
Ambient temperature, T h o t (K)303303303303303
Reference temperature, T r (K)273278277274275
Set temperature, T w (K)277279279279279
Storage size, S (m3)50720025600704
Production rate, P i (ton/year)86.8--
Table 3. Parameters characteristics of the transport activities.
Transport (From–To)Supplier–ProducerProducer–Distribution CenterDistribution Center–Retailer
TypeSingle dropSingle dropMulti drop
VehicleTruckTrailerSmall delivery vehicle
Fuel typeDiesel oilDiesel oilDiesel oil
Refrigeration system driven by-Truck engineTruck engine
Average distance travelled (km)5015050
Average travelling time (h)1104
Distance travelled per liter of fuel (km/L)438.5
Average amount of product transported (kg)11,00070001000
Electrical power for refrigeration equipment (kW)-17-
Table 4. General parameters.
ParameterValue
δ 0.1
Fuel conversion factor, ε (kWh/L)10.9
γ 0.5
h1
m 1
T C 5 (RM) and 14 (FP)
Publisher’s Note: MDPI stays neutral with regard to jurisdictional claims in published maps and institutional affiliations.

