
University Students’ Perceptions of Food Waste in the UAE

 , ,
, ,
Abstract
:1. Introduction
2. Materials and Methods
2.1. Survey Description
2.2. Statistical Analysis
3. Results and Discussion
3.1. Demographic Analysis
3.2. Knowledge about Food Waste
3.3. Perceptions of Food Waste
3.4. Behavior
3.5. Interventions to Reduce Food Waste
4. Recommendations
- Education: The study showed that there is a lack of knowledge about the links between food and water consumption, and young people waste more food. Therefore, it is important to introduce environmental education among the young generation in schools and universities. The introduction of food waste-related courses at universities and schools would provide a unique opportunity for changing the food waste behavior of students, given that they take many of their meals on campus. Such programs should address specific behavioral factors in order to develop university and community cultures whose members are aware of the impacts of food waste and mindful of how to reduce it. The greater the individuals’ knowledge and awareness of the problem of food waste, the more likely they are to modify their behavior positively [52,81].
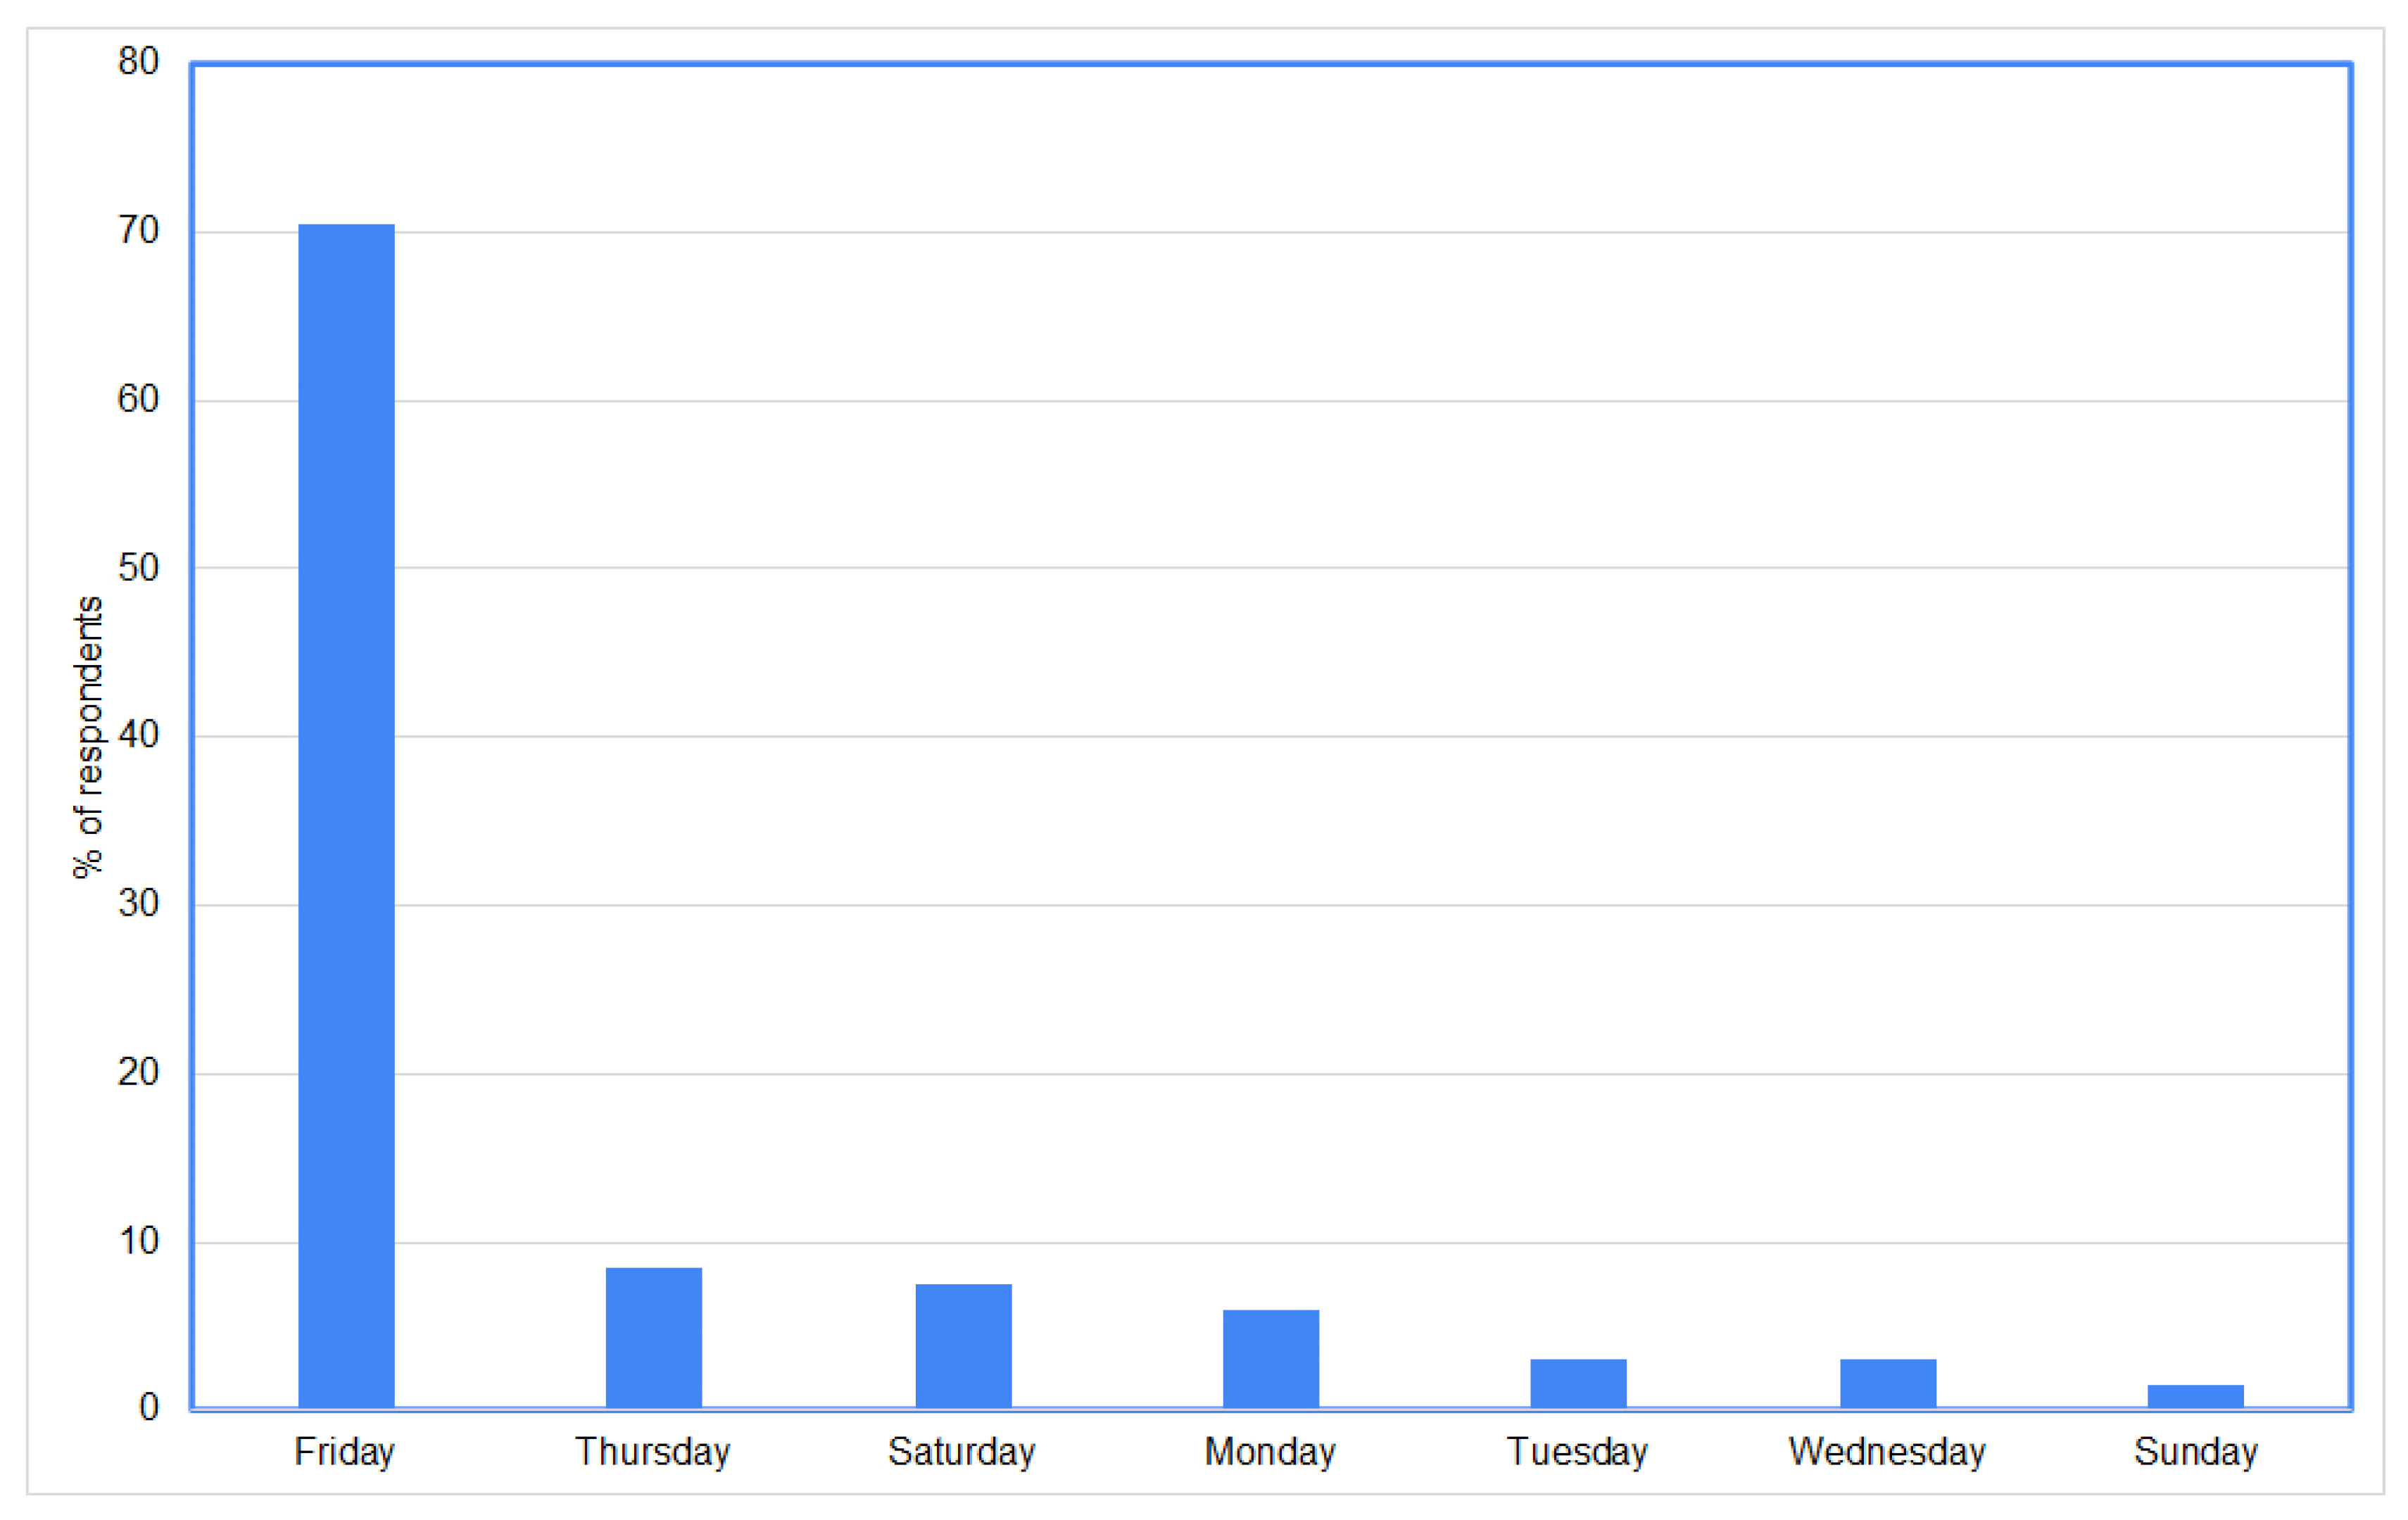
- Public awareness: Since most of the respondents (70%) indicated that Friday had the highest levels of food waste, special campaigns could be arranged ahead of Friday. The findings can be used to design material for food waste intervention programs, thereby contributing to protecting the environment, saving money, and achieving the UN SDGs (notably, the goals for zero hunger, sustainable cities and communities, and responsible consumption and production). In particular, flyers could be distributed at schools, universities, restaurants, hotels, malls, and hostels to reduce food waste. To achieve sustainability, there is a need for continuous training for skilled practitioners in the food chain (example, housewives, food banks officers, donors, and recipients of food).
- Compassion: Practice in the UAE already includes the donation and distribution of excess food to people in need, and these activities should be promoted to enrich the spirit of philanthropy, solidarity, and compassion among members of the community [34]. Development of local applications would help in the distribution of surplus food to those who need it by linking producers and consumers. The applications could be in different languages to cater for diversity of UAE residents. Social media also plays an important role in connecting people, and this has a positive impact on food conservation [51,78].
- Infrastructure for extra food: The food banks can help in sharing food to prevent food waste and in ensuring safety of food [82]. Therefore, there is a need to increase the number of food banks. Encourage community to use discarded food for feeding animals, birds, and recycle it properly (preparation of infrastructure for recycling/composting food and kitchen waste).
- Food waste audits: Perform regular food waste audits at institutions such as universities to give real statistics about food wasted and how to prevent this. Companies specialized in waste reduction techniques such as Winnow and LeanPath can be involved. These companies sell training, scales, and software to corporations with cafeterias and to college/university cafeterias.
- Future research: Responses to a questionnaire may not reflect real behaviors and there is a distinct gap between the intentions of the respondents and their actions [50,83]. It is recommended that future research work could apply social practice theory to understand food waste in the context of daily practices.
- Fund: Food waste is a complex problem and its reduction needs a multidisciplinary approach that takes into account many factors such as culture, socioeconomic status, education, policies, and use of advanced technologies. Therefore, there is a need to allocate funds to support education and research dealing with food waste.
5. Conclusions
- One of the limitations of this study is the low response rate. This could be attributed to the perception of some students that the survey was seeking to monitor their use of food, which would have made them reluctant to participate even if the questionnaire was circulated many times. Incentives such as gifts/awards could be used to encourage more participation.
- The data is collected from one university in UAE and a large proportion of the respondents are females (71.6%). This is not sufficient to generalize the outcomes. It is questionable whether the answers will be consistent when undertaking the survey at other universities (comparison). Future work could target other universities.
- The convenience sampling method was adopted in this study because of a budget constraint. The method is widely used in the literature [52]. However, it does not allow for a direct statistical generalization of the results. Therefore, probabilistic sampling design could be used in future work.
- The target group in this study is young people (students) at the university. Other age groups, and other sectors such as retail shops, restaurants, hotels, housewives, dining services employees, and recipients of donated food could be included in future work. These groups are important in addressing the creation, reduction, and ultimate prevention of food waste.
Author Contributions
Funding
Institutional Review Board Statement
Informed Consent Statement
Data Availability Statement
Acknowledgments
Conflicts of Interest
Abbreviations
| ERC | Emirates Red Crescent |
| FAO | Food and Agriculture Organization |
| UAE | United Arab Emirates |
| UAEU | United Arab Emirates University |
| UN SDGs | United Nations Sustainable Development Goals |
| USD | United States Dollar |
Appendix A

| SDGs Research Program |
|---|
| Title of Research Project: University students’ Perceptions of Food Waste in the UAE |
| Related SDG: Goal 2: Zero Hunger |
| Name of Faculty (Mentor): Mohamed Yagoub Mohamed |
| Department: Geography and Urban Sustainability |
| College: Humanities and Social Sciences |
| Dear student, Greetings. Your participation in this study about young people’s perceptions of food waste is highly appreciated. Please complete the questions below, which should take a few minutes. All information will remain confidential and will be used in summary form for research purposes only. You can withdraw from the questionnaire at any time. |
| Consent |
| I have read the above information and I voluntarily agree to participate in this study. Please note this is an online survey using the Google Forms tool. Please click on “Enter the Survey” if you agree or “Exit the Survey” if you disagree. |
| Knowledge |
|
| Perception |
|
| Behavior |
|
| Interventions to reduce food waste |
|
| Demography |
|
| Thank you very much for your time and invaluable input, and for sharing your knowledge. If you have any questions related to the study, please send an email to: Prof. M. M. Yagoub Email: myagoub@uaeu.ac.ae Researcher at UAE University |
References
- Adamashvili, N.; Chiara, F.; Fiore, M. Food loss and waste, a global responsibility?! Econ. Agro-Aliment./Food Econ. 2019, 21, 825–846. [Google Scholar] [CrossRef]
- Corrado, S.; Sala, S. Food waste accounting along global and European food supply chains: State of the art and outlook. Waste Manag. 2018, 79, 120–131. [Google Scholar] [CrossRef] [PubMed]
- FAO (Food and Agriculture Organization of the United Nations). Global Food Losses and Food Waste—Extent, Causes and Prevention; FAO: Rome, Italy, 2011. [Google Scholar]
- WFP (World Food Program). Advocacy for Zero Hunger. 2022. Available online: https://www.wfp.org/advocacy (accessed on 5 March 2022).
- UNEP (UN Environment Program). Using Green and Digital Technologies to Reduce Food Waste at the Consumer Level. 2021. Available online: https://wedocs.unep.org/bitstream/handle/20.500.11822/36803/CytSb.pdf (accessed on 20 April 2022).
- UN (United Nations). The 17 Sustainable Development Goals (SDGs). 2022. Available online: https://sdgs.un.org/goals (accessed on 17 July 2021).
- Nikolaus, C.J.; Nickols-Richardson, S.M.; Ellison, B. Wasted food: A qualitative study of U.S. young adults’ perceptions, beliefs and behaviors. Appetite 2018, 130, 70. [Google Scholar] [CrossRef]
- FAO (Food and Agriculture Organization of the United Nations). Food Wastage Footprint: Impacts on Natural Resources; FAO: Rome, Italy, 2013. [Google Scholar]
- Buzby, J.C.; Wells, H.F.; Hyman, J. The Estimated Amount, Value, and Calories of Postharvest Food Losses at the Retail and Consumer Levels in the United States. In Food Loss in the United States: Selected Analyses; USDA: Washington, DC, USA, 2014; pp. 1–42. [Google Scholar]
- FAO. Food Loss and Food Waste. 2021. Available online: http://www.fao.org/food-loss-and-food-waste/flw-data (accessed on 12 March 2022).
- Gustavsson, J. The Climate Change Impact of Retail Waste from Horticultural Products. Master’s Thesis, Department of Plant and Environmental Sciences, University of Gothenburg, Gothenburg, Sweden, 2010. [Google Scholar]
- OLI. The Problem of Food Waste. 2021. Available online: https://olioex.com/food-waste/the-problem-of-food-waste/ (accessed on 11 February 2022).
- Isola, A.-M.; Laiho, J. Commoning surplus food in Finland–actors and tensions. In Enacting Community Economies within a Welfare State; Eskelinen, T., Hirvilammi, T., Venäläinen, J., Eds.; Mayfly Books: London, UK, 2020; pp. 95–116. [Google Scholar]
- Parfitt, J.; Barthel, M.; Macnaughton, S. Food waste within food supply chains: Quantification and potential for change to 2050. Phil. Trans. R. Soc. 2010, 365, 3065–3081. [Google Scholar] [CrossRef]
- Stuart, T. Waste—Uncovering the Global Food Scandal; Penguin Books: London, UK, 2009. [Google Scholar]
- Williams, H.; Wikström, F.; Otterbring, T.; Löfgren, M.; Gustafsson, A. Reasons for household food waste with special attention to packaging. J. Clean. Prod. 2012, 24, 141–148. [Google Scholar] [CrossRef]
- WRAP. Packaging Technologies with Potential to Reduce the Amount of Food Thrown Away; WRAP: Banbury, UK, 2006; Available online: https://wrap.org.uk/taking-action/food-drink (accessed on 20 December 2021).
- WRAP. Understanding Food Waste—Key Findings of Our Recent Research on the Nature, Scale and Causes of Household Food Waste; WRAP: Banbury, UK, 2007. [Google Scholar]
- WRAP. Household Food and Drink Waste in the UK; WRAP: Banbury, UK, 2009. [Google Scholar]
- Midgley, J.L. The logics of surplus food redistribution. J. Environ. Plan. Manag. 2014, 57, 1872–1892. [Google Scholar] [CrossRef]
- Nair, D.J.; Rashidi, T.H.; Dixit, V.V. Estimating surplus food supply for food rescue and delivery operations. Socio-Econ. Plan. Sci. 2017, 57, 73–83. [Google Scholar] [CrossRef]
- Warshawsky, D. Food waste, sustainability, and the corporate sector: Case study of a US food company. Geogr. J. 2016, 182, 384–394. [Google Scholar] [CrossRef]
- Guiding Pick. Implementation of Food Loss and Waste Protocol in UAE: A Significant Step to Reduce Food Waste. 2017. Available online: http://guidingpick.com/implementation-food-loss-waste-protocol-uae-significant-step-reduce-food-waste/ (accessed on 10 February 2022).
- Zawya. EcoWaste 2015 to Showcase Next Generation Organic Waste Technology. 2021. Available online: https://www.zawya.com/ (accessed on 11 December 2021).
- Kohli, S.A. UAE Aims to Cut Food Waste by Half by 2030. Khaleej Times, 2021. Available online: https://www.khaleejtimes.com/ramadan-2021/ramadan-2021-uae-aims-to-cut-food-waste-by-half-by-2030 (accessed on 17 January 2022).
- Paužuoliene, J.; Šimanskiene, L.; Fiore, M. What about Responsible Consumption? A Survey Focused on Food Waste and Consumer Habits. Sustainability 2022, 14, 8509. [Google Scholar] [CrossRef]
- Dubai Media Office. UAE Food Bank Distributes 27,362 Tonnes of Food between Its Launch in 2017 and 2020-End. 2021. Available online: https://mediaoffice.ae/en/news/2021/June/03-06/UAE-food-bank#: (accessed on 5 March 2022).
- FAO. World Food Day at Expo Dubai. 2021. Available online: http://www.fao.org/world-food-day/events/detail/dubai-expo-celebrates-world-food-day/en (accessed on 15 January 2022).
- Microsoft Network. UAE Food Bank Distributes More than 10 Million Meals in 2021. 2022. Available online: https://www.msn.com/en-ae/news/national/uae-food-bank-distributes-more-than-10-million-meals-in-2021/ar-AATcPi9?ocid=entnewsntp&pc=U531 (accessed on 15 January 2022).
- UAE Food Bank. 2021. Available online: https://www.dm.gov.ae/foodbank/ (accessed on 24 December 2021).
- UAE National Committee on Sustainable Development Goals. UAE and the 2030 Agenda for Sustainable Development: Excellence in Implementation. 2017. Available online: https://sustainabledevelopment.un.org/content/documents/20161UAE_SDGs_Report_Full_English.pdf (accessed on 15 December 2021).
- UAE’s Government Portal. National Food Security Strategy 2051. 2021. Available online: https://u.ae/en/about-the-uae/strategies-initiatives-and-awards/federal-governments-strategies-and-plans/national-food-security-strategy-2051 (accessed on 15 December 2021).
- UAE Food Waste Pledge. 2021. Available online: https://www.foodwastepledge.ae/ (accessed on 5 December 2021).
- Wam. ERC Distributes over 800,000 Meals, 30 Tons of Meat under ‘Grace Conservation’ Project. 2020. Available online: https://wam.ae/en/details/1395302815510 (accessed on 18 December 2021).
- Kamel, D. Generation Start-Up: A Restaurant’s Excess Food is Now a UAE Resident’s Bargain Dinner with BonApp. Available online: https://www.thenationalnews.com (accessed on 25 January 2022).
- SyndiGate Media. Food-Waste Reduction App Launches in UAE. 2020. Available online: https://www.hoteliermiddleeast.com/operations/front-of-house/food-beverage/food-waste-reduction-app-launches-in-uae (accessed on 2 March 2022).
- Buzby, J.C.; Guthrie, J.F. Plate Waste in School Nutrition Programs; Final Report to Congress, ERS E-FAN-02-009; USDA: Washington, DC, USA, 2002. [Google Scholar]
- Gallo, A.E. Consumer food waste in the US. Natl. Food Rev. 1980, 12, 13–16. [Google Scholar]
- Kijboonchoo, K.; Thasanasuwan, W.; Srichan, W. Gender Differences in Knowledge, Attitude, Food Choice and BodyImage Perception among Children Aged 9-12 Years in Bangkok, Thailand. J. Public Health Dev. 2013, 11, 49–60. [Google Scholar]
- Barr, S. Factors influencing environmental attitudes and behaviours: A UK case study of household waste management. Environ. Behav. 2007, 39, 435–473. [Google Scholar] [CrossRef]
- Li, C. Gender differences in nutrition knowledge, attitude, and practice among elderly people. Int. J. Manag. Econ. Soc. Sci. 2017, 6, 199–211. [Google Scholar]
- Brook, L. Food Behaviour Consumer Research—Findings from the Quantitative Survey; Briefing Paper; WRAP: Banbury, UK, 2007. [Google Scholar]
- Hamilton, C.; Denniss, R.; Baker, D. Wasteful Consumption in Australia; Discussion Paper No. 77; The Australia Institute: Canberra, Australia, 2005. [Google Scholar]
- Osner, R. Food wastage. Nutr. Food Sci. 1982, 82, 13–16. [Google Scholar] [CrossRef]
- Van Garde, S.J.; Woodburn, M.J. Food discard practices of householders. J. Am. Diet. Assoc. 1987, 87, 322–329. [Google Scholar] [CrossRef]
- Engstrom, R.; Carlsson-Kanyama, A. Food losses in food service institutions—Examples from Sweden. Food Policy 2004, 29, 203–213. [Google Scholar] [CrossRef]
- Koivupuro, H.K.; Hartikainen, H.; Silvennoinen, K.; Katajajuuri, J.M.; Heikintalo, N.; Reinikainen, A.; Jalkanen, L. Influence of socio-demographical, behavioural and attitudinal factors on the amount of avoidable food waste generated in Finnish households. Int. J. Consum. Stud. 2012, 36, 183–191. [Google Scholar] [CrossRef]
- Stancu, V.; Haugaard, P.; Lähteenmäki, L. Determinants of consumer food waste behaviour: Two routes to food waste. Appetite 2016, 96, 7–17. [Google Scholar] [CrossRef]
- Selahudin, N.F.; Salleh, S.M.; Azman, N.A.N.N.; Mohaiyadin, N.M. Food Waste Self-Reported Behavior: An Investigation Among Malaysian Youth. Glob. Bus. Manag. Res. 2020, 12, 130–138. [Google Scholar]
- Radzyminska, M.; Jakubowska, D.; Staniewska, K. Consumer attitude and behaviour towards food waste. J. Agribus. Rural. Dev. 2016, 39, 175–181. [Google Scholar] [CrossRef]
- Lazell, J. Consumer food waste behaviour in universities: Sharing as a means of prevention. J. Consum. Behav. 2016, 15, 430–439. [Google Scholar] [CrossRef]
- Principato, L.; Secondi, L.; Pratesi, C. Reducing food waste: An investigation on the behaviour of Italian youths. Br. Food J. 2015, 117, 731–748. [Google Scholar] [CrossRef]
- Singh, N.; Singh, T.; Singh, D. Youth Food Waste Behavior: A Waste Stream Components Analysis. J. Environ. Manag. Tour. 2018, 7, 1389–1397. [Google Scholar] [CrossRef]
- Mirosa, M.; Munro, H.; Mangan-Walker, E.; Pearson, D. Reducing waste of food left on plates. Br. Food J. 2016, 118, 2326–2343. [Google Scholar] [CrossRef]
- Burlea-Schiopoiu, A.; Ogarca, R.F.; Barbu, C.M.; Craciun, L.; Baloi, I.C.; Mihai, L.S. The impact of COVID-19 pandemic on food waste behaviour of young people. J. Clean. Prod. 2021, 294, 126333. [Google Scholar] [CrossRef]
- Aliefia, D.; Syaputra, G.E.; Novella, U.; Yamazaki, A.; Nakatsuka, K.; Fujiyama, I. Awareness Before and During Pandemic toward Food Waste: “Comparison between Indonesia and Japanese Students”. In IOP Conference Series: Earth and Environmental Science; IOP Publishing: Bristol, UK, 2021; Volume 933, p. 012023. [Google Scholar]
- Science Daily. Why Are Young Adults Wasting so Much Food? Study Looks at Perceptions and Food Behaviors. 2021. Available online: https://www.sciencedaily.com/releases/2018/08/180822122832.htm (accessed on 12 January 2022).
- Thyberg, K.L.; Tonjes, D.J. Drivers of food waste and their implications for sustainable policy development. Resour. Conserv. Recycl. 2016, 106, 110–123. [Google Scholar] [CrossRef]
- Delynko, K. What’s the Beef with Water? 2019. Available online: https://www.denverwater.org/tap/whats-beef-water (accessed on 27 March 2022).
- Food Print. Water Footprint of Food Guide. 2022. Available online: https://www.watercalculator.org/water-footprint-of-food-guide/ (accessed on 25 March 2022).
- Hoekstra, A.Y.; Chapagain Ashok, K.; Aldaya, M.M.; Mekonnen, M.M. The Water Footprint Assessment Manual: Setting the Global Standard; Earthscan: London, UK, 2011. [Google Scholar]
- Mekonnen, M.M.; Hoekstra, A.Y. A global assessment of the water footprint of farm animal products. Ecosystems 2012, 15, 401–405. [Google Scholar] [CrossRef]
- Richter, B. Knowledge and Perception of Food Waste Among German Consumers. J. Clean. Prod. 2017, 166, 641–648. [Google Scholar] [CrossRef]
- Sally, H. Food Footprint Series: Is Eating Seafood Better for the Climate Than Meat? 2021. Available online: https://www.greenqueen.com.hk/food-footprint-seafood-meat-climate/ (accessed on 21 May 2022).
- Water Footprint. What is a Water Footprint? 2022. Available online: https://waterfootprint.org/en/water-footprint/what-is-water-footprint/ (accessed on 6 March 2022).
- WeForum. Which Foods Need the Most Water to Produce? 2022. Available online: https://www.weforum.org/agenda/2021/06/water-footprint-food-sustainability (accessed on 12 April 2022).
- Lukwaro, G. UAE Meat Consumption above Global Average. The National News. 2010. Available online: https://www.thenationalnews.com/business/uae-meat-consumption-above-global-average-1.481556 (accessed on 7 March 2022).
- Diprose, G.; Lee, L. Food rescue as collective care. Area 2022, 54, 144–151. [Google Scholar] [CrossRef]
- Hargreaves, T. Practice-ing behaviour change: Applying social practice theory to pro-environmental behaviour change. J. Consum. Cult. 2011, 11, 79–99. [Google Scholar] [CrossRef]
- Shove, E.; Pantzar, M. Consumers, producers and practices: Understanding the invention and reinvention of Nordic walking. J. Consum. Cult. 2005, 5, 43–64. [Google Scholar] [CrossRef]
- Roses, R.P.; Prassas, E.S.; McShane, W.R. Traffic Engineering, 3rd ed.; Pearson Education Inc.: Saddle River, NJ, USA, 2004. [Google Scholar]
- Simkus, J. What is ANOVA (Analysis of Variance). Simply Psychology, 2022. Available online: www.simplypsychology.org/anova.html (accessed on 14 May 2022).
- UAE University. UAEU Facts & Figures. 2022. Available online: https://www.uaeu.ac.ae/en/about/facts_and_figures.shtml (accessed on 20 March 2022).
- Gustavsson, J.; Cederberg, C.; Sonesson, U.; van Otterdijk, R.; Meybeck, A. Global Food Losses and Food Wastes: Extent, Causes and Prevention; Food and Agriculture Organization of the United Nations: Rome, Italy, 2011. [Google Scholar]
- Kosseva, M.; Webb, C. Food Industry Wastes: Assessment and Recuperation of Commodities; E-Book; Elsevier Science & Technology: Amsterdam, The Netherlands, 2013. [Google Scholar]
- Stefan, V.; van Herpen, E.; Tudoran, A.A.; Lahteenmaki, L. Avoiding food waste by Romanian consumers: The importance of planning and shopping routines. Food Qual. Prefer. 2013, 28, 375–381. [Google Scholar] [CrossRef]
- Schaeffer, K. Among U.S. Couples, Women Do More Cooking and Grocery Shopping than Men. 2019. Available online: https://www.pewresearch.org/fact-tank/2019/09/24/among-u-s-couples-women-do-more-cooking-and-grocery-shopping-than-men/ (accessed on 21 May 2022).
- Foster, D.; Lineham, C. ‘Liking’ carbon: Can social media play a role in carbon management? Carbon Manag. 2013, 4, 1–4. [Google Scholar] [CrossRef]
- Caldeira, C.; Laurentiisa, V.; Corradoa, S.; Holsteijnb, F.; Salaa, S. Quantification of food waste per product group along the food supply chain in the European Union: A mass flow analysis. Resour. Conserv. Recycl. 2019, 149, 479–488. [Google Scholar] [CrossRef]
- Van der Werf, P.; Seabrook, J.A.; Gilliland, J.A. Food for naught: Using the theory of planned behaviour to better understand household food wasting behaviour. Can. Geogr. 2019, 63, 478–493. [Google Scholar] [CrossRef]
- Pinto, R.S.; Pinto, R.M.d.S.; Melo, F.F.S.; Campos, S.S.; Cordovil, C.M.d.S. A Simple Awareness Campaign to Promote Food Waste Reduction in a University Canteen. Waste Manag. 2018, 76, 28–38. [Google Scholar] [CrossRef] [PubMed]
- Watson, M.; Meah, A. Food, waste and safety: Negotiating conflicting social anxieties into practices of domestic provisioning. In Waste Matters: New Perspectives on Food and Society; Evans, D., Campbell, H., Murcott, A., Eds.; Wiley & Sons: Oxford, UK, 2013; pp. 102–120. [Google Scholar]
- Vermeir, I.; Verbeke, W. Sustainable food consumption: Exploring the consumer “attitude–behaviour intension” gap. J. Agric. Environ. Ethics 2006, 19, 169–194. [Google Scholar] [CrossRef]
| Variable | Chi-Square | Cramer’s V |
|---|---|---|
| Gender | 0.318 (df = 2) | 0.107 |
| Place of residence | 0.753 (df = 2) | 0.053 |
| Income | 0.657 (df = 4) | 0.078 |
| Variable | Chi-Square | Cramer’s V |
|---|---|---|
| Gender | 0.854 (df = 2) | 0.040 |
| Place of residence | 0.011 (df = 2) | 0.212 |
| Income | 0.639 (df = 4) | 0.079 |
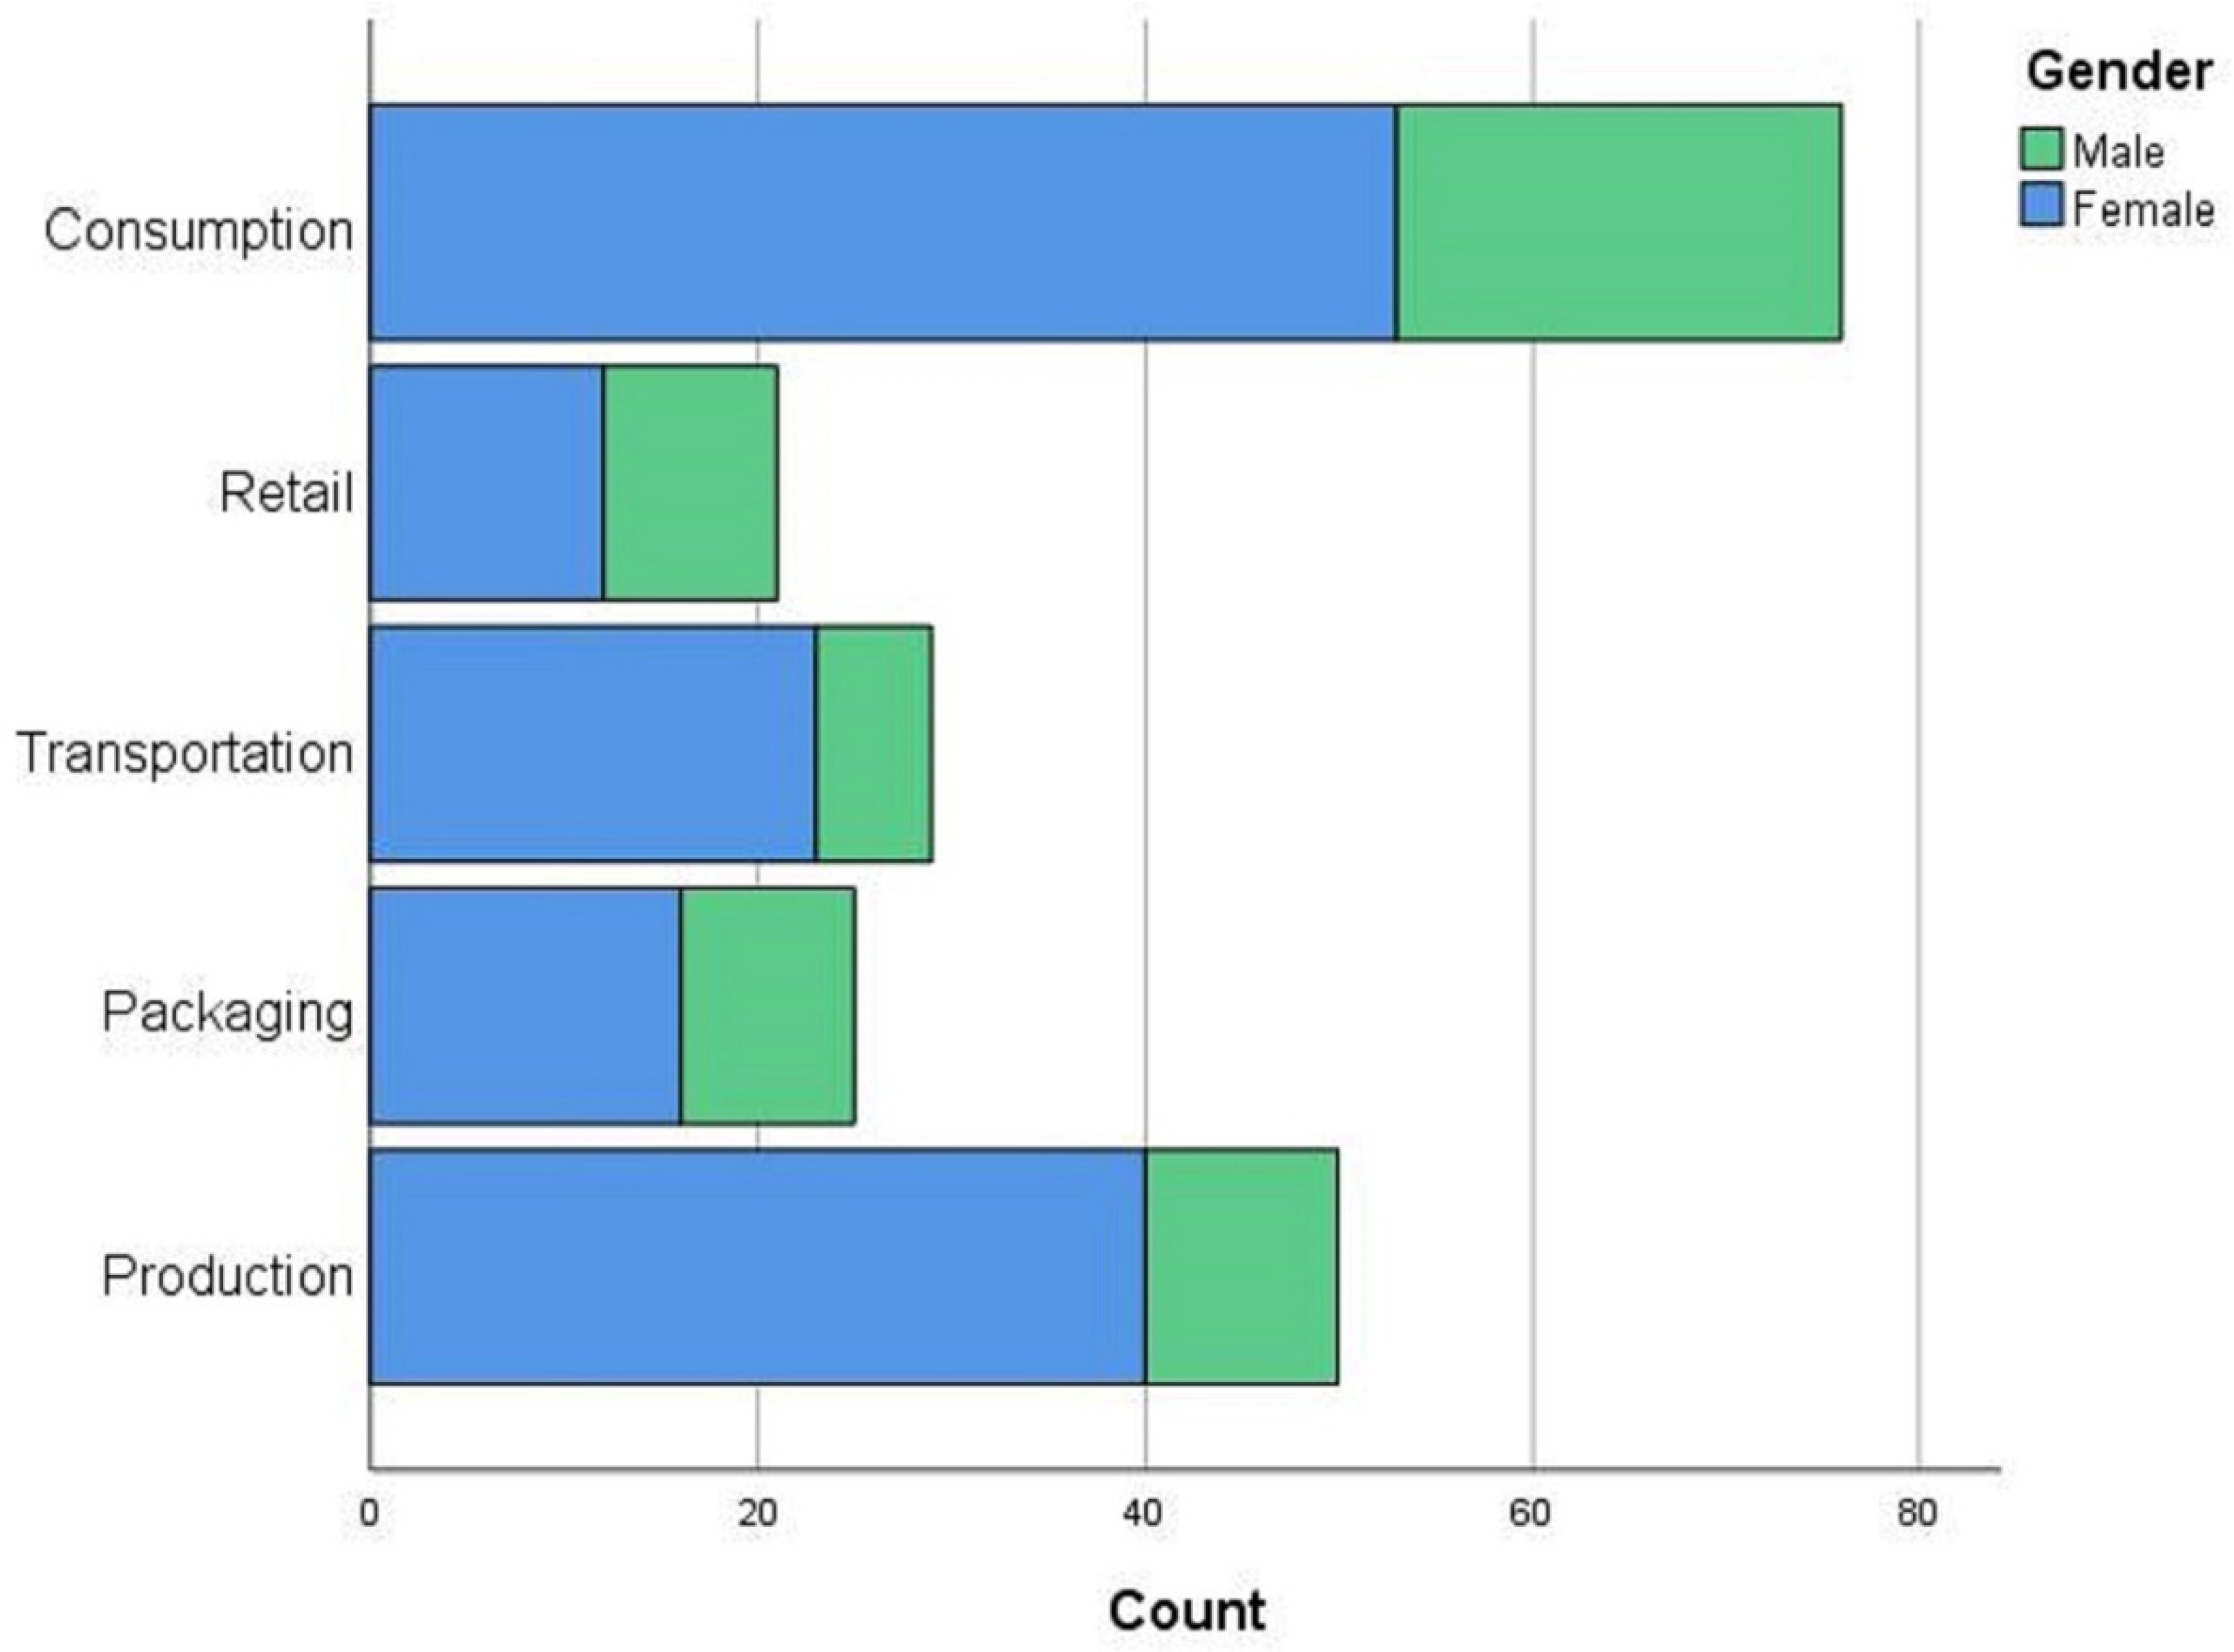
| Gender | Production | Packaging | Transportation | Retail | Consumption | Total |
|---|---|---|---|---|---|---|
| Male | 10 | 9 | 6 | 9 | 23 | 57 |
| Female | 40 | 16 | 23 | 12 | 53 | 144 |
| Total | 50 | 25 | 29 | 21 | 76 | 201 |
| Variable | Chi-Square | Cramer’s V |
|---|---|---|
| Gender | 0.232 (df = 4) | 0.167 |
| Place of residence | 0.070 (df = 4) | 0.208 |
| Income | 0.424 (df = 8) | 0.142 |
| Variable | Chi-Square | Cramer’s V |
|---|---|---|
| Gender | 0.170 (df = 3) | 0.158 |
| Place of residence | 0.964 (df = 3) | 0.037 |
| Income | 0.325 (df = 6) | 0.131 |
| Gender | N | Mean | Std Deviation | Std Error Mean |
|---|---|---|---|---|
| Male | 57 | 3.84 | 0.978 | 0.130 |
| Female | 144 | 3.67 | 0.982 | 0.082 |
| Assumption | F | Sig. | t | df | Significance | Mean Difference | Std Error Difference | |
|---|---|---|---|---|---|---|---|---|
| One-Sided p | Two-Sided p | |||||||
| Equal Variances Assumed | 0.332 | 0.565 | 1.143 | 199 | 0.127 | 0.255 | 0.175 | 0.154 |
| Equal variances not assumed | 1.145 | 103.201 | 0.127 | 0.255 | 0.175 | 0.153 | ||
| Gender | N | Mean | Std Deviation | Std Error Mean |
|---|---|---|---|---|
| Male | 57 | 3.56 | 1.102 | 0.146 |
| Female | 144 | 3.35 | 0.993 | 0.083 |
| Place of residence | ||||
| In campus | 70 | 3.51 | 0.974 | 0.116 |
| Off campus | 131 | 3.36 | 1.053 | 0.092 |
| Income | ||||
| Low | 22 | 3.36 | 1.329 | 0.283 |
| Medium | 91 | 3.37 | 0.839 | 0.088 |
| High | 88 | 3.47 | 1.124 | 0.120 |
| Total | 201 |
Publisher’s Note: MDPI stays neutral with regard to jurisdictional claims in published maps and institutional affiliations. |
© 2022 by the authors. Licensee MDPI, Basel, Switzerland. This article is an open access article distributed under the terms and conditions of the Creative Commons Attribution (CC BY) license (https://creativecommons.org/licenses/by/4.0/).
Share and Cite
Yagoub, M.M.; Al Hosani, N.; AlSumaiti, T.; Kortbi, O.; Alshehhi, A.A.; Aldhanhani, S.R.; Albedwawi, S.A. University Students’ Perceptions of Food Waste in the UAE. Sustainability 2022, 14, 11196. https://doi.org/10.3390/su141811196
Yagoub MM, Al Hosani N, AlSumaiti T, Kortbi O, Alshehhi AA, Aldhanhani SR, Albedwawi SA. University Students’ Perceptions of Food Waste in the UAE. Sustainability. 2022; 14(18):11196. https://doi.org/10.3390/su141811196
Chicago/Turabian StyleYagoub, Mohamed M., Naeema Al Hosani, Tareefa AlSumaiti, Othmane Kortbi, Aaesha A. Alshehhi, Sarah R. Aldhanhani, and Shamma A. Albedwawi. 2022. "University Students’ Perceptions of Food Waste in the UAE" Sustainability 14, no. 18: 11196. https://doi.org/10.3390/su141811196
APA StyleYagoub, M. M., Al Hosani, N., AlSumaiti, T., Kortbi, O., Alshehhi, A. A., Aldhanhani, S. R., & Albedwawi, S. A. (2022). University Students’ Perceptions of Food Waste in the UAE. Sustainability, 14(18), 11196. https://doi.org/10.3390/su141811196