Article

Automatic Segmentation and Classification System for Foliar Diseases in Sunflower

by
Rodica Gabriela Dawod
1,* and
Ciprian Dobre
1,2
1
Faculty of Automatic Control and Computer Science, Polytechnic University of Bucharest, 060042 Bucharest, Romania
2
National Institute for Research and Development in Informatics, 011455 Bucharest, Romania
*
Author to whom correspondence should be addressed.
Sustainability 2022, 14(18), 11312; https://doi.org/10.3390/su141811312
Submission received: 7 August 2022 / Revised: 5 September 2022 / Accepted: 7 September 2022 / Published: 9 September 2022

Abstract

:
Obtaining a high accuracy in the classification of plant diseases using digital methods is limited by the diversity of conditions in nature. Previous studies have shown that classification of diseases made with images of lesions caused by diseases is more accurate than a classification made with unprocessed images. This article presents the results obtained when classifying foliar diseases in sunflower using a system composed of a model that automatically segments the leaf lesions, followed by a classification system. The segmentation of the lesions was performed using both Faster R-CNN and Mask R-CNN. For the classification of diseases based on lesions, the residual neural networks ResNet50 and ResNet152 were used. The results show that automatic segmentation of the lesions can be successfully achieved in the case of diseases such as Alternaria and rust, in which the lesions are well-outlined. In more than 90% of the images, at least one affected area has been segmented. Segmentation is more difficult to achieve in the cases of diseases such as powdery mildew, in which the entire leaf acquires a whitish color. Diseased areas could not be segmented in 30% of the images. This study concludes that the use of a system composed of a network that segments lesions, followed by a network that classifies diseases, allows us to both more accurately classify diseases and identify those images for which a precise classification cannot be made.

1. Introduction

The digital solutions developed for agriculture aim at streamlining agricultural operations, both to obtain increased productivity per hectare, as well as to efficiently use natural resources and protect the environment.
The implementation of “green agriculture” and “organic agriculture” [1] can be supported by artificial intelligence algorithms. For instance, reducing the consumption of freshwater used in agriculture can be achieved with the help of systems that signal the need to irrigate, while productivity increases can be achieved with models that recommend the date of cultivation, date of harvesting, or even the type of crop to grow.
The productivity obtained in agriculture is closely related to climatic conditions. Both drought and excessive moisture can cause significant economic damage. Preventive plant protection measures are necessary to reduce yield losses caused by climate change, diseases, and pests. Digital solutions that combine soil analysis with weather information and plant imagery can signal and prevent the appearance of diseases and pests. In this way, we can reduce the need for plant protection chemicals and minimize environmental damage.
Remote-sensing measurements [2], such as the Normalized Difference Vegetation Index (NDVI), are used to highlight the development of crops and identify areas of problems in a field, without having to visit the field. A low vegetation index can signal an area damaged by insects or affected by diseases or a lack of nitrogen. Along with recommendation and prevention systems, digital plant disease identification systems also play an important role in limiting agricultural productivity losses.
With this research, we sought to further extend previous studies related to classifications of foliar diseases in plants. The available dataset contained field images of four diseases affecting sunflowers, along with healthy cases. The models presented here are generally applicable to any foliar plant disease with visible symptoms. The images were captured using a high-performance phone and had the necessary resolution for this type of study.
Before carrying out this research, we studied the results obtained in previous studies on the interpretability of convolutional networks applied to classify foliar diseases [3]. By analyzing the conclusions of other studies in the field, we determined that a classification of individual lesions is more accurate than when considering the whole leaf or unprocessed images. Barbedo [4], when using individual lesions, obtained an accuracy 12% higher than when using the original images. A similar result was obtained by Sharma et al. [5] when, using CNN models, the team classified full leaves versus segmented lesions. In both studies, the segmentation of lesions was done manually, but we aimed to achieve automatic lesion segmentation.
To select the segmentation network, we reviewed articles related to segmentation and classification in agriculture. Before deciding to use segmentation with region-based convolutional neural networks, low-level methods were considered: Chan–Vese; morphological ACWE (active contour without edge) [6]; K-means segmentation; and thresholding [7]. Yet, since the results of segmentation with deep-learning methods are far superior to those of low-level methods, we focused on selecting a CNN network for the segmentation of leaf lesions.
Storey et al. [8] applied Mark R-CNN to segment rust disease on the leaves of an apple tree. Their work analyzed three Mask R-CNN network backbones: ResNet-50, MobileNetV3-Large and MobileNetV3-Large-Mobile. ResNet-50 backbone provided the best result. Lück et al. [9] presented automatic segmentation methods applied for powdery mildew, a disease in which the entire leaf acquires a whitish color, making the affected areas difficult to segment.
Quoc et al. [10] compared U-Net with Mask R-CNN in agricultural area segmentation applied to satellite images, while Tassis et al. [11] used Mask R-CNN, U-Net, and PSPNet in their study of coffee diseases.
For studies on the classification of diseases, the dataset offered by PlantVillage is often used. This dataset contains images processed in a laboratory, showing a leaf affected by a disease, placed on a unicolored background. Atila et al. [12] applied this dataset to classify diseases using several versions of EfficientNet, ResNet50, and other models. Li et al. [13] published a review of studies in recent years on plant disease detection using deep learning, spanning over 100 studies in the field, which used diverse datasets and convolutional neural networks for classification. Despite such diversity already present in the literature, our study adds a new set of sunflower images, and we contribute findings based on this for the automatic segmentation and classification of diseases.
In this study, we aimed to test the state-of-the-art segmentation models on a new set of images collected from the field, with four sunflower diseases. We manually annotated 1500 images to train the segmentation networks. After segmentation, disease classification was carried out based on individual lesions, using multiple lesions on the same leaf, to improve the classification accuracy. That analysis allows us to present new results, not seen in previous studies. The rest of the paper is organized as follows: Section 2 presents the methodology; Section 3 outlines the results; finally, Section 4 contains a discussion of the results obtained and we indicate next steps.

2. Materials and Methods

2.1. Dataset

The study started with a set of 858 images containing four foliar sunflower diseases and also healthy leaves. Due to the relatively low number of images, the study does not aim to discuss the impact that the disease stage has on classification, nor the case when a leaf is attacked by several diseases. We could not capture images in all stages of plant growth or in all disease stages. Images were taken in fields using an iPhone X equipped with a high-performance camera. Image dimensions are 3024 × 4032 px. Images were captured from a distance of 10 to 20 cm, and this allowed the preservation of details. Using augmentation, the number of images was increased.
To train a neural network, a large number of images along with their correct classification is required. Taking a large number of images from the field is difficult and it is necessary to apply artificial methods to increase the number of images. The technique is known as augmentation and consists of transformations applied to a small set of images available per class. Geometric transformations such as flip, rotation, cropping are considered classical augmentation methods. Using deep learning for digital images augmentation is the new trend in this area. Khalifa et al. [14] makes a survey of recent accomplishments in the area of deep-learning based augmentation. Another interesting survey focused on automatic augmentation for agriculture was done by Lu et al. [15].
In this study, we applied flip and rotation as geometric transformations, kernel filters, but also, neural filters, available in Photoshop. Super Zoom is one of the Neural Filters provided by Photoshop.
To increase the variety within the data set, 30 images of powdery mildew and 40 images of downy mildew were added from Internet. Table 1 presents the structure of the dataset with full leaf images. From 300 images per class, 225 were used for training and 75 for validation. Images were resized to 224 × 224 using Photoshop functionalities.
Starting from the dataset presented in Table 1, with images containing full leaves and background elements, using manual annotations, we built a new dataset of images containing lesions and areas with disease symptoms. We used functionality available in pycocotools to extract segmented regions. Table 2 presents the structure of the dataset with lesions and areas affected by the disease. From 600 images per class, 450 were used for training and 150 for validation.

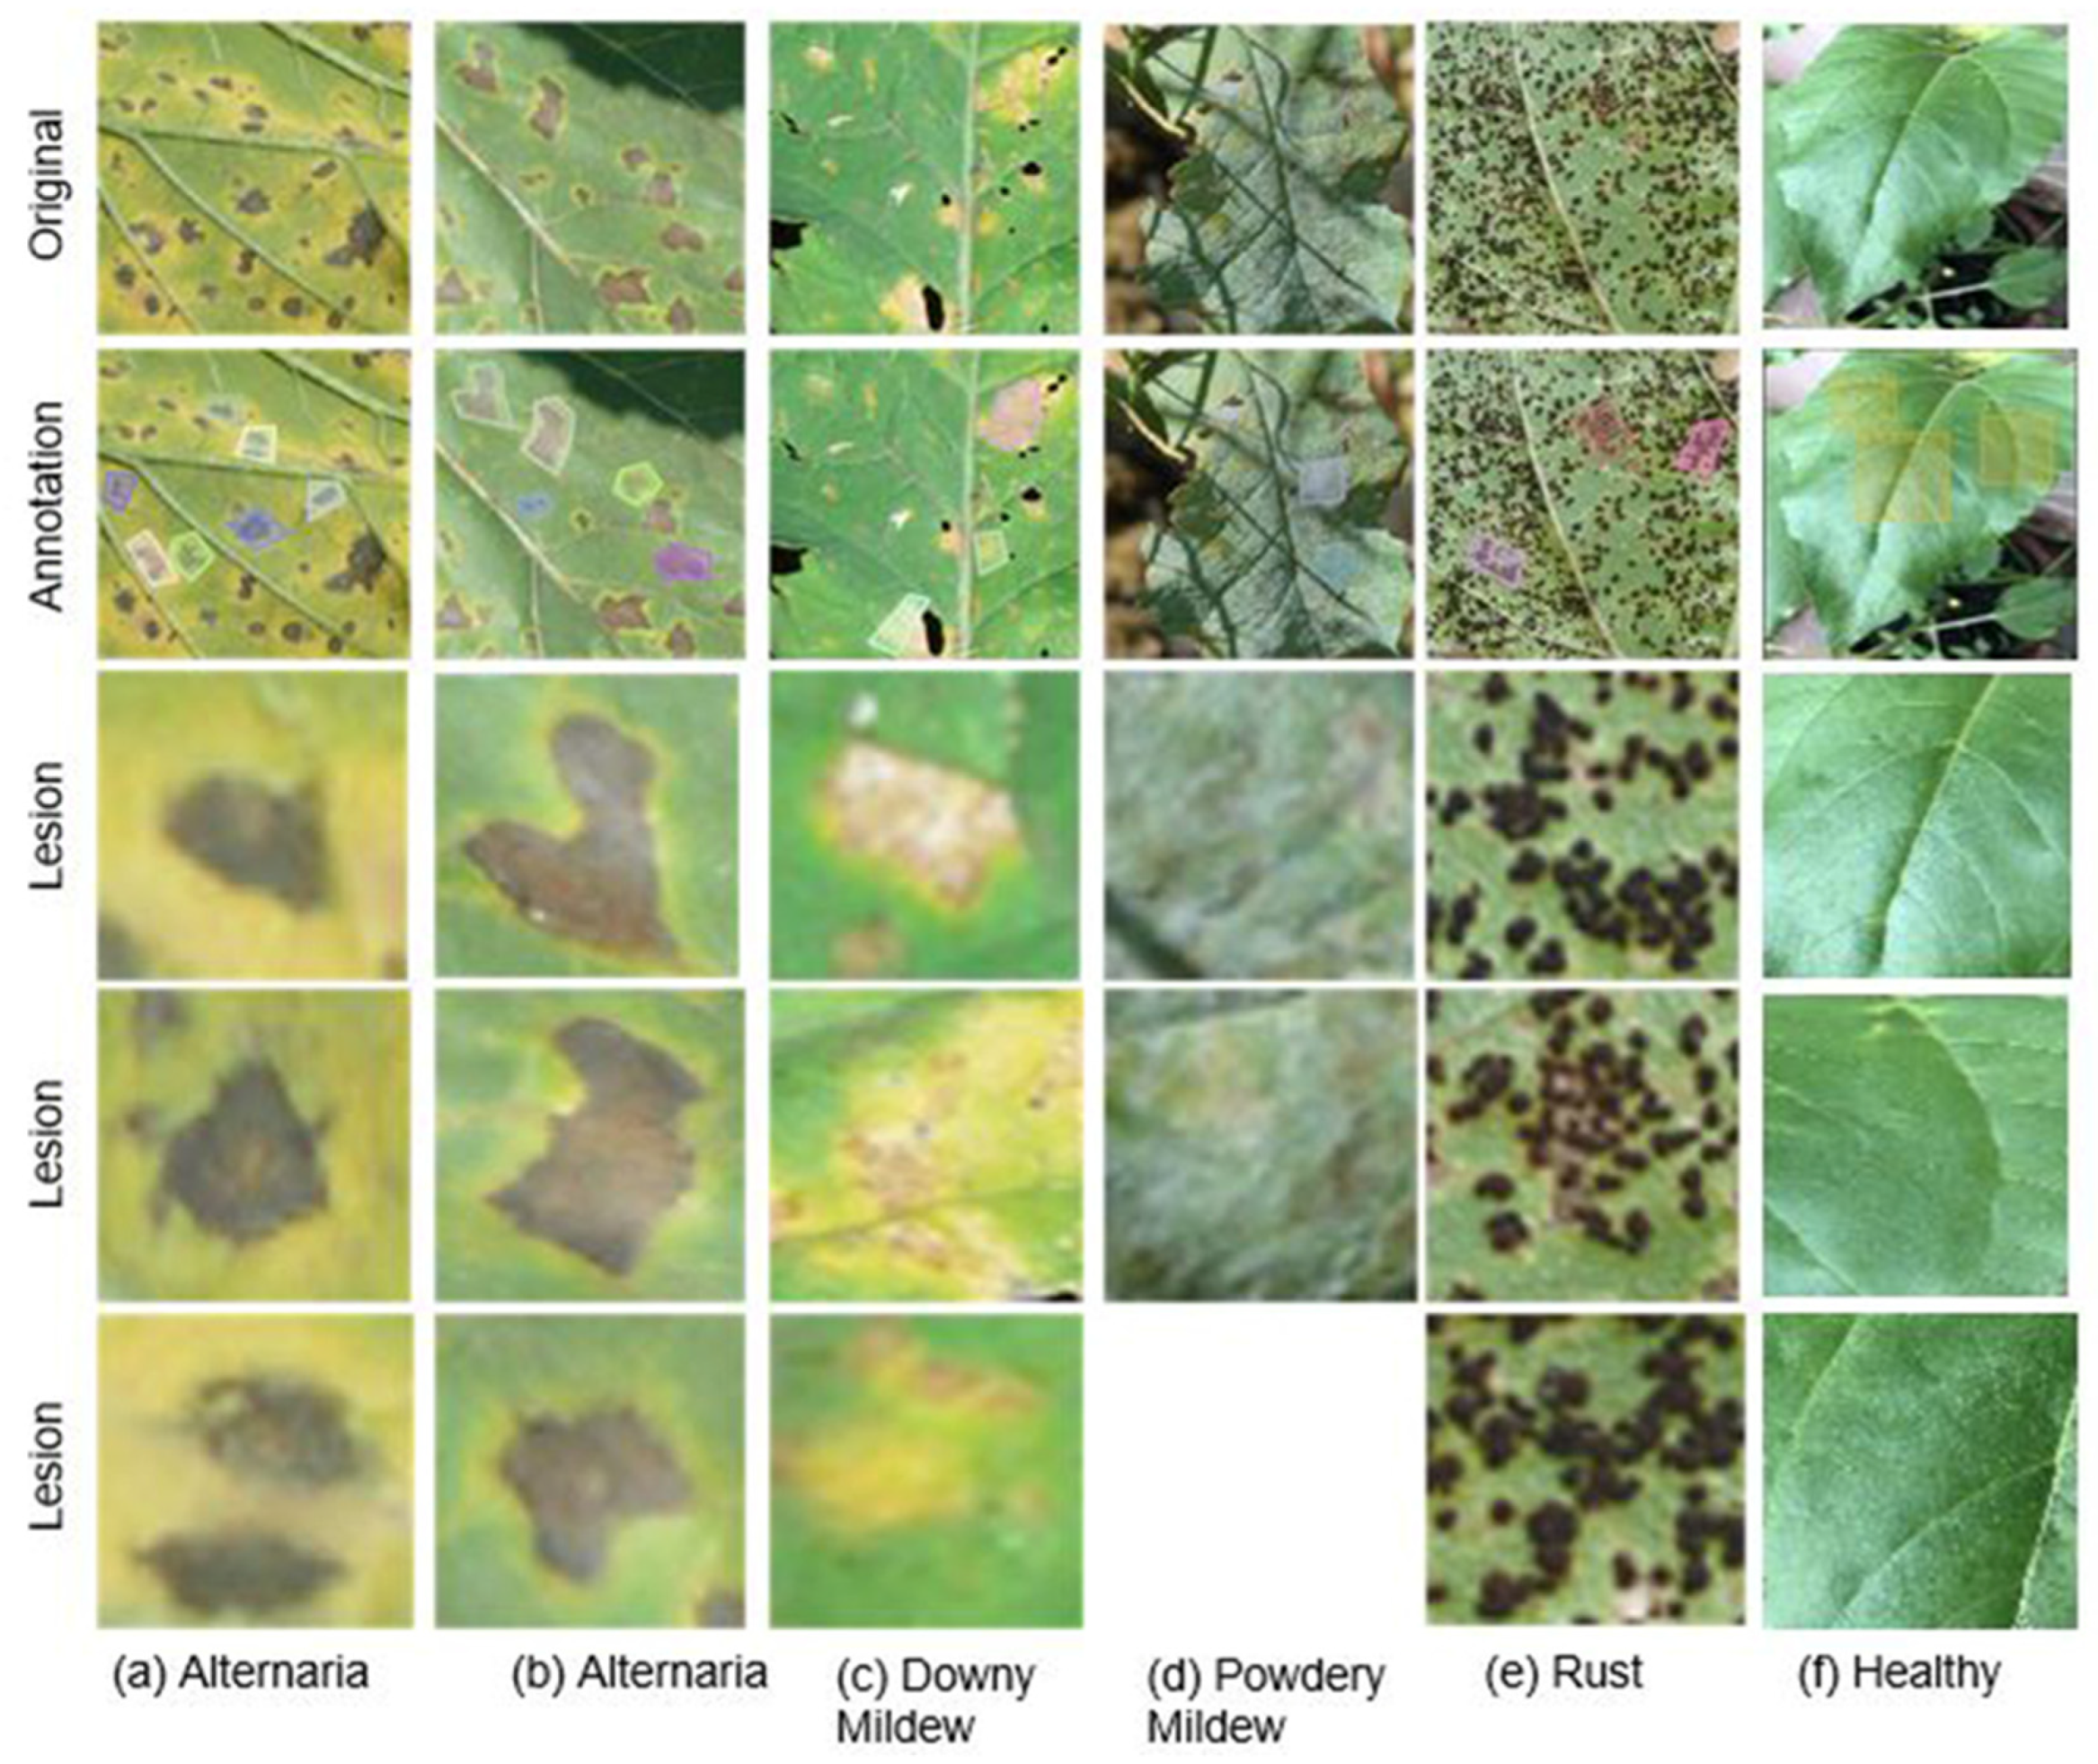
2.2. Image Annotations

To automatically segment the lesions, as well as classify diseases based on the areas affected by the disease, it was necessary to manually annotate the images. In each picture, the diseased areas of the leaf were marked using a polygonal shape, and a label was added to each segmented region. Annotations were saved as Common Objects in the Context format as a JSON file [16]; this format is often used in automatic segmentation algorithms.
To produce the image annotations required for segmentation and classification, two tools were tested: VGG Image Annotator (VIA) [17] and Make Sense. Make [18] Sense was selected as our annotation tool due to its ease of use, as well as since it supports several output file formats, such as YOLO, VGG, JSON, VOC XML, and CSV.
The selection of diseased regions and their labeling was a very important step since the model would use the marked locations during training. If the regions were labeled incorrectly, the model would be incorrectly trained, and this would lead to inaccuracy in the segmentation. Figure 1 shows the initial image, followed by the annotated image and the selected areas of interest.
It can be observed in Figure 1, that while in Alternaria (a, b) and Rust (e), the affected areas are well-outlined, in powdery mildew (d), the disease affects the entire surface of the leaf, giving it a whitish tinge. The lesions caused by Alternaria (a, b) and downy mildew (c) are surrounded by a yellowish halo, but the effect of the disease on the leaf is represented by different colors. In the areas affected by Alternaria, the brown color predominates, and in the areas affected by downy mildew, we can note a white-yellow mixture. The shape of the lesion is also different, with Alternaria lesions, taking a shape that has several corners. Due to the advanced phase of the disease, in certain pictures, the leaf shows holes of black color. In some images, each lesion is marked distinctly, while in case (e), the annotation may include either one or a group of lesions. In the case of downy mildew (c), if the segmented lesion does not include the yellow halo, the disease can be easily confused with powdery mildew (d) since in both cases, we observe the presence of a white color. Even if the automatic segmentation of the lesions could be carried out correctly, the existence of similar symptoms could affect the accuracy of the classification.

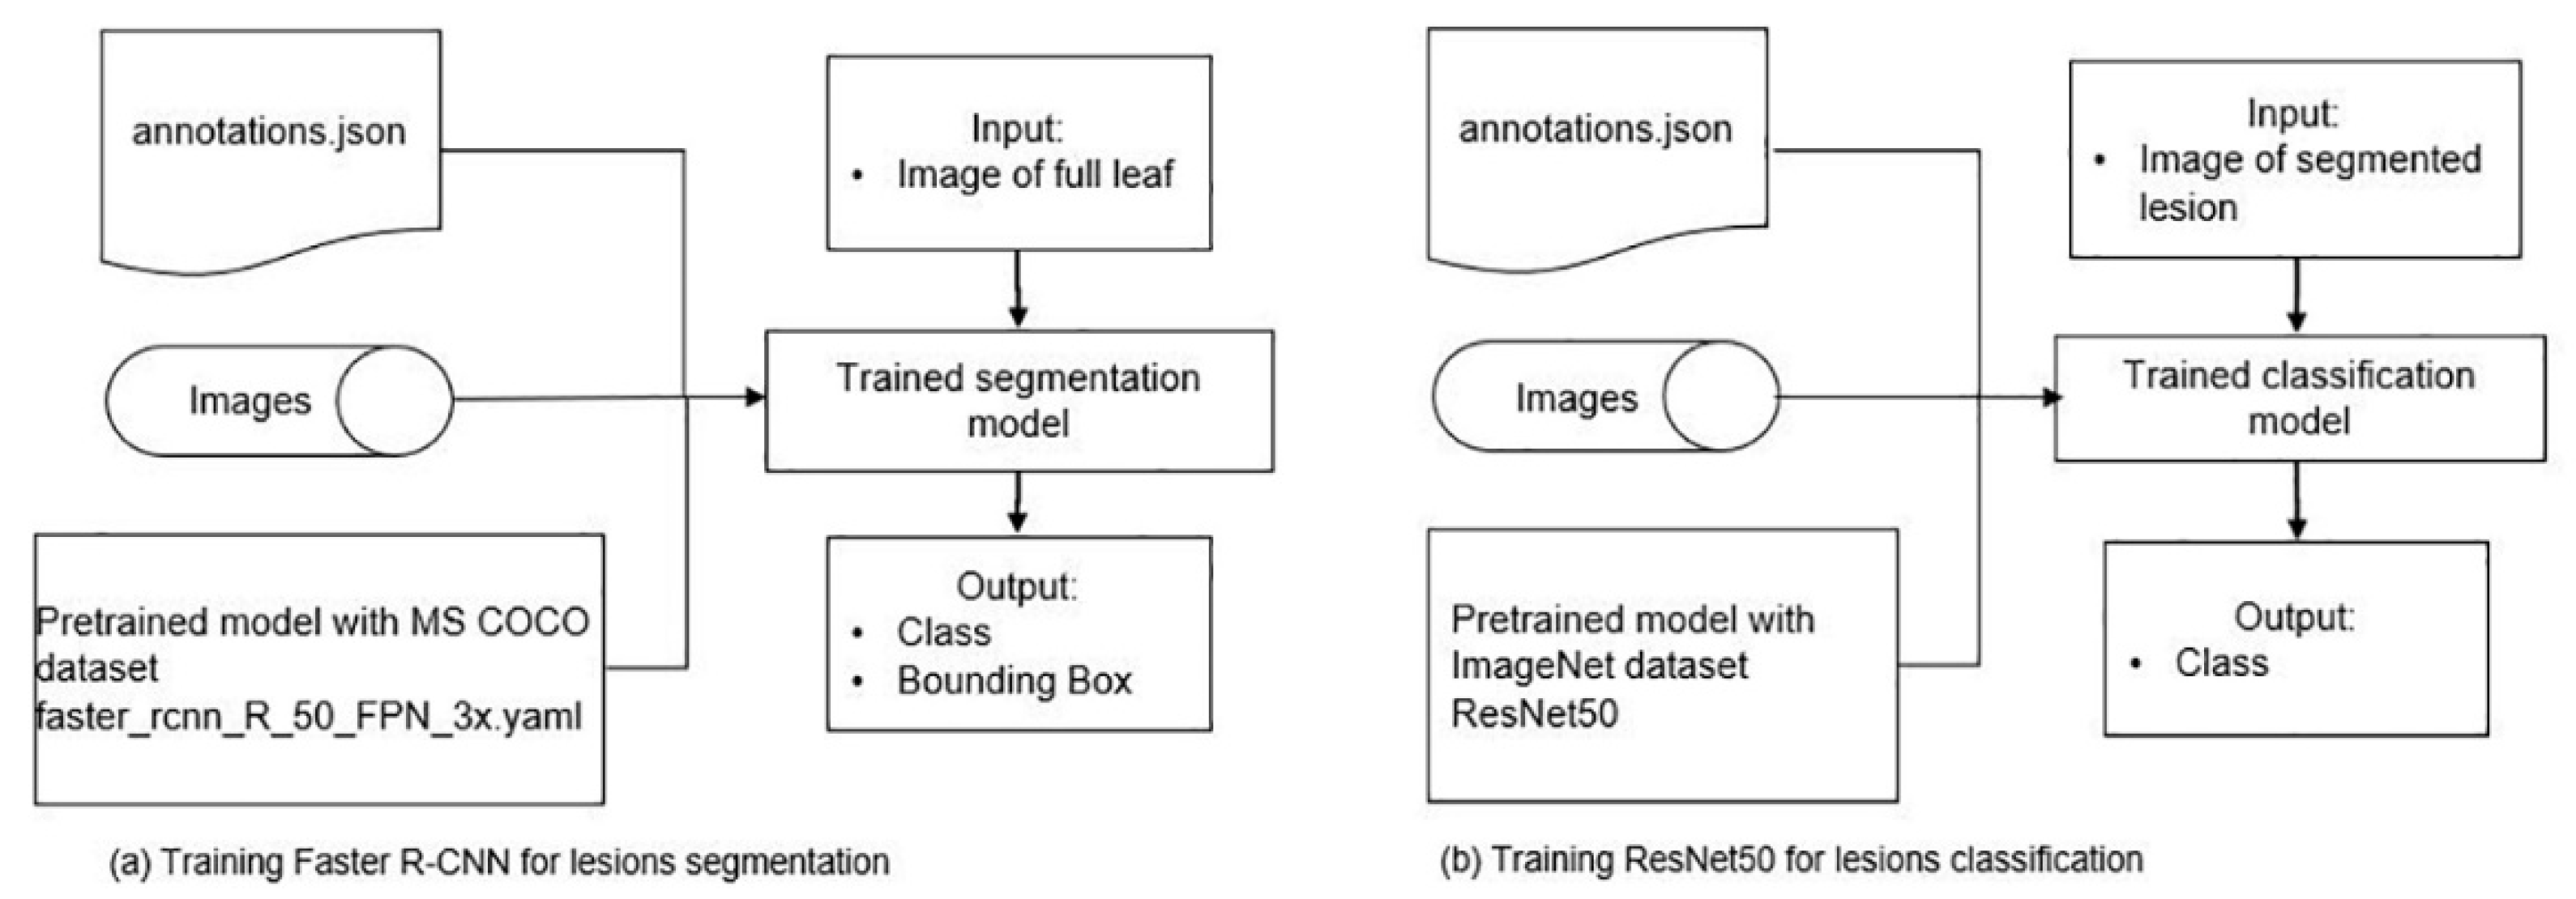
2.3. Proposed System for Automatic Segmentation and Classification

The system proposed to perform segmentation and classification is composed of a segmentation network represented by Faster R-CNN or Mask R-CNN, followed by a classification network. ResNet was selected to perform the classification step. Figure 2 presents the flow of segmentation and classification algorithms, and Figure 3 shows a graphical representation of this system. As the classification output of this system, we took the disease with the highest number of occurrences of lesions.
In real life, a plant can be infested with several pathogens. If the lesions of the same leaf have a different classification, we might think that the plant shows the symptoms of several diseases. In the absence of an agronomist or laboratory methods, it is difficult to prove the presence of multiple diseases, so this situation is not covered by our system.

2.3.1. Faster R-CNN and Mask R-CNN Models Used for Segmentation

The Faster R-CNN segmentation model [19] uses a new method to generate region proposals, called the Region Proposal Network (RPN). The RPN is a neural network that proposes multiple objects available within a given image. Faster R-CNN has two outputs for each detected object: a class label and a bounding box.
Mask R-CNN [20] is an extension of Faster R-CNN, also offering an object mask, in addition to a frame and classification. Mask R-CNN is composed of two steps. In the first step, the network proposes areas of the input image where there could be objects of interest. In the second step, it refines the bounding box, carries out the object classification, and generates a mask of pixels of the object. In our study, the lesion bounding box would have been enough since the lesion mask was not used, but we decided to execute segmentation experiments with both Faster R-CNN and Mask R-CNN to compare their performance.
When it comes to the convolutional backbone architecture used for feature extraction, Mask R-CNN studies have evaluated different architectures: ResNet [21], ResNeXt [22] with both 50 and 101 layers, and a more recent backbone called the Feature Pyramid Network (FPN) [23]. In this study, the Faster R-CNN architecture was used for the network head, to which we added a fully convolutional mask prediction branch. The implementation of both Faster R-CNN and Mask-R CNN models may be carried out in PyTorch, Detectron2 [24], and other open-source tools. In PyTorch, there is a Mask R-CNN model with a ResNet-50-FPN backbone and a Faster R-CNN model with both ResNet-50-FPN and MobileNetV3-Large FPN backbone, while in Detectron2, more versions are available. As part of Detectron2, the Facebook AI Research team also released a model zoo, including pre-trained models for object detection, semantic segmentation, and keypoint detection. Given the baseline results presented in model zoo, for the experiments executed in this study, the R50-FPN model was selected and initiated with weights from a model pretrained on the MS-COCO dataset.
Fine-tuning the Mask R-CNN network is an elaborate activity. In our study, we used the standard configuration present in Detecrton2. In a subsequent study, we aim to achieve an increase in performance by fine-tuning the network parameters.

2.3.2. ResNet Model Used for Classification

A convolutional neural network (CNN) was considered for classification due to the promising performance results from previous studies. A ResNet-type network was used, with two architectures, ResNet50 and ResNet152. This type of network, created in 2015 by researchers at Microsoft Research, was chosen due to the reduced time required for training, the low storage space of learned parameters, and the high accuracy. Transfer learning was used for experiments and models were initiated with weights from a model pretrained on ImageNet. A CNN network can be trained from scratch, or we can use the transfer learning. With transfer learning, we take the parameters (weights and biases) of a learned problem of a similar nature, and we use them on a new dataset. Transfer learning is used for experiments where dataset does not have enough data to train a full model from scratch.
Tests were also conducted using EfficientNet, but for our dataset, ResNet offered slightly superior accuracy.
For classification based on field images, selected CNN models, ResNet50 and ResNet152, were trained and tested using two versions of the dataset presented in Table 1, DS1-V1 without healthy leaves and DS1-V2 with healthy leaves. We wanted to study the impact that the introduction of the healthy leaf class had on the results. Training was done with categorical cross-entropy loss, a Stochastic Gradient Descent (SDG) optimizer, a learning rate of 0.001, batch sizes of 30 for DS1-V1 and 45 for DS1-V2, and six epochs.
For disease classification based on images with lesions, starting from the set of images presented in Table 1, using manual annotation, we obtained the dataset presented in Table 2, in which we had images of the segmented lesions or diseased areas containing a group of lesions. To build the dataset, we used a functionality available in pycocotools to load, parse, visualize, and extract segmented regions. We extracted 600 diseased areas per class. Each bounding box representing a lesion, or an area affected by disease was extracted into an image that was resized to 224 × 224.
The ResNet50 and ResNet152 models were trained using two versions of the dataset, without healthy green areas of leaves (DS2-V1) and with healthy green areas of leaves (DS2-V2). Training was done with categorical cross-entropy loss, a Stochastic Gradient Descent (SDG) optimizer, a learning rate of 0.001, and batch sizes of 45 for DS2-V1 and 75 for DS2-V2.

3. Results

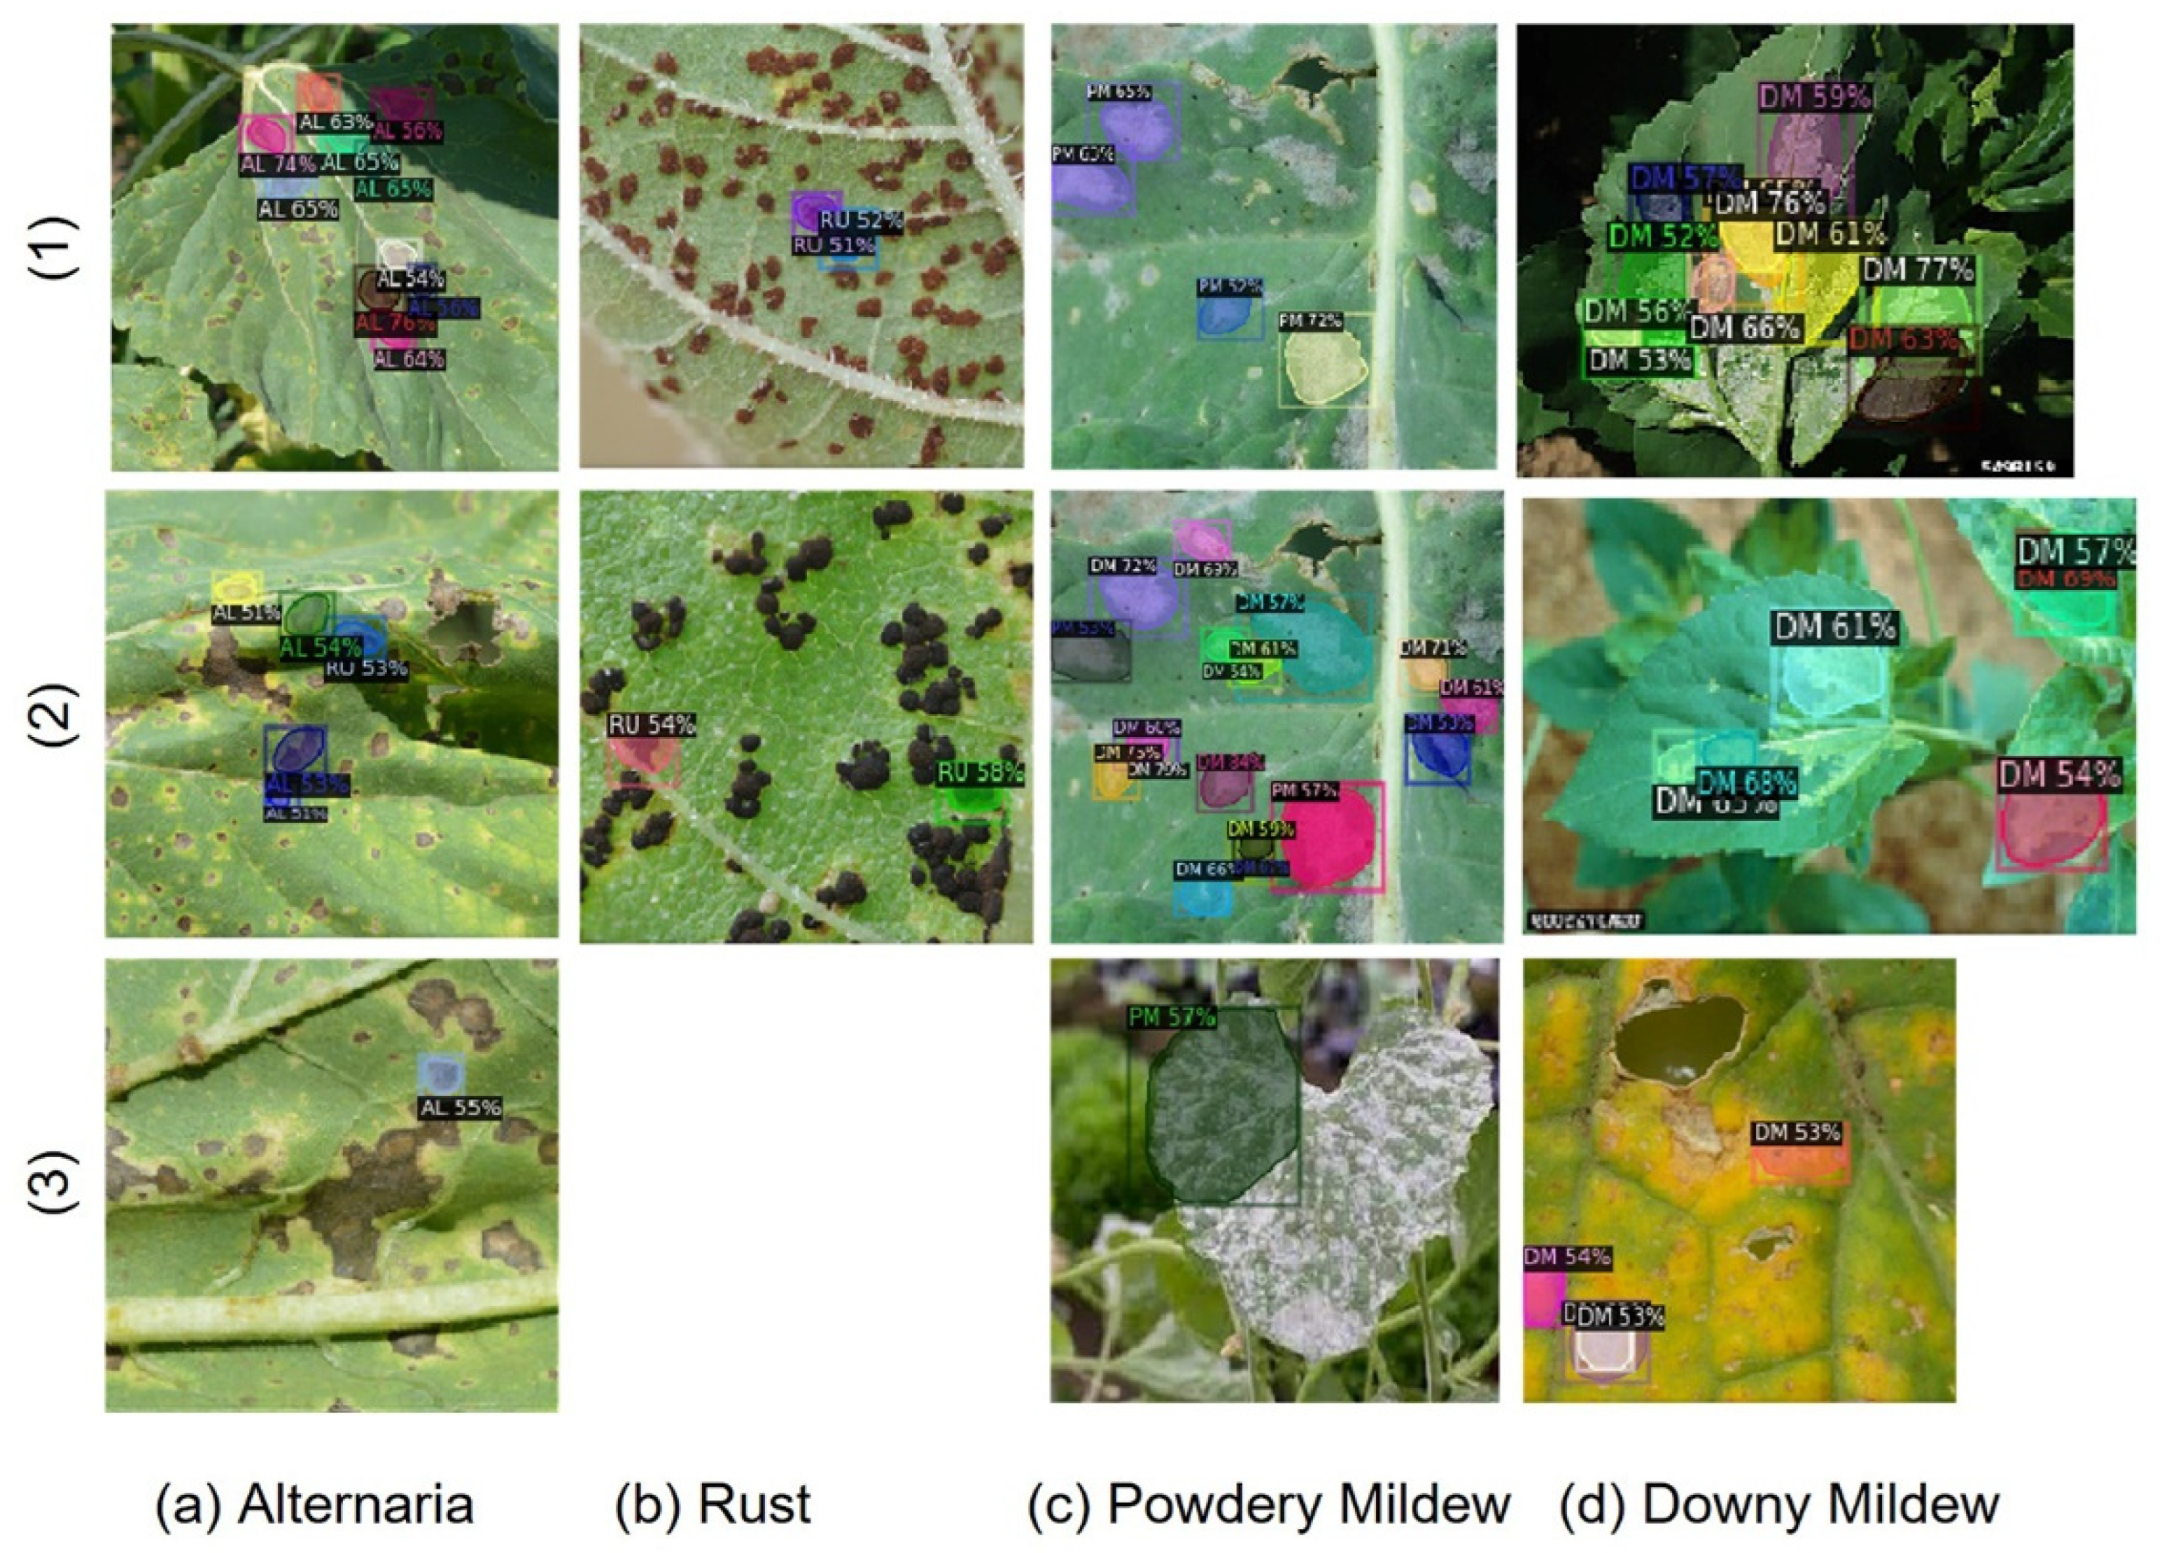
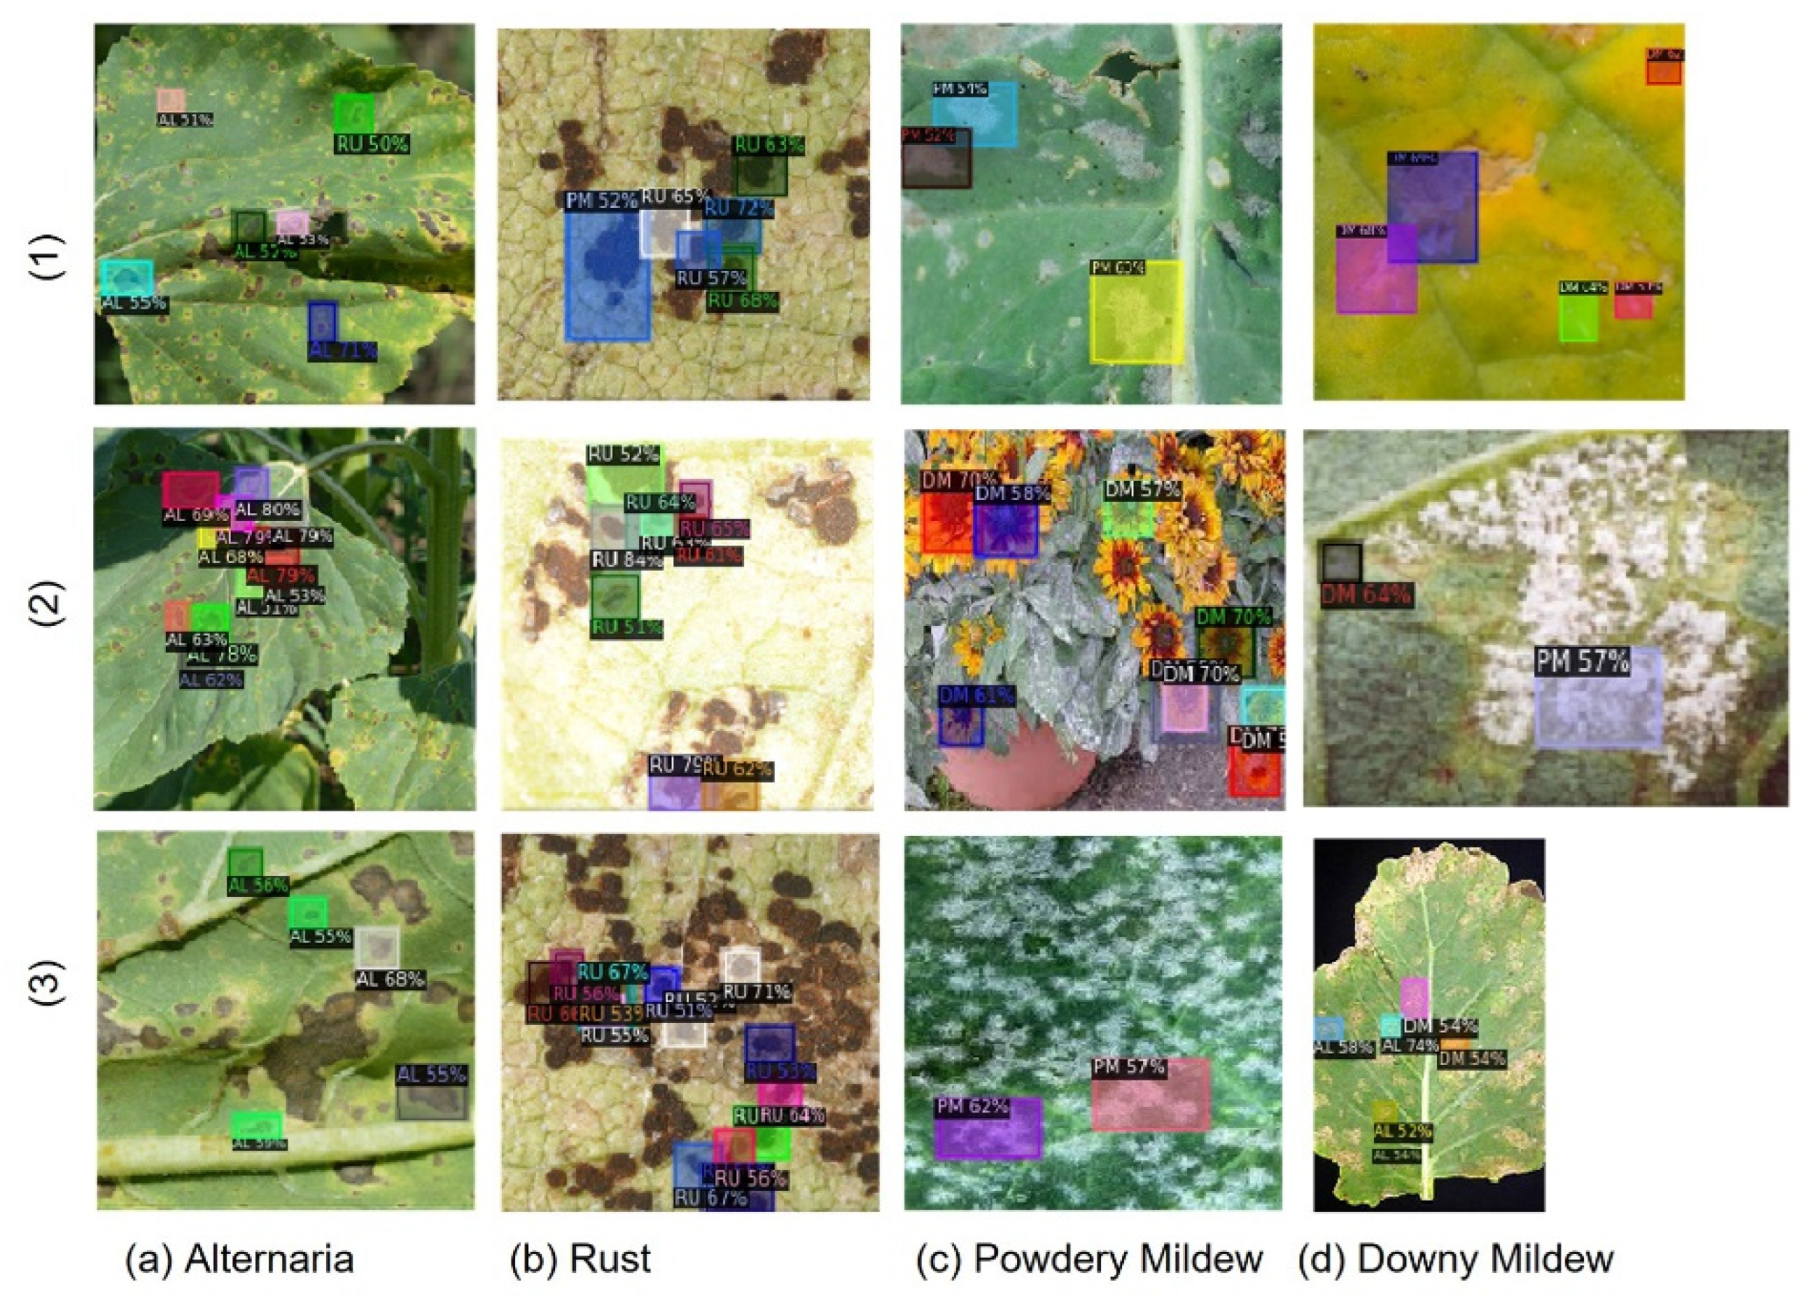
3.1. Segmentation of Lesions with Mask R-CNN and Faster R-CNN

Mask R-CNN and Faster R-CNN networks were trained to segment and classify the four foliar diseases. The results obtained for both networks showed that we had images in which the framing of the lesions or diseased areas was correct, as well as images in which segmentation was not performed. We also noted that we had correct and incorrect classifications of lesions.
Figure 4 presents images with bounding boxes from Mask R-CNN, and Figure 5 presents images where no specific lesion was selected when segmentation was carried out with Mask R-CNN.
In images from Figure 4(a1,a3), all segmented lesions were correctly classified as Alternaria. In Figure 4(a2), most lesions were classified correctly, except for one, which was classified as rust. Rust images from Figure 4(b1,b2) were correctly classified, but in the case of rust, we can observe that a high number of lesions were not segmented. For downy mildew, the segmentation and classification were done correctly.
Powdery mildew images from Figure 4(c1,c2) are segmentations of the same image. In Figure 4(c1), network was trained with 600 iterations, while in Figure 4(c2), network was trained with 900 iterations. We can note that in Figure 4(c1), fewer lesions are segmented compared to Figure 4(c2), but the classification is done correctly, while in Figure 4(c2), the classification is wrong.
Figure 5 contains images in which the lesions could not be segmented, although we tested using 300, 600, and 900 training iterations.
Segmentation of the lesions was also tested with the Faster R-CNN network. Figure 6 presents images with bounding boxes for Faster R-CNN, and Figure 7 presents images where no specific lesion was selected when segmentation was done with Faster R-CNN. For the images in which the segmentation of the lesions could not be done, we can note that the disease is in an advanced stage, or the leaves are wilted.

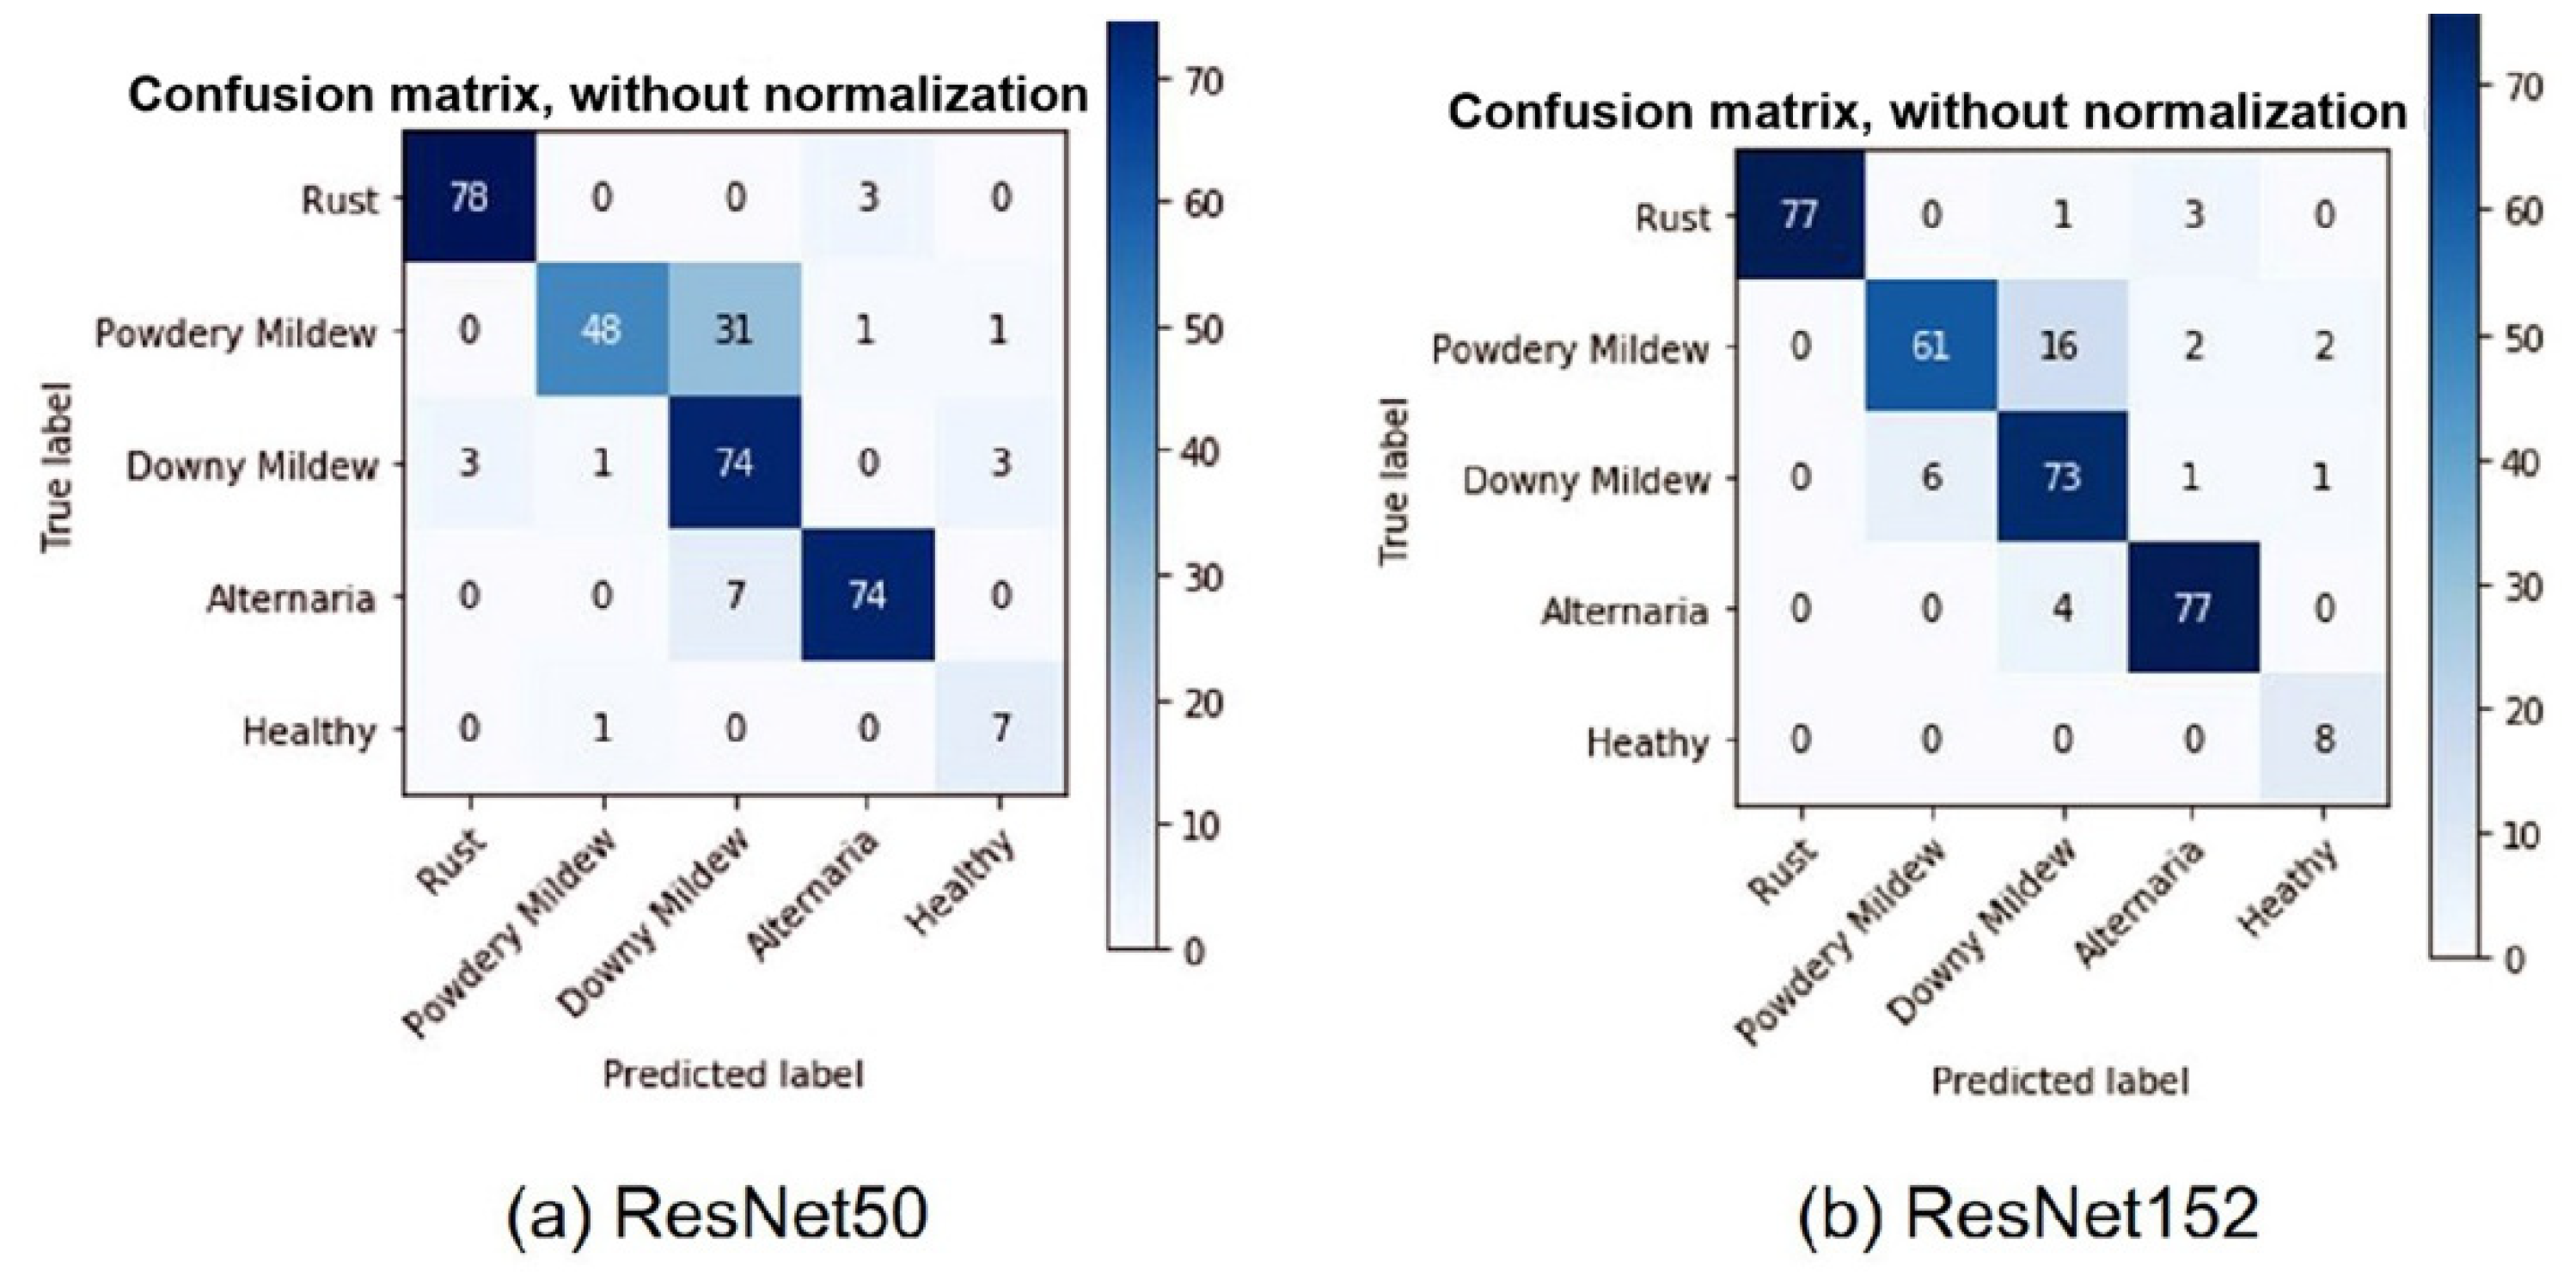
3.2. Disease Classification Based on Field Images and CNN

ResNet50 and ResNet152 were trained using the dataset from Table 1, with images containing leaves and background elements. The experiments were carried out initially without including the class of healthy leaves, and then adding this class as well. We wanted to study the impact that the healthy leaf class has on accuracy. The training metrics are presented in Table 3. A confusion matrix was created for each model and dataset combination. The results are presented in Figure 8 and Figure 9.
The classification results for the test dataset are presented in Table 4.
The introduction of the healthy class to DS1-V2 led to a decrease in accuracy for both types of networks, but more predominantly for ResNet50. The decrease in classification accuracy can be observed in the case of powdery mildew, where the number of images misclassified as downy mildew increased. Figure 10 presents images misclassified when the models were trained with DS1-V2.
Images from Figure 10a,b represent multiple leaves and an advanced stage of the disease. Figure 10d is an example where downy mildew is confused with Alternaria, while in Figure 10c, powdery mildew is mistaken for downy mildew. The healthy leaf in Figure 10e, meanwhile, was confused with powdery mildew.

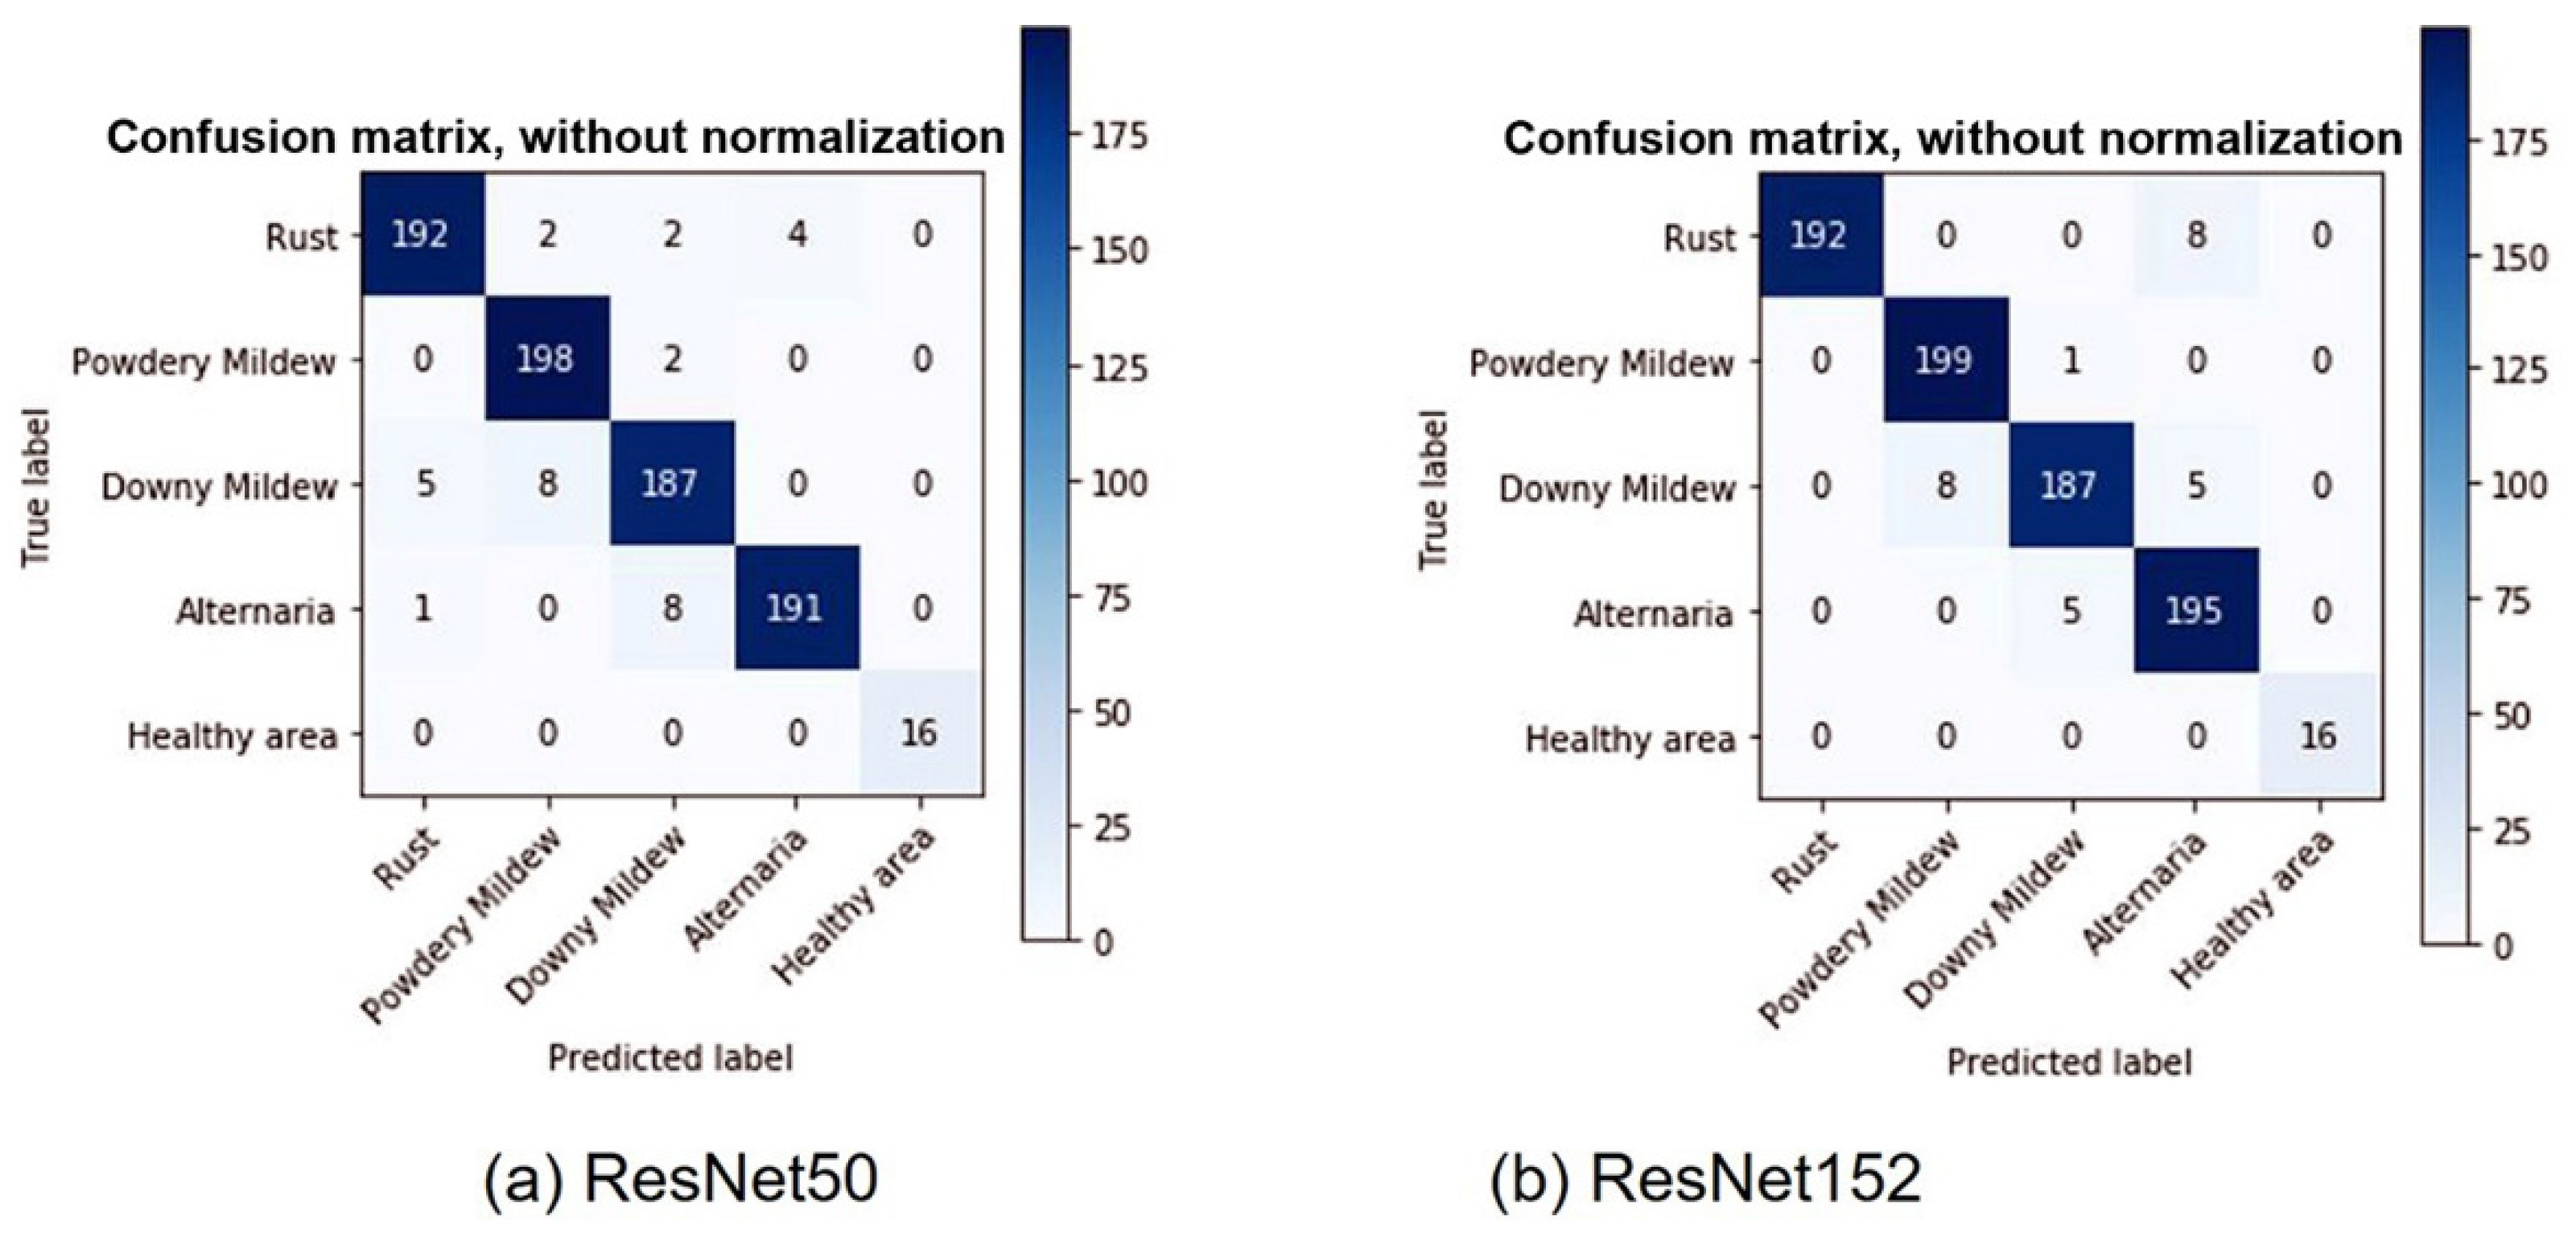
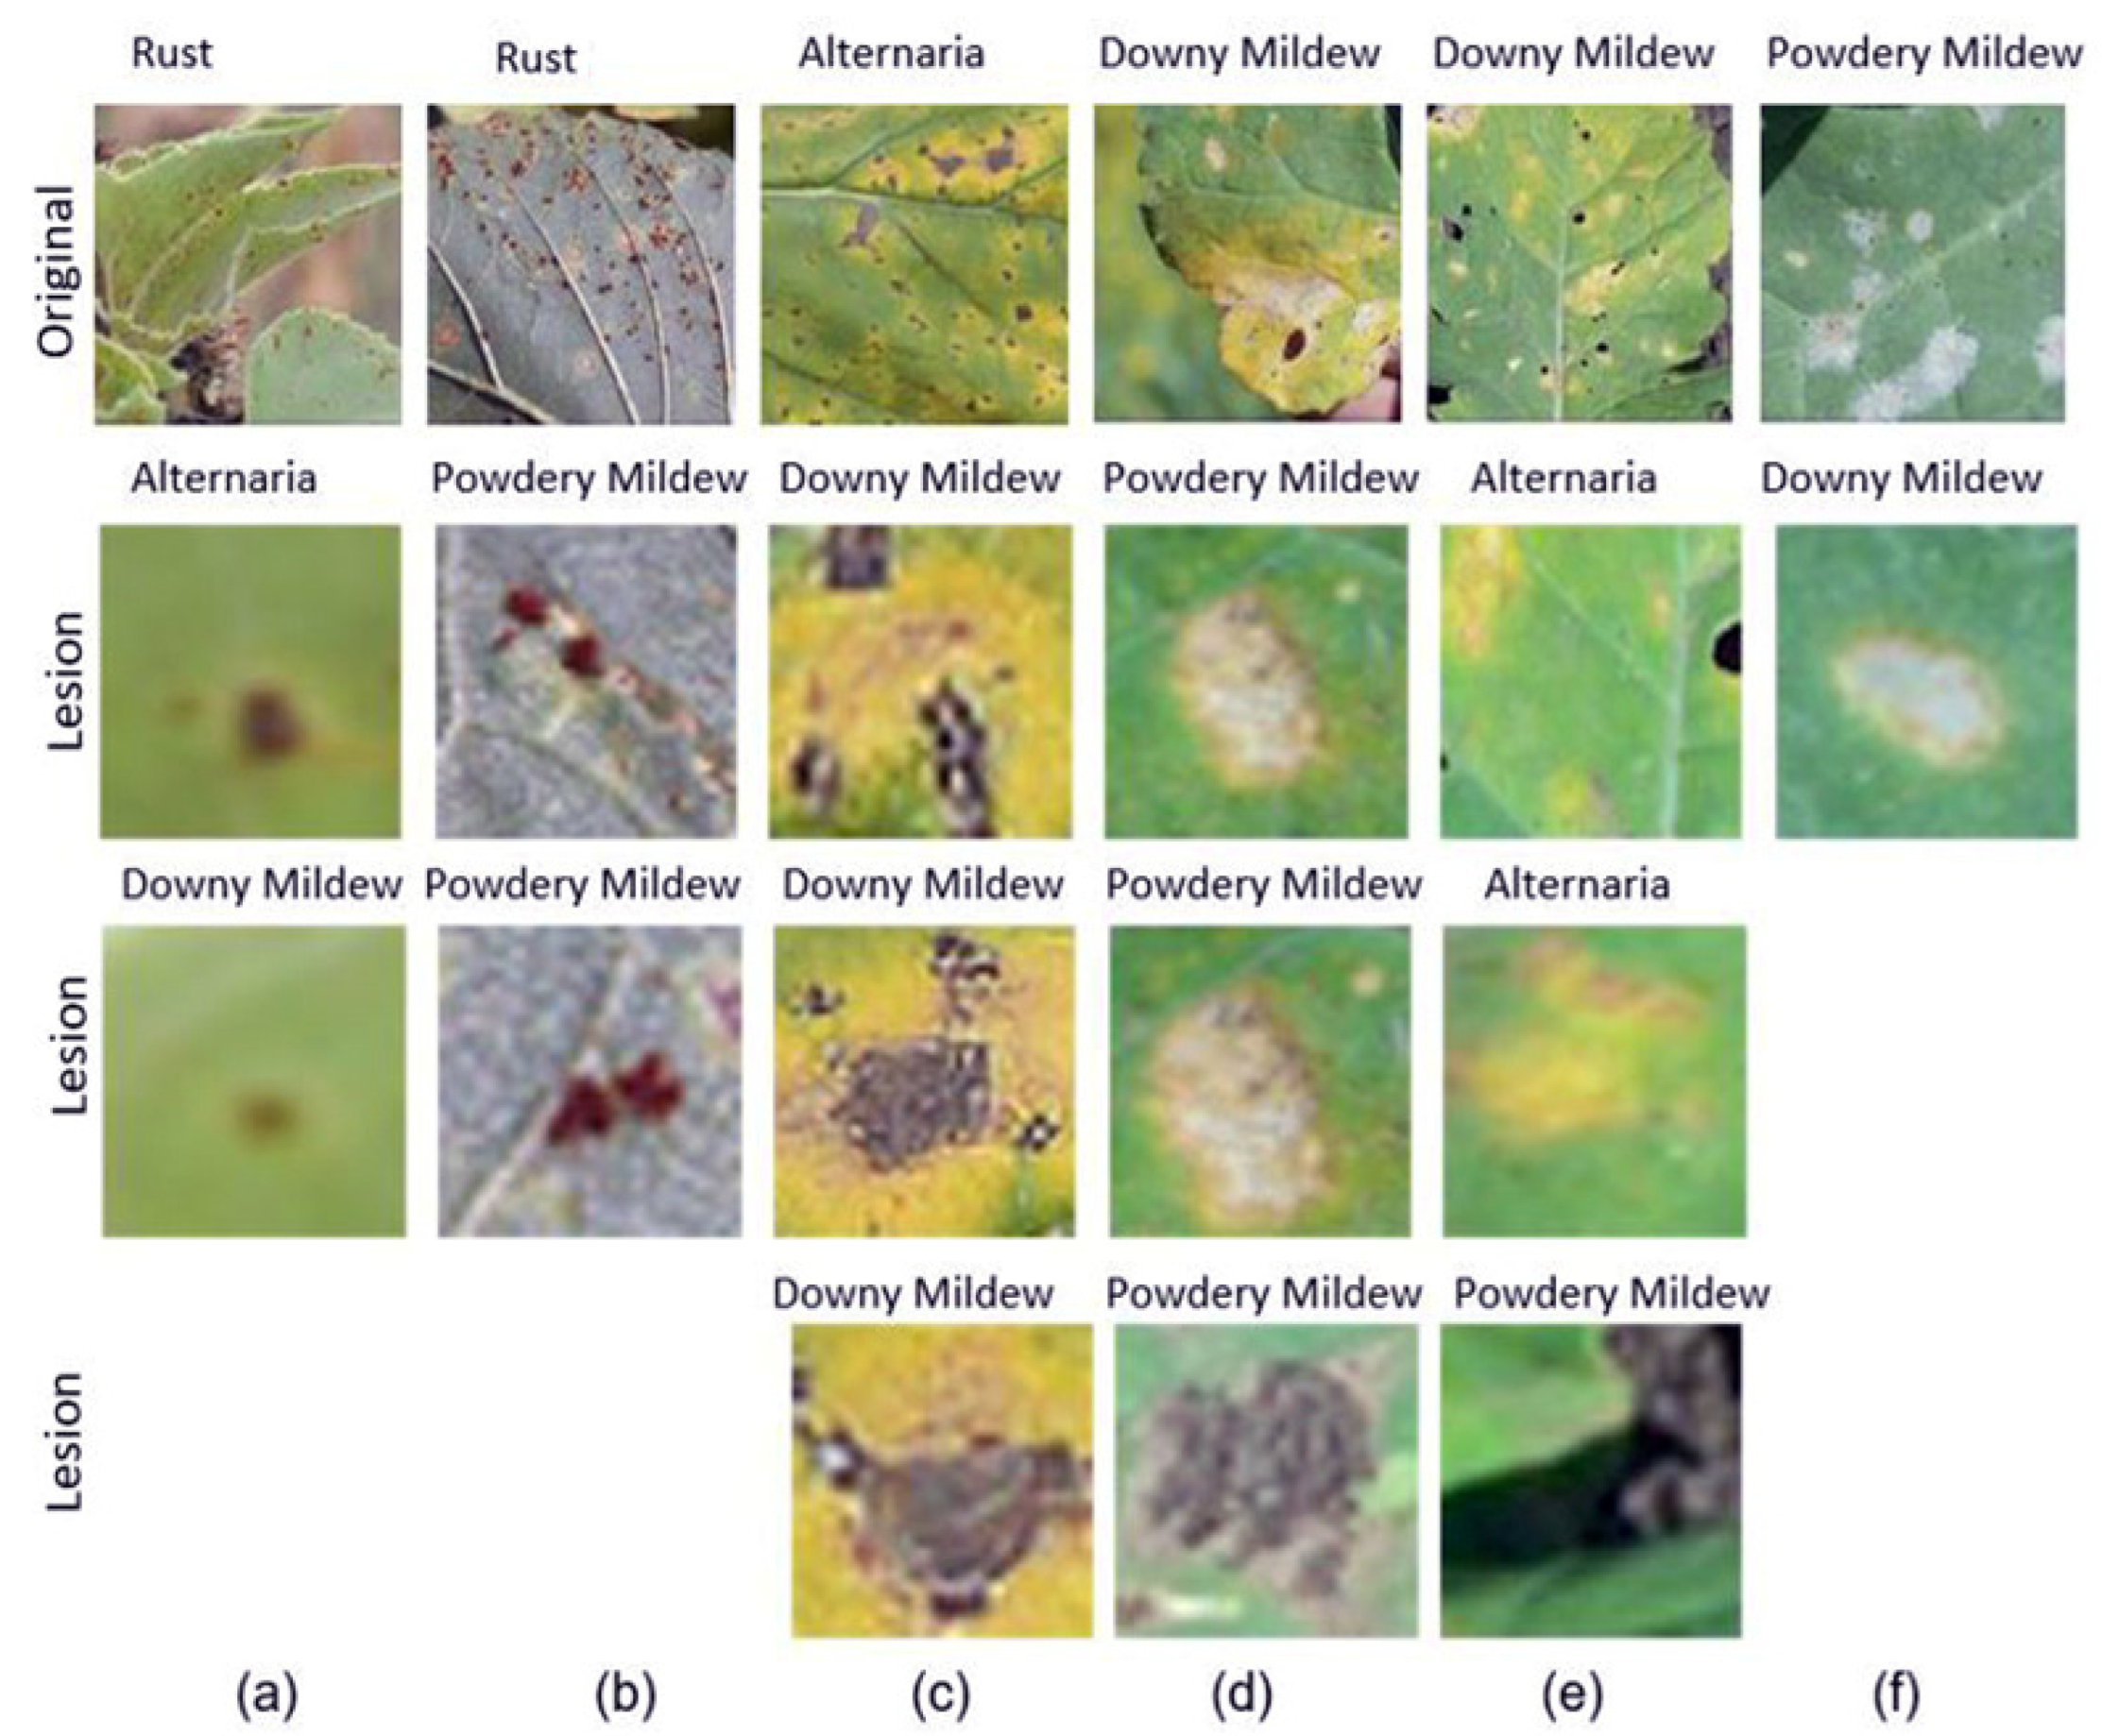
3.3. Disease Classification Based on Images with Lesions and CNN

Starting from the dataset presented in Table 2, ResNet50 and ResNet152 were trained based on the dataset with lesions and diseased areas, using the dataset without the class of healthy areas and the complete dataset with healthy areas. The training metrics are presented in Table 5. A confusion matrix was created for each model and dataset, as shown in Figure 11 and Figure 12.
The classification results for the test dataset are presented in Table 6.
If we compare the results from Table 4 with Table 6, when training was carried out on images containing lesions, the accuracy was higher compared to results obtained when training was carried out on unprocessed field images. All images of healthy areas were correctly classified as healthy, and no image of a segmented lesion was misclassified as healthy. We can note an increase in the accuracy after introducing the healthy leaf area class, especially for downy mildew. Figure 13 presents images misclassified during testing.
Rust original image from Figure 13a, as it was taken from a distance, did not allow for the identification of the disease, and diseased spots were mistakenly classified as either Alternaria or downy mildew due to the yellow halo. Areas of Alternaria, Figure 13c, were surprisingly classified as downy mildew, with the reason for the misclassification unclear. Most likely, the yellow color predominant around the brown spots influenced the classification.
In the case of downy mildew images, Figure 13d,e, we can observe spots of whitish color wrongly classified as powdery mildew, while spots with a strong yellow halo were misclassified as Alternaria. The downy mildew images captured the disease in an advanced stage of development, when leaves already had black holes. As mentioned previously, classification in the case of leaves with an advanced degree of disease cannot be carried out accurately.
The introduction of the class of healthy leaf areas improved the accuracy, but some images were still misclassified. Certain lesions caused by downy mildew were misclassified as powdery mildew and vice versa. The main reason for this was that in the dataset, there were many images of downy mildew in the stage of advanced disease and withered leaves.

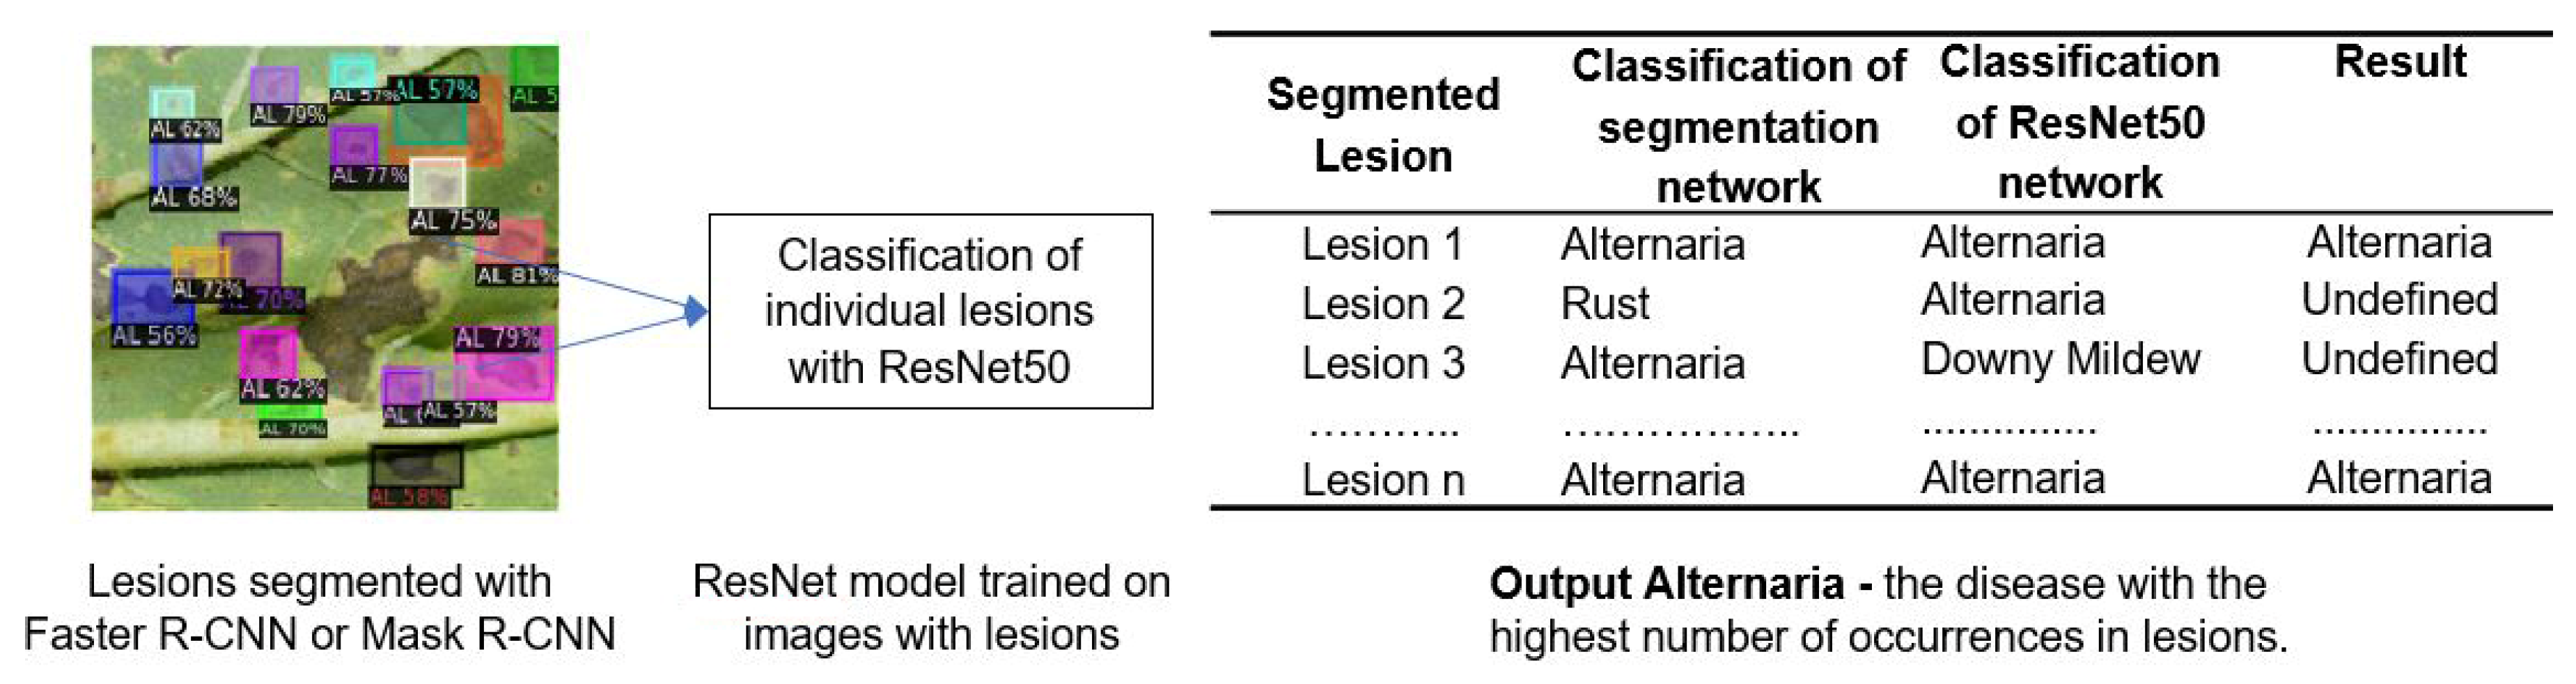
3.4. Segmentation and Classification System

To conclude this study, we made an end-to-end test of our disease detection system. We tested the segmentation using Faster R-CNN and Mask R-CNN, followed by classification using ResNet50. The ResNet50 network was trained based on the dataset presented in Table 2, with manually annotated lesions and diseased areas. As the classification output of this system, we took the disease with the highest number of occurrences of lesions.
The dataset presented in Table 1, with full leaf images, was used for this test, where 81 images from each disease were segmented and then classified. Images for which segmentation could not be performed were considered “non-classifiable”. Results are presented in Table 7 for Faster R-CNN segmentation and in Table 8 for Mask R-CNN.
Accuracy was calculated as the number of correctly classified images, where the images not segmented were not considered. This disease identification system, composed of the disease segmentation network, followed by disease classification, allowed us to avoid erroneous classification by considering the unsegmented images as unclassifiable. The system of using Mask R-CNN and classification produced better results compared to Faster R-CNN and classification.
From the experimental results, it can be seen that some diseases have not been well distinguished and discriminated. This is mainly the case of powdery mildew and downy mildew. We can conclude that this system presents robust results for certain types of diseases, in which the lesions are well outlined, and for other types of diseases, a different approach may be required. Testing different classification methods for certain diseases and combining the types of networks that offer the best performance in each case, will be the subject of further study.

4. Discussion

This study, conducted for foliar diseases of plants, presents a method of automatic segmentation of diseased areas, followed by precise detection of the disease. Although the study was limited to four foliar diseases found in sunflower, methods used can be applied to other plants.
Of the four foliar diseases, rust and Alternaria are manifested by well-defined areas of the lesions produced, while downy mildew and powdery mildew can extend over the entire leaf. The use of these diseases in our study allowed us to evaluate the behavior of the system for both types of disease manifestations.
For segmentation, the proposed system was evaluated with Faster R-CNN and Mask R-CNN and the usage of Mask R-CNN provided overall better results. A lower performance in the segmentation of diseased areas was observed for powdery mildew, where disease is spread across the leaf, without distinct lesions.
Classification of diseases was tested with ResNet50 and ResNet152, using a dataset with images taken from fields and a dataset with diseased areas. It is observed that a classification made with segmented lesions provides a significant better accuracy compared to the classification made with images containing full leaves.
We also studied the impact of introducing a healthy class on the classification results. It is observed that the introduction of the healthy class had a positive effect on accuracy in case of classification done with segmented lesions and a negative impact when classification was done with full image.
The diversity of nature continues to pose a challenge for researchers in the field of artificial intelligence. The main limitation in the study of plant diseases is given by the lack of a set of images taken from different geographical areas, containing different stages of the disease, manifestations on the upper and lower sides, as well as annotations on the date of capture and geographical coordinates. A first future objective would be to build this new set of data, which would allow us to continue our research using more crops and more diseases.
The continuing development of classification algorithms may require using both sides of the leaf in classification. Symptoms present on both sides could facilitate the differentiation of diseases where there is otherwise high confusion. Introducing information collected through sensors regarding precipitation or soil parameters could also contribute to improving the classification algorithms. Creating a system composed of several types of networks could also allow us to achieve good performance for all types of diseases.

Author Contributions

Conceptualization, R.G.D. and C.D.; methodology, R.G.D.; software, R.G.D.; validation, R.G.D. and C.D.; formal analysis, R.G.D.; investigation, R.G.D.; resources, R.G.D.; data curation, R.G.D.; writing—original draft preparation, R.G.D.; writing—review and editing, C.D. and R.G.D. All authors have read and agreed to the published version of the manuscript.

Funding

This research received no external funding.

Institutional Review Board Statement

Not applicable.

Informed Consent Statement

Not applicable.

Data Availability Statement

Not applicable.

Conflicts of Interest

The authors declare no conflict of interest.

References

  1. Sadiku, M.N.; Omotoso, A.A.; Musa, S.M. Green Agriculture. Int. J. Trend Sci. Res. Dev. 2020, 4, 69–70. [Google Scholar]
  2. Radoglou-Grammatikis, P.; Sarigiannidis, P.; Lagkas, T.; Moscholios, I. A compilation of UAV applications for Precision Agriculture. Comput. Netw. 2020, 172, 107148. [Google Scholar] [CrossRef]
  3. Dawod, R.G.; Dobre, C. Resnet interpretation methods applied to the classification of Foliar Diseases in sunflower. J. Agric. Food Res. 2022, 9, 100323. [Google Scholar] [CrossRef]
  4. Barbedo, J.G.A. Plant disease identification from individual lesions and spots using deep learning. Biosyst. Eng. 2019, 180, 96–107. [Google Scholar] [CrossRef]
  5. Sharma, P.; Berwal, Y.P.; Ghai, W. Performance analysis of deep learning CNN models for disease detection in plants using image segmentation. Inf. Processing Agric. 2020, 7, 566–574. [Google Scholar] [CrossRef]
  6. Chan, T.; Vese, L. An active contour model without edges. In Scale-Space Theories in Computer Vision; Springer: Berlin/Heidelberg, Germany, 1999; pp. 141–151. [Google Scholar]
  7. Sezgin, M.; Sankur, B. Survey over image thresholding techniques and Quantitative Performance Evaluation. J. Electron. Imaging 2004, 13, 146. [Google Scholar]
  8. Storey, G.; Meng, Q.; Li, B. Leaf disease segmentation and detection in apple orchards for precise smart spraying in sustainable agriculture. Sustainability 2022, 14, 1458. [Google Scholar] [CrossRef]
  9. Lück, S.; Strickert, M.; Lorbeer, M.; Melchert, F.; Backhaus, A.; Kilias, D.; Seiffert, U.; Douchkov, D. “Macrobot”: An automated segmentation-based system for powdery mildew disease quantification. Plant Phenomics 2020, 2020, 839856. [Google Scholar] [CrossRef] [PubMed]
  10. Quoc, T.T.; Linh, T.T.; Minh, T.N. Comparing U-Net convolutional network with mask R-CNN in Agricultural Area segmentation on satellite images. In Proceedings of the 2020 7th NAFOSTED Conference on Information and Computer Science (NICS), Hochiminh, Vietnam, 26–27 November 2020. [Google Scholar]
  11. Tassis, L.M.; Tozzi de Souza, J.E.; Krohling, R.A. A deep learning approach combining instance and semantic segmentation to identify diseases and pests of coffee leaves from in-field images. Comput. Electron. Agric. 2021, 186, 106191. [Google Scholar] [CrossRef]
  12. Atila, Ü.; Uçar, M.; Akyol, K.; Uçar, E. Plant Leaf disease classification using EfficientNet Deep Learning Model. Ecol. Inform. 2021, 61, 101182. [Google Scholar] [CrossRef]
  13. Li, L.; Zhang, S.; Wang, B. Plant disease detection and classification by Deep Learning—A Review. IEEE Access 2021, 9, 56683–56698. [Google Scholar] [CrossRef]
  14. Khalifa, N.E.; Loey, M.; Mirjalili, S. A comprehensive survey of recent trends in Deep Learning for digital images augmentation. Artif. Intell. Rev. 2021, 55, 2351–2377. [Google Scholar] [CrossRef] [PubMed]
  15. Lu, Y.; Chen, D.; Olaniyi, E.; Huang, Y. Generative Adversarial Networks (gans) for image augmentation in agriculture: A systematic review. Comput. Electron. Agric. 2022, 200, 107208. [Google Scholar] [CrossRef]
  16. Lin, T.-Y.; Maire, M.; Belongie, S.; Hays, J.; Perona, P.; Ramanan, D.; Dollár, P.; Zitnick, C.L. Microsoft Coco: Common Objects in Context. Computer Vision–ECCV 2014. In Proceedings of the 13th European Conference, Zurich, Switzerland, 6–12 September 2014; pp. 740–755. [Google Scholar]
  17. Dutta, A.; Zisserman, A. The VIA annotation software for images, audio and video. In Proceedings of the 27th ACM International Conference on Multimedia, Nice, France, 21–25 October 2019. [Google Scholar]
  18. Make Sense. Available online: http://www.makesense.ai/ (accessed on 29 August 2021).
  19. Ren, S.; He, K.; Girshick, R.; Sun, J. Faster R-CNN: Towards real-time object detection with region proposal networks. IEEE Trans. Pattern Anal. Mach. Intell. 2017, 39, 1137–1149. [Google Scholar] [CrossRef] [PubMed] [Green Version]
  20. He, K.; Gkioxari, G.; Dollar, P.; Girshick, R. Mask R-CNN. In Proceedings of the 2017 IEEE International Conference on Computer Vision (ICCV), Venice, Italy, 22 October 2017. [Google Scholar]
  21. He, K.; Zhang, X.; Ren, S.; Sun, J. Deep residual learning for image recognition. In Proceedings of the 2016 IEEE Conference on Computer Vision and Pattern Recognition (CVPR), Las Vegas, NV, USA, 27–30 June 2016. [Google Scholar]
  22. Xie, S.; Girshick, R.; Dollar, P.; Tu, Z.; He, K. Aggregated residual transformations for deep neural networks. In Proceedings of the 2017 IEEE Conference on Computer Vision and Pattern Recognition (CVPR), Honolulu, HI, USA, 21–26 July 2017. [Google Scholar]
  23. Lin, T.-Y.; Dollar, P.; Girshick, R.; He, K.; Hariharan, B.; Belongie, S. Feature Pyramid Networks for Object Detection. In Proceedings of the 2017 IEEE Conference on Computer Vision and Pattern Recognition (CVPR), Honolulu, HI, USA, 21–26 July 2017. [Google Scholar]
  24. Wu, Y.; Kirillov, A.; Massa, F.; Lo, W.Y.; Girshick, R. Facebookresearch/Detectron2: Detectron2 Is a Platform for Object Detection, Segmentation, and Other Visual Recognition Tasks. Available online: https://github.com/facebookresearch/detectron2 (accessed on 1 August 2021).
Figure 1. Annotated images and lesions extracted.
Sustainability 14 11312 g001
Figure 2. Flow of segmentation and classification algorithms.
Sustainability 14 11312 g002
Figure 3. Segmentation and classification system.
Sustainability 14 11312 g003
Figure 4. Images with lesions segmented by Mask R-CNN.
Sustainability 14 11312 g004
Figure 5. Images with lesions not segmented by Mask R-CNN.
Sustainability 14 11312 g005
Figure 6. Images with lesions segmented by Faster R-CNN.
Sustainability 14 11312 g006
Figure 7. Images with lesions not segmented by Faster R-CNN.
Sustainability 14 11312 g007
Figure 8. Confusion matrix for DS1-V1.
Sustainability 14 11312 g008
Figure 9. Confusion matrix for DS1-V2.
Sustainability 14 11312 g009
Figure 10. Images that were misclassified.
Sustainability 14 11312 g010
Figure 11. Confusion matrix for classification based on lesions, without healthy areas.
Sustainability 14 11312 g011
Figure 12. Confusion matrix for classification based on lesions, including healthy areas.
Sustainability 14 11312 g012
Figure 13. Lesions misclassified: (a) Rust original and lesions; (b) Rust original and lesions; (c) Alternaria original and lesions; (d) Downy Mildew original and lesions; (e) Downy Mildew original and lesions; (f) Powdery Mildew original and lesions.
Sustainability 14 11312 g013
Table 1. Dataset with full leaf images.
HostClassNo. of Images
for Training and Validation
No. of Images
for Testing
SunflowerRust30081
SunflowerPowdery mildew30081
SunflowerDowny mildew30081
SunflowerAlternaria leaf blight30081
SunflowerHealthy leaves3008
Table 2. Dataset with lesions and areas affected by the disease.
HostClassNo. of Images
for Training and Validation
No. of Images
for Testing
SunflowerRust600200
SunflowerPowdery mildew600200
SunflowerDowny mildew600200
SunflowerAlternaria leaf blight600200
SunflowerHealthy leaves60016
Table 3. Training results.
CNNImage SizeEpochsTrain. LossValid. LossTraining
Accuracy
Valid.
Accuracy
ResNet50 DS1-V1224 × 22460.0560.3030.9910.863
ResNet152 DS1-V1224 × 22460.0650.2460.9840.92
ResNet50 DS1-V2224 × 22460.0690.3870.9870.858
ResNet152 DS1-V2224 × 22460.0490.3070.9930.903
Table 4. Classification results for test dataset with images containing leaves.
ML Model/DatasetAccuracy
ResNet50/DS1-V192.59%
ResNet152/DS1-V191.97%
ResNet50/DS1-V284.63%
ResNet152/DS1-V289.15%
Table 5. Training results.
CNNImage SizeEpochsTrain. LossValid. LossAccuracyValid.
Accuracy
ResNet50 DS2-V1224 × 22460.0250.0910.9960.967
ResNet152 DS2-V1224 × 22460.0140.0900.9980.969
ResNet50 DS2-V2224 × 22460.0150.0870.9990.969
ResNet152 DS2-V2224 × 22460.0120.07410.98
Table 6. Classification results for test dataset based on lesions.
ML Model/DatasetAccuracy
ResNet50/DS2-V195.12%
ResNet152/DS2-V193.25%
ResNet50/DS2-V296.0%
ResNet152/DS2-V296.6%
Table 7. Results of segmentation-classification system for Faster R-CNN.
HostClassTest ImagesUnclassifiableClassified CorrectlyClassified
Incorrectly
Accuracy per Disease
SunflowerRust81369988%
SunflowerPowdery mildew8134153231%
SunflowerDowny mildew8120451673%
SunflowerAlternaria leaf blight81278196%
Table 8. Results of segmentation-classification system for Mask R-CNN.
HostClassTest ImagesUnclassifiableClassified CorrectlyClassified
Incorrectly
Accuracy per Disease
SunflowerRust817631185%
SunflowerPowdery mildew8124362136%
SunflowerDowny mildew81666988%
SunflowerAlternaria leaf blight81074791%
Publisher’s Note: MDPI stays neutral with regard to jurisdictional claims in published maps and institutional affiliations.

