Article

Land Comprehensive Carrying Capacity of Major Grain-Producing Areas in Northeast China: Spatial–Temporal Evolution, Obstacle Factors and Regulatory Policies

School of Humanities and Law, Northeastern University, Shenyang 110169, China
*
Author to whom correspondence should be addressed.
Sustainability 2022, 14(18), 11322; https://doi.org/10.3390/su141811322
Submission received: 22 August 2022 / Revised: 7 September 2022 / Accepted: 8 September 2022 / Published: 9 September 2022
(This article belongs to the Special Issue Sustainable Urban Development and Land Use Policy)

Abstract

:
Major grain-producing areas in Northeast China serve as a significant national commodity in their role as grain bases. In order to achieve sustainable land use in such areas and ensure national food security, it is critical to understand the spatial–temporal evolution features of the land comprehensive carrying capacity of such areas, ascertain major obstacle factors and propose regulatory policies for effectively improving the land comprehensive carrying capacity. In this paper, a TOPSIS model based on grey relational entropy weight is developed to analyze the spatial–temporal evolution features of the land comprehensive carrying capacity of major grain-producing areas in Northeast China from 2000 to 2020, and an obstacle degree model is employed to determine the main obstacles to improving the land comprehensive carrying capacity of major grain-producing areas in Northeast China. The study results show the following: (1) The land comprehensive carrying capacity of major grain-producing areas in Northeast China is at a low level, showing an N-shaped trendline, and its spatial–temporal evolution features are subject to changes in land food carrying capacity, land economic carrying capacity and land ecological carrying capacity.(2) The main obstacle factors for improving the land comprehensive carrying capacity of major grain-producing areas in Northeast China are urbanization rate, gross industrial output per hectare and industrial solid waste emission per hectare. Cultivated land area per capita, grain output per hectare and industrial wastewater discharge per hectare have recently become obstacle factors for the land comprehensive carrying capacity of the study areas. Based on these results, the paper proposes regulatory strategies for stabilizing agricultural population transfer to avoid its reversal, exploring the optimization and upgrading of secondary sector structures to promote a low-carbon transition to green industries, and implementing cultivated land protection policies to steadily boost cultivated land grain productivity, with a view to increasing the land comprehensive carrying capacity of major grain-producing areas in Northeast China. The findings of this study act as a scientific reference for enhancing the land comprehensive carrying capacity of major grain-producing areas in Northeast China, which is crucial for ensuring national food security.

1. Introduction

Land forms the material basis of human society’s survival and development [1]. It plays a vital role in socioeconomic growth, and the sustainable utilization of land resources is key to socioeconomic development [2,3,4]. It is recognized that land development is largely limited by available resources and the environment [5]. However, recently, there has been increasing recognition of the urgent need for humanity to live within the land carrying capacity, considering the global impact of an increasing population and depleted land resources. Land carrying capacity assessment could help to calculate optimal population numbers and sustainable land use outcomes in accordance with naturally determined limits [6,7]. Studying the comprehensive carrying capacity of regional land resources and exploring the obstacle factors that affect the improvement of land comprehensive carrying capacity (LCCC) can help promote the sustainable use of land resources. The LCCC is not merely the number of people and the degree of human activities that a country or region can sustain with its land resources at certain economic, technological and social levels [8,9,10]. It should have multiple connotations, such as maximum grain yields and the upper limit of the ecological carrying capacity of a region. Hence, improving the comprehensive carrying capacity of regional land plays a major role in guaranteeing the sustainable development of food production and the regional population.
Major grain-producing areas in Northeast China comprise 209 counties and cities in Heilongjiang, Jilin, Liaoning and the Inner Mongolia Autonomous Region. They are the largest producing regions of corn, rice, wheat and soybean and also the largest commodity grain base in China to date, with a grain commodity rate averaging 70%. Major grain-producing areas in Northeast China produced 182.86 million tons of grain in 2021, constituting 26.79% of the country’s grain output. Considering the fact that major grain-producing areas in Northeast China contribute largely to national food security, efforts are required to scientifically assess the LCCC of these areas and to look into key barriers, which are of great practical significance to enhance the comprehensive carrying capacity and sustainable utilization of the land. Furthermore, China has proposed the Major Function Oriented Zoning approach, which guides the orientation of the ecofriendly growth mode of land space and the elevation of land use efficiency [8]. In this context, studies of spatial–temporal evolution, obstacle factors and policy regulatory perspectives of LCCC are of great meaning.

1.1. Literature Review

The concept of carrying capacity originated in the research domain of physics and later spread to fields such as demography, ecology, and economics [11,12,13,14,15]. Research on resource and environment carrying capacity began with the emergence of land resource carrying capacity in the late 1940s, before shifting focus to the balance between humanity and land in the early 1970s in response to the immense strain on non-renewable resources, reaching carrying capacity ceilings [16,17]. In the late 1980s, research on regional land carrying capacity attracted the attention of the United Nations Educational, Scientific and Cultural Organization (UNESCO) and the Food and Agriculture Organization (FAO), and was then widely applied across regions [18,19,20,21]. Nowadays, most scholars studying land carrying capacity focus on connotation interpretation [12], index system construction [13,22], regional difference analysis [23,24], influence factor analysis [23,25,26], future prediction simulation [27], and enhancement strategy [28], and, instead of taking a simple and mono-factor approach, they are increasingly considering multiple factors and compound research methodology. There are two main methods used to evaluate LCCC. One is to construct an evaluation index system by selecting indices from natural resources, the ecological environment, food production, the social economy and other systems, based on the complex attributes of LCCC in the population, economy, society and food industry [29,30,31,32]. The other is to construct an evaluation index system within a fixed model framework, such as the DPSIR model [33]. The major evaluation methods that are available include the general trend method [34], fuzzy mathematics method [35], ecological footprint method [20,36,37,38,39], system dynamics method [40,41,42,43] and ArcGIS [44,45]. This shows that, in LCCC evaluation, the emphasis has shifted from single-factor carrying capacity measurement to comprehensive-factor carrying capacity measurement.
There have been many studies on LCCC evaluation, but there are also some limitations of these existing studies. Most of the existing studies focus on the evolution characteristics and laws of the LCCC of a region in the temporal dimension, and fail to examine the spatial distribution features of regional LCCC in the long term. In addition, there is little research focused on the obstacle factors affecting the comprehensive carrying capacity of land in a region, and this makes it challenging for academics to suggest specific strategies for improving regional LCCC. However, the lack of LCCC studies on regional spatial–temporal and obstacle factors is not conducive to promoting regulatory policies for LCCC.

1.2. Research Objectives and Innovations

By basing this study on the functional positioning of the major grain-producing areas in Northeast China in terms of ensuring national food security, we developed an evaluation index system for the LCCC of the study areas. We then proceeded to analyze the evolution characteristics and laws of the LCCC of the study areas in both temporal and spatial dimensions, and diagnosed the key obstacle factors that restrict the comprehensive carrying capacity of land in these areas. This study aims to offer guidance for improving the LCCC of the study areas, improving the sustainable use of land resources and ensuring grain production and national food security in China.
This study adds to existing research in the following ways: (1) The ultimate goal of LCCC evaluation is to find the best carrying state of the land and avoid the worst carrying state. The Technique for Order of Preference by Similarity to Ideal Solution (TOPSIS), therefore, is an effective method to assess LCCC by choosing the alternative that is closest to the positive ideal solution and farthest from the negative ideal solution, which could provide a better understanding of the regional LCCC status. (2) Identifying the influence factors that limit the improvement of LCCC is a key method to achieve the goal of sustainable land use, thus, using the obstacle degree model to explore the obstacle factors of LCCC could provide a clear reference to promote regulatory policies that aim to improve the LCCC level. Thus, this study will not only enrich the existing studies of LCCC from the perspectives of spatial–temporal evolution and obstacle factors, and contribute to the integrated body of knowledge of LCCC, but also provide a valuable LCCC regulatory policy reference for sustainable land use practices in the study areas and other major grain-producing areas.
The remainder of this paper is structured as follows. Section 2 describes the construction of the LCCC index system. Section 3 displays the methods and Section 4 discusses the empirical results of the models. Section 5 and Section 6 present the discussion and conclusions of this study, respectively.

2. Index System Construction

Land comprehensive carrying capacity (LCCC) is a comprehensive concept. It relates to the interplay and coordinated development among such factors as nature, socioeconomics, population and ecology [46,47]. To evaluate LCCC, one should fully consider not only the basic natural resource attributes of land resources, but also the fundamental role of land resource systems as the basis of socioeconomic development and the carrier of the ecological environment in social, economic and ecological landscapes. Therefore, this paper argues that the LCCC reflects the threshold of the scale and intensity of human activities that land resources can bear under the constraints of society, economy and the ecological environment within a certain period [44]. The LCCC of the study areas is measured using the TOPSIS method to choose the LCCC alternatives that possess both the shortest distance from the positive ideal solution and the longest distance from the negative ideal solution.
The LCCC evaluation index system lacks a universal standard at present. Taking into account the connotations of LCCC, data accessibility and the main function positioning of the study areas, this paper believes that such an index system should involve the food, economic, social and ecological carrying capacities of the land. For major grain-producing areas in Northeast China, the food carrying capacity of the land is the most fundamental carrying capacity of land resources. Continued improvement of the food carrying capacity of the land in the study areas through the sustainable utilization of land resources guarantees national food security. Hence, land food carrying capacity is the basic carrying capacity of land resources. Economy, society and ecology are key catalysts for change in land food carrying capacity, and they interact with each other for coordinated development. Economic growth, social progress and eco-environment construction affect the upper limit and threshold of land food carrying capacity to a certain extent. Enhancing the economic and social carrying capacities of land can effectively increase the land ecological carrying capacity. To some extent, land ecological carrying capacity limits the potential for socioeconomic development and affects land food carrying capacity. By referring to other research findings [7,9,10,14,24,48,49,50,51,52], we selected LCCC evaluation indices in the four dimensions of food, society, economy and ecology (Table 1). The indices chosen are: (i) cultivated land area per capita, grain output per capita, grain output per hectare, gross agricultural output per hectare and cropping index in terms of land food carrying capacity; (ii) GDP per hectare, consumption expenditure per hectare, gross industrial output per hectare, fiscal revenue per hectare in terms of land economic carrying capacity; (iii) urbanization rate, natural population growth rate, population density and urban built-up area per capita from the perspective of land social carrying capacity; and (iv) park green area per capita, industrial wastewater discharge per hectare, industrial solid waste emission per hectare and environmental protection expenditure per hectare in terms of land ecological carrying capacity.
In light of data accessibility and indicator consistency, the data from Inner Mongolia are not included in this study. The data for the indicators in the study mainly come from statistical yearbooks and officially released statistics of the national economic and social development of Heilongjiang, Jilin and Liaoning provinces from 1990 to 2021, and some data are from the China Statistical Yearbook and China Environment Yearbook between 1990 and 2021.

3. Methods

3.1. LCCC Calculation

TOPSIS is short for Technique for Order of Preference by Similarity to Ideal Solution. Its principle is to rank the evaluation object by measuring its relative distance from the positive (optimal) and negative (worst) ideal solutions. This TOPSIS model applies to multi-attribute decision-making problems and can reflect the dynamic change trend of the evaluation object in a comprehensive and objective manner [53]. Hence, it is suitable for LCCC evaluation in this study. Based on existing research results, existing studies use the entropy method to objectively measure the weights of each evaluation index, and employ the grey correlation method to solve index information loss and overcome the ambiguity and uncertainty of evaluation index setting [54]. Therefore, in this study, we use the grey relational entropy weight and TOPSIS to evaluate the LCCC of the study areas [26,54]. The specific steps are as follows.
  • Normalize the data.
In order to eliminate the impact of the difference in indicator dimension and nature on the evaluation results, the evaluation indices are normalized. Let there be m evaluation objects and n evaluation indicators, then the formation of the evaluation index matrix R = ( R i j ) m × n . The original data are normalized with the range standardization method. In cases where the larger the positive index value, the better the result, then the formula is (1); the smaller the negative index value, the better the result, then the formula is (2). The normalized matrix V = ( V i j ) m × n is obtained using the following Formulas (1) and (2):
v i j = [ r i j min ( r i j ) ] / [ max ( r i j ) min ( r i j ) ]
v i j = [ max ( r i j ) r i j ] / [ max ( r i j ) min ( r i j ) ]
  • Construct the weighted normalized evaluation matrix.
The maxima of the normalized index values in the four major categories, respectively, constitute the reference sequence V 0 , then V 0 = { v 01 , v 02 , , v 0 n } , v 0 j = max v i j ,   j = 1 , 2 , , n . The grey correlation coefficient of the jth index in year i is δ i j , which could be written as:
δ i j = min i min j | v 0 j v i j | + λ   max i max j | v 0 j v i j | | v 0 j v i j | + λ   max i max j | v 0 j v i j |
where separation coefficient λ = 0. Then, the entropy of grey correlation of the jth evaluation index is:
E j = 1 ln m i = 1 m e i j ln e i j
where e i j = δ i j / i = 1 m δ i j , j = 1 , 2 , , n and e i j 0 ,   i = 1 m e i j = 1 , so that the grey relational entropy weight of the jth evaluation index is:
w j = t j / j = 1 n t j , j = 1 , 2 , , n
where t j = 1 E j is the deviation of the jth index. The weighted normalized matrix is:
Y = w j × V = ( y i j ) m × n
  • Determine the positive ideal solution Y + and the negative ideal solution Y .
Y + = { max y i j | i = 1 , 2 , , m } = { y 1 + , y 2 + , , y m + }
Y = { min y i j | i = 1 , 2 , , m } = { y 1 , y 2 , , y m }
Calculate the distances D + and D of the evaluation object in different years from the positive and negative ideal solutions.
D j + = i = 1 m ( y i + y i j ) 2
D j = i = 1 m ( y i y i j ) 2
  • Calculate the LCCC level value.
C j represents the LCCC level value, and the formula is:
C j = D j D j + + D j
Formula (11) suggests that C j [ 0 , 1 ] ; the closer the value is to 1, the closer the LCCC is to the optimal state, and the closer it is to 0, the closer the LCCC is to the worst state [26,44]. In order to characterize the high or low LCCC level, the non-equally spaced division method is employed to divide the close degree into four levels, with reference to the relevant studies [55,56] (Table 2).

3.2. Diagnosis of LCCC Obstacle Factors

Having identified the LCCC value that is close to the ideal solution, we may proceed to explore the obstacle factors of LCCC, in order to provide a reference for formulating regulatory policies for LCCC improvements. Building on the available literature [26], we introduce three variables to ascertain influence factors: factor contribution degree, index deviation degree and obstacle degree. Factor contribution degree S i j represents the contribution of a single index to the LCCC, which is generally expressed by the index weight w i . The index deviation degree P i j is the gap between the actual value of a single index and the optimal target value. The obstacle degree O i is the degree of obstruction of the indices of the four categories or a single index to the LCCC, and the formula is as follows:
O i = P i w i / ( i = 1 n P i w i )
where P i = 1 v i j , and v i j is the normalized index value.

4. Results

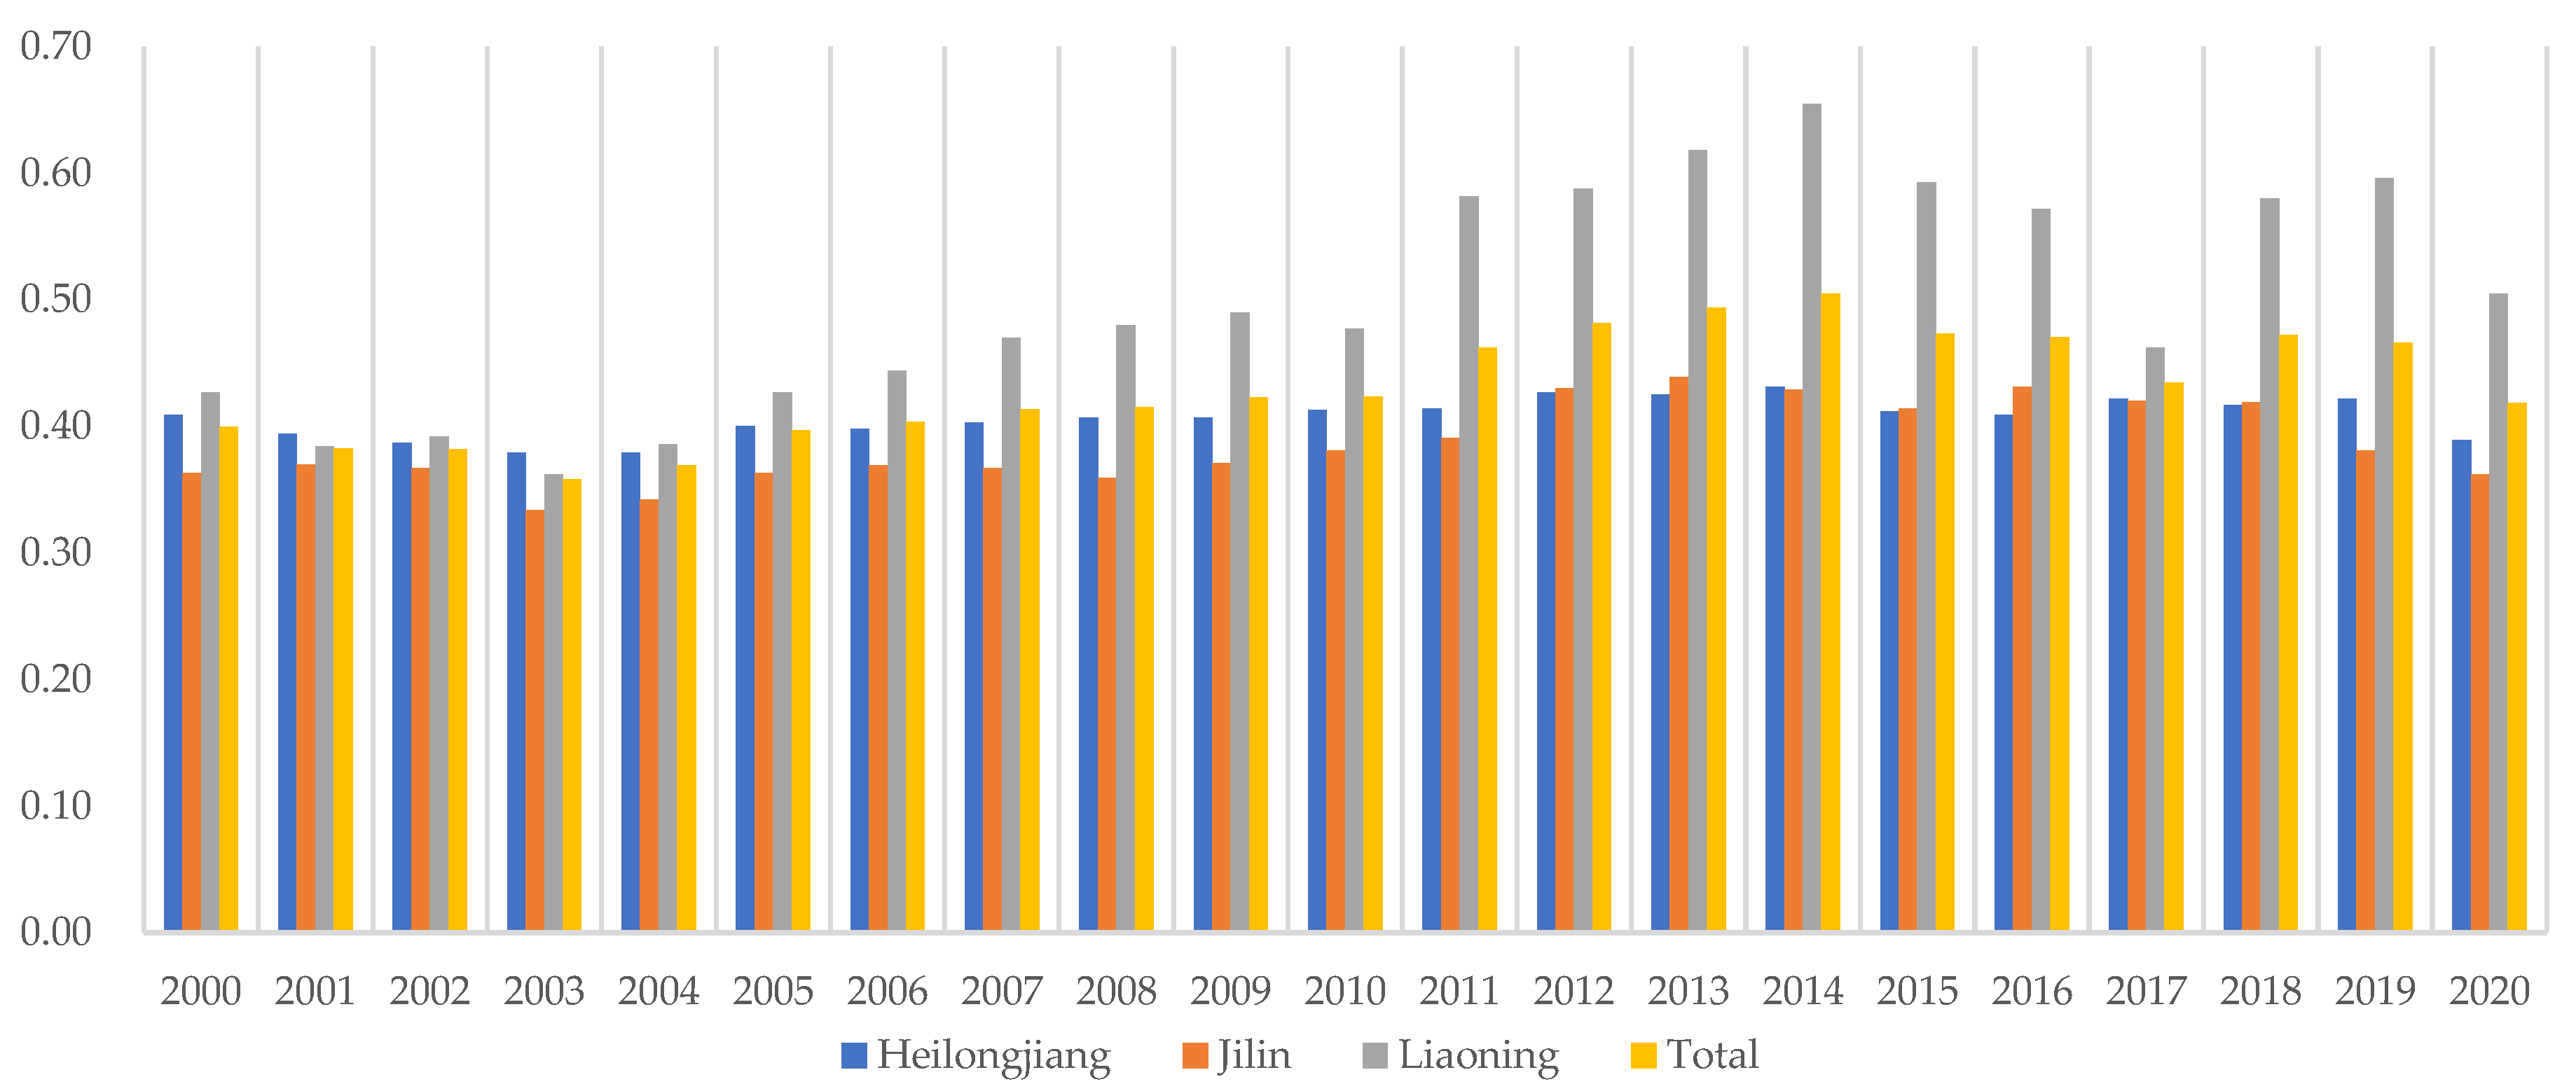
4.1. Evaluation of LCCC of Three Provinces in Major Grain-Producing Areas in Northeast China from 2000 to 2020

4.1.1. LCCC Evaluation

Table 3 illustrates the calculation results of the LCCC of the study areas from 2000 to 2020, and Figure 1 shows the trend of the LCCC of the study areas between 2000 and 2020.
In the temporal dimension, the LCCC of the study areas showed an N-shaped trendline during the time period under study. The LCCC level, although demonstrating a general uptrend, averaged below 0.3 before 2009, which was a very low level; since 2010, the calculated results of the LCCC level were above 0.3, which was a low level. The LCCC in the study areas between 2000 and 2020 reached a high of 0.381 in 2014. During the study period, the LCCC value of the major grain-producing areas in Northeast China was 0.278 on average, in a very low level range, indicating that there is a gap between the LCCC of the study areas and the ideal value, with considerable room for improvement.
In the spatial dimension, between 2000 and 2020, the LCCC value of Liaoning Province averaged 0.395, which was a relatively high level across the study areas, surpassing that of Heilongjiang from 2007. It showed a significant increase, reaching a maximum of 0.636 in 2013; then, it started to decline, and rose again in 2016, showing a continuous uptrend; and from 2014 to 2016, it exceeded 0.6 and was at a medium level. The LCCC value of Jilin Province from 2000 to 2020 was at a very low level, averaging 0.118; as the change trend suggests, except for a slight drop in 2003, 2016 and 2019, it was basically a continuous, slight increase, with a rise of merely 0.136 in 2021. The LCCC value of Heilongjiang Province averaged 0.321; it was in a continued uptrend with slight fluctuations, from 0.293 in 2000 to 0.367 in 2020, with an annual growth rate averaging 0.35%.

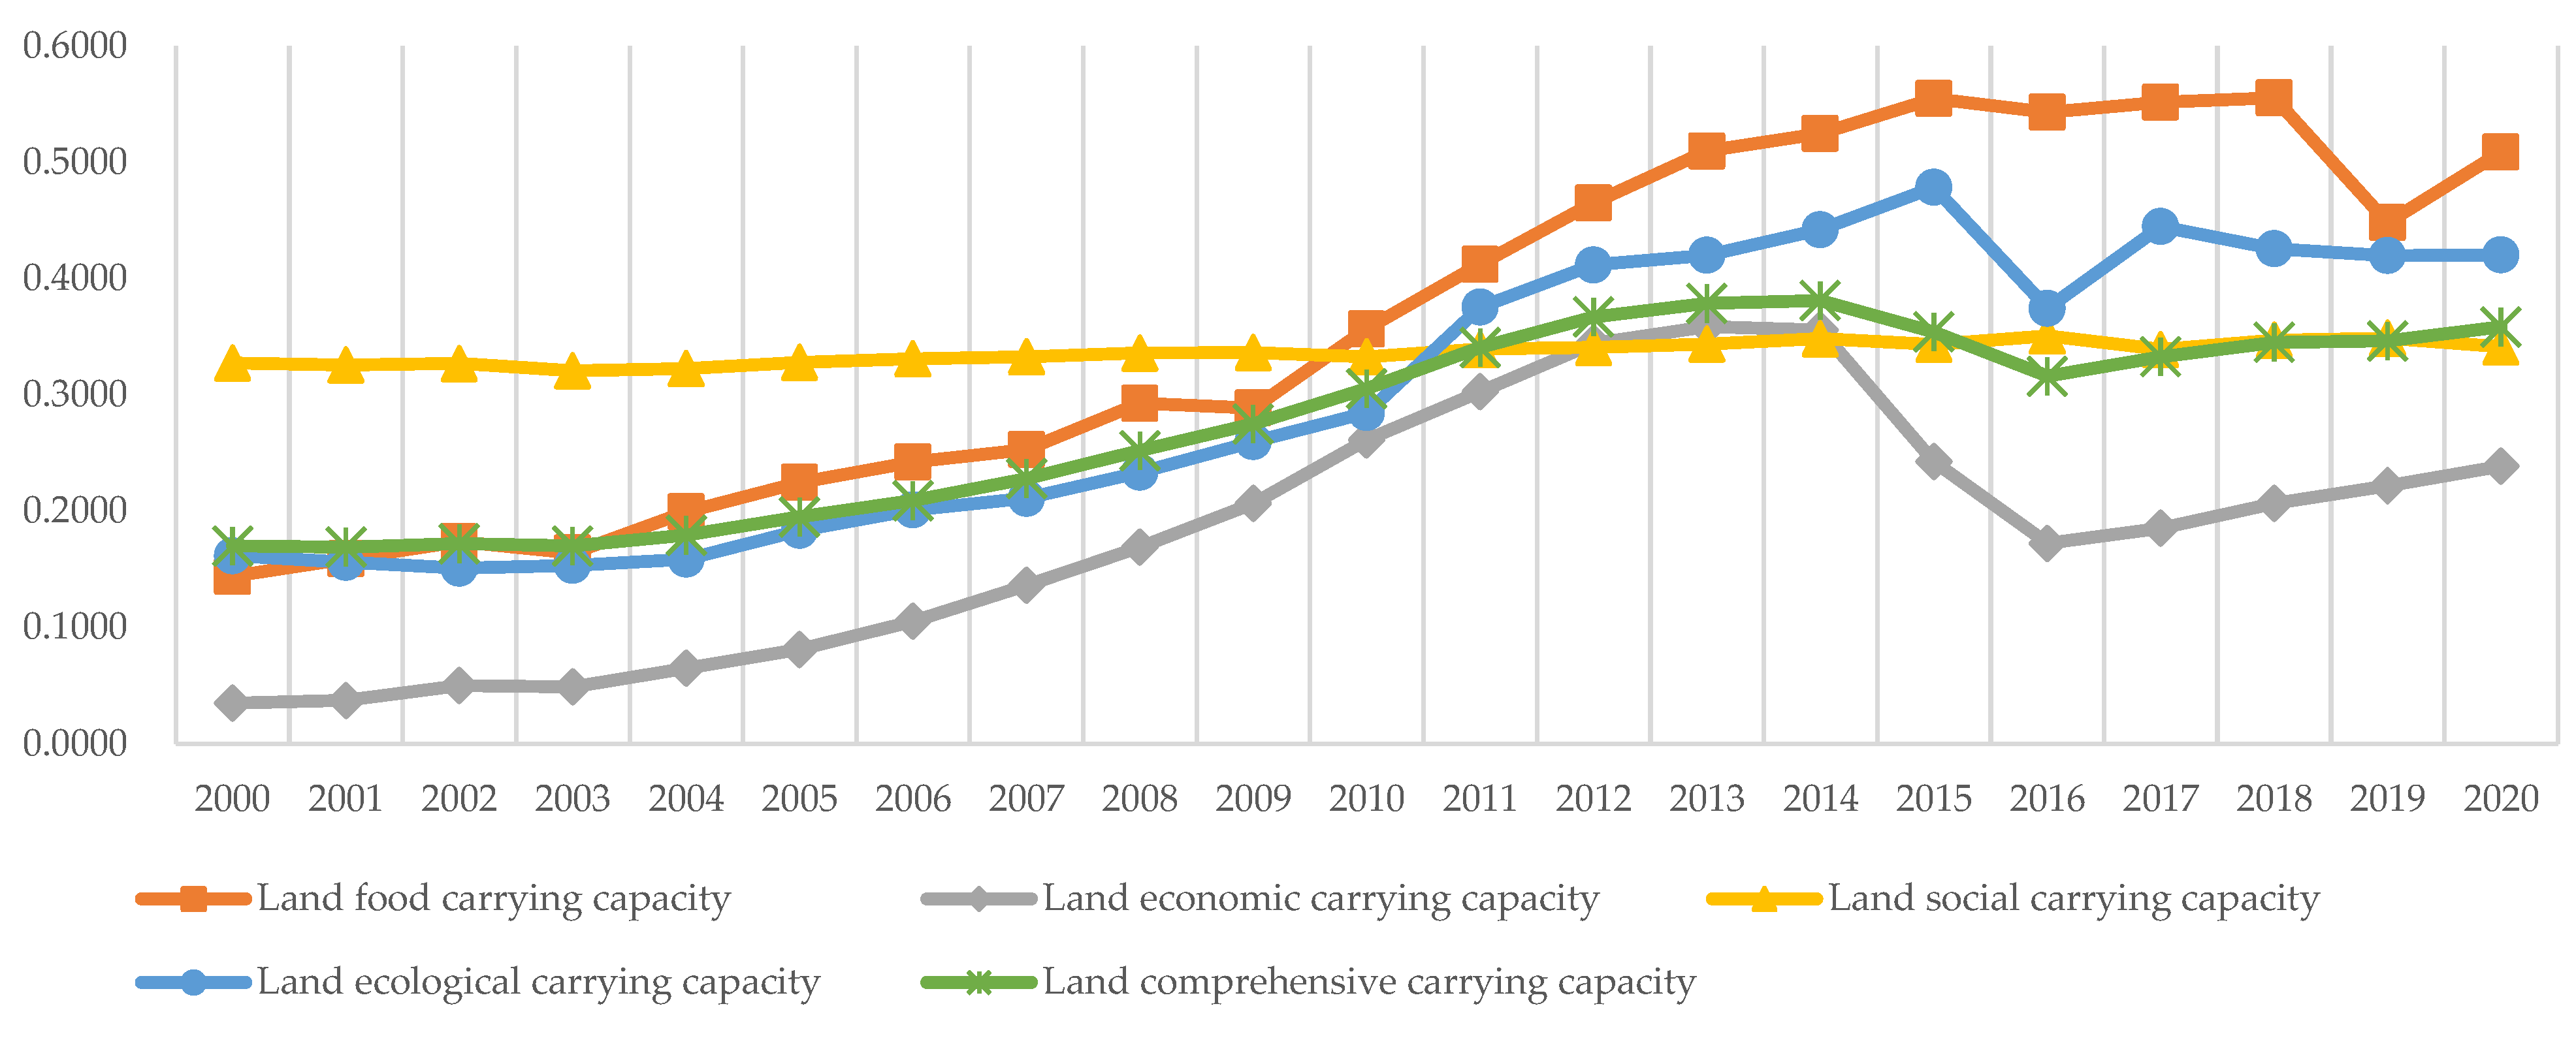
4.1.2. Evaluation of Classified Land Carrying Capacity

Figure 2 describes the trends of the LCCC and the classified land carrying capacity of the major grain-producing areas in Northeast China. It shows that the LCCC of the study areas started to drop after peaking in 2014, and began to rise again from 2016. By examining the trend in the change in classified land carrying capacity, it is possible to investigate the causes of LCCC change in the study areas.
Land food carrying capacity generally showed a continued uptrend, with a modest fall in 2016, a substantial decline in 2019, and then a rise since 2020. As a fundamental national commodity grain base, the major grain-producing areas in Northeast China ensure the stability of national grain production. Liaoning, Jilin, Heilongjiang, and other places experienced more rain in the summer of 2019 than usual, which caused waterlogging in farmlands and large-scale flooding in spring corn lands in eastern Heilongjiang, central Jilin and part of Liaoning. Waterlogging in some farmland worsened in August of the same year because Heilongjiang received somewhat more precipitation than usual. During the same period, the land in Liaoning, eastern and northern Heilongjiang and most of Jilin was in an over-wet state, while the temperature in most of Heilongjiang and western and eastern Jilin was lower than that of the same period in previous years, and the sown area of grain crops was cut by the government. Due to the climate, food carrying capacity experienced a dramatic but transient fall, and began to rebound in 2020.
Land economic carrying capacity reached a high of 0.381 in 2014, plummeted to 0.172 in 2016 and later began to rise. Its trend was basically consistent with that of LCCC. Northeast China is the major grain-producing area of the country and is also an important established industrial base in China. Due to the decline and overcapacity of national steel, coal and heavy industries, as well as the unreasonable industrial structure of Northeast China, the economy of Northeast China has registered a continued fall since 2014, leading to a decline in the national income, industrial output, fiscal revenue and consumption expenditure, accompanied by a sharp drop in land economic carrying capacity. However, underpinned by national support policies, Northeast China is actively exploring the path of industrial structure optimization and upgrading. Socioeconomic development is therefore being restored to its normal pace, economic income is recovering, and land economic carrying capacity is rising accordingly.
Land social carrying capacity fluctuated slightly from 2000 to 2020, showing a gentle change trend. This indicates that the carrying capacity of land resources in Northeast China in terms of population resources is basically stable, and the urbanization rate, natural population growth rate, population density, and urban built-up area per capita also remain basically stable. However, in terms of the value, land social carrying capacity averaged 0.33 and remained at a low level, showing some room for improvement.
Land ecological carrying capacity peaked at 0.478 in 2015 with a continued uptrend, fell to 0.374 in 2016, and then rebounded. Its fluctuation resembles that of LCCC. From the perspective of each indicator, the positive indices of urban park green area per capita and environmental protection expenditure per hectare dropped in 2016, and the negative indices of land industrial wastewater discharge per hectare and solid waste emission per hectare rose in 2016, resulting in a significant decline in land ecological carrying capacity in this year. Since 2017, land ecological carrying capacity has begun to rebound. Such improvement relates largely to Northeast China’s efforts to transform the economic growth mode, optimize the industrial structure, promote green economic development and develop ecological civilization.
By analyzing the change trend of the classified land carrying capacity in major grain-producing areas in Northeast China from 2000 to 2020, it can be found that the influencing factors are land economic carrying capacity and land ecological carrying capacity, followed by land food carrying capacity and land social carrying capacity. Therefore, the emphasis should be on ensuring the steady increase in land economic carrying capacity and land ecological carrying capacity in order to guarantee the steady improvement in the LCCC of the study areas.

4.2. Obstacle Factors of LCCC of the Major Grain-Producing Areas in Northeast China

According to the obstacle degree formula, the obstacle factors of LCCC in the study areas in 2000, 2005, 2010, 2015 and 2020 were calculated, and the top five obstacle factors of LCCC in the study areas in each year are shown in Table 4.
In 2000, 2005, 2010, 2015 and 2020, the main obstacle factors were X10 urbanization rate, X8 gross industrial output per hectare and X16 industrial solid waste emission per hectare. In 2010, 2015 and 2020, the obstacle degree of urbanization rate exceeded 20%, which greatly impacted the improvement in the LCCC; the obstacle degree of the remaining indices on the LCCC exceeded 10%. The obstacle degree of the above three indices was large, and considering the internal reasoning of index evaluation, their entropy weight was large, which directly affected the calculation results of the LCCC and obstacle degree. Practically, the urbanization level reflects the urbanization process and non-farm degree of a region. Higher urbanization levels can significantly increase the scale of non-farm labor force, boost economic income, and improve the land social carrying capacity and LCCC of a region. Increased industrial output per hectare can significantly improve regional gross domestic product (GDP); established industrial bases in Northeast China, in particular, have a solid industrial foundation, and industrial income accounts for a large proportion of national income. Hence, increased industrial output per hectare can provide sufficient financial security for the development of primary and tertiary sectors, thereby improving the land economic carrying capacity and LCCC of the region. The lower the industrial solid waste emissions per hectare, the smaller the impact on the regional ecological environment, and the more likely it is that land ecological carrying capacity will improve. In order to raise gross industrial output per hectare and reduce industrial solid waste emission per hectare simultaneously, further efforts are required to proactively explore ways of optimizing and upgrading the industrial structure of the secondary sector, realize green production, and achieve a win–win situation with regard to economic income and ecological civilization construction. In 2000, 2005 and 2010, X4 gross agricultural output per hectare was a key obstacle factor affecting the LCCC of the study areas. Before 2010, the gross agricultural output per hectare in the study areas averaged 366,700 CNY/hm2, and it hit 1,136,900 CNY/hm2 in 2020. Such an increase was attributed to the recent implementation of a national financial support policy and arable land protection policy for the major grain-producing areas in Northeast China. In 2000 and 2005, X17 environmental protection expenditure per hectare was an obstacle factor of LCCC in the study areas, and before 2005, it was only 3,200 CNY/hm2, hindering the improvement of LCCC in the study areas. With the country placing greater emphasis on ecological civilization construction and environmental protection, the environmental protection expenditure per hectare in the study areas rose to 63,900 CNY/hm2 by 2020, causing it to no longer be the major factor limiting the improvement in the LCCC of the study areas. X1 cultivated land area per capita, X3 grain production per capita, and X15 industrial wastewater discharge per hectare evolved into the main factors limiting the LCCC of the study areas. This indicates that the major grain-producing areas in Northeast China still face the reality of more people but less land, necessitating increased grain productivity for cultivated land and improved green production to ensure the steady enhancement of the LCCC.
The results of the analysis suggest that the LCCC of the study area from 2000 to 2020 was generally at a relatively low level, with neither the comprehensive carrying capacity of land nor the other categories of land carrying capacity demonstrating a high level. This indicates that there is still much room to improve the LCCC level of the major grain-producing areas in Northeast China. In addition, the obstacle factor analysis results offer us suitable perspectives to improve the LCCC level in the study areas, such as stabilizing urbanization progress to ensure that the transferred agricultural population will not return to the countryside, encouraging the growth of green industry to achieve eco-friendly development and safeguarding the resources of arable land to increase grain yields. These results lay a good foundation for proposing LCCC regulatory policies in the study area.

5. Discussion

5.1. Regulatory Policies for Improving LCCC

In light of the findings in this paper, the following regulatory policies are proposed to further improve the LCCC of the main grain-producing areas in Northeast China:
(1) Stabilizing agricultural population transfer and avoiding its reversal. According to the results, the urbanization rate is a key obstacle factor affecting how LCCC will improve; therefore, steadily increasing the urbanization rate is a key method of improving the LCCC level in the study areas. Supporting policies for agricultural population transfer, job placement, allowances for living expenses, educational advancement and many other aspects are also an effective tool to retain agricultural population transfer rates, attract non-agricultural labor, improve the stability of the agricultural population transferred, and ensure that the transferred population does not return to rural areas. This can effectively guarantee the urbanization level and further improve the LCCC of the major grain-producing areas in Northeast China by enhancing the land social carrying capacity.
(2) Actively exploring the optimization and upgrading of the secondary sector industrial structure and promoting a low-carbon transition to green industries. The results of this study suggest that industrial solid waste emission per hectare and industrial wastewater discharge per hectare are the obstacle factors that have recently been affecting LCCC improvement in the study areas. Stakeholders should look into ways to improve and modernize secondary sector structure, change conventional industrial production methods, coordinate industrial development, cut energy use and pollutant emissions, create green manufacturing systems, boost resource and energy efficiency, and quicken the transition of manufacturing to a low-carbon, high-quality industry. All of these efforts help to achieve the green and low-carbon transformation of the old industrial base in Northeast China, promote the linkage of primary and tertiary sectors, and boost the economy in the study areas, thereby raising the LCCC of the major grain-producing areas in Northeast China based on an increase in land ecological carrying capacity and land economic carrying capacity.
(3) Implementing the policy of cultivated land protection and enhancing the grain productivity of cultivated land stage by stage. This study finds that cultivated land area per capita and grain yield per hectare are current obstacle factors for the improvement of LCCC in the study areas. Major grain-producing areas in Northeast China, as a key contributor to national food security, should adhere to a food production strategy based on farmland management and technological applications. To be specific, sustainable farmland use and the innovative application of agricultural technology can increase farmland productivity. Trials of crop rotation and fallow systems are efforts to implement technical processes and guarantee cultivated land fertility. Grain cultivation subsidies to farmers and an improved comparative income of grain cultivation can help avoid the "non-grain" use of arable land and ensure grain production. An increased land food carrying capacity can facilitate the attainment of the ultimate objective of raising the LCCC.

5.2. Contribution to Research, Limitations and Future Perspectives

Some existing studies have analyzed the LCCC and its features of spatial–temporal evolution [15,23,57], but the lack of long-term spatial–temporal evolution research of LCCC in the major grain-producing areas does not allow us to clearly calculate the optimal population, grain limitations and sustainable land use outcomes. Furthermore, the existing studies mostly focus on the assessment of the LCCC [58,59], with less attention being paid to its obstacle factors, which leads to less targeted results concerning the proposed policies. This makes it challenging for academics to suggest specific strategies for improving regional LCCC. Thus, in this study, the quantitative evaluation of the LCCC through the TOPSIS model provides a scientific guide with which to measure the regional LCCC in the long term (for 20 years), and based upon the calculated results, we continue to analyze the obstacle factors of the LCCC of the study areas using the obstacle degree model. Taking into account the obstacle factors identified, this paper provides regulatory measures, attempting to provide a targeted reference for improving the LCCC in the study areas.
However, in this study, we only analyzed the spatial–temporal evolution trends and obstacle factors of LCCC in three provinces in the major grain-producing area over the past 20 years. Analysis over longer time scales and smaller spatial scales could be used to continually improve the LCCC assessment results, making them more accurate. In addition, results on the composition of the LCCC evaluation index system have been inconclusive. Fully reflecting the LCCC from the perspectives of agricultural production, economy, society, ecology, etc., and constructing a more scientific LCCC evaluation index system, using a more comprehensive evaluation method, should also be focused on in the future.

6. Conclusions

In this paper, we take Heilongjiang, Jilin and Liaoning, the major grain-producing areas in Northeast China, as the study areas, calculate the LCCC level in a TOPSIS model, and analyze the major obstacle factors influencing the LCCC of the study areas using the obstacle degree model.
According to research results, in the temporal dimension, the LCCC of the major grain-producing areas in Northeast China showed a N-shaped trendline between 2000 and 2020; before 2009, the LCCC of the study areas was at a very low level; and after 2010, the LCCC was at a low level. In the spatial dimension, among the three provinces, the LCCC of Liaoning Province, showing a continued uptrend, was higher than that of the other two provinces; the LCCC of Jilin Province was lower and exhibited a slight rise; and the LCCC of Heilongjiang Province showed a continued, flatly upward trendline.
From the perspective of the classification of land carrying capacity, from 2000 to 2020, the food, economic and ecological carrying capacities of the land in the study areas all showed an N-shaped trendline, namely, a rise–drop–rise trend, while land social carrying capacity had little fluctuation, being at a more stable level. The main obstacle factors for the improvement in the LCCC of the study area in 2000, 2005, 2010, 2015 and 2020 were urbanization rate, gross industrial output per hectare and industrial solid waste emission per hectare. Later, cultivated land area per capita, grain output per hectare, industrial wastewater discharge per hectare, and industrial solid waste emission per hectare also became obstacle factors for LCCC in the study areas.

Author Contributions

J.G. is responsible for conceptualization, methodology, writing—original draft preparation, and writing—review and editing. R.Z. is responsible for formal analysis, visualization, and writing—review and editing. Y.Z. is responsible for investigation. All authors have read and agreed to the published version of the manuscript.

Funding

This research was funded by the Ministry of Education Humanities and Social Sciences Foundation Youth Project of China, Grant Number: 19YJC630037; the National Natural Science Foundation of China, Grant Number: 42101254; the Fundamental Research Funds for the Central Universities, Grant Number: N2114002; and the Soft Science Research Project of Liaoning Province, Grant Number: 2021JH4/10100065.

Data Availability Statement

The data presented in this study are available in the article.

Conflicts of Interest

The authors declare no conflict of interest.

References

  1. Yang, H.; Li, X.B. Cultivated land and food supply in China. Land Use Policy 2000, 17, 73–88. [Google Scholar] [CrossRef]
  2. Niu, S.D.; Lyu, X.; Gu, G.Z. A New Framework of Green Transition of Cultivated Land-Use for the Coordination among the Water-Land-Food-Carbon Nexus in China. Land 2022, 11, 933. [Google Scholar] [CrossRef]
  3. Gao, J.; Zhu, Y.; Zhao, R.; Sui, H. The Use of Cultivated Land for Multiple Functions in Major Grain-Producing Areas in Northeast China: Spatial–Temporal Pattern and Driving Forces. Land 2022, 11, 1476. [Google Scholar] [CrossRef]
  4. Guo, S.; Shen, G.Q.; Chen, Z.; Yu, R. Embodied cultivated land use in China 1987–2007. Ecol. Indic. 2014, 47, 198–209. [Google Scholar] [CrossRef]
  5. Chen, Y.; Li, S.R.; Cheng, L. Evaluation of cultivated land use efficiency with environmental constraints in the Dongting Lake Eco-Economic Zone of Hunan province. Land 2000, 9, 440. [Google Scholar] [CrossRef]
  6. Goswami, P.; Nishad, S. Quantification of regional and global sustainability based on combined resource criticality of land and water. Curr. Sci. 2018, 114, 355–366. [Google Scholar] [CrossRef]
  7. Lane, M. The carrying capacity imperative: Assessing regional carrying capacity methodologies for sustainable land-use planning. Land Use Policy 2010, 27, 1038–1045. [Google Scholar] [CrossRef]
  8. Tang, Y.; Yuan, Y.; Zhong, Q. Evaluation of Land Comprehensive Carrying Capacity and Spatio-Temporal Analysis of the Harbin-Changchun Urban Agglomeration. Int. J. Environ. Res. Public Health 2021, 18, 521. [Google Scholar] [CrossRef]
  9. Kessler, J.J. Usefulness of the human carrying capacity concept in assessing ecological sustainability of land-use in semi-arid regions. Agric. Ecosyst. Environ. 1994, 48, 273–284. [Google Scholar] [CrossRef]
  10. Onishi, T. A capacity approach for sustainable urban development: An empirical study. Reg. Stud. 1994, 28, 39–51. [Google Scholar] [CrossRef]
  11. Malthus, T.R. An Essay on the Principle of Population: The 1803 Edition; Yale University Press: New Haven, CT, USA; London, UK, 2018. [Google Scholar]
  12. Zhou, W.; Elshkaki, A.; Zhong, S.; Shen, L. Study on Relative Carrying Capacity of Land Resources and Its Zoning in 31 Provinces of China. Sustainability 2021, 13, 1459. [Google Scholar] [CrossRef]
  13. Zhao, L.L.; Li, J.Y.; Shao, Q.L. Evaluation of urban comprehensive carrying capacity: Case study of the Beijing-Tianjin-Hebei urban agglomeration. Environ. Sci. Pollut. Res. 2020, 27, 19774–19782. [Google Scholar] [CrossRef] [PubMed]
  14. Sun, X.; Qin, J.; Diao, C.; Zuo, T. Spatial–Temporal Difference Analysis of Land Carrying Capacity Based on Man-Grain Relationship in Chongqing Municipality. J. Southwest Univ. (Nat. Sci. Ed.) 2014, 36, 175–182. (In Chinese) [Google Scholar]
  15. Ma, P.; Ye, G.; Peng, X.; Liu, J.; Qi, J.; Jia, S. Development of an index system for evaluation of ecological carrying capacity of marine ecosystems. Ocean. Coast. Manag. 2017, 144, 23–30. [Google Scholar] [CrossRef]
  16. Australian UNESCO Seminar; Australian UNESCO Committee for Man and the Biosphere. Energy and How We Live: Flinders University of South Australia, 16–18 May 1973; Australian-UNESCO Committee: Canberra, Australia, 1973.
  17. Holling, C.S. Resilience and Stability of Ecological Systems. Annu. Rev. Ecol. Syst. 1973, 4, 1–23. [Google Scholar] [CrossRef]
  18. UNESCO & FAO. Carrying Capacity Assessment with a Pilot Study of Kenya: A Resource Accounting Methodology for Exploring National Options for Sustainable Development; Food and Agriculture Organization of the United Nations: Rome, Italy, 1985. [Google Scholar]
  19. FAO. Potential Population Supporting Capacities of Lands in Developing World; Food and Agriculture Organization of the United Nations: Rome, Italy, 1982. [Google Scholar]
  20. Zeev, S.; Meidad, K.; Avinoam, M. A multi-spatial scale approach to urban sustainability—An illustration of the domestic and global hinterlands of the city of Beer-Sheva. Land Use Policy 2014, 41, 498–505. [Google Scholar] [CrossRef]
  21. Cheng, K.; Fu, Q.; Cui, S.; Li, T.; Pei, W.; Liu, D.; Meng, J. Evaluation of the land carrying capacity of major grain-producing areas and the identification of risk factors. Nat. Hazards 2017, 86, 263–280. [Google Scholar] [CrossRef]
  22. Wei, L.y.; Jin, C.; Lu, Y.Q. Exploring resources and environmental carrying capacities at the county level: A case study of China’s Fengxian County. PLoS ONE 2019, 14, e0225683. [Google Scholar] [CrossRef]
  23. Cui, G.; Zhang, X.; Zhang, Z.; Cao, Y.; Liu, X. Comprehensive land carrying capacities of the Cities in the Shandong Peninsula blue economic zone and their spatio-temporal variations. Sustainability 2019, 11, 439. [Google Scholar] [CrossRef]
  24. Cheng, J.; Zhou, K.; Chen, D.; Fan, J. Evaluation and analysis of provincial differences in resources and environment carrying capacity in China. Chin. Geogr. Sci. 2016, 26, 539–549. [Google Scholar] [CrossRef]
  25. Yang, N.N.; Li, J.S.; Lu, B.B.; Luo, M.H.; Li, L.Z. Exploring the Spatial Pattern and Influencing Factors of Land Carrying Capacity in Wuhan. Sustainability 2019, 11, 2786. [Google Scholar] [CrossRef] [Green Version]
  26. Li, J. Evaluation of Spatial-Temporal Variation of Land Comprehensive Carrying Capacity of Yangtze River Economic Zone and Diagnosis of Obstacle Factors. East. China Econ. Manag. 2019, 33, 67–75. (In Chinese) [Google Scholar]
  27. Li, J.J.; Wei, Y.; Li, Y. Dynamic evaluation and simulation of land carrying capacity in a karst mountainous area—A case study of Guiyang. Arab. J. Geosci. 2022, 15, 598. [Google Scholar] [CrossRef]
  28. Li, K.; Jin, X.; Ma, D.; Jiang, P. Evaluation of resource and environmental carrying capacity of China’s rapid-urbanization areas-A case study of Xinbei District. Land 2019, 8, 69. [Google Scholar] [CrossRef]
  29. Wei, C.; Guo, Z.Y.; Wu, J.P.; Ye, S.F. Constructing an assessment indices system to analyze integrated regional carrying capacity in the coastal zones—A case in Nantong. Ocean. Coast. Manag. 2014, 93, 51–59. [Google Scholar] [CrossRef]
  30. Ren, C.; Guo, P.; Li, M.; Li, R. An innovative method for water resources carrying capacity research—Metabolic theory of regional water resources. J. Environ. Manag. 2016, 167, 139–146. [Google Scholar] [CrossRef]
  31. Widodo, B.; Lupyanto, R.; Sulistiono, B.; Harjito, D.A.; Hamidin, J.; Hapsari, E.; Yasin, M.; Ellinda, C. Analysis of Environmental Carrying Capacity for the Development of Sustainable Settlement in Yogyakarta Urban Area. Procedia Environ. Sci. 2015, 28, 519–527. [Google Scholar] [CrossRef]
  32. Lu, Y.; Xu, H.; Wang, Y.; Yang, Y. Evaluation of water environmental carrying capacity of city in Huaihe River Basin based on the AHP method: A case in Huai’an City. Water Resour. Ind. 2017, 18, 71–77. [Google Scholar] [CrossRef]
  33. Qian, G.; Wang, J.; Yin, H.; Zhang, G. Comprehensive evaluation of the regional Atmospheric Environment Carrying Capacity: Model development and a case study in China. Ecol. Indic. 2018, 91, 259–267. [Google Scholar]
  34. Guo, Q.; Wang, J.Y.; Zhang, B. A Comprehensive Assessment of Regional Water Resources Carrying Capacity based on the DPSIRM Framework. J. Nat. Resour. 2017, 32, 484–493. [Google Scholar]
  35. Wang, Q. A Fuzzy Comprehensive Evaluation Method of Area Resource Carrying Capacity. Int. J. Circuits 2020, 14, 1137–1153. [Google Scholar] [CrossRef]
  36. Huang, Q.; Wang, R.; Ren, Z.; Li, J.; Zhang, H. Regional ecological security assessment based on long periods of ecological footprint analysis. Resour. Conserv. Recycl. 2007, 51, 24–41. [Google Scholar] [CrossRef]
  37. Budihardjo, S.; Hadi, S.; Sutikno, S.; Purwanto, P. The ecological footprint analysis for assessing carrying capacity of industrial zone in Semarang. J. Hum. Resour. Sustain. Stud. 2013, 1, 14–20. [Google Scholar] [CrossRef]
  38. Guzman, J.; Marrero, M.; Arellano, A. Methodology for determining the ecological footprint of the construction of residential buildings in Andalusia (Spain). Ecol. Indic. 2013, 25, 239–249. [Google Scholar] [CrossRef]
  39. Clancy, S.A.; Worrall, F.; Davies, R.J.; Gluyas, J.G. An assessment of the footprint and carrying capacity of oil and gas well sites: The implications for limiting hydrocarbon reserves. Sci. Total Environ. 2018, 618, 586–594. [Google Scholar] [CrossRef]
  40. Zhu, X.Z.; Li, X.W.; Jia, K.J.; Qi, F. System Dynamics of Land Comprehensive Carrying Capacity in Shanghai. China Land Sci. 2014, 28, 90–96. (In Chinese) [Google Scholar]
  41. Dai, D.; Sun, M.; Lv, X.; Lei, K. Evaluating water resource sustainability from the perspective of water resource carrying capacity, a case study of the Yongding River watershed in Beijing-Tianjin-Hebei region. Environ. Sci. Pollut. Res. 2020, 27, 21590–21603. [Google Scholar] [CrossRef]
  42. Yang, J.; Lei, K.; Khu, S.; Meng, W. Assessment of Water Resources Carrying Capacity for Sustainable Development Based on a System Dynamics Model: A Case Study of Tieling City. Water Resour. Manag. 2014, 29, 885–899. [Google Scholar] [CrossRef]
  43. Guo, S.L.; Li, C.J.; Liu, S.Q.; Zhou, K. Land carrying capacity in rural settlements of three gorges reservoir based on the system dynamic model. Nat. Resour. Model. 2018, 31, e12152. [Google Scholar] [CrossRef]
  44. Zhang, R.T.; Zhang, X.L.; Yin, P. Spatial-temporal Differentiation and Driving Factors Identification of Urban Land Resources Carrying Capacity in the Yangtze River Economic Belt. Econ. Geogr. 2022, 42, 185–192. (In Chinese) [Google Scholar]
  45. Shi, Y.; Wang, H.; Yin, C. Evaluation method of urban land population carrying capacity based on GIS-A case of Shanghai, China. Comput. Environ. Urban Syst. 2013, 39, 27–38. [Google Scholar] [CrossRef]
  46. Cheng, X.Y.; Yang, Q.Y.; Bi, G.H. Study on Spatial and Temporal Disparities of Land Resource Carrying Capacity in Jiangjin District of Chongqing. Resour. Environ. Yangtze Basin 2019, 28, 2319–2330. (In Chinese) [Google Scholar]
  47. Sun, T.; Feng, Z.M.; Yang, Y.Z. Research on land resource carrying capacity: Progress and prospects. J. Resour. Ecol. 2018, 9, 331–340. [Google Scholar]
  48. Su, Y.; Xue, H.; Liang, H. An evaluation model for urban comprehensive carrying capacity: An empirical case from Harbin city. Int. J. Environ. Res. Public Health 2019, 16, 367. [Google Scholar] [CrossRef]
  49. Xue, Q.; Yang, X.; Wu, F. A three-stage hybrid model for the regional assessment, spatial pattern analysis and source apportionment of the land resources comprehensive supporting capacity in the Yangtze River Delta urban agglomeration. Sci. Total Environ. 2020, 711, 134428. [Google Scholar] [CrossRef]
  50. Wei, Y.; Huang, C.; Li, J.; Xie, L. An evaluation model for urban carrying capacity: A case study of China’s mega-cities. Habitat Int. 2016, 53, 87–96. [Google Scholar] [CrossRef]
  51. Liu, H. Comprehensive carrying capacity of the urban agglomeration in the Yangtze River Delta, China. Habitat Int. 2012, 36, 462–470. [Google Scholar] [CrossRef]
  52. Tsou, J.; Gao, Y.; Zhang, Y.; Genyun, S.; Ren, J.; Li, Y. Evaluating urban land carrying capacity based on the ecological sensitivity analysis: A case study in Hangzhou. Remote Sens. 2017, 9, 529. [Google Scholar] [CrossRef] [Green Version]
  53. Yang, L.J.; Yang, Y.C. The Spatiotemporal Variation in Resource Environmental Carrying Capacity in the Gansu Province of. Acta Ecol. Sin. 2017, 37, 7000–7017. (In Chinese) [Google Scholar]
  54. Liu, S.F.; Yang, Y.J.; Wu, L.F. Grey System Theory and Its Applications; Science Press: Beijing, China, 2014. (In Chinese) [Google Scholar]
  55. Lu, C.Y.; Wen, F.; Yang, Q.Y.; Chen, L.L.; Zong, H.M. Urban Land Use Performance Evaluation and Obstacle Factor Diagnosis Based on Improved TOPSIS Method—A Case Study of Chongqing City. Resour. Sci. 2011, 33, 535–541. (In Chinese) [Google Scholar]
  56. Lei, X.P.; Qiu, R.B.; Liu, Y. Evaluation of Regional Land Use Performance Based on Entropy TOPSIS Model and Diagnosis of Its Obstacle Factors. Trans. CSAE 2016, 32, 243–253. (In Chinese) [Google Scholar]
  57. Peng, B.; Wang, Y.; Elahi, E.; Wei, G. Evaluation and prediction of the ecological footprint and ecological carrying capacity for yangtze river urban agglomeration based on the grey model. Int. J. Environ. Res. Public Health 2018, 15, 2543. [Google Scholar] [CrossRef] [PubMed]
  58. Chen, W.; Zhong, S.; Geng, Y.; Chen, Y.; Cui, X.; Wu, Q.; Pan, H.; Wu, R.; Sun, L.; Tian, X. Emergy based sustainability evaluation for Yunnan Province, China. J. Clean. Prod. 2017, 162, 1388–1397. [Google Scholar] [CrossRef]
  59. Liu, R.Z.; Borthwick, A.G.L. Measurement and assessment of carrying capacity of the environment in Ningbo. J. Environ. Manag. 2011, 92, 2047–2053. [Google Scholar] [CrossRef]
Figure 1. Change trend of the LCCC of the main grain-producing areas in Northeast China from 2000 to 2020.
Sustainability 14 11322 g001
Figure 2. Change trend of LCCC and classified land carrying capacity in major grain-producing areas in Northeast China.
Sustainability 14 11322 g002
Table 1. Evaluation index system and weight of the land comprehensive carrying capacity.
Category of Land Carrying CapacitySymbol Evaluation Index Function Weight
Land food carrying capacityX1Cultivated land area per capita (total cultivated area/total population, hectare/person)+5.57%
X2Grain output per capita (gross grain output/total population, kg/person)+2.97%
X3Grain output per hectare (gross grain output/total cultivated area, kg/person)+0.39%
X4Gross agricultural output per hectare (gross agricultural output/total cultivated area, 10,000/km2)+3.48%
X5Cropping index (grain sown area/total cultivated area, %)+0.13%
Land economic carrying capacityX6GDP per hectare (GDP/total land area, 10,000/km2)+7.26%
X7Consumption expenditure per hectare (total consumption expenditure/total land area, 10,000/km2)+6.87%
X8Gross industrial output per hectare (gross industrial output/total land area, 10,000/km2)+18.86%
X9Fiscal revenue per hectare (total fiscal revenue/total land area, 10,000/km2)+10.11%
Land social carrying capacityX10Urbanization rate (non-agricultural population/total population, %)+19.98%
X11Natural population growth rate (%)+0.80%
X12Population density (total population/total land area, person/km2)2.52%
X13Urban built-up area per capita (m2)+0.54%
Land ecological carrying capacityX14Park green area per capita (m2)+0.79%
X15Industrial wastewater discharge per hectare (industrial wastewater discharge/total land area, 10,000 tons/km2)5.93%
X16Industrial solid waste emission per hectare (industrial solid waste emission/total land area, 10,000 tons/km2)9.83%
X17Environmental protection expenditure per hectare (environmental protection expenditure/total land area, 10,000/km2)+6.97%
Table 2. Evaluation criteria for land comprehensive carrying capacity (LCCC).
LCCC level value[0, 0.3)[0.3, 0.6)[0.6, 0.8)[0.8, 1)
LCCC levelVery lowLow Medium High
Table 3. Calculation results of the LCCC of major grain-producing areas in Northeast China from 2000 to 2020.
YearHeilongjiang Jilin Liaoning Total Year Heilongjiang Jilin Liaoning Total
20000.2930.0560.1610.17020110.3250.1250.5720.341
20010.2950.0570.1550.16920120.3300.1540.6170.367
20020.2960.0560.1640.17220130.3330.1670.6360.379
20030.2970.0520.1610.17020140.3360.1760.6310.381
20040.2980.0550.1850.17920150.3400.1850.5370.354
20050.3010.0610.2230.19520160.3390.1770.4320.316
20060.3030.0660.2580.20920170.3440.1910.4630.333
20070.3060.0690.3090.22820180.3460.2010.4880.345
20080.3140.0790.3630.25220190.3530.1770.5090.346
20090.3150.0910.4190.27520200.3670.1920.5160.358
20100.3190.1000.4970.305Average 0.3210.1180.3950.278
Table 4. Obstacle factor ranking and obstacle degree of LCCC in major grain-producing areas in Northeast China in 2000, 2005, 2010, 2015 and 2020.
Rank 20002005201020152020
Obstacle FactorObstacle Degree %Obstacle FactorObstacle Degree %Obstacle FactorObstacle Degree %Obstacle FactorObstacle Degree %Obstacle FactorObstacle Degree %
1X1017.74X1018.69X1021.35X1025.64X1023.43
2X812.70X812.85X811.77X814.32X815.66
3X1611.34X1611.44X1611.55X1610.16X1612.58
4X410.25X49.73X48.67X17.85X310.37
5X178.69X178.37X27.68X37.23X156.68
Publisher’s Note: MDPI stays neutral with regard to jurisdictional claims in published maps and institutional affiliations.

