Essay

Detecting Cable Force Anomalies on Cable-Stayed Bridges Using the STA/LTA Method

Guangxi Key Laboratory of Geomechanics and Geotechnical Engineering, Guilin University of Technology, Guilin 541004, China
*
Author to whom correspondence should be addressed.
Sustainability 2022, 14(18), 11373; https://doi.org/10.3390/su141811373
Submission received: 11 July 2022 / Revised: 24 August 2022 / Accepted: 1 September 2022 / Published: 10 September 2022

Abstract

:

Highlights

What are the main findings?
  • A new method (STA/LTA) for identifying cable force anomalies is proposed.
  • STA/LTA is sensitive to anomalies and is insensitive to temperature.
What is the implication of the main finding?
  • STA/LTA is verified by the identification of the anomalies in a real bridge.
  • STA/LTA remedies the gaps in the current cable force anomaly detection methods.

Abstract

The cable force of cable-stayed bridges may become abnormal during operation, so cable force anomaly detection is essential for evaluating the health of cables. The current methods for detecting cable force anomalies have poor resistance to temperature disturbances and are insensitive to abnormal cable force, making it challenging to detect minor cable force anomalies. Therefore, this work employs the short-time-average over long-time-average (STA/LTA) method to detect cable force anomalies. The characteristic function and key parameters of the STA/LTA method are optimized and tested by combining measured cable force data with cable force anomaly simulation. The results show that the STA/LTA method can effectively mitigate the interference of temperature in the detection of cable force anomalies and that it has good sensitivity to minor cable force anomalies. By examining detecting the measured cable force data of the Xiangjiang Bridge in Dongzhou, Hengyang, China, it is further verified that the STA/LTA method could effectively detect a cable force anomaly with a cable force deviation rate of higher than 1%.

1. Introduction

Cable-stayed bridges are widely used long-span bridges composed of a central beam, stay cable, and main tower, where the stay cable undertakes the load transfer between the cable tower and the main beam. The stay cable is not only the key stressed component of cable-stayed bridges but also the weakest component. In long-term service, stay cables suffer environmental erosion, traffic load, and natural disasters, which inevitably lead to corrosion, wire breakage, fatigue, and other damage. If these kinds of damages are not detected and rectified in time, they will seriously impact the mechanical properties and service life of the stay cable and even threaten the safety of the whole bridge [1]. Although many non-destructive testing methods are used to detect damage to stay cables, such as magnetic flux leakage testing, magnetostrictive sensors, and vibration-based methods, there are still many limitations in the application conditions and detection results [2,3]. Changes in cable force can most directly reflect the safety state of the stay cable. Therefore, the real-time monitoring and detection of cable forces are important components of the health monitoring systems of cable-stayed bridges [4,5].
The actual cable force of cable-stayed bridges can be measured by using various techniques, such as the pressure gauge method, the magnetic flux method, and the vibration frequency method [6]. In particular, cable force monitoring technology based on optical fiber sensing enjoys the advantages of high precision, excellent durability, and outstanding anti-electromagnetic interference ability. Therefore, it has been widely used in the online monitoring of cable force [7,8,9,10]. After analyzing the cable force data, it can be judged whether the cable force is abnormal by setting a threshold. For example, China’s highway bridge evaluation standards stipulate that when the deviation rate of the measured cable force ( deviation   rate = ( measured   cable   force design   cable   force ) / design   cable   force   ×   100 % ) exceeds ±10%, the cable force is assumed to be abnormal [11]. The American Association of State Highway and Transportation Officials (AASHTO) uses 75% of the standard cable force value as the early warning threshold for judging cable force anomalies [12]. However, the disadvantage of using empirical threshold methods is that if the threshold is set too high, some minor cable force anomalies caused by cable wire breakage, cable relaxation, and the load of heavy-duty vehicles are missed. These minor cable force anomalies will not immediately change the performance of the cable, but over time, they may damage the cable under high-stress conditions [13]. A too-low threshold can also lead to a misreporting of the cable force anomaly due to the influence of ambient temperature [14,15,16]. Too many misreports affect the regular operation of bridges; the identification of minor force anomalies must exclude the influence of ambient temperature.
In recent years, several methods have been proposed to reduce the influence of ambient temperature on the measured cable force data. For example, Ren et al. [17] proposed a linear regression method to establish the correlation between cable force and temperature. Moreover, Wang et al. [18] utilized the finite element method to eliminate the influence of ambient temperature on the monitored data of cable force. It is worth noting that Cross et al. [19] proposed the use of cointegration between monitoring data and ambient temperature data to eliminate the impact of ambient temperature. Cointegration is an economic data analysis method. Several researchers have used the cointegration method to eliminate the influence of ambient temperature and to realize the damage identification of the structure [16,19,20,21]. Cointegration is also used to analyze cable force. Fan et al. [12] employed the cointegration approach to analyze the influence of temperature on measured cable force data. Using a finite element simulation, they proved that this method could effectively determine the cable force anomalies caused by heavy vehicles, snowfall, and cable damage. Although these aforementioned methods can eliminate the effect of ambient temperature on cable force, they all require ambient temperature for calculations, which can lead to erroneous results when the ambient temperature is inaccurate (in the case of failure or if the temperature measurement position is far away from the cable force measurement position). Generally, minor cable force anomalies are more challenging to identify than large ones for two reasons: first, changes in cable force caused by temperature interfere with the identification of minor anomalies, and the existing methods can be influenced further by inaccurate ambient temperatures; and second, the methods used are not sensitive to minor anomalies.
Aiming at the above shortcomings and difficulties of cable force anomaly detection, we propose a method for identifying cable force anomalies based on the ratio of short-time-average cable force characteristics to long-time-average cable force characteristics (STA/LTA). The devised method eliminates ambient temperature interference in the cable force without measuring the ambient temperature, accurately and quickly determining any abnormal changes in cable force. We also verified the effectiveness of this method by analyzing the anomalies in the measured cable force of the Xiangjiang Bridge in Dongzhou, Hengyang, China, using its health monitoring system. This work attempts to remedy the shortcomings of the current methods for detecting cable force anomalies, providing a more accurate basis for the evaluation of the state of cables on cable-stayed bridges.

2. Short-Time-Average over Long-Time-Average Method for Anomaly Detection

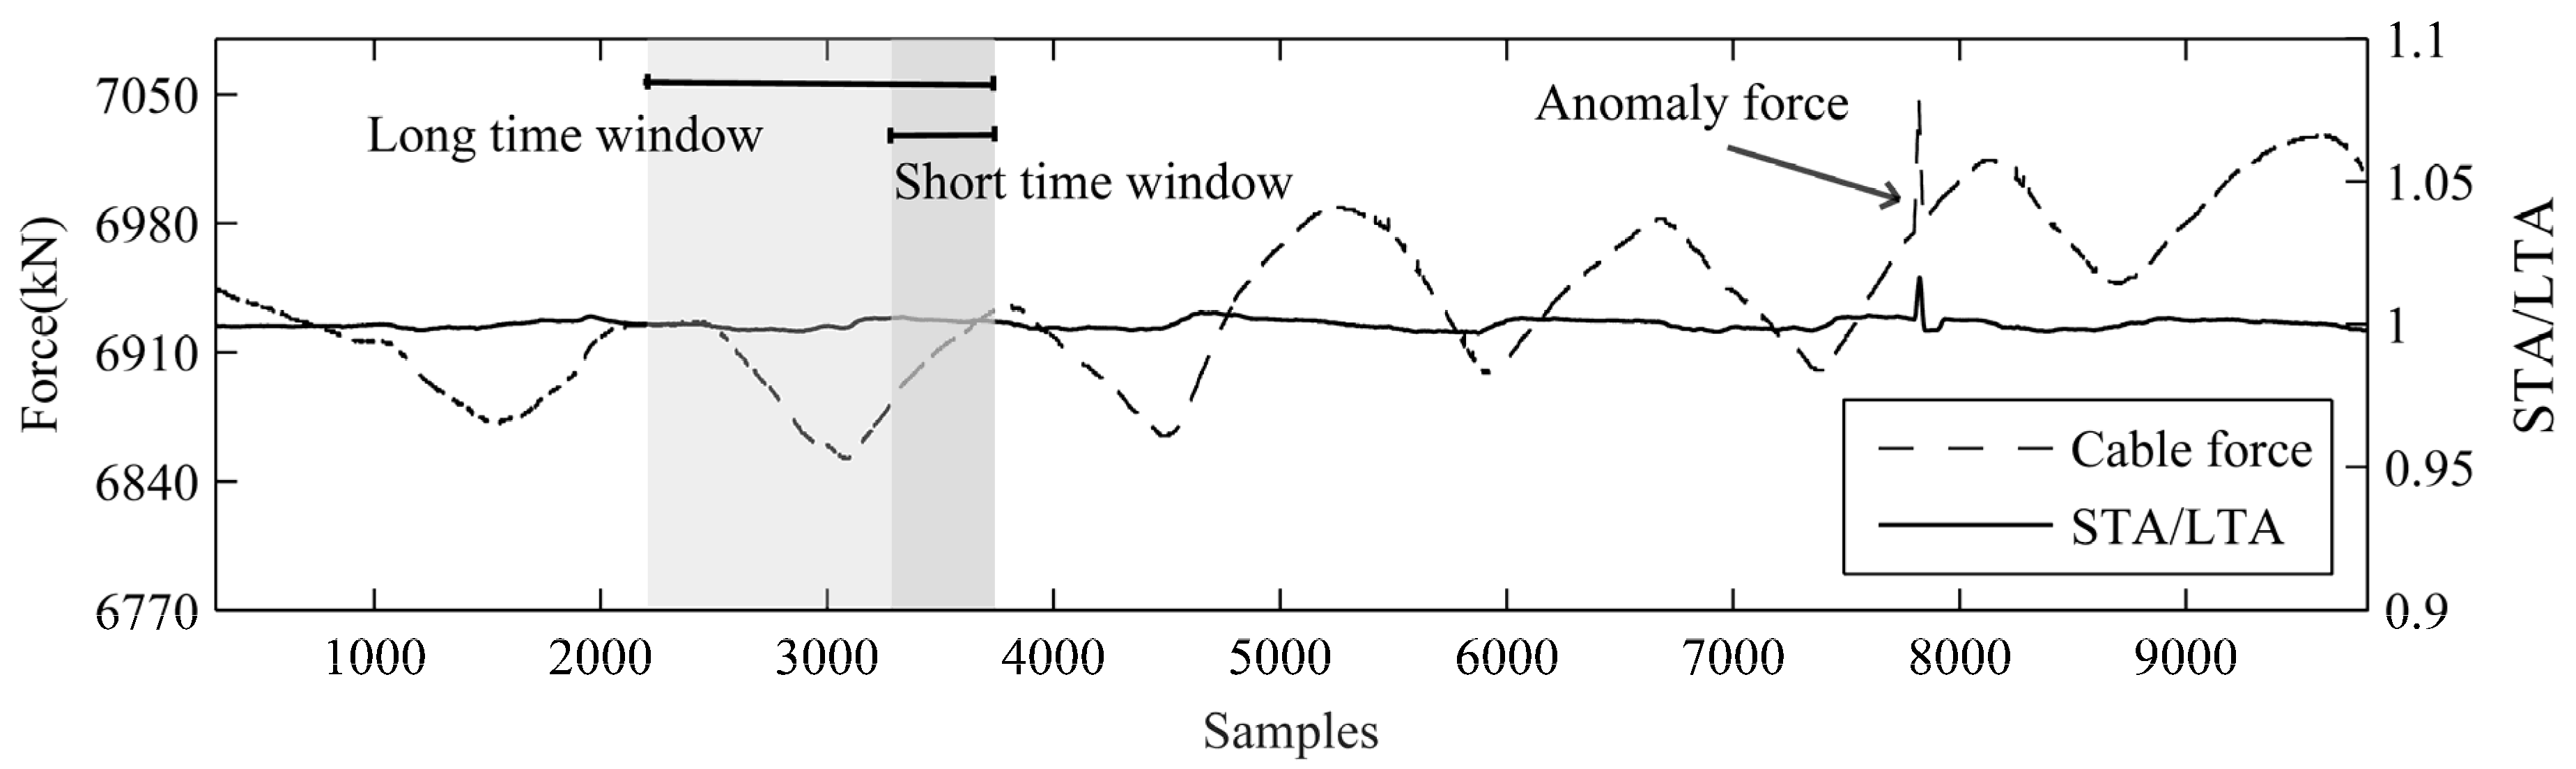
2.1. Principle of the Short-Time-Average over Long-Time-Average Method

The STA/LTA method is a signal triggering algorithm proposed by Stevenson, primarily used for the automatic detection of seismic signals [22,23]. The LTA is the average value of the long-time window characteristics of the signals and reflects their long-time state. The STA is the average value of the short-time window characteristics of the signals and indicates their short-time state. The ratio of the STA to the LTA can represent the abnormal changes in the amplitude, frequency, and energy of the signals in a short time. Figure 1 depicts the determination principle of the short-time-average over long-time-average method. Taking the data on the cable force as the signal, the corresponding STA/LTA can be calculated for each data point of the signal. The STA/LTA of the standard signal is approximately one. When the signal is abnormal, the STA/LTA quickly reaches the preset trigger threshold I to determine the signal anomaly.
Equation (1) expresses the formula for calculating the STA/LTA [22]:
A n o m a l y :    STA i LTA i = i N + 1 i CF ( x i ) / N i M + 1 i CF ( x i ) / M R o r 2 R
where i is the current time; STAi represents the average value of the short time window signal; LTAi indicates the average value of the long time window signal; CF(xi) denotes the characteristic function of signal xi; N stands for the length of the short time window (that is, the total number the signal data points in the short time window); M is the length of the long time window (that is, the total number of signal data points in the long time window (M > N)); R indicates the threshold of the signal increase anomaly; an 2 − R is the threshold of the signal reduction anomaly. The characteristic function, the length of the short time window, the length of the long time window, and the threshold are essential for the accuracy of the STA/LTA method and should be determined according to the signal characteristic.

2.2. Selection of Characteristic Function

The commonly used characteristic functions include CF 1 ( x i ) = x i 2 ( x i 1 x i + 1 ) 2 [23], CF 2 ( x i ) = | x i x i 1 | [24], and CF 3 ( x i ) = x i 2 [25]. The principle of selecting the characteristic function is that it can effectively mitigate interference and is sensitive to abnormal changes in signals. In order to select the characteristic function suitable for detecting cable force anomalies, we chose a section of the measured cable force data, added the assumed cable force anomalies, and compared and analyzed the changes in the STA/LTA calculated using the above characteristic functions. Figure 2 delineates the results.
Figure 2 demonstrates that the STA/LTA calculated using the characteristic function CF 3 ( x i ) = x i 2 significantly reduces the temperature interference (temperature causes the cable force to fluctuate) and is most sensitive to abnormal changes in the cable force. When the cable force abruptly increases or decreases, the ratio of the STA to the LTA significantly increases or decreases accordingly.
Therefore, CF3(xi) is selected as the characteristic function of the cable force. CF3(xi) is then improved to obtain the final cable force characteristic function, CF(Fi), to avoid an LTA value of zero when the cable force data equals zero:
CF ( F i ) = ( | F i | + 0.01 ) 2
where Fi is the measured cable force (kN) data at a particular time.

2.3. Determination of Long and Short Time Windows and Threshold

The above characteristic function, CF(Fi), calculates the STA/LTA; the length of the short time window, the length of the long time window, and the trigger threshold are empirical parameters that need to be set based on a large number of cable force anomalies. In the regular operation of a cable, anomalies rarely occur, so it is necessary to obtain a large amount of abnormal cable force data through simulation. Although abnormal cable force data can be simulated using the finite element method [12], the simulated data lack actual interference and noise, which is quite different from the measured data. The cable force anomaly achieved by randomly changing the cable force in the measured data is simulated to generate abnormal cable force data that are more in line with the actual situation. The specific process is to randomly select a particular time for monitoring cable force data so that the cable force at that time increases or decreases by 1–10% [11,12], a cable force deviation rate of 1–10%. Using the above random generation method of cable force anomalies, 400 samples of cable force data were generated from the actual measured cable force data of the Xiangjiang Bridge monitoring system (see Section 3.1 for further details), of which 200 samples contained anomalies and the other 200 samples had no anomalies, with each sample containing 2000 data points. These 400 samples were used to test the performance of STA/LTA with different parameters (N, M and R).
The identified abnormal cable force results are divided into four cases: the true positive (TP), indicating that there is an anomaly, and it is identified; the true negative (TN), denoting that there is an anomaly, but it is not identified; the false positive (FP), implying that there is no anomaly, but one is identified; the false negative (FN), indicating that there is no anomaly, and no anomaly is found. The cable force data sample has balanced abnormal data and normal data, so the accuracy (P) expressed by Equation (3) can evaluate the detection effect at different parameters:
P = T P + T N T P + F N + F P + T N
This work selects short time window lengths of 10, 30, and 50; long time window lengths of 100, 300, and 500; and thresholds of 1.005, 1.010, and 1.015, and uses the STA/LTA method to determine the abnormal cable force data samples. The test results presented in Table 1 demonstrate that the STA/LTA method has the highest accuracy (P = 0.955) when N = 30, M = 300, and R = 1.01.

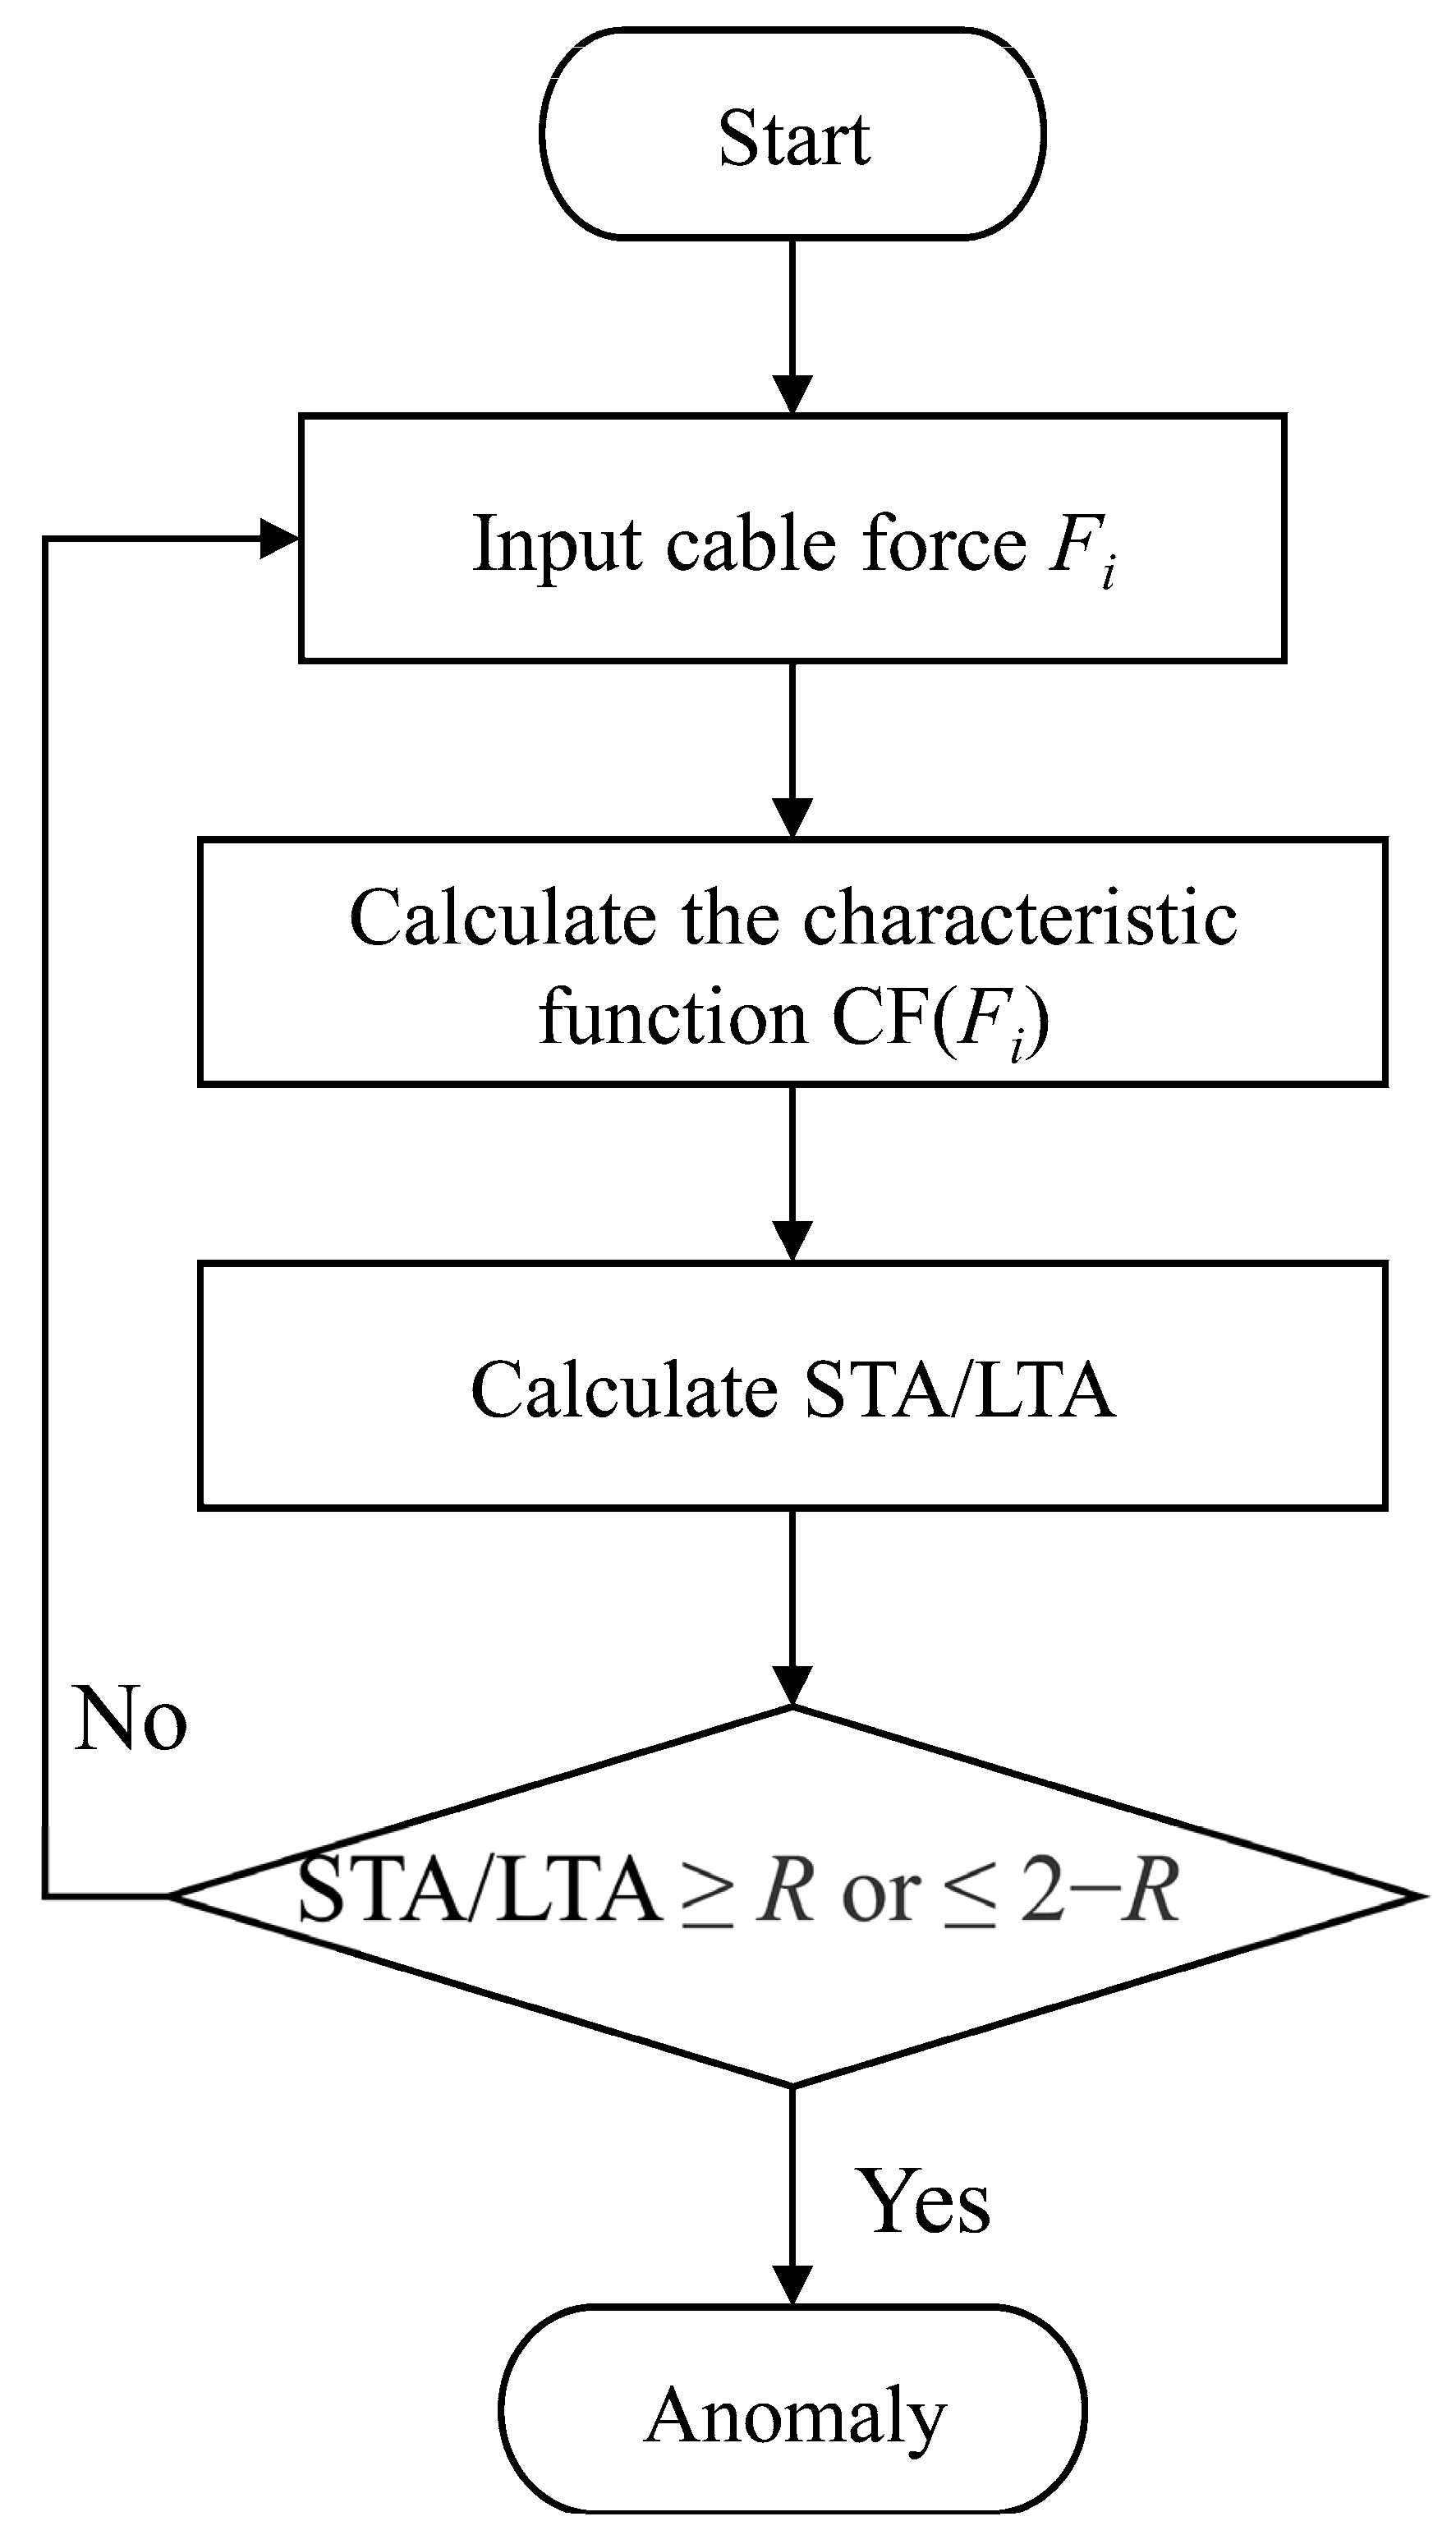
2.4. Automatic Detection Process of Cable Force Anomalies

By adopting the optimal characteristic function, CF(Fi), the corresponding length of the short time window, the length of the long time window, and the trigger threshold, the following steps can be taken to realize the continuous automatic detection of cable force anomalies (Figure 3):
(1)
Take the measured cable force data, F(i), of the monitoring system as the input;
(2)
Calculate the characteristic function, CF(Fi), using Equation (2);
(3)
Calculate the value of the STA/LTA by Equation (1);
(4)
Use the trigger threshold to judge the cable force anomaly. When the STA/LTA ≥ R, the cable force increases abnormally, and when the STA/LTA ≤ 2 − R, the cable force decreases abnormally; the maximum or minimum point of the STA/LTA is taken as the cable force anomaly point;
(5)
If there is an anomaly, a warning message is given; otherwise, return to step (1) to continue the next round of calculations.

3. Test

3.1. Project Background

The Xiangjiang Bridge in Dongzhou, Hengyang, China, is a three-tower, single-cable plane, low concrete tower, cable-stayed bridge with a span of 120 + 2 × 210 + 120 m, a main tower height equal to 35 m, with 192 stay cables in total. The stay cables adopt the steel-strand, cable-group anchorage system, with a single cable-plane, double-row cable layout, which is fixed at the central separation belt of the main beam. The bridge is equipped with a health monitoring system, and a total of 21 cables are equipped with fiber Bragg grating cable force sensors. Figure 4 and Figure 5 display the specific layout locations. The effective cable force has been stored in real-time since July 2019; it should be noted that the bridge was completed at the end of January 2019 and has not been opened yet.

3.2. Detection of Cable Force Anomalies

The measured cable force data from 19 July 2019 to 10 December 2019 were downloaded from the bridge health monitoring system. During this period, the sensors continuously and stably collected cable force data once a minute. The force data of cables 10-9-YX, 10-6-YS, and 10-15-YS are missing due to sensor failure, so there are only 18 cable samples providing data. The STA/LTA method was employed to detect the cable force of these 18 cables. The results listed in Table 2 demonstrate that the cable force of each cable is abnormal, the range of the abnormal change is not extensive, and the cable force deviation rate is between 1.0% and 4.8%.
The occurrence time of the identified cable force anomalies shows that all the cable force anomalies are concentrated on 3 September 2019 and 5 September 2019. To further analyze the cable force anomalies on these two days, we took cable 11-10-ZX, with the largest cable force deviation rate of +4.8%, as an example. As shown in Figure 6, there are five abnormal increases in the cable force indicated by red points, three on 3 September 2019, near data point 6000, and two on 5 September 2019, near data point 8000. It is worth noting that the temperature interference in Figure 6 causes significant cable force changes, even exceeding the three minor cable force anomalies determined. The STA/LTA method accurately identified the cable force anomaly and did not detect the temperature interference by mistake, indicating a strong resistance to temperature interference.
Figure 7 delineates the locally enlarged cable force anomaly presented in Figure 6. Anomalies ①, ②, ③, and ⑤ show that the cable force increases to the maximum value in 2–3 grades and then suddenly declines to the normal level; nevertheless, there is no grading of the cable force in anomaly ④. It takes approximately 1–2 h for each cable force anomaly to return to the normal, and the deviation rate of the cable force rises by 2.7–4.8%. These characteristics indicate that the bridge has experienced graded loading. After verification with the bridge department, it was found that bridge completion tests were carried out on 3 September 2019 and 5 September 2019, implying that the detected cable force anomaly was consistent with the bridge test situation in terms of the time and cable force deviation rate.
To further analyze the sensitivity of STA/LTA to cable force anomaly, we took cable 12-5-ZS, with the smallest cable force deviation rate of +1.0%, as an example. As shown in Figure 8, there are four abnormal increases in the cable force indicated by red points, one on 3 September 2019, near data point 6000 (Figure 8d), and three on 5 September 2019, near data point 8000 (Figure 8e). These cable force anomalies with a variation rate of 1–2.7% were correctly identified, proving that STA/LTA is very sensitive to cable force anomalies.

4. Discussion

The above test results demonstrate that the STA/LTA method can effectively detect cable force anomalies with a cable force deviation rate of higher than 1%. Compared with the existing cable force anomaly identification methods based on linear regression [17], finite element, [18] and cointegration [19], the main advantage of the STA/LTA method is that it does not need ambient temperature to eliminate the interference of ambient temperature, which can not only avoid misjudgment caused by inaccurate ambient temperature but also can be used for cable tension without ambient temperature. The basic idea of the STA/LTA method is to detect cable force anomalies through the difference between the long-term and short-term cable force change. The key is to reasonably set the characteristic functions to mitigate the temperature interference in the long-time-window characteristics and strengthen the cable force anomaly in the short-time-window characteristics. This idea is inspired by the seismic phase detection method, where the signal change caused by the first arrival of the P or S wave determines the accurate arrival time of the P and S waves. At present, the STA/LTA method is widely used in seismic monitoring systems. Therefore, this study attempts to remedy the shortcomings of the existing cable force detection methods. Furthermore, some helpful insights are obtained through the intersection of different disciplines.
The STA/LTA method can identify smaller cable force anomalies more accurately than the existing anomaly detection methods and is conducive to accurately evaluating the state of cables and prolonging cable life. The cables of cable-stayed bridges inevitably suffer from various operational effects, causing cable force anomalies. Some cable force anomalies are significant and easily identified, enabling them to be handled in time. However, some anomalies are minor and difficult to notice, but they will inevitably damage cables over time. Therefore, it is necessary to comprehensively collect and accumulate abnormal cable force information in a timely manner to ensure the accuracy of cable state assessments. By adding random anomalies to the measured cable tension data, 200 abnormal data were obtained, most of these random anomalies could be identified using the STA/LTA method, and the random anomalies represented most of the real anomalies, which shows that the STA/LTA method can accurately identify many types of anomalies. Moreover, the process or cause of the anomaly can be deduced through the comprehensive analysis of cable force anomalies. For example, the cable force anomalies of the Xiangjiang Bridge were due to completion tests, confirming the accuracy and practicability of the method developed herein in practical applications; the method is also conducive to tracking and preventing the factors that may damage cables.
The STA/LTA method eliminates the trend of the signal and highlights the anomaly of the signal through the ratio of the short time window feature to the long time window feature, independent of the physical meaning of the signal itself. Although the STA/LTA method was developed to identify the cable force anomalies of cable-stayed bridges, its application is not limited to the cables of cable-stayed bridges, and it can also be used to identify the abnormal monitoring signals of other types of structures. When this method is applied to the cables of different cable-stayed bridges or structures, it is necessary to utilize the measured cable force data to optimize and adjust the length of the short time window, the length of the long time window, and the threshold. Section 2.3 describes the specific optimization and adjustment processes. The Xiangjiang Bridge is new and has not been opened to traffic yet. Therefore, only abnormal increases in the cable force exist in the measured cable force data; changes in the cable force data will be more complex in the daily operation of the cable-stayed bridge. In a follow-up study, more measured data on cable forces are needed to optimize the STA/LTA method so as to improve its accuracy in complex environments. In addition, in the long-term cable monitoring process, the abnormal cable force events automatically recorded by this method can be employed to establish a data set of the abnormal historical events of the cable to provide essential data that support the intelligent analysis of the cable anomalies. For example, Li et al. [7] used the abnormal cable force data caused by vehicle load to identify the state of the cable force.

5. Conclusions

The main conclusions that follow from the findings of the current work are as follows:
The operational environment of cable-stayed bridges is complex, and various abnormal changes occur in the monitored data on cable force. Minor cable force anomalies are often ignored by monitoring systems, but these anomalies can cause extensive damage to cables over time. Therefore, this study develops a method suitable for detecting minor cable force anomalies based on the STA/LTA method.
First, the characteristic function of the STA/LTA method, which can effectively mitigate temperature interference and is highly sensitive to cable force, was determined according to the variation characteristics of the measured cable force data. Then, based on these data, the cable force anomaly was simulated; the optimal values of the length of the short time window, the length of the long time window, and the threshold were determined, and the cable force anomalies with a cable force deviation rate higher than 1% were detected. Finally, the flow chart for the automatic calculation of the STA/LTA method was presented.
Using monitored data on the Xiangjiang Bridge in Dongzhou, Hengyang, China, and applying the STA/LTA method, we detected five cable force anomalies with a cable force deviation rate ranging from +1% to +4.8%. The identified cable force anomalies were in agreement with five actual bridge completion tests in terms of the time and the cable force deviation rate, indicating that our method is effective in practical applications.
The STA/LTA method does not require ambient temperature, and the principle is simple and easy to program for implementation. It can automatically detect cable force anomalies, accurately record the abnormal changes in cable force data, and provide comprehensive, essential data support for evaluating the state of cable components. Therefore, this study provides a new research idea for detecting cable force anomalies in theory and a practical detection method for ensuring the safety of cables on cable-stayed bridges.

Author Contributions

Conceptualization, Y.W. and W.Z.; methodology, Y.W.; software, Q.Z. and Y.L.; validation, Q.Z. and Y.L.; investigation, Q.Z. and Y.L.; resources, W.Z.; data curation, W.Z.; writing—original draft preparation, Y.W. and Q.Z.; writing—review and editing, Y.W. and Q.Z.; visualization, M.Z.; funding acquisition, Y.W., M.Z. and W.Z. All authors have read and agreed to the published version of the manuscript.

Funding

This research was supported by the Guangxi Nature Science Foundation Program (grant number 2018GXNSFAA050145), the Guangxi Innovation Driven Development Project (Science and Technology Major Project, Grant (grant number Guike AA18118008), and the National Natural Science Foundation of China (grant number 51968016).

Institutional Review Board Statement

Not applicable.

Informed Consent Statement

Not applicable.

Data Availability Statement

The data used to support the findings and results of this study are available from the corresponding author upon request.

Acknowledgments

Our deepest gratitude goes to the anonymous reviewers for their careful work and thoughtful suggestions.

Conflicts of Interest

The authors declare no conflict of interest.

References

  1. Svensson, H. Cable-Stayed Bridges: 40 Years of Experience Worldwide; John Wiley & Sons: Hoboken, NJ, USA, 2013. [Google Scholar]
  2. Khedmatgozar Dolati, S.S.; Caluk, N.; Mehrabi, A.; Khedmatgozar Dolati, S.S. Non-Destructive Testing Applications for Steel Bridges. Appl. Sci. 2021, 11, 9757. [Google Scholar] [CrossRef]
  3. Khedmatgozar Dolati, S.S.; Malla, P.; Mehrabi, A.; Polanco, J.O.; Nanni, A. Non-destructive testing applications for in-service FRP reinforced/strengthened concrete bridge elements. In Proceedings of the SPIE 12047, Nondestructive Characterization and Monitoring of Advanced Materials, Aerospace, Civil Infrastructure, and Transportation XVI, Long Beach, CA, USA, 6 March–11 April 2022; Volume 12047, pp. 59–74. [Google Scholar] [CrossRef]
  4. Li, H.; Ou, J. The state of the art in structural health monitoring of cable-stayed bridges. J. Civ. Struct. Health Monit. 2016, 6, 43–67. [Google Scholar] [CrossRef]
  5. Al-Khateeb, H.T.; Shenton, H.W., III; Chajes, M.J.; Aloupis, C. Structural Health Monitoring of a Cable-Stayed Bridge Using Regularly Conducted Diagnostic Load Tests. Front. Built Environ. 2019, 5, 41. [Google Scholar] [CrossRef]
  6. Zhang, L.; Qiu, G.; Chen, Z. Structural health monitoring methods of cables in cable-stayed bridge: A review. Measurement 2021, 168, 108343. [Google Scholar] [CrossRef]
  7. Li, H.; Ou, J.; Zhou, Z. Applications of optical fiber Bragg gratings sensing technology-based smart stay cables. Opt. Lasers Eng. 2009, 47, 1077–1084. [Google Scholar] [CrossRef]
  8. Sun, X.; Wang, Q.M.; Zhu, M.; Wu, M.C. Application of optical fiber Bragg grating strain gauge to cable force monitoring of FAST. Opt. Precis. Eng. 2015, 23, 919–925. [Google Scholar] [CrossRef]
  9. Hu, D.; Guo, Y.; Chen, X.; Zhang, C. Cable force health monitoring of Tongwamen bridge based on fiber Bragg grating. Appl. Sci. 2017, 7, 384. [Google Scholar] [CrossRef]
  10. Zheng, R.; Liu, L.; Zhao, X.; Chen, Z.; Zhang, C.; Hua, X. Investigation of measurability and reliability of adhesive-bonded built-in fiber Bragg grating sensors on steel wire for bridge cable force monitoring. Measurement 2018, 129, 349–357. [Google Scholar] [CrossRef]
  11. Research Institute of Highway Science; Ministry of Transport. Specification for Testing and Evaluation of Highway Bridge Bearing Capacity JTG/T J21-2011; People’s Communications Publishing House Co., Ltd.: Beijing, China, 2011. (In Chinese) [Google Scholar]
  12. Fan, Z.Y.; Huang, Q.; Ren, Y.; Zhu, Z.Y.; Xu, X. A cointegration approach for cable anomaly warning based on structural health monitoring data: An application to cable-stayed bridges. Adv. Struct. Eng. 2020, 23, 2789–2802. [Google Scholar] [CrossRef]
  13. Xu, J.; Sun, H.; Cai, S. Effect of symmetrical broken wires damage on mechanical characteristics of stay cable. J. Sound Vib. 2019, 461, 114920. [Google Scholar] [CrossRef]
  14. Lepidi, M.; Gattulli, V. Static and dynamic response of elastic suspended cables with thermal effects. Int. J. Solids Struct. 2012, 49, 1103–1116. [Google Scholar] [CrossRef]
  15. Xia, Y.; Chen, B.; Zhou, X.Q.; Xu, Y.L. Field monitoring and numerical analysis of Tsing Ma Suspension Bridge temperature behavior. Struct. Control. Health Monit. 2013, 20, 560–575. [Google Scholar] [CrossRef]
  16. Shi, H.; Worden, K.; Cross, E.J. A regime-switching cointegration approach for removing environmental and operational variations in structural health monitoring. Mech. Syst. Signal Processing 2018, 103, 381–397. [Google Scholar] [CrossRef]
  17. Ren, Y.; Xu, X.; Huang, Q.; Zhao, D.Y.; Yang, J. Long-term condition evaluation for stay cable systems using dead load-induced cable forces. Adv. Struct. Eng. 2019, 22, 1644–1656. [Google Scholar] [CrossRef]
  18. Wang, J.F.; Zhang, J.T.; Xu, R.Q.; Yang, Z.X. Evaluation of Thermal Effects on Cable Forces of a Long-Span Prestressed Concrete Cable-Stayed Bridge. J. Perform. Constr. Facil. 2019, 33, 04019072. [Google Scholar] [CrossRef]
  19. Cross, E.J.; Worden, K.; Chen, Q. Cointegration: A novel approach for the removal of environmental trends in structural health monitoring data. Proc. R. Soc. A Math. Phys. Eng. Sci. 2011, 467, 2712–2732. [Google Scholar] [CrossRef]
  20. Dao, P.B.; Staszewski, W.J. Lamb wave based structural damage detection using cointegration and fractal signal processing. Mech. Syst. Signal Processing 2014, 49, 285–301. [Google Scholar] [CrossRef]
  21. Liang, Y.; Li, D.; Song, G.; Feng, Q. Frequency co-integration based damage detection for bridges under the influence of environmental temperature variation. Measurement 2018, 125, 163–175. [Google Scholar] [CrossRef]
  22. Stevenson, P.R. Microearthquakes at Flathead Lake, Montana: A study using automatic earthquake processing. Bull. Seismol. Soc. Am. 1976, 66, 61–80. [Google Scholar] [CrossRef]
  23. Allen, R. Automatic earthquake recognition and timing from single traces. Bull. Seismol. Soc. Am. 1978, 68, 1521–1532. [Google Scholar] [CrossRef]
  24. McEvilly, T.V.; Majer, E.L. ASP: An automated seismic processor for microearthquake networks. Bull. Seismol. Soc. Am. 1982, 72, 303–325. [Google Scholar] [CrossRef]
  25. Swindell, W.H.; Snell, N.S. Station Processor Automatic Signal Detection System. Phase I: Final Report, Station Processor Software Development, Report ALEX (01)-FR-77-01; AFTAC Contract F08606-76-C-0025; Texas Instruments: Dallas, TX, USA, 1977.
Figure 1. An example of the short-time-average over long-time-average (STA/LTA) method determining the cable force anomaly.
Sustainability 14 11373 g001
Figure 2. Examples of the characteristic functions calculating the cable force. (a) cable force with tow anomalies; (b) STA/LTA calculated using CF1; (c) STA/LTA calculated using CF2; (d) STA/LTA calculated using CF3.
Sustainability 14 11373 g002
Figure 3. Cable force anomaly automatic detection process using the STA/LTA method.
Sustainability 14 11373 g003
Figure 4. Full view of the bridge and positions of the points measuring cable force.
Sustainability 14 11373 g004
Figure 5. The plan of the points measuring cable force.
Sustainability 14 11373 g005
Figure 6. The abnormal increase in the force on cable 11-10-ZX. (a) Measured cable force of cable 11-10-ZX; (b) the location of cable 11-10-ZX (on middle tower); (c) STA/LTA calculated by the measured cable force; red points indicate cable force anomalies; red line indicates the cable 11-10-ZX.
Sustainability 14 11373 g006
Figure 7. The details of the abnormal increase in the force on cable 11-10-ZX. (a) Three cable force anomalies ①, ②, and ③ (red points) on 3 September 2019; (b) two cable force anomalies ④ and ⑤ (red points) on 5 September 20.
Sustainability 14 11373 g007
Figure 8. The abnormal increase in the force on cable 12-5-ZS. (a) Measured cable force of cable 12-5-ZS; (b) the location of cable 12-5-ZS (on right tower); (c) STA/LTA calculated by the measured cable force; (d) one cable force anomaly ① on 3 September 2019; (e) three cable force anomalies ②, ③ and ④ on 5 September 20; red points indicate cable force anomalies; red line indicates the cable 12-5-ZS.
Sustainability 14 11373 g008
Table 1. The results of the cable force anomaly detection using the STA/LTA method at different parameters.
Detection ResultsR = 1.005R = 1.010R = 1.015
N = 10
M = 100
N = 30
M = 300
N = 50
M = 500
N = 10
M = 100
N = 30
M = 300
N = 50
M = 500
N = 10
M = 100
N = 30
M = 300
N = 50
M = 500
TP182190169170184157151157128
FN181031301643494372
FP795741221000
TN121143159198198199200200200
P0.7570.8320.820.920.9550.890.8770.8920.82
Table 2. The results of the detected abnormal cable force.
Cable NumberDesign Cable Force
(kN)
Abnormal Increase in the Cable Force
NumberMaximum Deviation RateMinimum Deviation Rate
10-1-YX57954+1.8%+1.2%
10-4-ZX59775+2.3%+1.8%
10-11-ZS63325+2.4%+1.3%
10-16-ZX78445+3.9%+3.2%
11-14-YX73455+4.0%+2.9%
11-12-YS66555+4.2%+3.1%
11-8-YX61525+4.4%+3.4%
11-4-YS60524+2.7%+2.0%
11-1-ZS58515+2.8%+1.2%
11-10-ZX64385+4.8%+2.7%
11-16-ZS76185+3.8%+2.8%
12-15-YS77715+3.6%+1.7%
12-7-YX59005+3.0%+2.0%
12-3-YX59155+3.0%+1.7%
12-2-ZX58605+2.6%+1.2%
12-5-ZS60194+2.7%+1.0%
12-10-ZX65185+4.4%+2.1%
12-15-ZS76315+3.7%+2.5%
Publisher’s Note: MDPI stays neutral with regard to jurisdictional claims in published maps and institutional affiliations.

