Article

The Impact of Individual Differences on the Acceptance of Self-Driving Buses: A Case Study of Nanjing, China

Department of Industrial Design, Nanjing University of Science and Technology, Nanjing 210094, China
*
Author to whom correspondence should be addressed.
Sustainability 2022, 14(18), 11425; https://doi.org/10.3390/su141811425
Submission received: 2 August 2022 / Revised: 1 September 2022 / Accepted: 7 September 2022 / Published: 12 September 2022
(This article belongs to the Section Sustainable Transportation)

Abstract

:
As a new mode of public transportation, self-driving buses offer numerous benefits, including increased traffic safety, reduced energy consumption, optimized road-resource ratios, and improved traffic accessibility. However, there is still a need to fully understand the public’s perception of self-driving buses before they are widely used. As a result, we investigated whether individual differences (including demographic and personality traits) influence the acceptance of self-driving buses in Nanjing, China. A questionnaire was given to 453 people in Nanjing, and the sample data were analyzed using a one-way analysis of variance (ANOVA). According to the findings, gender, age, educational background, income level, frequency of use, and personality traits all had a significant impact on the acceptance of self-driving buses. This study’s findings provide empirical data to help guide future research on self-driving buses, as well as a theoretical foundation for self-driving-bus development and design.

1. Introduction

Automobiles are now the most common mode of transportation worldwide, and, each year, approximately 1.35 million people die in motor vehicle traffic accidents in countries all over the world according to relevant data [1]. As the country with the most car owners in the world, the United States has approximately 2.2 million injuries and 30,000 deaths due to road traffic accidents each year, with direct economic losses of up to USD 300 billion [2]. Human factors or improper operation are responsible for 90% of these accidents [3]. Fortunately, as technology advances, autonomous driving technology matures. Autonomous vehicles (AVs) can ensure vehicle safety through rigorous data calculations, reducing personal injuries from traffic accidents, as well as energy consumption and environmental pollution [4,5,6]. However, for the general public, the introduction of autonomous driving technology brings with it increased traffic risks and uncertainty, and, despite the numerous benefits of AVs, the general public is currently wary [7,8,9,10].
The public transportation network is one of the key issues in the planning and construction of large cities, and it is one of the criteria representing the degree of development and well-being of a city, which is closely related to the working lives of everyone in a city [11]. Self-driving buses, unlike AVs, are small- and medium-sized vehicles that can carry 10–20 passengers at the same time. They do not need to be operated by a passenger and can stop and drive on one or more defined routes by themselves. Self-driving buses have many advantages, such as reducing energy consumption, optimizing road-resource allocation, improving traffic accessibility, and increasing traffic operation efficiency [11,12,13,14,15]. Several companies around the world are already developing self-driving buses and conducting regional road tests, and some projects are ready for mass production. These projects include Apollo Baidu, EasyMile EZ10, Navya Arma, Olli, etc. [11] Studies in the relevant bodies of literature indicate that public acceptance of autonomous driving technology is generally low [12,16,17]. Therefore, the greatest obstacle to promoting the use of self-driving buses is not the technical aspect, but the level of public trust and acceptance. Thus, public acceptance is an important prerequisite for placing self-driving buses into service, and trust is an important influence on determining whether a person accepts a given technology [4,18,19,20,21]. The famous rule of “no trust, no use” is central to the design of automated systems [22]. Therefore, studying the public’s acceptance of self-driving buses is crucial and is also central to this study.
There are significant differences in the public acceptance of certain technologies between individuals, but how these differences manifest regarding self-driving buses is not yet known. The concept of “individual differences” includes aspects of demographics and personality traits [23,24]. Previous research has shown that individual differences can have an impact on the adoption of AVs. For example, women tend to be more apprehensive about AVs compared to men, and therefore less likely to adopt them [22]. Younger, more educated individuals are more likely to adopt AVs [25]. However, there is a lack of research in the existing literature on the impact of individual differences on the acceptance of AVs.
Given the importance of this research topic and the lack of existing literature on the status of studies investigating Chinese regions, we decided to conduct a survey in Nanjing, China, to investigate whether individual differences have an impact on the acceptance of self-driving buses. The survey collected data on respondents’ gender, age, region, educational background, marital status, income level, frequency of bus use, and personality traits. We analyzed the individual differences affecting the acceptance of self-driving buses based on these individual characteristics, aiming to improve the theoretical research related to self-driving buses and to promote the development, design, and iterative upgrading of self-driving buses.
This paper is structured as follows: Section 2 provides a review of the relevant research literature. Section 3 describes the method of data collection and the sample information. Section 4 presents the results of the data analysis. Section 5 discusses the findings as related to the existing literature. Section 6 summarizes the study.

2. Literature Review

2.1. Acceptance

“Willingness to use” is an important prerequisite for the acceptance of self-driving buses and is influenced by multiple factors. Studies have shown that public opinion can have a significant impact on the emergence and diffusion of new technologies, and that these effects can take a long time to eliminate [26,27]. Experience has a strong influence on the willingness to use new technologies. Willingness to use AVs tends to increase after experiencing them, as experience with the technology changes perceptions and greatly increases the willingness to use it when the experience meets or exceeds the expected experience [28,29,30]. An individual’s age, gender, and education level can likewise have an impact on the willingness to use. Studies have shown that younger drivers are more receptive to AVs [31]. Men are more likely to try AVs than women [22,32], and younger, more educated people are more likely to adopt AVs [25].
The level of trust in the technology strongly influences the acceptance of the technology, especially in the early stages of new technology diffusion. Studies on autonomous driving have also shown that trust is also an important influencing factor for the acceptance of autonomous driving [20,33,34]. Unlike conventional vehicles, the shift from a human-operated vehicle to a technology-controlled vehicle requires AVs users to fully trust the autonomous driving technology, so trust has a significant impact on acceptance [35,36,37].
“Safety” has always been a primary concern for the public, especially in the field of transportation. About 90% of the annual traffic accidents in countries around the world are caused by human factors [38]. AVs use radar (including millimeter-wave radar and LIDAR) installed in different locations, combined with cameras and ultrasonic sensors to detect the road environment around the vehicle; through artificial intelligence, they also use algorithms to process the information on the road—vehicles, obstacles, and other situations—enabling real-time, intelligent control of vehicle steering and driving speed, so that the vehicle, through the data calculations, is able to achieve safe driving goals. Compared with traditional vehicles, AVs will improve traffic efficiency and ensure the safety of road traffic. Agencies predict that, by 2040, the widespread use of AVs will reduce traffic accident rates by 80% [38,39,40].
The payment of additional fees is one of the important reference factors for the acceptance of autonomous driving technologies. Related studies have shown that the willingness to pay extra fees and the acceptable amounts vary by country and region [41]. A survey in France showed that participants were happy to pay additional fees for AVs, while another survey showed that people from the United States, the United Kingdom, and Japan were not willing to pay extra fees, whereas most people from China and India were willing to pay extra fees [32,42]. There was also an online survey of the U.S., the U.K., and Australia that showed that only 5% of people were willing to pay more than USD 30,000, and over a fifth had no willingness to pay additional fees [22].

2.2. Individual Differences

There are no two identical people in the world, and individual differences are the important characteristics that distinguish people from each other. Individual differences are psychological traits that evolve and can help each person to define his or her personality within the commonality [43]. Individual differences are often represented quantitatively by investigating demographic information and personality traits. Many new technologies have been developed or adopted initially by investigating the relevant effects on them through individual differences [23,24,44,45].
The gender of the person is an important influencing factor in their acceptance of AVs. According to Nordhoff et al. [46], based on a study of 116 countries and regions, men are more receptive to AVs compared to women. Females are less likely to adopt AVs than males because they consider more factors than males when adopting AVs [22]. Esterwood et al. [47] found, based on a study of 428 participants, that men were more likely to ride self-driving buses than women, and that women remained skeptical about the advantages of self-driving buses. Other studies have come to the opposite conclusion, finding that women prefer autonomous driving more than men do, and that they have a stronger intention to adopt AVs [34].
Age is another important influencing factor in the acceptance of self-driving buses. Through interviews with over 1000 drivers in the United States, the United Kingdom, and Australia, it was found that younger drivers were more likely to experience AVs than older drivers, but that these younger drivers were more interested in automated driving technology compared to experiencing AVs [22]. Older drivers expressed a greater distrust of AVs, while younger drivers showed a higher trust and willingness to use them [47,48]. Another study found that increasing age had a negative impact on the acceptance of new technologies, and, unlike younger people, older users were more susceptible to subjective perceptions [49].
Different state and ethnic beliefs, as well as different geographic regions of a country, can have an impact on the acceptance of self-driving buses. For example, surveys have shown that Asian Americans are more willing to take self-driving buses than Caucasian Americans, and Hispanics and Asians have expressed great anticipation that AVs will improve daily travel for people with some behavioral disabilities [47,50]. The study found that the working process of public transportation penetration varies significantly in the United States by geographic region. There are significant data differences in the purchase rate of electric vehicles in some regions of Northern Europe due to geographical differences, such as culture and beliefs [51,52].
Differences in education level can also have an impact on the acceptance of AVs. For example, Zhang et al. [25] found, through a survey of 443 U.S. drivers, that the acceptance of AVs was influenced by education level, and when higher levels of education were observed, acceptance of AVs was also higher, with a positive relationship effect. In contrast, those with higher levels of education display higher acceptance of new technologies and are more likely to install them in their vehicles [22].
Income level is likewise an important influencing factor. The income level will, to some extent, determine one’s attitude towards new technologies [32,41,42]. Schoettle and Sivak’s [22] study found that, in cases related to AVs, those respondents with lower incomes were more concerned with safety issues, and those with higher incomes were more concerned with the determination of accident liability in case processing. In the same way, one’s marital status will similarly determine one’s attitude toward new technologies. Single people are significantly more receptive to AVs than are married people [25]. Married individuals are more likely to focus on safety and consider more factors due to their married lives [22].
The impact of frequency of use on the acceptance of autonomous buses cannot be ignored. Frequency of use tends to change a person’s behavior and lead them to develop a fixed mindset, but it may lead to a slower awareness of new things. Research related to AVs has shown that people who drive cars frequently or who are experienced drivers are less interested in AVs [53]. Frequent bus riders are more likely to try self-driving buses than infrequent bus riders [47]. More surveys are needed to verify the effect of frequency of use on the acceptance of self-driving buses.
Personality traits are different from other individual differences and are more individualized. Personality is a characteristic set of behavioral, cognitive, and affective patterns which are shaped by biological and environmental factors, and which change over time [54]. A survey of 647 drivers in China found that drivers who remained optimistic and open to new things were more trusting and willing to adopt AVs; however, drivers who were less emotionally stable tended to have less trust in AVs [21]. Another survey of 443 drivers in the United States found that extroverted, emotionally stable drivers were more willing to consider AVs [25]. The “Big Five” personality traits include openness to experience, conscientiousness, extraversion, agreeableness, and neuroticism [55]. Openness to experience is a general appreciation for art, emotion, adventure, unusual ideas, imagination, curiosity, and variety of experience (e.g., I am someone who is original and comes up with new ideas). Conscientiousness is a tendency to display self-discipline, act dutifully, and strive for achievement against measures or outside expectations (e.g., I am someone who is reliable and who can always be counted on). Extraversion indicates that individuals enjoy interacting with other people and are often considered to be energetic people (e.g., I am someone who is outgoing and sociable). People who display agreeableness are usually considerate, kind, generous, trusting and trustworthy, helpful, and willing to compromise with others (e.g., I am someone who is compassionate and has a soft heart). Neuroticism is the tendency to experience negative emotions, such as anger, anxiety, or depression, and it is sometimes referred to as emotional instability, the converse of which is emotional stability (e.g., I am someone who worries a lot). We also use the Big Five personality traits to test respondents on personality traits.
In conclusion, through the literature review, we found that public acceptance of self-driving buses is influenced by individual differences. However, the number of relevant surveys is small, the depth is insufficient, and there is a lack of survey data and analytical findings from a large number of countries and regions.

3. Method

3.1. Survey

Due to the prevalence of the spread of COVID-19 and the control policies of the Chinese government, we decided to conduct a field investigation using Nanjing as an example. Nanjing is in the eastern part of China in the lower reaches of the Yangtze River. It is a mega-city in China, an important central city in the eastern region, a scientific research and education base, and a comprehensive transportation hub. The total area of the city is 6587.02 square kilometers. As of 2021, the resident population was 9,423,400, the urbanization rate was 86.9%, and the city’s gross regional product was CNY 1,635,532 billion. It is also a major industrial base and a national low-carbon pilot city in China. Another key reason for choosing Nanjing was the opening of the regional road experience of Robo-Bus, a self-driving minibus, in Nanjing’s Jiangxinzhou Islet (Future Mobility Demonstration Island and Smart Driving Innovation Zone) in October 2021.
The survey was conducted mainly among permanent residents of Nanjing, and a questionnaire, divided into two parts, was developed based on the research theme. The first part collected data on respondents’ gender, age, region, nationality, educational background, marital status, income level, frequency of bus use, and personality traits. In the second part, to measure respondents’ acceptance of self-driving buses, 5 items were implemented using a 7-point Likert scale (1 = minimum, 7 = maximum, and 4 = neutral). The survey was conducted according to the principle of random distribution in crowded places, such as in Nanjing Jiangxinzhou Islet and in large shopping malls. To ensure the accuracy of data collection, an offline face-to-face survey was used [56]. The survey process was anonymous to ensure that the respondents’ information was not leaked.
A total of 500 respondents participated in the survey and completed the questionnaire. We then randomly selected the sample data according to the same percentages, matching the latest published demographic data proportions, to constitute a specific subgroup of the population. Finally, 453 sample data were obtained. The demographic data table is shown in Table 1, the personality trait data are shown in Figure 1, and the acceptance rating scale is shown in Table 2.

3.2. Data Analysis

The purpose of this study was to investigate the differences in the acceptance of self-driving buses among specific subgroups of people. Therefore, we conducted an empirical investigation in Nanjing, China, to analyze the individual differences among specific subgroups of people based on representative sample data. To achieve a valid analysis of the data, we decided to conduct a one-way ANOVA using IBM’s SPSS statistics software. The significance level threshold for all data tests was set at 0.05, and the confidence interval was set at 95%. The scales were first tested for reliability and validity, and the thresholds were all greater than 0.7 according to exploratory factor analysis, indicating that the scales had good reliability. When equal variance was assumed (p > 0.05), Bonferroni’s correction was applied for post-hoc multiple comparisons. When equal variance was not assumed (p < 0.05), Tamhane’s T2 test was used for post-hoc multiple comparisons. In this article, the F-value was used to determine the between-group significance, and it is the ratio of the between-group to the within-group mean square. A larger value of this ratio indicates that the difference between groups is more significant and the difference within groups is less significant relative to the overall data. The p-value is a measure of the size of the difference between the control group and the experimental group; when the p-value is less than 0.05, it means that there is a significant difference between the two groups; when the p-value is less than 0.01, it means that the difference between the two groups is extremely significant. Eta-squared (η2) is an effect measure that represents the proportion of variance in the dependent variable explained by differences between groups, and it indicates a weak correlation between variables when η2 < 0.06, a moderate correlation when η2 < 0.16, and a strong correlation when η2 > 0.16.

4. Results

By performing a one-way ANOVA on the sample data with corrections via post-hoc multiple comparisons, we arrived at the results of the analysis (Table 3).

4.1. Gender

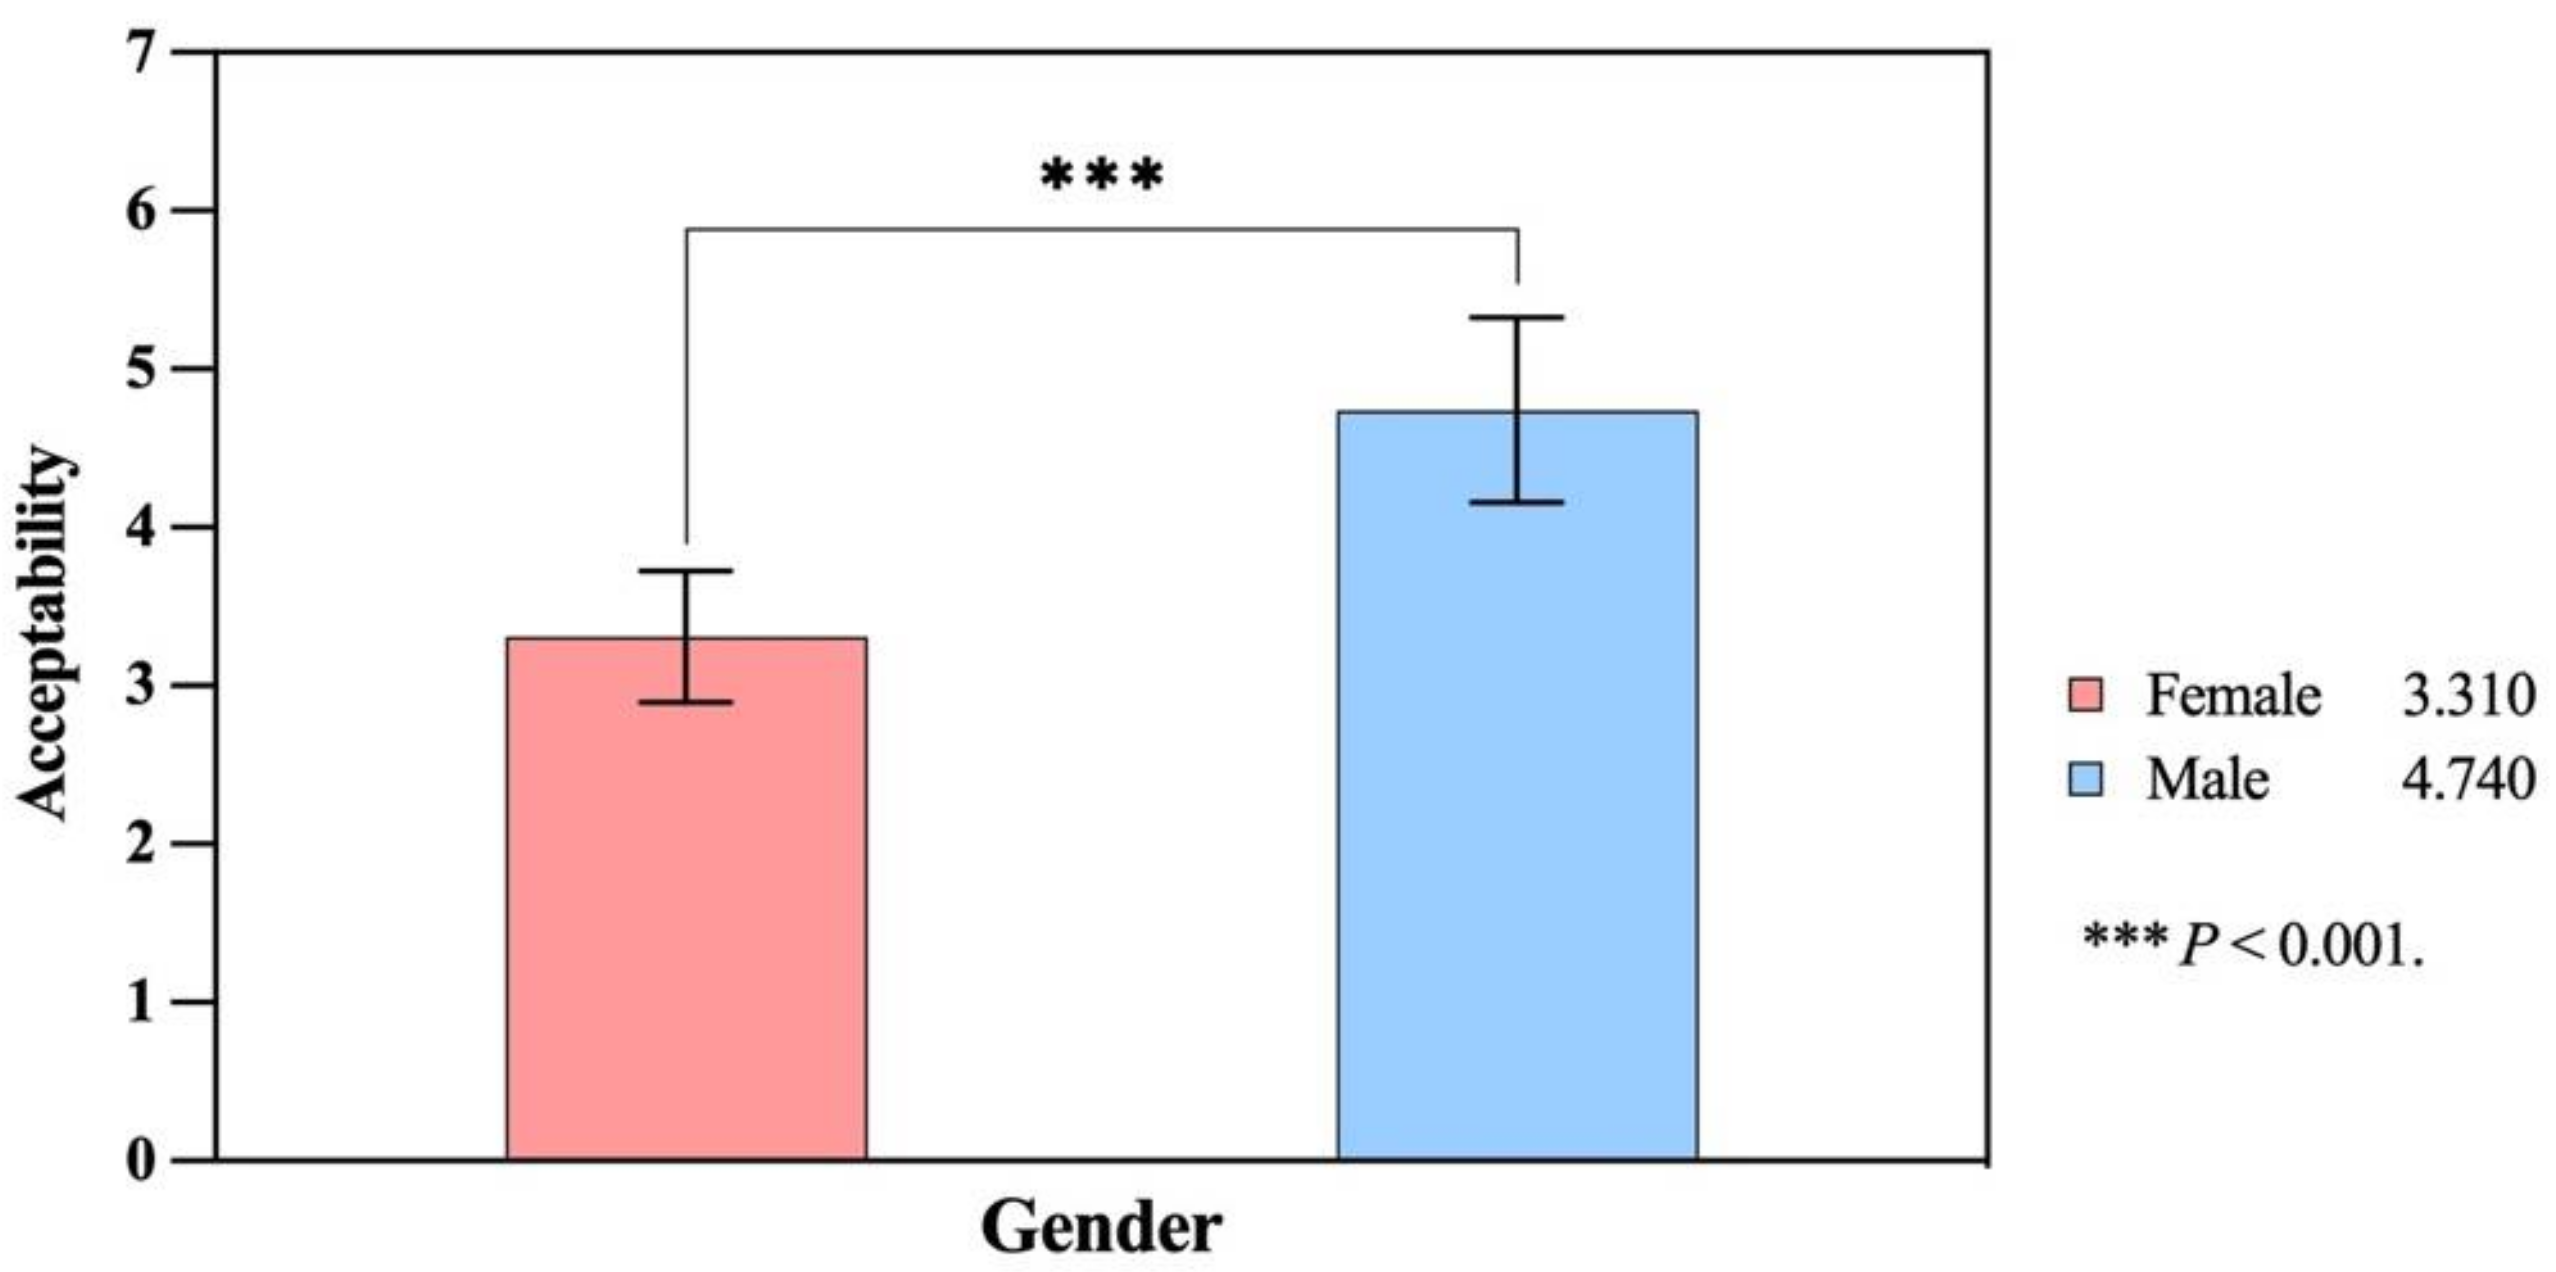
The one-way ANOVA showed that gender had a significant effect on the acceptance of self-driving buses (F = 211.292, p < 0.001, η2 = 0.319). Compared to females (Mean = 3.31, SD = 1.017), males (Mean = 4.74, SD = 1.074) were more receptive and more willing to accept self-driving buses. The results are shown in Figure 2.

4.2. Age

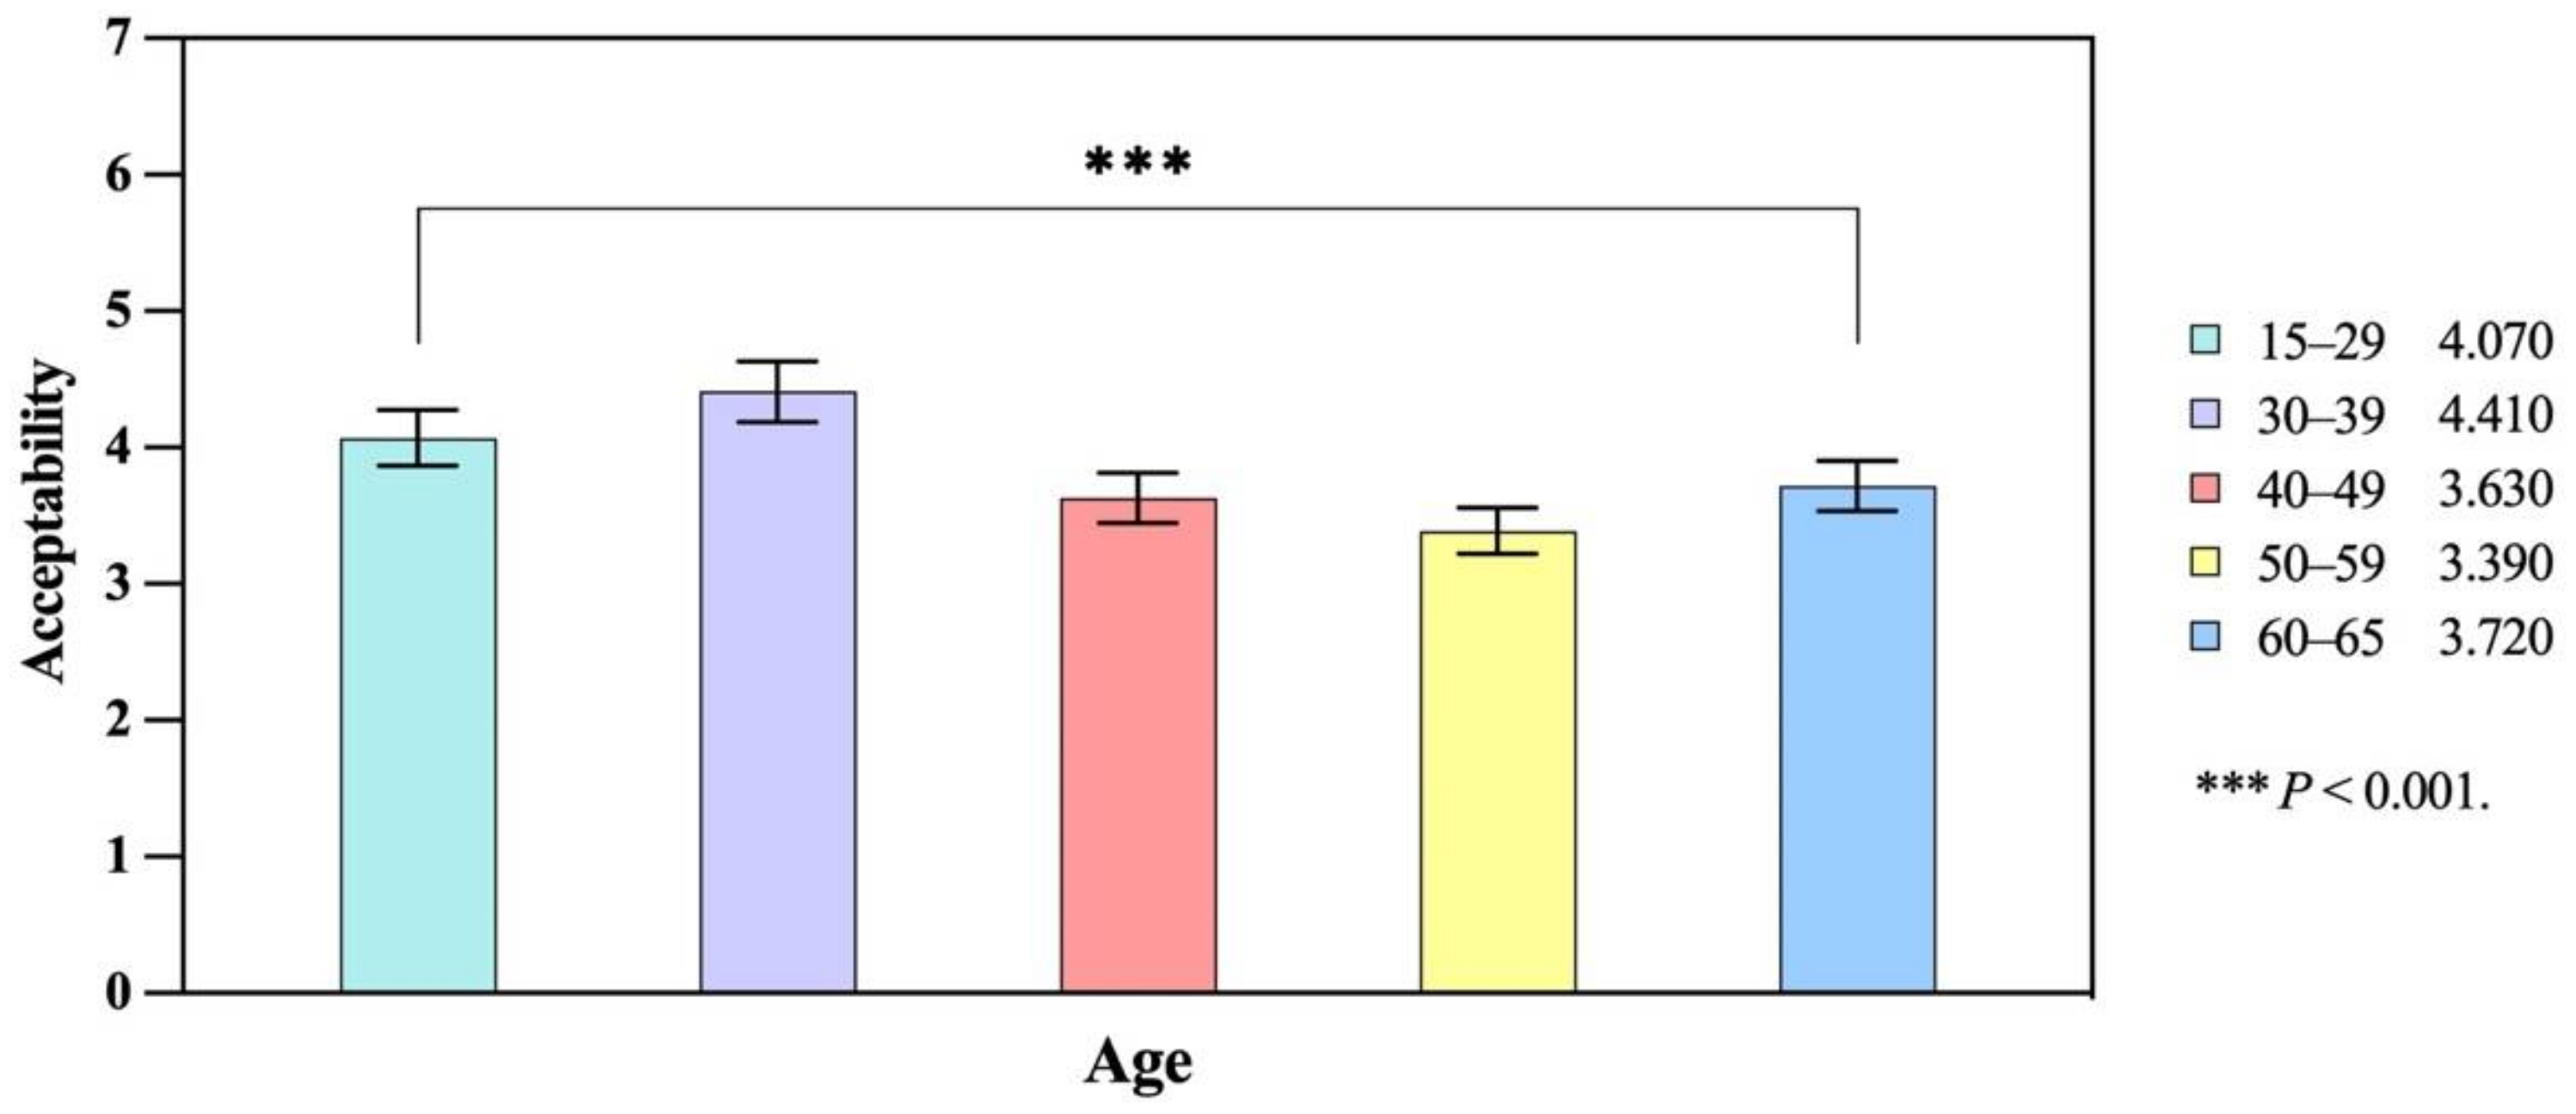
The one-way ANOVA showed that age had a significant effect on the acceptance of self-driving buses (F = 9.803, p < 0.001, η2 = 0.08). The highest level of acceptance and willingness to use self-driving buses was found among respondents in the 30–39-year-old (Mean = 4.41, SD = 1.200) age group. Then, respondents in the 15–29-year-old (Mean = 4.07, SD = 1.443), 40–49-year-old (Mean = 3.63, SD = 1.241), 60–65-year-old (Mean = 3.72, SD = 0.523), and 50–59-year-old (Mean = 3.39, SD = 0.812) age groups showed the lowest results. The results are shown in Figure 3.

4.3. Region

The one-way ANOVA showed that there was no significant effect from different regions (urban and rural) on the acceptance of self-driving buses (F = 0.202, p = 0.653, η2 < 0.001). The mean was slightly higher for urban respondents (Mean = 4.05, SD = 1.203) than for rural respondents (Mean = 3.97, SD = 1.640).

4.4. Educational Background

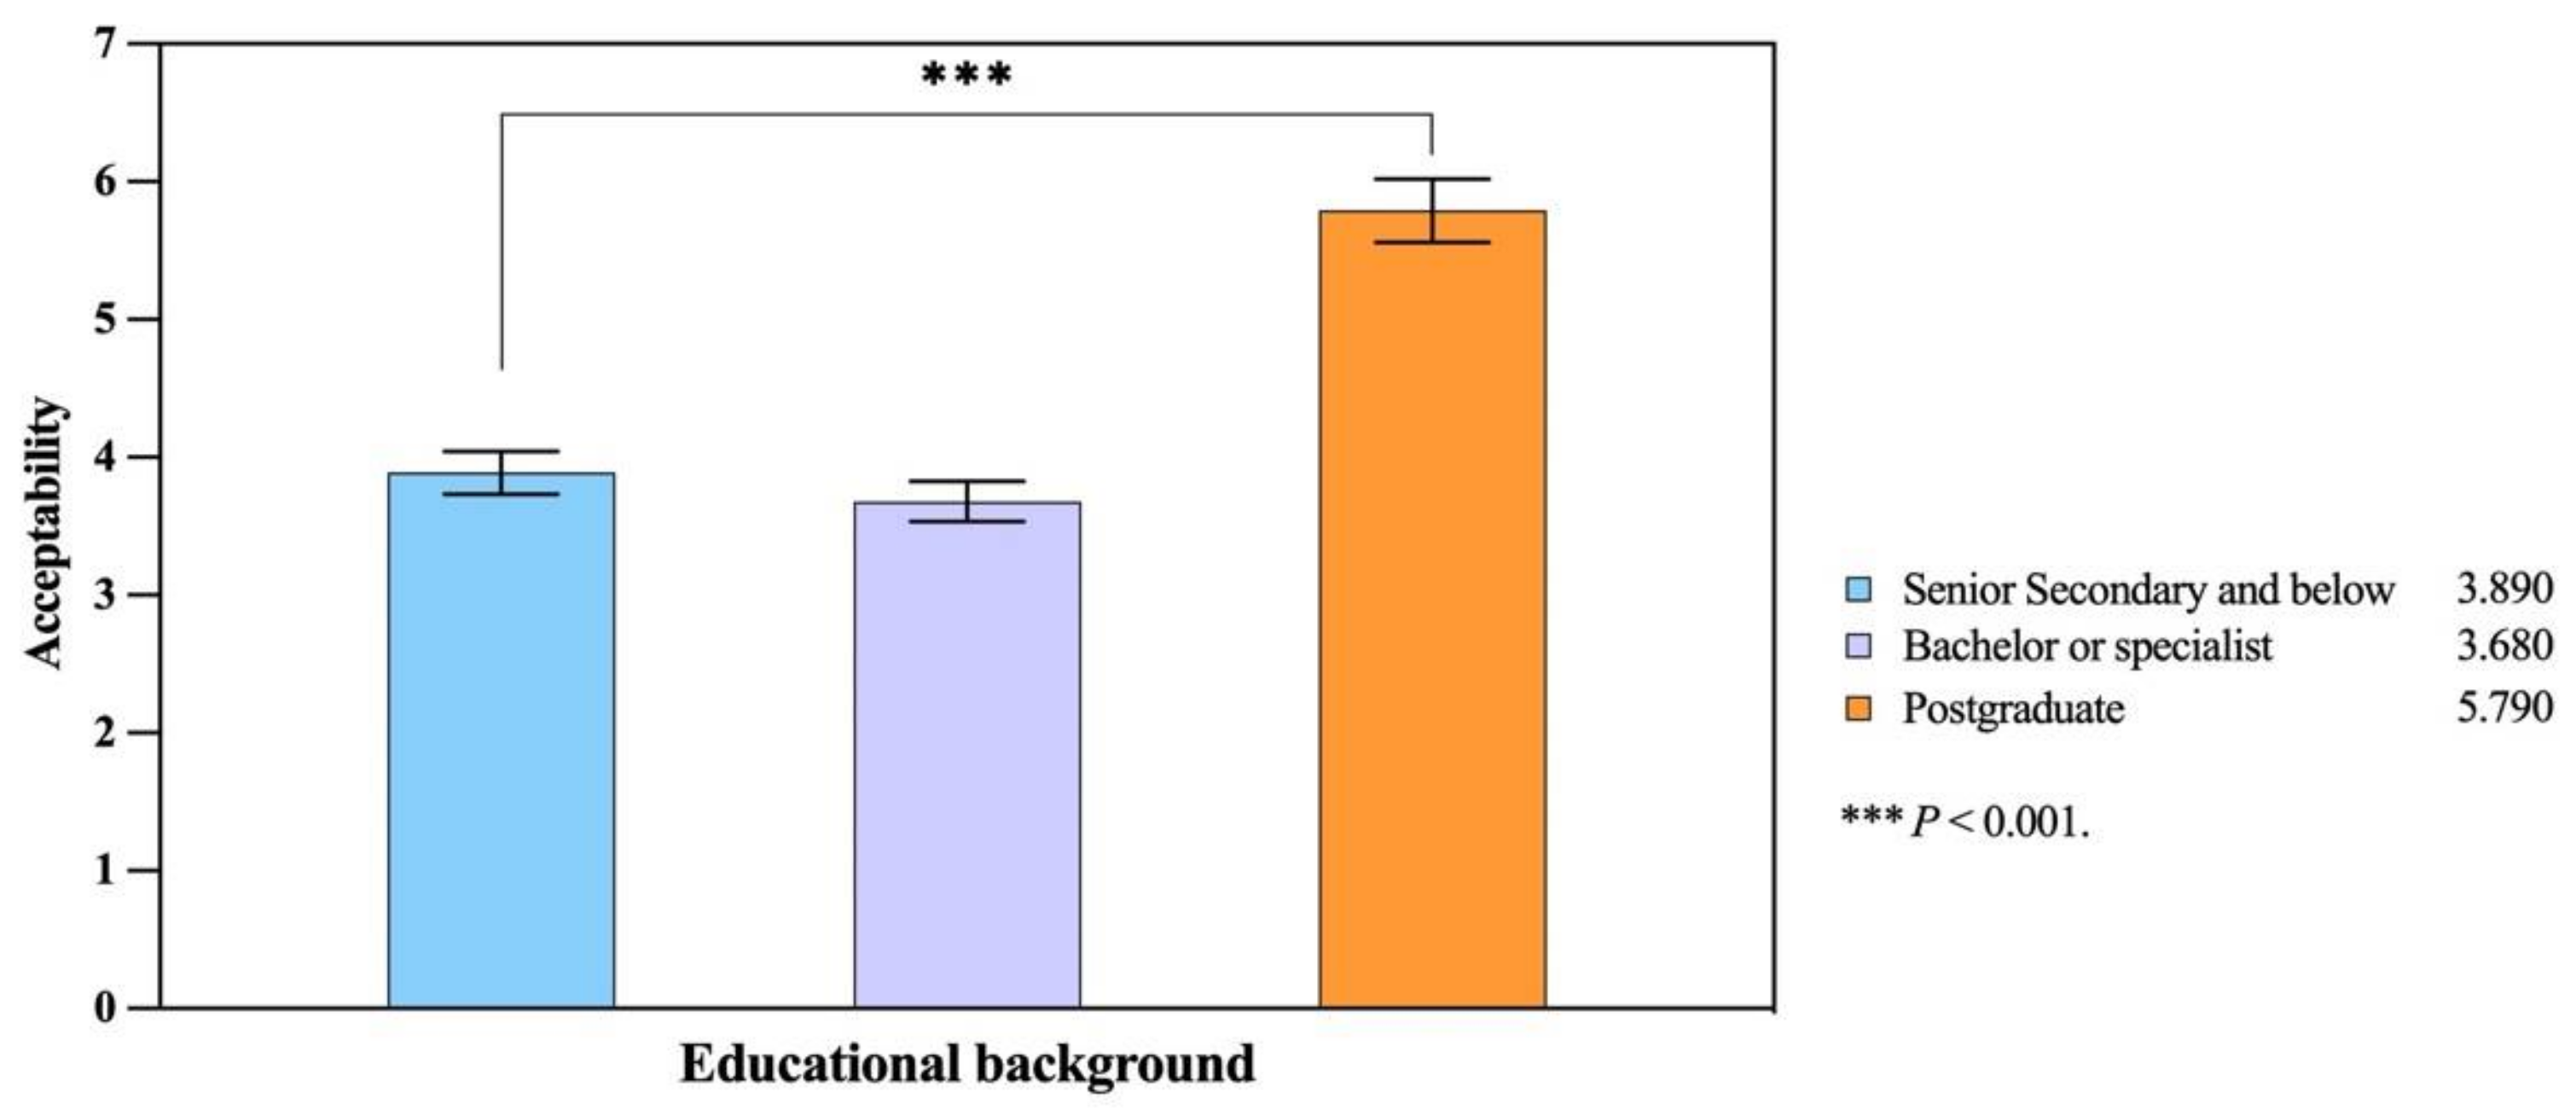
The one-way ANOVA showed that respondents with different educational backgrounds had significant differences in their acceptance of self-driving buses (F = 65.997, p < 0.001, η2 = 0.227). Respondents with postgraduate qualifications and above (Mean = 5.79, SD = 0.414) were more receptive and willing to accept self-driving buses, followed by high school and below (Mean = 3.89, SD = 1.189) and finally bachelor or college (Mean = 3.68, SD = 1.120). The results are shown in Figure 4.

4.5. Marital Status

The one-way ANOVA showed that there was no significant effect of marital status (unmarried, married) on the acceptance of self-driving buses (F = 1.674, p = 0.196, η2 = 0.004). The difference between the means of unmarried respondents (Mean = 3.93, SD = 1.392) and married respondents (Mean = 4.09, SD = 1.191) was very small.

4.6. Income Level

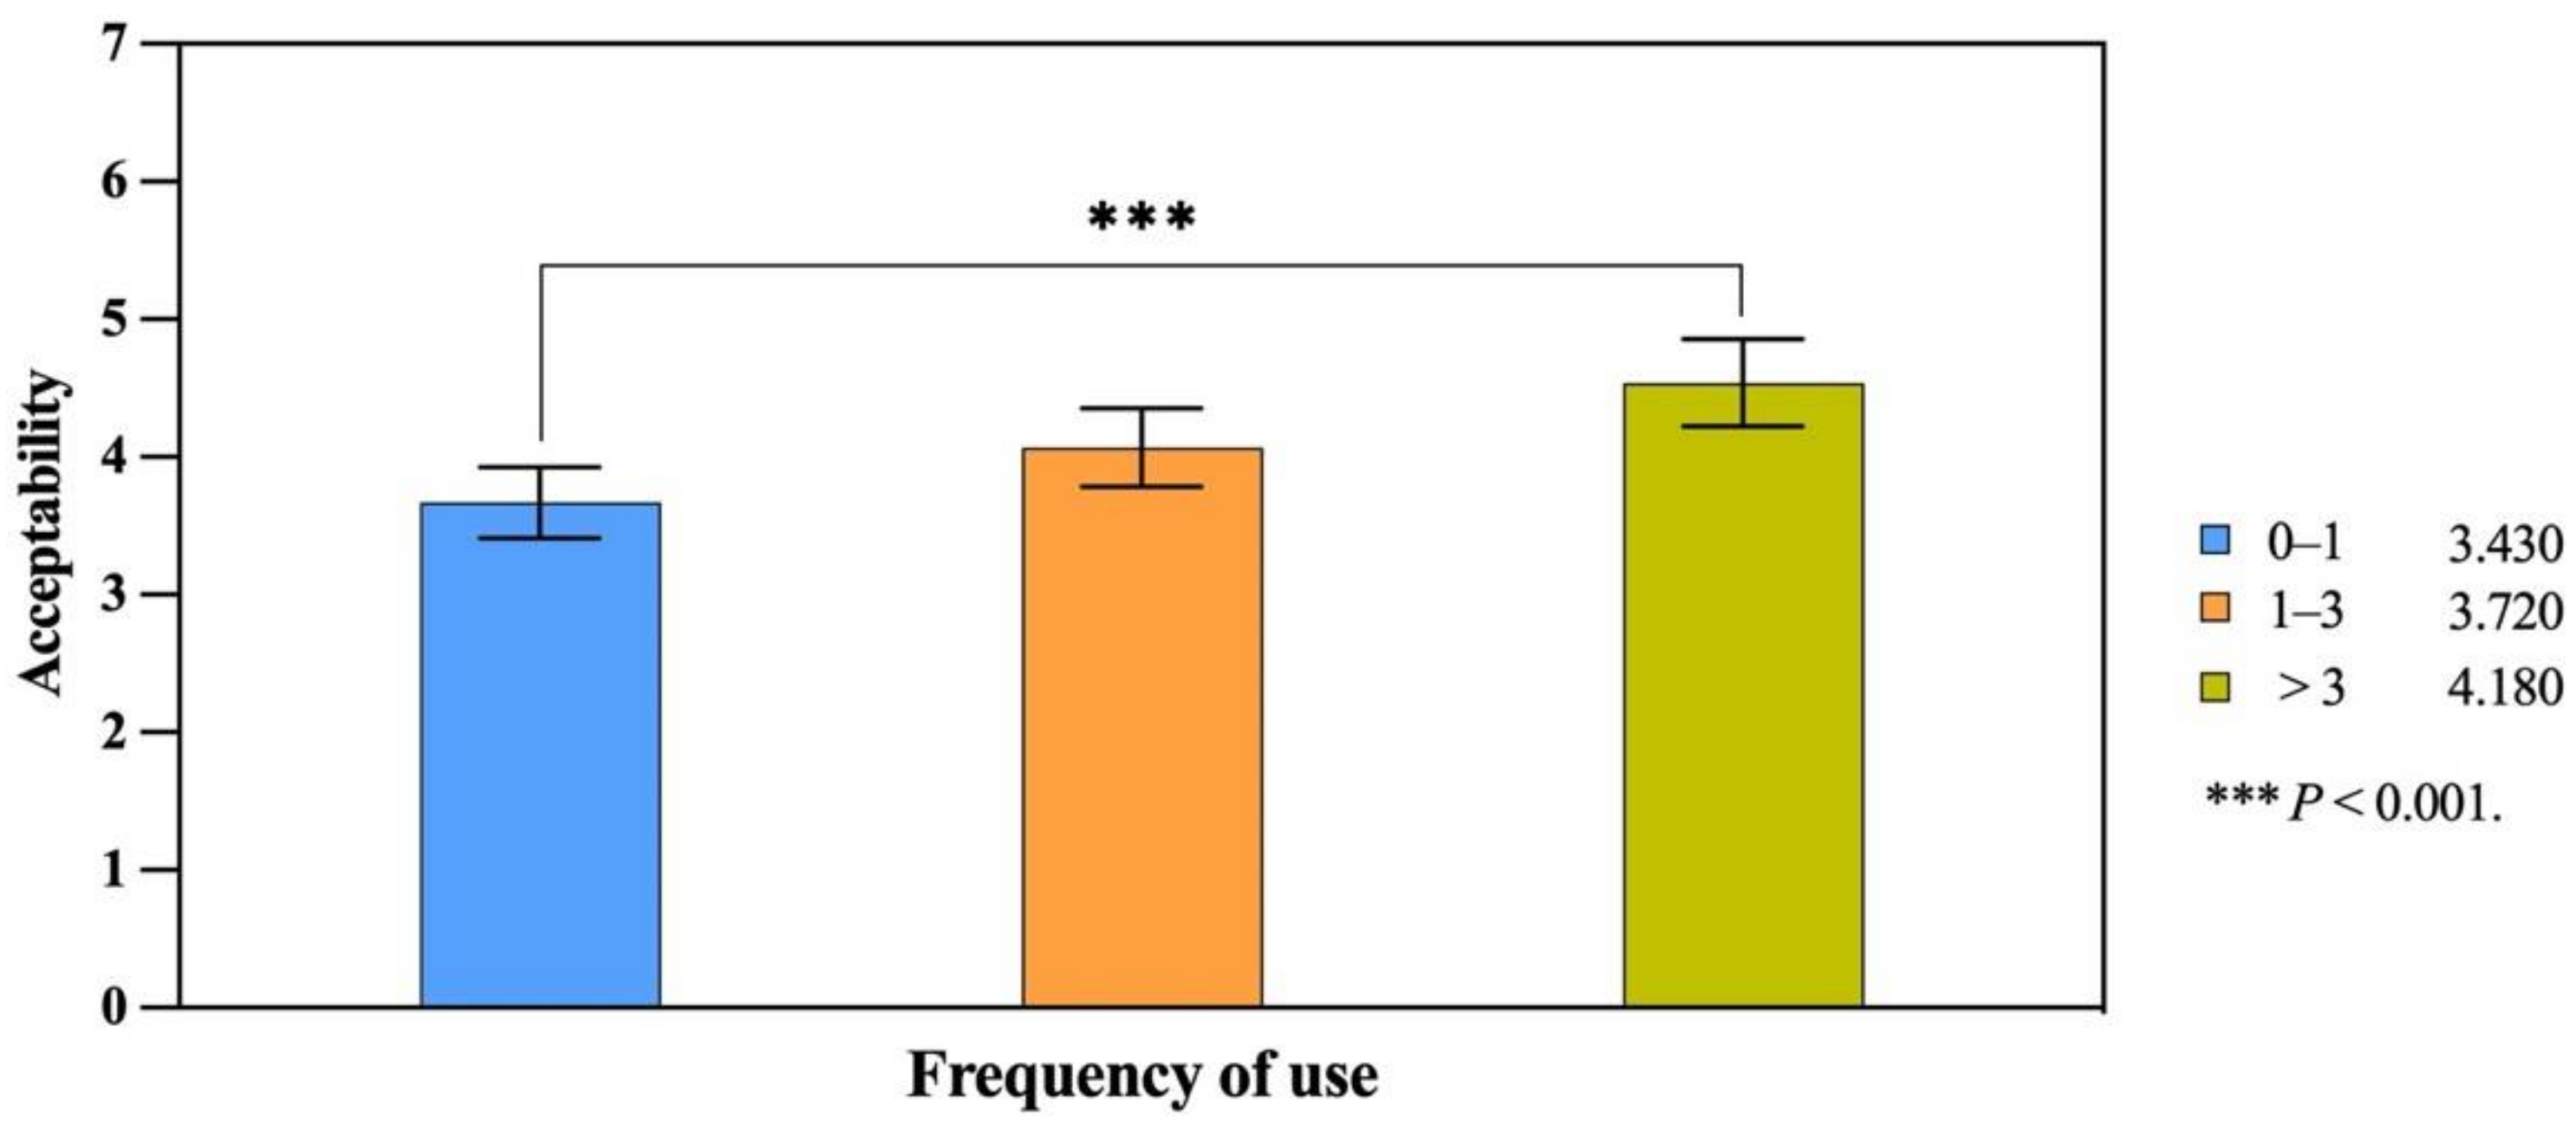
The one-way ANOVA showed a significant effect of different income levels on the respondents’ acceptance of self-driving buses (F = 23.232, p < 0.001, η2 = 0.134). Respondents with a monthly income of > CNY 10,000 (Mean = 4.78, SD = 1.139) were more receptive and willing to accept self-driving buses, followed by those with a monthly income of CNY 8,000–10,000 (Mean = 4.18, SD = 1.078), CNY 5,000–8,000 (Mean = 3.72, SD = 1.138), and respondents earning < CNY 5,000 (Mean = 3.43, SD = 1.431) were the least receptive to self-driving buses. The results are shown in Figure 5.

4.7. Frequency of Use

The one-way ANOVA revealed that respondents with different frequencies of use had significant differences in their levels of acceptance of self-driving buses (F = 11.181, p < 0.001, η2 = 0.047). Respondents who used the bus >3 times per day (Mean = 4.54, SD = 1.093) were more receptive and willing to accept the self-driving bus, followed by 1–3 times per day (Mean = 4.07, SD = 1.357), and finally 0–1 time per day (Mean = 3.67, SD = 1.032). The results are shown in Figure 6.

4.8. Personality Traits

Personality traits were quantitatively differentiated by administering the Big Five personality traits test to respondents, and results were divided into two groups, low and high scores, based on the means. The one-way ANOVA revealed no significant difference between respondents with low and high scores for conscientiousness (F = 0.02, p = 0.887, η2 < 0.001), extraversion (F = 0.004, p = 0.95, η2 < 0.001), and acceptance of self-driving buses. Respondents displaying neuroticism (F= 4.604, p = 0.032, η2 = 0.01) differed less significantly in their acceptance of self-driving buses. Openness to experience (F = 13.331, p < 0.001, η2 = 0.029) and agreeableness (F = 40.388, p < 0.001, η2 = 0.082) had a significant effect on the acceptance of self-driving buses, and respondents with high scores showed higher levels of acceptance and a stronger willingness to ride self-driving buses than those with low scores. The results are shown in Figure 7.

5. Discussion

The purpose of this study was to investigate the effects of individual differences on the acceptance of self-driving buses in Nanjing, China. Data were collected on respondents’ gender, age, region, educational background, marital status, income level, frequency of use, and personality traits, and a one-way ANOVA was conducted on the sample data. The results found that gender, age, educational background, income level, frequency of use, and personality traits had a significant effect on levels of acceptance of self-driving buses.
As an urban public transportation vehicle, self-driving buses are different from ordinary self-driving cars and require more public acceptance and wider social acceptance. This study provides new empirical findings on the acceptance of self-driving buses. Analysis of the sample data revealed that the public acceptance of self-driving buses was generally low (Mean = 4.04, Median = 4, SD = 1.267). The highest score of 4 (35.3%) was followed by 3 (20.30%), 5 (19.90%), 6 (11%), and 2 (9.10%), and the lowest scores of 1 (2.20%) and 7 (2.20%). Respondents with high levels of acceptance of self-driving buses (scores of 6 and 7) accounted for 13.20% of the total, indicating that the public displays a low level of acceptance of self-driving buses, lacks trust, and remains skeptical, which will affect the process of implementing self-driving buses for large-scale use [12,16,17]. Therefore, public acceptance of self-driving buses should be improved by analyzing individual differences in the public, identifying factors that currently affect trust, and designing relevant measures and strategies to address them.
The results of the study revealed that gender, age, educational background, income level, and frequency of use had a significant effect on the level of acceptance of self-driving buses. The level of acceptance of self-driving buses was higher among men compared to women, which is the same as in previous studies [22,32,46,47]. In terms of age, the highest acceptance of self-driving buses was in the 30–39 age group, followed by the much younger 15–29 age group. Surprisingly, the 60–66 age group was more receptive than the 50–59 age group. This diverges from previous studies [25,31,47,48]. It shows that, for self-driving buses, the acceptance of each age group will be different; thus, it is necessary to refine the study of different age groups and to avoid a one-sided analysis from the perspective of age, to determine the level of acceptance. At the same time, the result also shows that senior citizens have a greater need for travel. Moreover, the higher the educational background and the higher the income level, the higher the acceptance of self-driving buses, which is generally consistent with previous studies [22,25,32,41,42]. Frequency of use likewise had a significant effect on the acceptance of self-driving buses. The analysis found that acceptance was highest for those who took > 3 bus rides per day, followed by 1–3 rides per day, and finally 0–1 ride per day. This is generally consistent with previous research [47].
There was no significant effect of region or marital status on the acceptance of self-driving buses. Urban respondents (Mean = 4.05, SD = 1.203) had a slightly higher mean than rural respondents (Mean = 3.97, SD = 1.640), which is consistent with some previous studies [25,50]. It also shows that, with the rapid development of China’s economy, the gap between urban and rural areas is decreasing significantly. The difference between the means of unmarried respondents (Mean = 3.93, SD = 1.392) and married respondents (Mean = 4.09, SD = 1.191) was very small. It indicates that marital status does not have a significant effect on the acceptance of self-driving buses and is not a major influencing factor. Of course, there is still a need to expand the scope and dimensions of the survey afterwards to confirm these results in depth.
The analysis of the personality trait study found that respondents’ openness to experience and agreeableness had a significant effect on their acceptance of self-driving buses, with high scores indicating greater acceptance and willingness to accept self-driving buses. Respondents who displayed conscientiousness (F = 0.02, p = 0.887, η2 = 0.0), extraversion (F = 0.004, p = 0.95, η2 = 0.0), and neuroticism (F = 4.604, p = 0.032, η2 = 0.01), with low and high scores on the acceptance of self-driving buses, did not differ significantly. Overall, people with the personality traits of high openness to experience and agreeableness are more receptive to self-driving buses. This is consistent with previous research findings [21,25].

6. Conclusions

As a new type of public transportation, self-driving buses will be an important part of the future smart public transportation network. However, any new technology needs to be fully understood in terms of public acceptance before it is placed into mass use. This study investigates the impact on the acceptance of self-driving buses by using individual differences as an entry point in Nanjing, China. The results show that public acceptance of self-driving buses is generally low, with most citizens being on the fence or holding a negative attitude, and only 13.20% of respondents had a high level of acceptance. Individual differences (including demographics and personality traits) are important to examine, with gender, age, educational background, income level, frequency of use, and personality traits all having significant effects on the level of acceptance of self-driving buses (Table 4).
Therefore, we should continue to conduct in-depth practical and theoretical research to eliminate or reduce the impact of these individual differences in the design and implementation of self-driving buses, so as to enhance the public’s acceptance of self-driving buses. The results of this study provide empirical data to support future research on self-driving buses, and they provide a theoretical basis for the development, design, and implementation of self-driving buses.
Due to the impact of COVID-19, there were many limitations on the survey process (e.g., time, location, etc.). In future studies, we intend to expand the survey scope and respondent population (e.g., mobility-impaired population, etc.) to obtain a more diverse sample size. A more refined classification of demographic characteristic variables, especially in terms of personality traits, should also focus on investigating the decision-making process of the public and on analyzing the differences in decision-making among people with different personality traits so as to provide more comprehensive empirical data and theoretical support for relevant research.

Author Contributions

Conceptualization, Z.L. (Zehua Li) and J.N.; methodology, Z.L. (Zehua Li) and J.N.; software, Z.L. (Zehua Li); validation, Z.L. (Zehua Li) and J.N.; formal analysis, Z.L. (Zehua Li); investigation, Z.L. (Zhenzhou Li), Y.C., and Y.W.; resources, Z.L. (Zehua Li), Y.C., and Y.W.; data curation, Z.L. (Zehua Li), Z.L. (Zhenzhou Li), Y.C., and Y.W.; writing—original draft preparation Z.L. (Zehua Li); writing—review and editing, Z.L. (Zehua Li), Z.L. (Zhenzhou Li), J.N., and B.J.; visualization, Y.C. and Y.W.; supervision, B.J. All authors have read and agreed to the published version of the manuscript.

Funding

This study was supported by the MOE (Ministry of Education in China) Foundation Project of Humanities and Social Sciences, grant number 17YJA760022 and the Postgraduate Research and Practice Innovation Program of Jiangsu Province, grant number KYCX22_0582.

Institutional Review Board Statement

Not applicable.

Informed Consent Statement

Informed consent was obtained from all subjects involved in the study.

Data Availability Statement

Not applicable.

Acknowledgments

We gratefully acknowledge the support of the HCI Lab, Department of Industrial Design, Nanjing University of Science and Technology, for this research.

Conflicts of Interest

The authors declare no conflict of interest.

References

  1. World Health Organization. Global Status Report on Road Safety 2018. 2019. Available online: www.who.int/publications/i/item/9789241565684 (accessed on 5 December 2021).
  2. Bansal, P.; Kockelman, K.M.; Singh, A. Assessing public opinions of and interest in new vehicle technologies: An Austin perspective. Transp. Res. Part C Emerg. Technol. 2016, 67, 1–14. [Google Scholar] [CrossRef]
  3. Fagnant, D.J.; Kockelman, K. Preparing a nation for autonomous vehicles: Opportunities, barriers and policy recommendations. Transp. Res. Part A Policy Pract. 2015, 77, 167–181. [Google Scholar] [CrossRef]
  4. Biondi, F.; Alvarez, I.; Jeong, K.-A. Human–vehicle cooperation in automated driving: A multidisciplinary review and appraisal. Int. J. Hum. Comput. Interact. 2019, 35, 932–946. [Google Scholar] [CrossRef]
  5. Du, N.; Haspiel, J.; Zhang, Q.; Tilbury, D.; Pradhan, A.K.; Yang, X.J.; Robert, L.P., Jr. Look who’s talking now: Implications of AV’s explanations on driver’s trust, AV preference, anxiety and mental workload. Transp. Res. Part C Emerg. Technol. 2019, 104, 428–442. [Google Scholar] [CrossRef]
  6. Zhang, Q.; Yang, X.J.; Robert, L.P. Drivers’ age and automated vehicle explanations. Sustainability 2021, 13, 1948. [Google Scholar] [CrossRef]
  7. Azevedo-Sa, H.; Zhao, H.; Esterwood, C.; Yang, X.J.; Tilbury, D.M.; Robert, L.P. How internal and external risks affect the relationships between trust and driver behavior in automated driving systems. Transp. Res. Part C Emerg. Technol. 2021, 123, 102973. [Google Scholar] [CrossRef]
  8. Jayaraman, S.; Creech, C.; Dawn, T.; Yang, X.J.; Pradhan, A.; Tsui, K.; Robert, L. Pedestrian Trust in Automated Vehicles: Role of Traffic Signal and AV Driving Behavior. Frontiers in Robotics and AI. Available online: https://www.frontiersin.org/articles/10.3389/frobt.2019.00117/full (accessed on 28 November 2019).
  9. Petersen, L.; Robert, L.; Yang, X.J.; Tilbury, D. Situational awareness, driver’s trust in automated driving systems and secondary task performance. SAE Int. J. CAV 2019, 2, 129–141. [Google Scholar] [CrossRef]
  10. Tan, H.; Chen, C.; Hao, Y. How people perceive and expect safety in autonomous vehicles: An empirical study for risk sensitivity and risk-related feelings. Int. J. Hum. Comput. Interact. 2021, 37, 340–351. [Google Scholar] [CrossRef]
  11. Iclodean, C.; Cordos, N.; Varga, B.O. Autonomous shuttle bus for public transportation: A review. Energies 2020, 13, 2917. [Google Scholar] [CrossRef]
  12. Gkartzonikas, C.; Gkritza, K. What have we learned? a review of stated preference and choice studies on autonomous vehicles. Transp. Res. Part C Emerg. Technol. 2019, 98, 323–337. [Google Scholar] [CrossRef]
  13. Faisal, A.; Yigitcanlar, T.; Kamruzzaman, M.; Currie, G. Understanding autonomous vehicles: A systematic literature review on capability, impact, planning and policy. J. Transp. Land Use 2019, 12, 45–72. [Google Scholar] [CrossRef]
  14. Paddeu, D.; Parkhurst, G.; Shergold, I. Passenger comfort and trust on first-time use of a shared autonomous shuttle vehicle. Transp. Res. Part C Emerg. Technol. 2020, 115, 102604. [Google Scholar] [CrossRef]
  15. Li, Z.; Li, X.; Jiang, B. How People Perceive the Safety of Self-Driving Buses: A Quantitative Analysis Model of Perceived Safety. Transp. Res. Rec. 2022. [Google Scholar] [CrossRef]
  16. Haspiel, J.; Du, N.; Meyerson, J.; Robert, L.P.; Tilbury, D.; Yang, X.J.; Pradhan, A.K. Explanations and expectations: Trust building in automated vehicles. In Proceedings of the ACM/IEEE International Conference on Human-Robot Interaction, Chicago, IL, USA, 5–8 March 2018; pp. 119–120. [Google Scholar] [CrossRef]
  17. Zhang, Q.; Robert, L., Jr.; Lionel, P.; Du, N.; Yang, X.J. Trust in AVs: The impact of expectations and individual differences. In Proceedings of the Conference on Autonomous Vehicles in Society: Building a Research Agenda, East Lansing, MI, USA, 18–19 May 2018. [Google Scholar]
  18. Lee, J.D.; See, K.A. Trust in automation: Designing for appropriate reliance. Hum. Factors 2004, 46, 50–80. [Google Scholar] [CrossRef]
  19. Bansal, P.; Kockelman, K.M. Are we ready to embrace connected and self-driving vehicles? A case study of Texans. Transportation 2018, 45, 641–675. [Google Scholar] [CrossRef]
  20. Choi, J.K.; Ji, Y.G. Investigating the Importance of Trust on Adopting an Autonomous Vehicle. Int. J. Hum. Comput. Interact. 2015, 31, 692–702. [Google Scholar] [CrossRef]
  21. Zhang, T.; Tao, D.; Qu, X.; Zhang, X.; Lin, R.; Zhang, W. The roles of initial trust and perceived risk in public’s acceptance of automated vehicles. Transp. Res. Part C Emerg. Technol. 2019, 98, 207–220. [Google Scholar] [CrossRef]
  22. Schoettle, B.; Sivak, M. A Survey of Public Opinion about Autonomous and Self-Driving Vehicles in the US, the UK, and Australia; University of Michigan: Ann Arbor, MI, USA, 2014. [Google Scholar]
  23. Harrison, A.W.; Rainer, R.K., Jr. The influence of individual differences on skill in end-user computing. J. Manag. Inf. Syst. 1992, 9, 93–111. [Google Scholar] [CrossRef]
  24. Robert, L.P. Personality in the human robot interaction literature: A review and brief critique. In Proceedings of the 24th Americas Conference on Information Systems, New Orleans, LA, USA, 16–18 August 2018; pp. 16–18. [Google Scholar]
  25. Zhang, Q.; Yang, X.J.; Robert, L.P., Jr. Individual Differences and Expectations of Automated Vehicles. Int. J. Hum. Comput. Interact. 2022, 38, 825–836. [Google Scholar] [CrossRef]
  26. Kaan, J. User Acceptance of Autonomous Vehicles: Factors & Implications. Master’s Thesis, Delft University of Technology, Delft, The Netherlands, 2017. [Google Scholar]
  27. Azevedo-Sa, H.; Jayaraman, S.K.; Yang, X.J.; Robert, L.P.; Tilbury, D.M. Context-adaptive management of drivers’ trust in automated vehicles. IEEE Robot. Autom. Lett. 2020, 5, 6908–6915. [Google Scholar] [CrossRef]
  28. Brown, S.A.; Venkatesh, V.; Goyal, S. Expectation confirmation in technology use. Inf. Syst. Res. 2012, 23, 474–487. [Google Scholar] [CrossRef]
  29. Maruping, L.M.; Bala, H.; Venkatesh, V.; Brown, S.A. Going beyond intention: Integrating behavioral expectation into the unified theory of acceptance and use of technology. J. Assoc. Inf. Sci. Technol. 2017, 68, 623–637. [Google Scholar] [CrossRef]
  30. Martinez, L.M.; De Correia, G.H.A.; Moura, F.; Mendes Lopes, M. Insights into carsharing demand dynamics: Outputs of an agent-based model application to Lisbon, Portugal. Int. J. Sustain. Transp. 2017, 11, 148–159. [Google Scholar] [CrossRef]
  31. Deloitte. Global Automotive Consumer Study: Exploringconsumers’ Mobility Choices and Transportation Decisions. 2014. Available online: https://www2.deloitte.com/content/dam/Deloitte/us/Documents/manufacturing/us-auto-global-automotive-consumer-study-100914.pdf (accessed on 11 June 2022).
  32. Payre, W.; Cestac, J.; Delhomme, P. Intention to use a fully automated car: Attitudes and a priori acceptability. Transp. Res. Part F Traffic Psychol. Behav. 2014, 27, 252–263. [Google Scholar] [CrossRef]
  33. Gefen, D.; Karahanna, E.; Straub, D.W. Trust and TAM in online shopping: An integrated model. MIS Q. 2003, 27, 51–90. [Google Scholar] [CrossRef]
  34. Alsghan, I.; Gazder, U.; Assi, K.; Hakem, G.H.; Sulail, M.A.; Alsuhaibani, O.A. The Determinants of Consumer Acceptance of Autonomous Vehicles: A Case Study in Riyadh, Saudi Arabia. Int. J. Hum. Comput. Interact. 2021, 38, 1375–1387. [Google Scholar] [CrossRef]
  35. Glancy, D.J. Privacy in autonomous vehicles. St. Clara Law Rev. 2012, 52, 1171–1239. [Google Scholar]
  36. Tay, B.; Jung, Y.; Park, T. When stereotypes meet robots: The double-edge sword of robot gender and personality in human–robot interaction. Comput. Hum. Behav. 2014, 38, 75–84. [Google Scholar] [CrossRef]
  37. Tussyadiah, I.P.; Zach, F.; Wang, J. Attitudes toward autonomous on demand mobility system: The case of self-driving taxi. In Information & Communication Technologies in Tourism; Schegg, R., Stangl, B., Eds.; Springer International Publishing: Cham, Switzerland, 2017; pp. 755–766. [Google Scholar]
  38. KPMG. Marketplace of Change: Automobile Insurance in the Era of Autonomous Vehicles, White Paper. 2015. Available online: https://assets.kpmg.com/content/dam/kpmg/pdf/2016/06/id-market-place-of-change-automobile-insurance-in-the-era-of-autonomous-vehicles.pdf (accessed on 11 June 2022).
  39. Paden, B.; Čáp, M.; Yong, S.Z.; Yershov, D.; Frazzoli, E. A survey of motion planning and control techniques for self-driving urban vehicles. IEEE Trans. Intell. Veh. 2016, 1, 33–55. [Google Scholar] [CrossRef]
  40. Bertoncello, M.; Wee, D. Ten Ways Autonomous Driving could Redefine the Automotive World; McKinsey & Company: Atlanta, GA, USA, 2015; Volume 6. [Google Scholar]
  41. Liu, P.; Yang, R.; Xu, Z. Public acceptance of fully automated driving: Effects of social trust and risk/benefit perceptions. Risk Anal. 2019, 39, 326–341. [Google Scholar] [CrossRef]
  42. Abraham, H.; Lee, C.; Brady, S.; Fitzgerald, C.; Mehler, B.; Reimer, B.; Coughlin, J.F. Autonomous vehicles and alternatives to driving: Trust, preferences, and effects of age. In Proceedings of the Transportation Research Board 96th Annual Meeting (TRB’17), Washington, DC, USA, 8–12 January 2017. [Google Scholar]
  43. Cooper, C. Individual Differences; Arnold: London, UK, 2002; Volume 2. [Google Scholar]
  44. Clark, B.; Parkhurst, G.; Ricci, M. Understanding the Socioeconomic Adoption Scenarios for Autonomous Vehicles: A Literature Review; Centre for Transport and Society (CTS): Bristol, UK, 2016. [Google Scholar]
  45. Im, S.; Bayus, B.L.; Mason, C.H. An empirical study of innate consumer innovativeness, personal characteristics, and new-product adoption behavior. J. Acad. Mark. Sci. 2003, 31, 61–73. [Google Scholar] [CrossRef]
  46. Nordhoff, S.; De Winter, J.; Kyriakidis, M.; Van Arem, B.; Happee, R. Acceptance of driverless vehicles: Results from a large cross-national questionnaire study. J. Adv. Transp. 2018, 2018, 5382192. [Google Scholar] [CrossRef]
  47. Esterwood, C.; Yang, X.J.; Robert, L.P. Barriers to AV bus acceptance: A national survey and research agenda. Int. J. Hum. Comput. Interact. 2021, 37, 1391–1403. [Google Scholar] [CrossRef]
  48. Frison, A.-K.; Aigner, L.; Wintersberger, P.; Riener, A. Who is Generation A? Investigating the experience of automated driving for different age groups. In Proceedings of the 10th International Conference on Automotive User Interfaces and Interactive Vehicular Applications, Toronto, ON, Canada, 23–25 September 2018; pp. 94–104. [Google Scholar] [CrossRef]
  49. Moris, M.G.; Venkatesh, V. Age differences in technology adoption decisions: Implications for a changing work force. Pers. Psychol. 2000, 53, 375–403. [Google Scholar] [CrossRef]
  50. Howard, D.; Dai, D. Public perceptions of self-driving cars: The case of Berkeley, California [Paper presentation]. In Proceedings of the Transportation Research Board 93rd Annual Meeting, Washington, DC, USA, 12–16 January 2014. [Google Scholar]
  51. Hughes-Cromwick, M. Public Transportation Fact Book (Tech. Rep.); American Public Transportation Association (APTA): Washington, DC, USA, 2019. [Google Scholar]
  52. Sovacool, B.K.; Kester, J.; Noel, L.; De Rubens, G.Z. Income, political affiliation, urbanism, and geography in stated preferences for electric vehicles (EVs) and vehicle-to-grid (V2G) technologies in Northern Europe. J. Transp. Geogr. 2019, 78, 214–229. [Google Scholar] [CrossRef]
  53. Koul, S.; Eydgahi, A. Utilizing the technology acceptance model (TAM) for driverless car technology adoption. J. Technol. Manag. Innov. 2018, 13, 37–46. [Google Scholar] [CrossRef]
  54. DeYoung, C.G.; Gray, J.R.; Corr, P.J.; Matthews, G. The Cambridge Handbook of Personality Psychology; Cambridge University Press: Cambridge, UK, 2009. [Google Scholar]
  55. Roccas, S.; Sagiv, L.; Schwartz, S.H.; Knafo, A. The Big Five Personality Factors and Personal Values. Personal. Soc. Psychol. Bull. 2002, 28, 789–801. [Google Scholar] [CrossRef]
  56. Pate, R.R. Physical activity assessment in children and adolescents. Crit. Rev. Food Sci. Nutr. 1993, 33, 321–326. [Google Scholar] [CrossRef]
Figure 1. Personality trait data.
Sustainability 14 11425 g001
Figure 2. Effect of gender on acceptance of self-driving buses.
Sustainability 14 11425 g002
Figure 3. Effect of age on acceptance of self-driving buses.
Sustainability 14 11425 g003
Figure 4. Effect of educational background on acceptance of self-driving buses.
Sustainability 14 11425 g004
Figure 5. Effect of income level on acceptance of self-driving buses.
Sustainability 14 11425 g005
Figure 6. Effect of frequency of use on acceptance of self-driving buses.
Sustainability 14 11425 g006
Figure 7. Effect of personality traits on acceptance of self-driving buses.
Sustainability 14 11425 g007
Table 1. Demographic data table.
ItemsN 1Demographics
(%)
Sample
(%)
GenderFemale22348.95%49.23%
Male23051.05%50.77%
Age15–2914068.27%30.90%
30–3916837.09%
40–496414.13%
50–594910.82%
60–65325.28%7.06%
RegionUrban area39486.90%86.98%
Township5913.10%13.02%
Educational backgroundHigh school and below29364.77%64.68%
Undergraduate or junior college11335.23%24.94%
Graduate student and above4710.38%
Marital statusUnmarried161 35.50%
Married292 64.50%
3Monthly income level (CNY 2)<CNY 500091 20.09%
CNY 5000–8000111 24.50%
CNY 8000–10,000161 35.54%
>CNY 10,00090 19.87%
Daily bus usage frequency (Times)0–171 15.67%
1–3262 57.84%
>3120 26.49%
1 N = Number; 2 CNY = Chinese Yuan.
Table 2. Acceptance rating scale.
ScoreN 1%M 2Med 3SD 4
1102.20%4.0441.267
2419.10%
39220.30%
416035.30%
59019.90%
65011%
7102.20%
1 N = Number; 2 M = mean; 3 Med = Median; 4 SD = Standard deviation.
Table 3. Results of data analysis.
ItemsN 1M 2SD 3Fp-ValueEta-Squared
GenderFemale2233.3101.017211.292<0.0010.319
Male2304.7401.074
Age15–291404.0701.4439.803<0.0010.08
30–391684.4101.200
40–49643.6301.241
50–59493.3900.812
60–65323.7200.523
RegionUrban areas3944.0501.2030.2020.653<0.001
Township593.9701.640
Educational backgroundSenior secondary and below2933.8901.18965.997<0.0010.227
Bachelor or specialist1133.6801.120
Postgraduate and above475.7900.414
Marital statusUnmarried1613.9301.3921.6740.1960.004
Married2924.0901.191
Monthly income level (CNY 4)<CNY 5000913.4301.43123.232<0.0010.134
CNY 5000–80001113.7201.138
CNY 8000–10,0001614.1801.078
>CNY 10,000904.7801.139
Daily bus usage frequency (Times)0–1713.6701.03211.181<0.0010.047
1–32624.0701.357
>31204.5401.093
Openness to experienceLow score2113.8101.14013.331<0.0010.029
High score2424.2401.338
ConscientiousnessLow score2524.0301.1890.020.887<0.001
High score2014.0401.361
ExtraversionLow score2314.0401.1240.0040.95<0.001
High score2224.0301.403
AgreeablenessLow score2713.7401.29440.388<0.0010.082
High score1824.4801.086
NeuroticismLow score2324.1601.2474.6040.0320.01
High score2213.9001.277
1 N = Number; 2 M = mean; 3 SD = Standard deviation; 4 CNY = Chinese Yuan.
Table 4. Results of individual differences study.
ItemsConclusionData Comparison
GenderMen are more receptive to self-driving buses than are women.Male (Mean = 4.74, SD = 1.074) > Female (Mean = 3.31, SD = 1.017)
AgeDifferent age groups have different levels of acceptance of self-driving buses.30–39 (Mean = 4.41, SD = 1.200) > 15–29 (Mean = 4.07, SD = 1.443) > 40–49 (Mean = 3.63, SD = 1.241) > 60–65 (Mean = 3.72, SD = 0.523) > 50–59 (Mean = 3.39, SD = 0.812)
Educational backgroundThose with higher educational backgrounds are more receptive to self-driving buses.Postgraduate and above (Mean = 5.79, SD = 0.414)>Senior secondary and below (Mean = 3.89, SD = 1.189) > Bachelor or specialist (Mean = 3.68, SD = 1.120)
Monthly income level (CNY 1)Those with higher income levels are more receptive to self-driving buses.>CNY 10,000 (Mean = 4.78, SD = 1.139)>CNY 8000–10,000 (Mean = 4.18, SD = 1.078) > CNY 5000–8000 (Mean = 3.72, SD = 1.138) > < CNY 5000 (Mean = 3.43, SD = 1.431)
Daily bus usage frequency (Times)Higher frequency of use increases acceptance of self-driving buses.>3 (Mean = 4.54, SD = 1.093) > 1–3 (Mean = 4.07, SD = 1.357) > 0–1 (Mean = 3.67, SD = 1.032)
AgreeablenessHigh scores outperform low scores for acceptance of self-driving buses.High score (Mean = 4.48, SD = 1.086) > Low score (Mean = 3.74, SD = 1.294)
Openness to experienceHigh scores outperform low scores for acceptance of self-driving buses.High score (Mean = 4.24, SD = 1.338) > Low score (Mean = 3.81, SD = 1.14)
1 CNY = Chinese Yuan.
Publisher’s Note: MDPI stays neutral with regard to jurisdictional claims in published maps and institutional affiliations.