Article

Simulated Validation and Prediction of Land Use under Multiple Scenarios in Daxing District, Beijing, China, Based on GeoSOS-FLUS Model

1
School of Landscape Architecture, Beijing Forestry University, Beijing 100083, China
2
Beijing Laboratory of Urban and Rural Ecology and Environment, Beijing Forestry University, Beijing 100083, China
3
National Forestry and Grassland Administration Key Laboratory of Urban and Rural Landscape Construction, Beijing Forestry University, Beijing 100083, China
*
Author to whom correspondence should be addressed.
These authors contributed equally to this work.
Sustainability 2022, 14(18), 11428; https://doi.org/10.3390/su141811428
Submission received: 29 July 2022 / Revised: 4 September 2022 / Accepted: 8 September 2022 / Published: 12 September 2022

Abstract

:
Land-use changes in urban fringe areas are dramatic, and modelling and predicting land-use changes under different scenarios can provide a basis for urban development regulation and control. As an important part of Beijing’s urban fringe, Daxing District is representative of its land-use changes. Taking the Daxing District of Beijing as an example, this study selected two periods of land-use data in 2008 and 2018 and predicted land-use changes in 2028 and 2038 using the GeoSOS-FLUS model (geographical simulation and optimisation system–future land-use simulation) and Markov chain model, based on the simulation and validation of land use in Daxing District from 2008 to 2018. Meanwhile, three types of scenario simulations were carried out. The results in the future predictions show that: (1) under the natural development scenario, the area of construction land and grassland gradually increased, and the area of cultivated land, woodland and water bodies gradually decreased; (2) under the cultivated land protection scenario, the area of cultivated land remained largely unchanged, the area of grassland decreased before increasing, the expansion of construction land was curbed, and the area of woodland and water bodies increased slowly; and (3) under the ecological control scenario, the area of cultivated land, grassland, woodland and water bodies showed slowly increasing trends, with a small amount of cultivated land being converted to construction land. These results indicate that the setting of cultivated land protection and ecological control can limit the expansion of construction land to a certain extent. This study can provide a basis for the regulation of urban development in the Daxing District in the future.

1. Introduction

The urban fringe area is an area formed at a certain stage of urban development where the built-up area of the city extends to the surrounding area of agricultural land to integrate and change it. Due to the intricate relationship between urban and rural areas and the spatial environment, this results in drastic changes to land use and sharp spatial contradictions [1,2,3]. In 2019, the State Council issued “Several Opinions on Establishing a Territorial Spatial Planning System and Supervising its Implementation”. This requires putting ecology first, promoting green development and scientifically delineating red lines for ecological protection, permanent basic farmland, urban development and other spatial control boundaries to leave space for sustainable development [4]. With the rapid development of China’s cities and land-use changes and distribution patterns brought about by the reshaping of social and economic structures, the issue of land use in urban fringe areas has become a key aspect of urban and rural governance. In this context, it is necessary to think systematically about land-use changes for urban fringe areas for three types of functions in particular: ecological protection, agricultural production and urban construction.
For many years, scholars have been studying urban fringes, with H. Louis, E. J Taffe, Muller and others conducting classification studies on the territorial structure and proposing the “ideal city model” as well as the “metropolitan structure model” [5,6]. J. O. Browder, Phelps N. A, J. W. R. Whitehand and others pointed out the importance of urban planning for the construction of edge cities, starting from the evolutionary mechanism [7,8,9]. The research process has undergone a gradual upgrade from qualitative to quantitative, static to dynamic and single to multiple objectives [10]. In terms of application methods, the CA (cellular automata) model, CLUE-S model (conversion of land use and its effects to a small regional extent) and Markov model have been widely used [11,12]. Yi et al. used the CA–Markov model to forecast urban expansion and lay the foundation for urban development boundary delineation [13]; Zhang et al. simulated self-organised land-use evolution in the reservoir area based on the CA–Markov model with multi-criteria evaluation using Landsat TM remote sensing images of the Three Gorges reservoir area in 2000, 2007 and 2014 as data sources [14]; Long and Aslan modelled the dynamic evolution of future land use and landscape-level-based land use in urban fringe areas through interpretation of remote sensing impacts [15,16]; Liu et al. conducted a multi-objective simulation of a land-use layout with the help of the CLUE-S model to solve the problem of land-use planning in multi-objectives and improve land-use efficiency [17]; Kucsicsa et al. used CLUE-S models to provide a guiding basis for formulating land-use planning and environmental policy [18].
The advantage of the CA model is that its “bottom-up” modelling principle is consistent with the geographic processes, but its disadvantage is that it is constrained by the model itself when it needs to consider the impact of “top-down” decisions [19]. The CLUE-S model is commonly used to predict small-scale land-use change and has the following advantages: (1) it can integrate the correlation between various land-use types and various drivers, and (2) it can be used to select multiple scales for the same area to obtain the best simulation solution. The Markov model is practical for predicting land-use change, but it is difficult to reflect the changes in spatial patterns [20]. Based on the traditional CA model, Liu et al. proposed the FLUS model (future land-use simulation), which has been proven to have higher simulation accuracy than CLUE-S and ANN-CA (artificial neural network–cellular automata) and has been widely used in land-use pattern simulation studies [21].
Daxing District is the new national gate of the capital in the southern part of Beijing and a pioneering area for urban and rural land system reform. With Beijing’s deconstruction of non-head functions, the new plain city should actively undertake suitable industries and functions to achieve higher quality and more sustainable development. This study used a coupled GeoSOS-FLUS and Markov chain model to forecast dynamic simulations of land-use changes for Daxing District, Beijing. The coupling of the GeoSOS-FLUS model and Markov chain model as well as the simulation process is shown in Figure 1. The combination of the two models makes the FLUS model able to handle complex spatial change while the Markov chain model predicts land quantity, thus realizing the full exploitation of spatial and quantitative information on the dynamic evolution of land use [22,23,24].
This study aimed to identify the problems in the process of land use through land-use simulation and ecological space optimisation model research and to alleviate the contradiction between economic development and ecological protection through the rational optimisation of ecological space. It is conducive to promoting social and economic development while considering the ecological environment’s restoration and protection. It is also conducive to the healthy development of the regional economy and the realisation of a coordinated and sustainable regional economic environment. The research results may provide a basis for the regulation of urban development in the Daxing District, as well as complement and improve the research related to land use in the urban fringe areas of Beijing.

2. Materials

2.1. Study Area

Daxing District is located in the southern suburbs of Beijing, 20 km from its centre. The terrain is elevated from the northwest to the southeast, with an altitude of 14–45 m. The climate is a warm-temperate semi-humid semi-arid continental monsoon climate with four distinct seasons. The average annual rainfall is 507.2 mm, the average temperature is 11.7 °C, and the average wind speed is 2.2 m/s with prevailing northeast and southwest winds [25]. Its total land area is 1035.95 km2, of which 657.75 km2 is cultivated land, accounting for 63.49% of the total land area, 334.96 km2 is construction land, accounting for 32.33% of the total land area, and 43.25 km2 is allocated for other purposes, accounting for 4.18% of the total land area. The region is dominated by agricultural land, with a greater proportion of cultivated land and a smaller proportion of woodland [26]. Among the suburban districts and counties in Beijing, Daxing District is the closest to the central urban area of Beijing, and its land use is characterised by a clear north–south subdivision due to the urbanisation process. The northern part is a typical urban fringe area. Due to the expansion of the Beijing metropolis and industrial expansion, the proportion of construction land is increasing year by year and shows a trend of complete urbanisation. The southern part is dominated by cultivated land, and the land-use structure and area remain relatively stable [27]. Located at an important strategic pivot point of Beijing’s “connecting one axis, straddling two belts and linking multiple centres”, Daxing District is the nearest new urban development area for Beijing’s central city and is also an important agricultural area on the outskirts of the city [28]; its economic pillars include the new media industry, the advanced manufacturing industry, the medical and health industry and the service industry in the airport economic zone. In the context of rapid urbanisation and rural transformation, Daxing District has become a focal point for high-tech manufacturing and strategic emerging industries in the south of Beijing and is an important area to support the upgrading of Beijing’s industrial structure. It is also part of the transformation of the city’s spatial structure and shifting of the population away from the central city. This directly affects the efficiency of land resource allocation and the sustainability of economic and social development in Beijing.

2.2. Data Sources and Processing

Based on the fact that China usually takes 5 years as a cycle for formulating development policies and 10 years as a period for model validation in related articles, this study selected 10 years as the interval for land-use quantity change simulation [29,30,31,32]. The current land-use data of the Daxing District of Beijing for 2008 and 2018 from the Institute of Geographical Sciences and Resources of the Chinese Academy of Sciences (Source: http://www.resdc.cn (accessed on 21 March 2022)) was selected with a spatial resolution of 30 × 30 m. The classification system for CNLUCC (remote sensing monitoring dataset of land-use and land-cover change over multiple periods in China) was utilised. Five major categories of land use in the Daxing District were identified: cultivated land, woodland, grassland, water bodies and construction land. Considering the key driving factors of urban development changes, the collection contains much information, such as data on the natural environment (elevation, slope direction, slope, vegetation coverage), social factors (distance to city centre, distance to airports, distance to highway, distance to railway station, distance to hospitals, distance to shopping malls, population distribution density) and economic factors (GDP).
The selected data were processed through ArcGIS 10.2. We downloaded DEM data of elevation from Geospatial Data Cloud (Source: http://www.gscloud.cn/search (accessed on 21 March 2022)) and used Slope and Aspect tools to generate slope and slope direction. NDVI data were obtained by downloading remote sensing images from Geospatial Data Cloud and performing banding operations based on NDVI = (NIR − R)/(NIR + R). The distance to city centre, distance to airport, distance to highway, distance to railway station, distance to hospital and distance to shopping mall were extracted from the current land-use data for city centre, airport, railway station, highway, hospital and shopping mall and formed into separate layers. The distance to each factor was obtained through Euclidean distance analysis; the population distribution density data were the kilometre grid data of the spatial distribution of the population in Beijing, and the data type was 1 km2 unit raster data, which needed to be resampled to 30 m resolution.

3. Methods

3.1. Site Size Forecasting Based on Markov Chain Model

Markov chain models are used in studies to simulate land-use changes by assuming that the state of a land-use type at (t + 1) is only related to the state of the land-use type at t. The specific process is represented as follows.
S(t + 1) = Pab × S(t),
where S(t), S(t + 1) is the land-use type state matrix of the study area at t, (t + 1); Pab represents the transfer probability matrix for the transformation from type a to type b [33].
To obtain the change in the land-use area from 2008 to 2018 and understand the actual change in land use in Daxing District, according to the remote sensing image interpretation data of Daxing District in two periods of 2008 and 2018, the area of various land-use types in the two periods was counted by using the Calculate Geometry of ArcGIS, and the total change and the average annual change were calculated.
To obtain the land-use area and its percentage of change from 2018 to 2038, firstly, the two images after classification in 2008 and 2018 were superimposed by ArcGIS, and the area of the change raster was counted to obtain the land-use type area transformation matrix. Then, the credibility of the Markov chain model was verified. Using the 2008 area of land use in Daxing District as the base, the predicted results of the area of land use in Daxing District in 2018 were compared with the actual situation of land use in Daxing District in 2018. The difference between the simulation results and the actual situation was small, and the kappa coefficient was calculated to be 0.9706, indicating that the use of Markov chain model to predict the land-use situation in Daxing District in 2018 was effective, indicating that the model had a high degree of confidence. Finally, the land-use area transformation matrix was used to predict the land-use changes in 2028 and 2038 and calculate each category’s increase or decrease proportion.

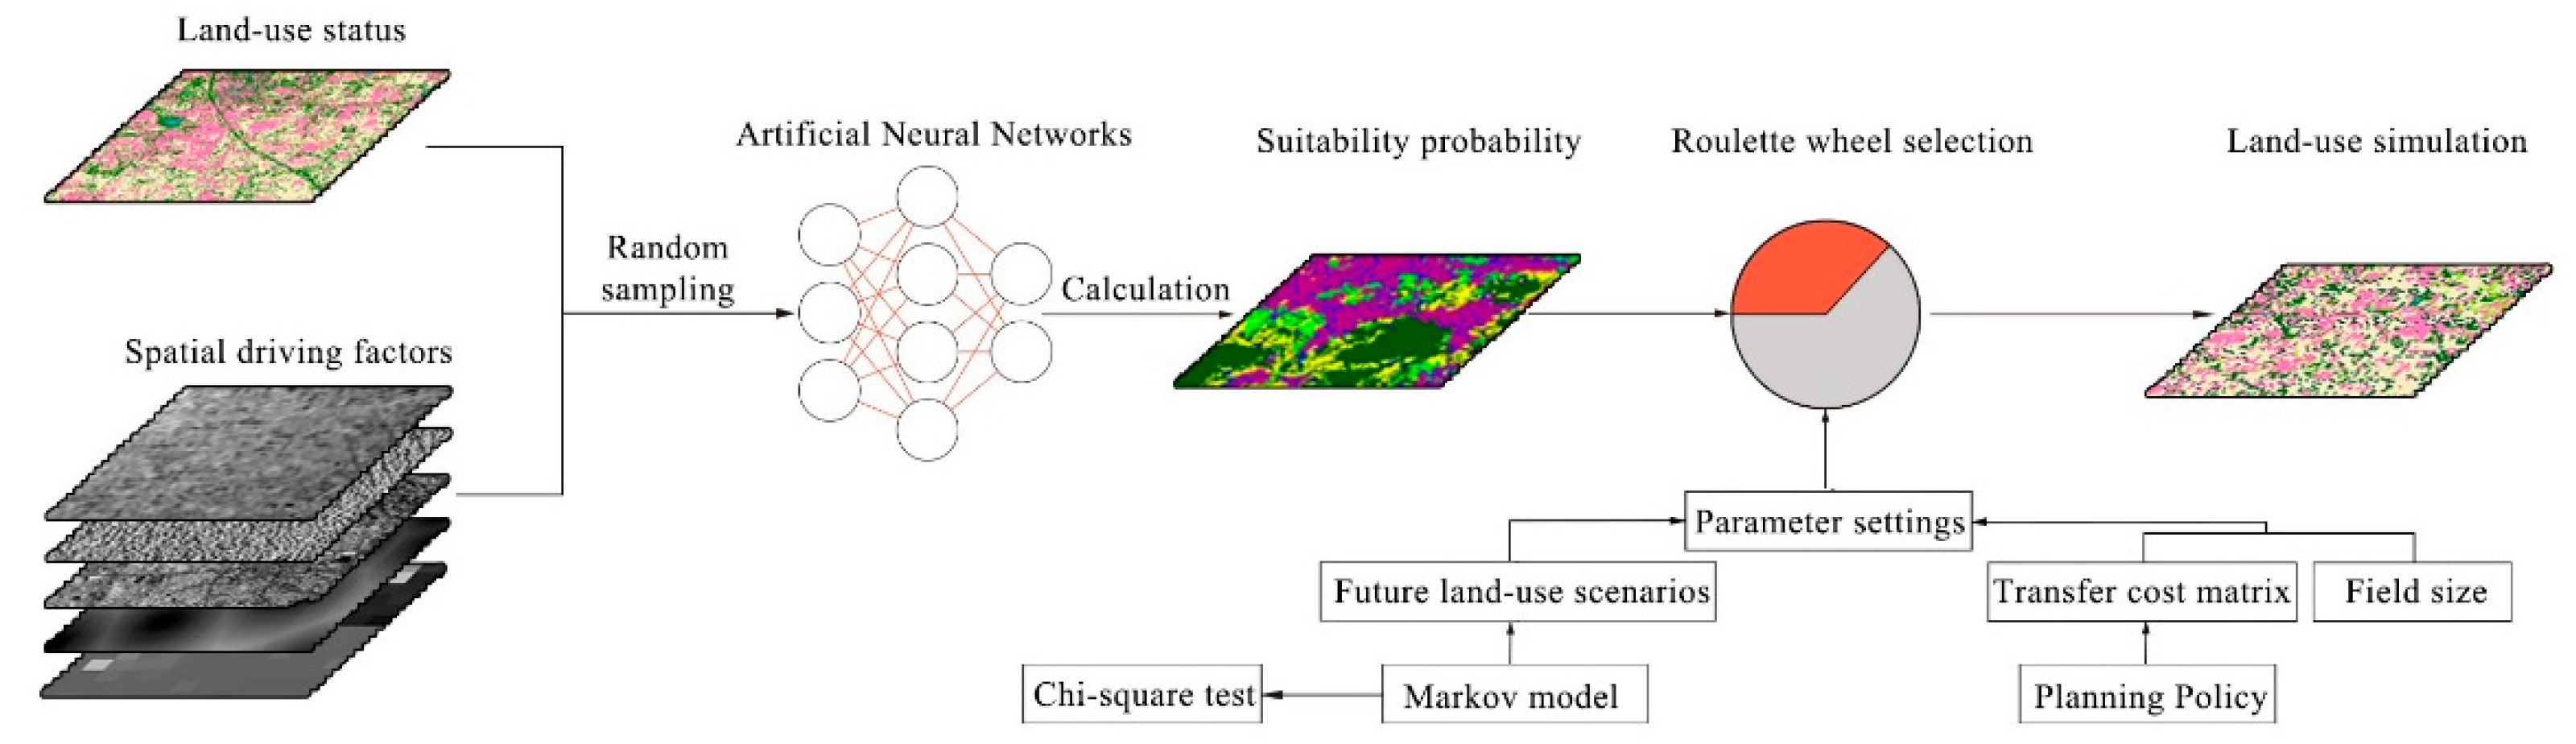
3.2. Simulation of Land-Use Morphology Based on GeoSOS-FLUS Model

In this study, the GeoSOS-FLUS model was used to simulate land use by setting the number of raster data rows to 1461 × 1437 and the resolution of image elements to 30 m. In the GeoSOS-FLUS model, an artificial neural network (ANN) algorithm was first used to obtain the likelihood of suitability of each land-use type within the study area. This was calculated from the Phase I land-use data and multiple driving factors (in terms of topography, transportation, location, economy, etc.) that contained both human activities and natural effects. An adaptive inertial competition mechanism based on the roulette wheel selection was then used to resolve the combined effects of natural and human activities. The uncertainty and complexity of the interconversion of land-use types were then addressed to present simulation results with high accuracy [34,35,36].

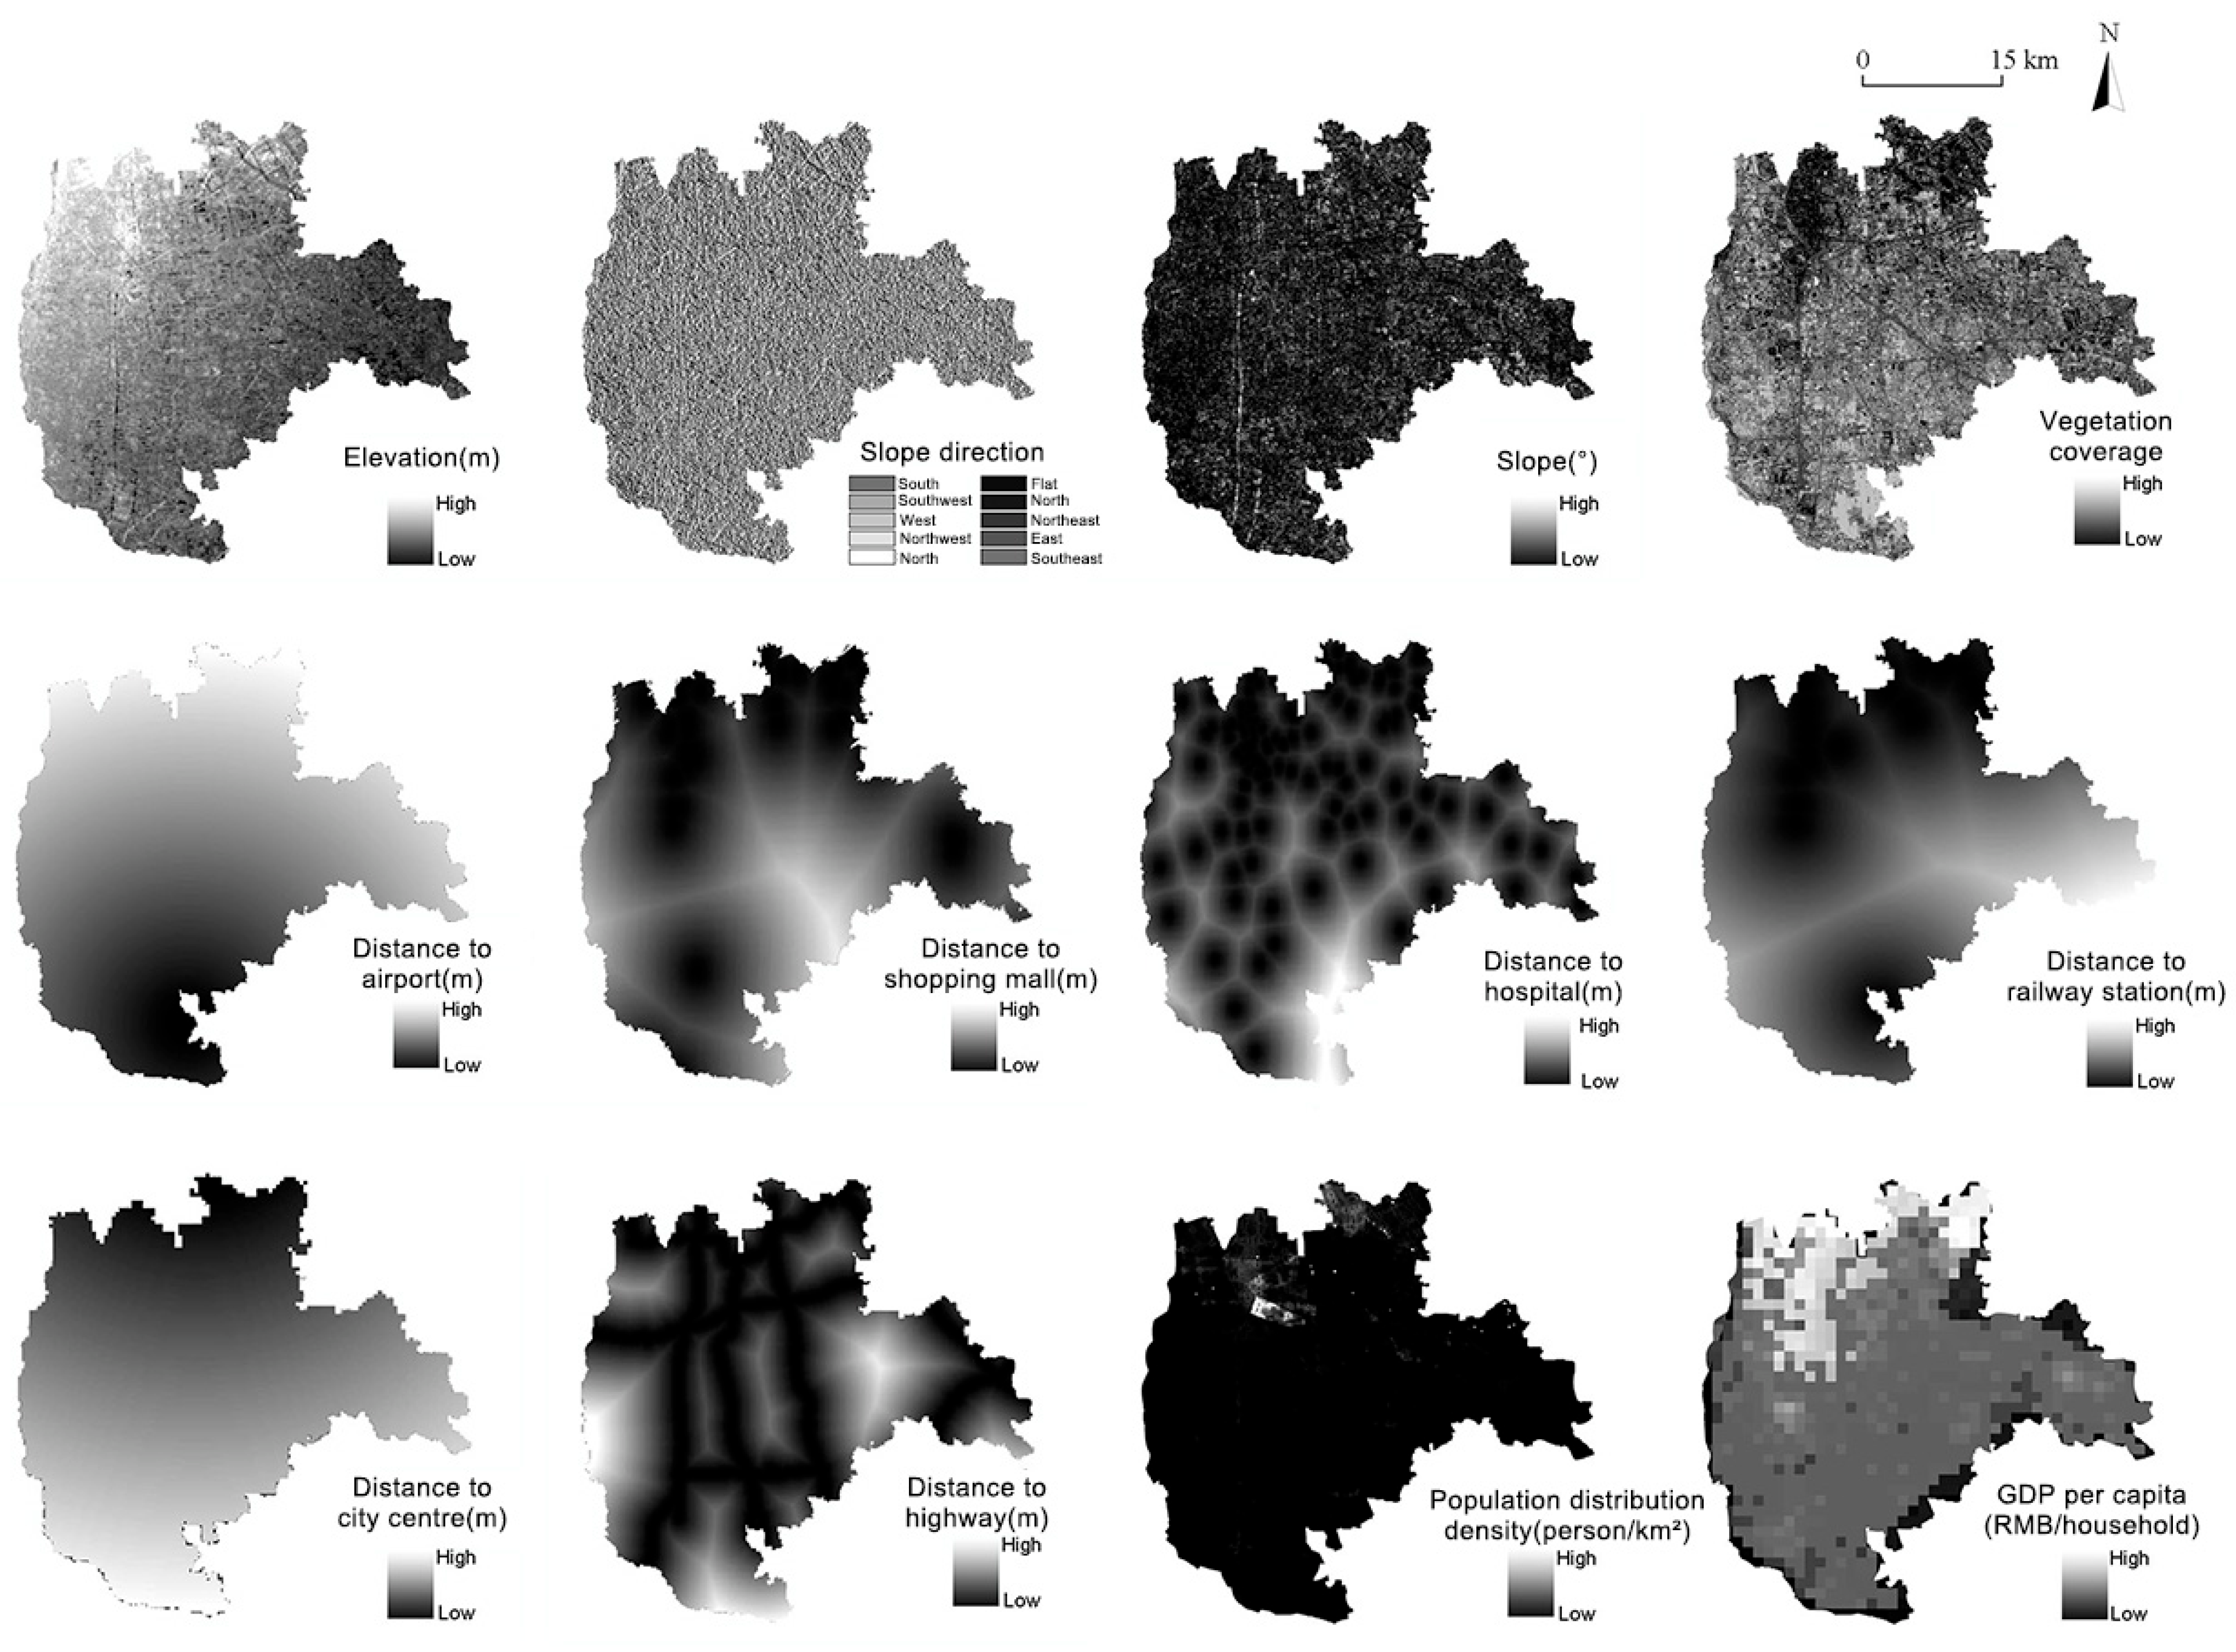
3.2.1. Selection of Driving Factors

Considering the principles of accessibility, consistency (consistency in time, space, coordinates and row numbers), quantifiability and spatial variability of the data on the influencing factors, the driving factors were selected from three categories: nature, society and economy. A total of 12 factors were selected (Table 1, Figure 2).

3.2.2. Parameter Measurements

(1)
Total demand
The land-use demand quantity in the model was the amount of future land area change. This article applied the number of grids (Number of grids: Daxing District area/number of grids for each type of land use) for calculation based on changes in the land-use area between 2008 and 2018 and applied the Markov model to find the transfer matrix regarding the change in land-use area for Daxing District between 2008 and 2018. It also predicted the change in land-use area in 2018 and obtained the land-use demand in Daxing District in 2018. The results are shown below (Table 2).
(2)
Land-use Simulation Under Multiple Scenarios
The conversion cost is the ease of conversion between categories, and there are always two values 0 and 1. Future land-use changes in cities are influenced by different constraints, and different constraints are taken into account when modelling land-use changes so that the future development trend of cities, as well as the intensity and direction of urban expansion, can be controlled in the model predictions. Based on the Daxing Zoning Plan (Territorial Spatial Planning) (2017–2035) (hereinafter referred to as the “Daxing Zoning Plan”) prepared by the Daxing District Party Committee and District Government in collaboration with the Beijing Municipal Commission of Planning and Natural Resources, this study added relevant planning constraints to the simulation of the future development of Daxing District. It stipulated that the model should be able to predict the city’s future development. The probability of converting non-construction land into construction land within these restricted areas was zero, allowing the simulation to develop under specific planning constraints [37,38]. Different cost matrices were set up based on the natural development scenario, the cultivated land protection scenario and the ecological control scenario to establish three types of land-use development models (Table 3).
Under the natural development scenarios, the urban development of the Daxing District was simulated under pristine natural conditions alone, without considering factors such as planning control and city protection. Using the current land-use data from 2018 as the training sample, 9 driving factors affecting land-use change were input for neural network training to calculate the probability distribution of suitability for each land-use type across the study area. The neural network based on the emergence probability calculation module in the FLUS model was activated to obtain simulations of each land-use type in the Daxing District in 2028 and 2038.
Under the cultivated land protection scenarios, the Daxing Zoning Plan emphasised the need to effectively implement cultivated land protection systems and to further increase governance efforts to maintain the quantity and quality of cultivated land, which was essential for sustainable agricultural development. The land-use modelling under this scenario could provide a reference for the authorities concerned in planning for urban development while giving priority to the protection of cultivated land [37].
Under the ecological control scenarios, ecological control zones could maintain the continuity of the ecosystem and prevent urban sprawl while respecting the natural ecosystem of the city and having a reasonable environmental carrying capacity. Based on the protection of ecological control zones considered under natural development conditions, current ecological lands such as mountains, forests, rivers and lakes with important ecological values and legally protected spaces such as water conservation areas, nature reserves and scenic spots were designated as ecological control zones. Future land-use changes were modelled following the principle that the ecological area would not be reduced and that its functions would not be diminished. This scenario could coordinate the development of urban scale and ecological patterns, thus enhancing ecological quality and achieving sustainable urban development [37].
(3)
Set parameters for each land-use type domain factor
The domain factor parameter of the land-use type indicates the strength of the expansion ability of the land-use type, and the parameter ranges from 0 to 1. The closer the value is to 1, the stronger the expansion of the land-use type. In this paper, based on the reference of relevant literature, combined with the transfer of land-use types in Daxing District, the field factor parameters of each category were preset for simulation tests, and after repeated debugging of the model, the field factor parameters of each land-use type in Daxing District were finally set (Table 4).
(4)
Cellular Neighbourhood Size and Accuracy Test
The neighbourhood value reflects the size of the cellular neighbourhood and is an odd number. Since the neighbourhood has a significant influence on the probability of each raster converting to a certain type of land use at a certain point in time, the best neighbourhood value needs to be determined. As such, the neighbourhood values were set to 1, 3, 5 and 7 for the simulations. According to the results, the model lasted longer as the neighbourhood value increased with the same settings, but the simulated change in each category could be found in the process of the first 10 iterations. Each category was rapidly converted and the simulated amount was close to the set target value of land demand. Thereafter the level of change tended to slow down and remained stable when the number of iterations exceeded 50. From the predicted values, the areas for grassland, woodland and water bodies reached the predicted quantity, while the quantity of cultivated land and construction land differed from the set value and was closest to the target predicted value when the neighbourhood value was 3.
To verify the credibility of the simulation results, the current land-use map of 2008 was used to obtain the 2018 land-use simulation map. The 2018 land-use simulation map was compared with the 2018 land-use interpretation map (Figure 3). A random sampling model was chosen, and 10% of the valid rasters were selected according to the total number of samples. It was calculated that the kappa indices were all greater than 0.75; therefore, it could be judged that the settings of each parameter were reasonable. When the neighbourhood value was 3, the maximum kappa value was 0.802; therefore, the best value for the neighbourhood could be judged to be 3.
At this point, it was determined that the model had sufficient accuracy to simulate future land-use changes for the study area, and the model and related parameters could be used to further simulate future land-use projections for Daxing District in 2028 and 2038.

4. Results

4.1. Analysis of Land-Use Change Area from 2008 to 2018

The change in the land-use area of Daxing District from 2008 to 2018 (Table 5) showed that the area of cultivated land, woodland and water bodies in the Daxing District decreased and the area of grassland and construction land increased between 2008 and 2018. The largest decrease and increase in cultivated land and construction land were 131.86 km2 and 116.68 km2, respectively, and the average annual changes were 13.2 km2 and 11.67 km2, respectively. The area of water bodies was second only to cultivated land with an annual average reduction of 1.61 km2, while the woodland area had a relatively small change, decreasing at an annual average rate of 0.7 km2.

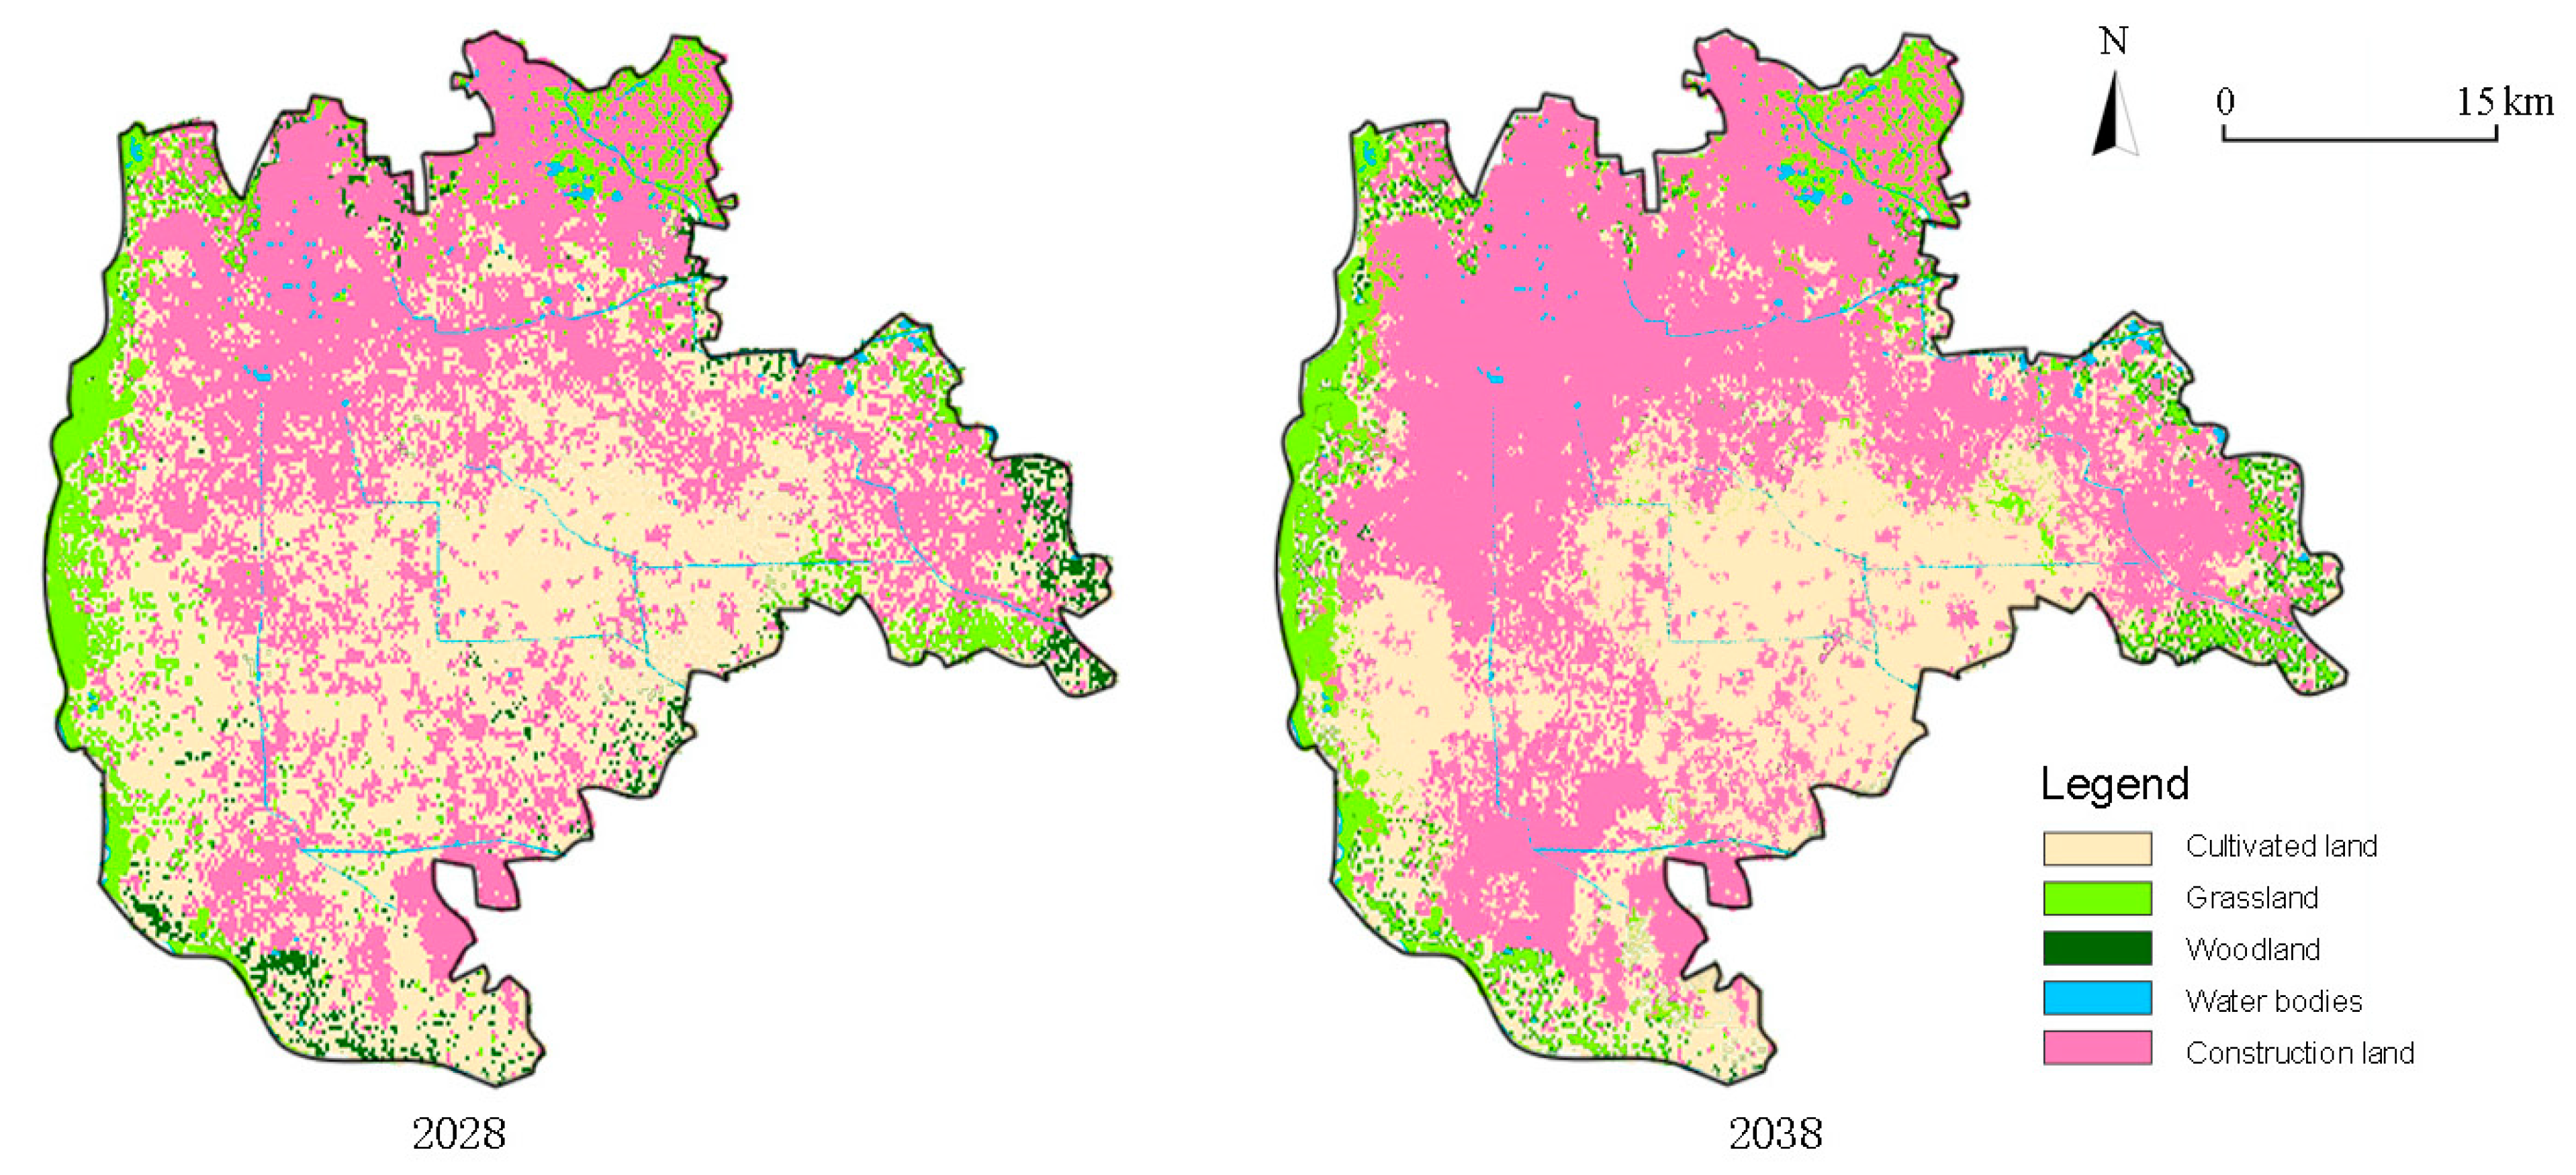
4.2. Land-Use Change Prediction from 2018 to 2038

The transfer matrix of land-use change area for Daxing District from 2008 to 2018 (Table 6) showed that most of the cultivated land was retained, with 156.01 km2 transformed into construction land, accounting for 23.16% of the total cultivated land area. The vast majority of grassland was transformed into construction land, with 0.08 km2 transformed, accounting for 81.34% of the total area. Most of the woodland was transformed into cultivated land and construction land, with the conversion rate being 59.04% and 17.27%, respectively, and only 21.15% of the area was preserved. More than half of the water bodies were converted into grassland, followed by construction land; 9.15% of the construction land was converted into cultivated land, with the remaining changes being less significant.
To verify the applicability of the Markov chain model to land-use changes, the simulation for land-use change quantity was carried out using the area of various types of land use in the Daxing District in 2008 as the base. The projected results of the area of cultivated land, grassland, woodland, water bodies and construction land in 2018 were compared with the actual area of various types of land use in the Daxing District in 2018, as shown in Table 7, indicating that the model had a high degree of confidence.
The study predicted land-use change in 2028 and 2038 through the land-use area conversion matrix and calculated the percentage increase or decrease for each category. Results are shown in Table 8, which showed that the largest decreases in land use are for cultivated land and woodland, and the largest increases were seen in construction land.

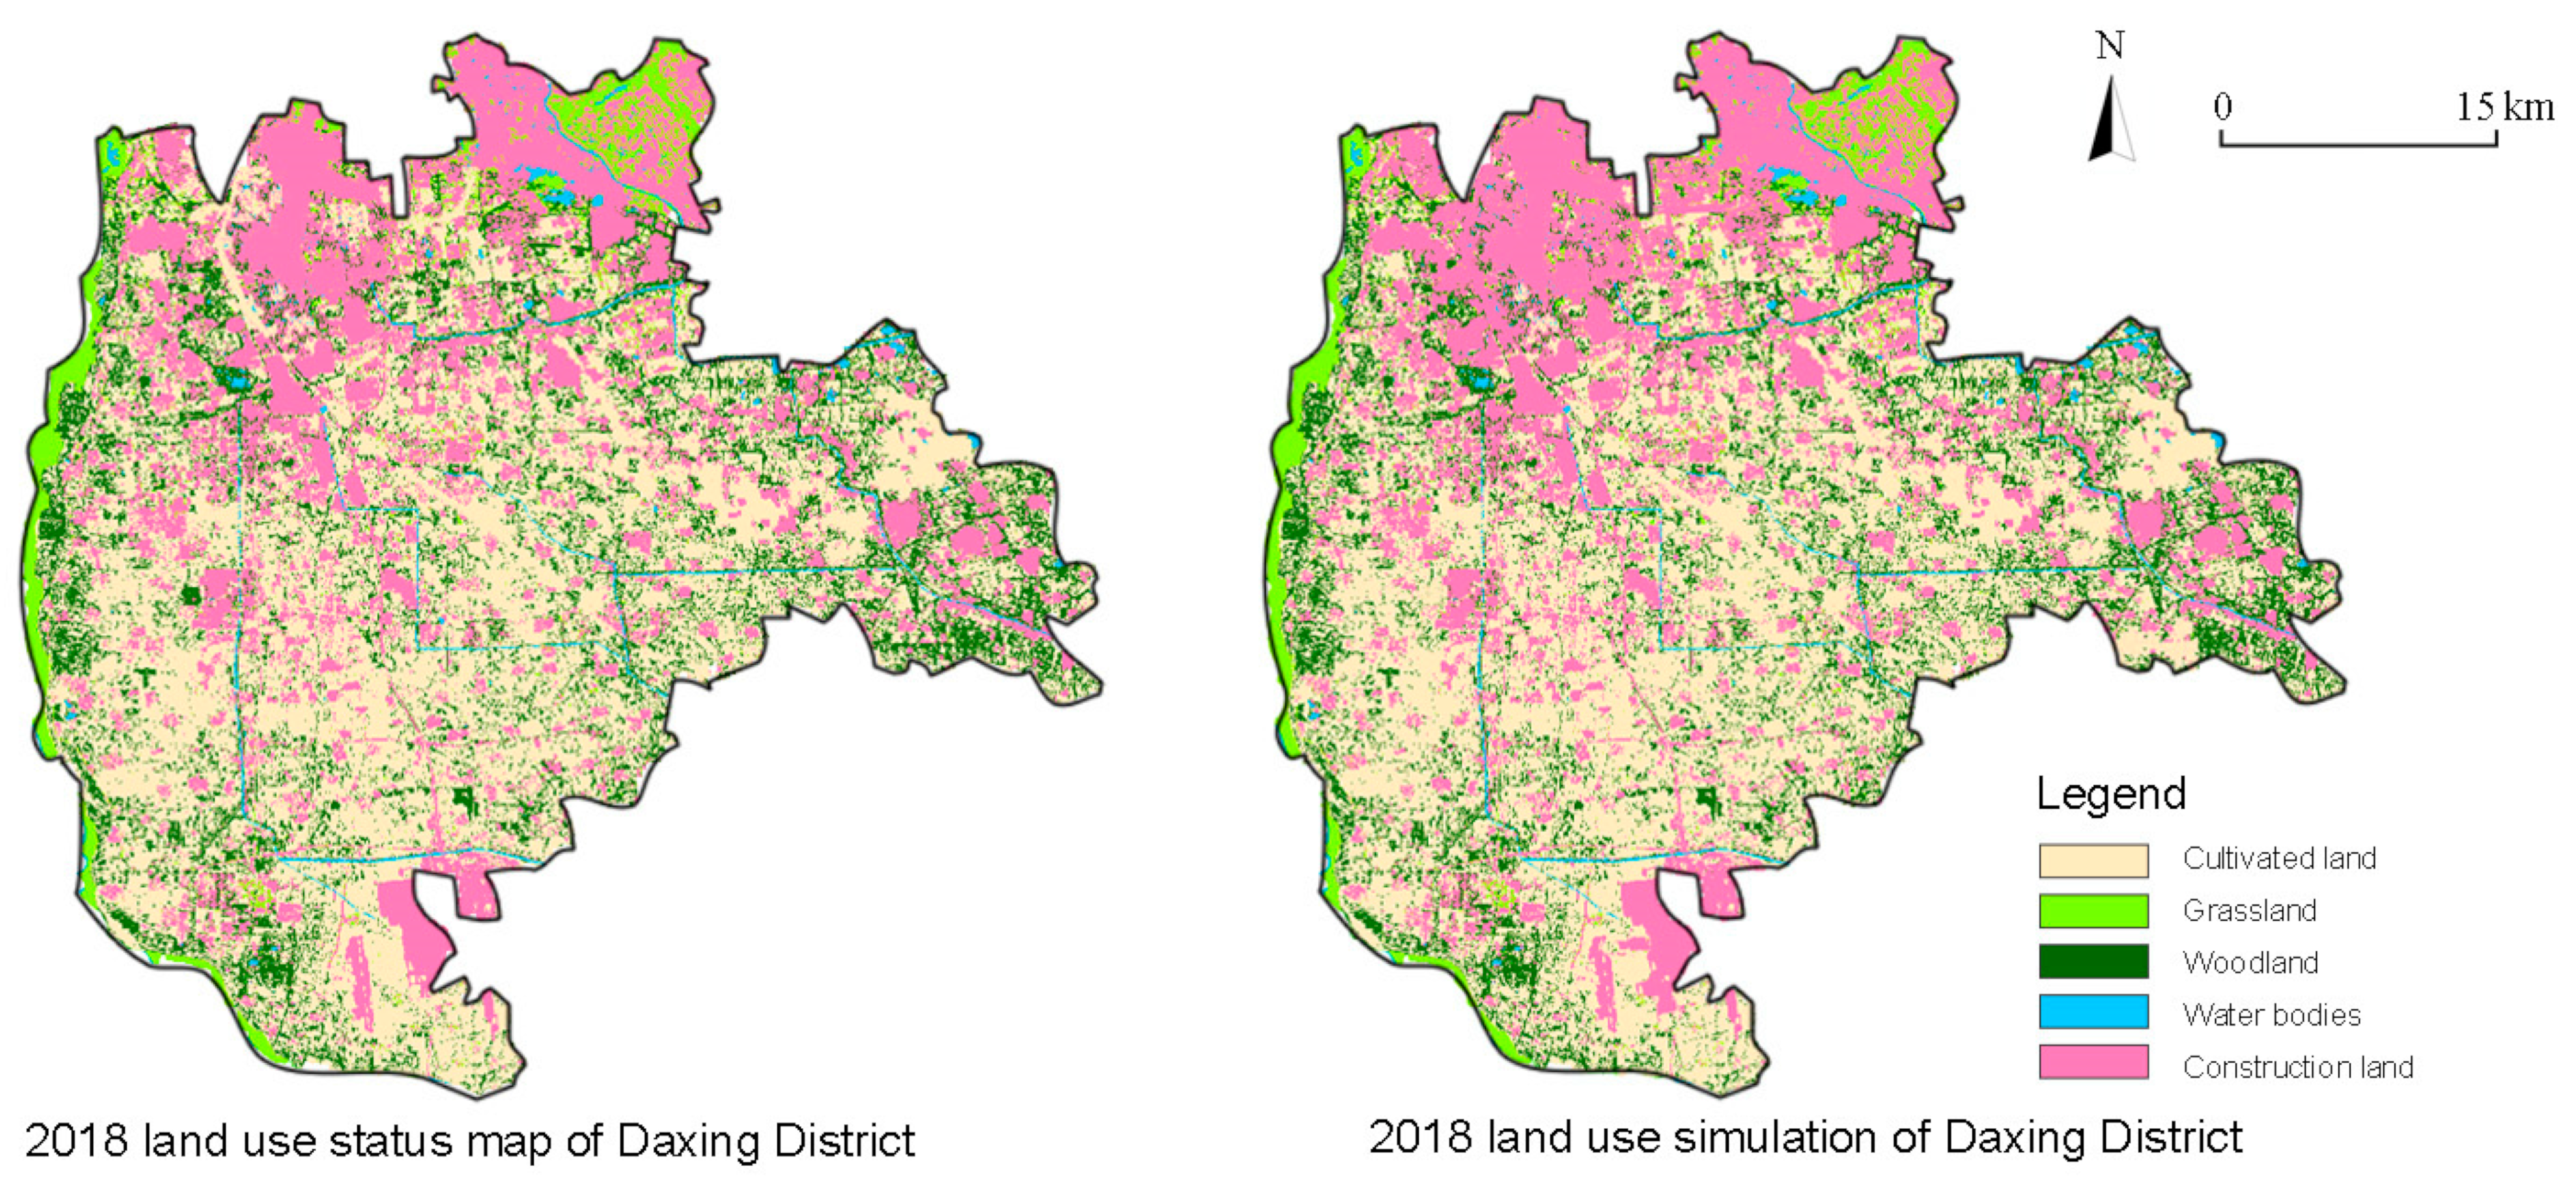
4.3. Natural Development Scenario Simulation Results

Compared with the area of each type in 2018, the predicted values of cultivated land, woodland and water bodies decreased and the predicted values of grassland and construction land increased as shown in Figure 4. The area change for each land-use type is shown in Figure 5.
The results show that under the condition that no constraints were adopted, the proportion of cultivated land, woodland and water bodies would decrease by 0.78%, 0.37% and 0.31%, respectively, in 2028, while grassland and construction land would increase by 6.09% and 3.22%, respectively. By 2038, the proportion of cultivated land, woodland and water bodies would decrease by 16.71%, 3.04% and 0.18%, respectively, while grassland and construction land would increase by 4.75% and 13.88%. From the perspective of the change in the proportional area, the land-use types with the largest decrease and increase in the area were cultivated land and construction land, respectively. The decade of 2018 to 2028 was the decade in which large areas of cultivated land would be converted to construction land, some woodland would be converted to grassland, and the area of construction land would increase and spread outwards.

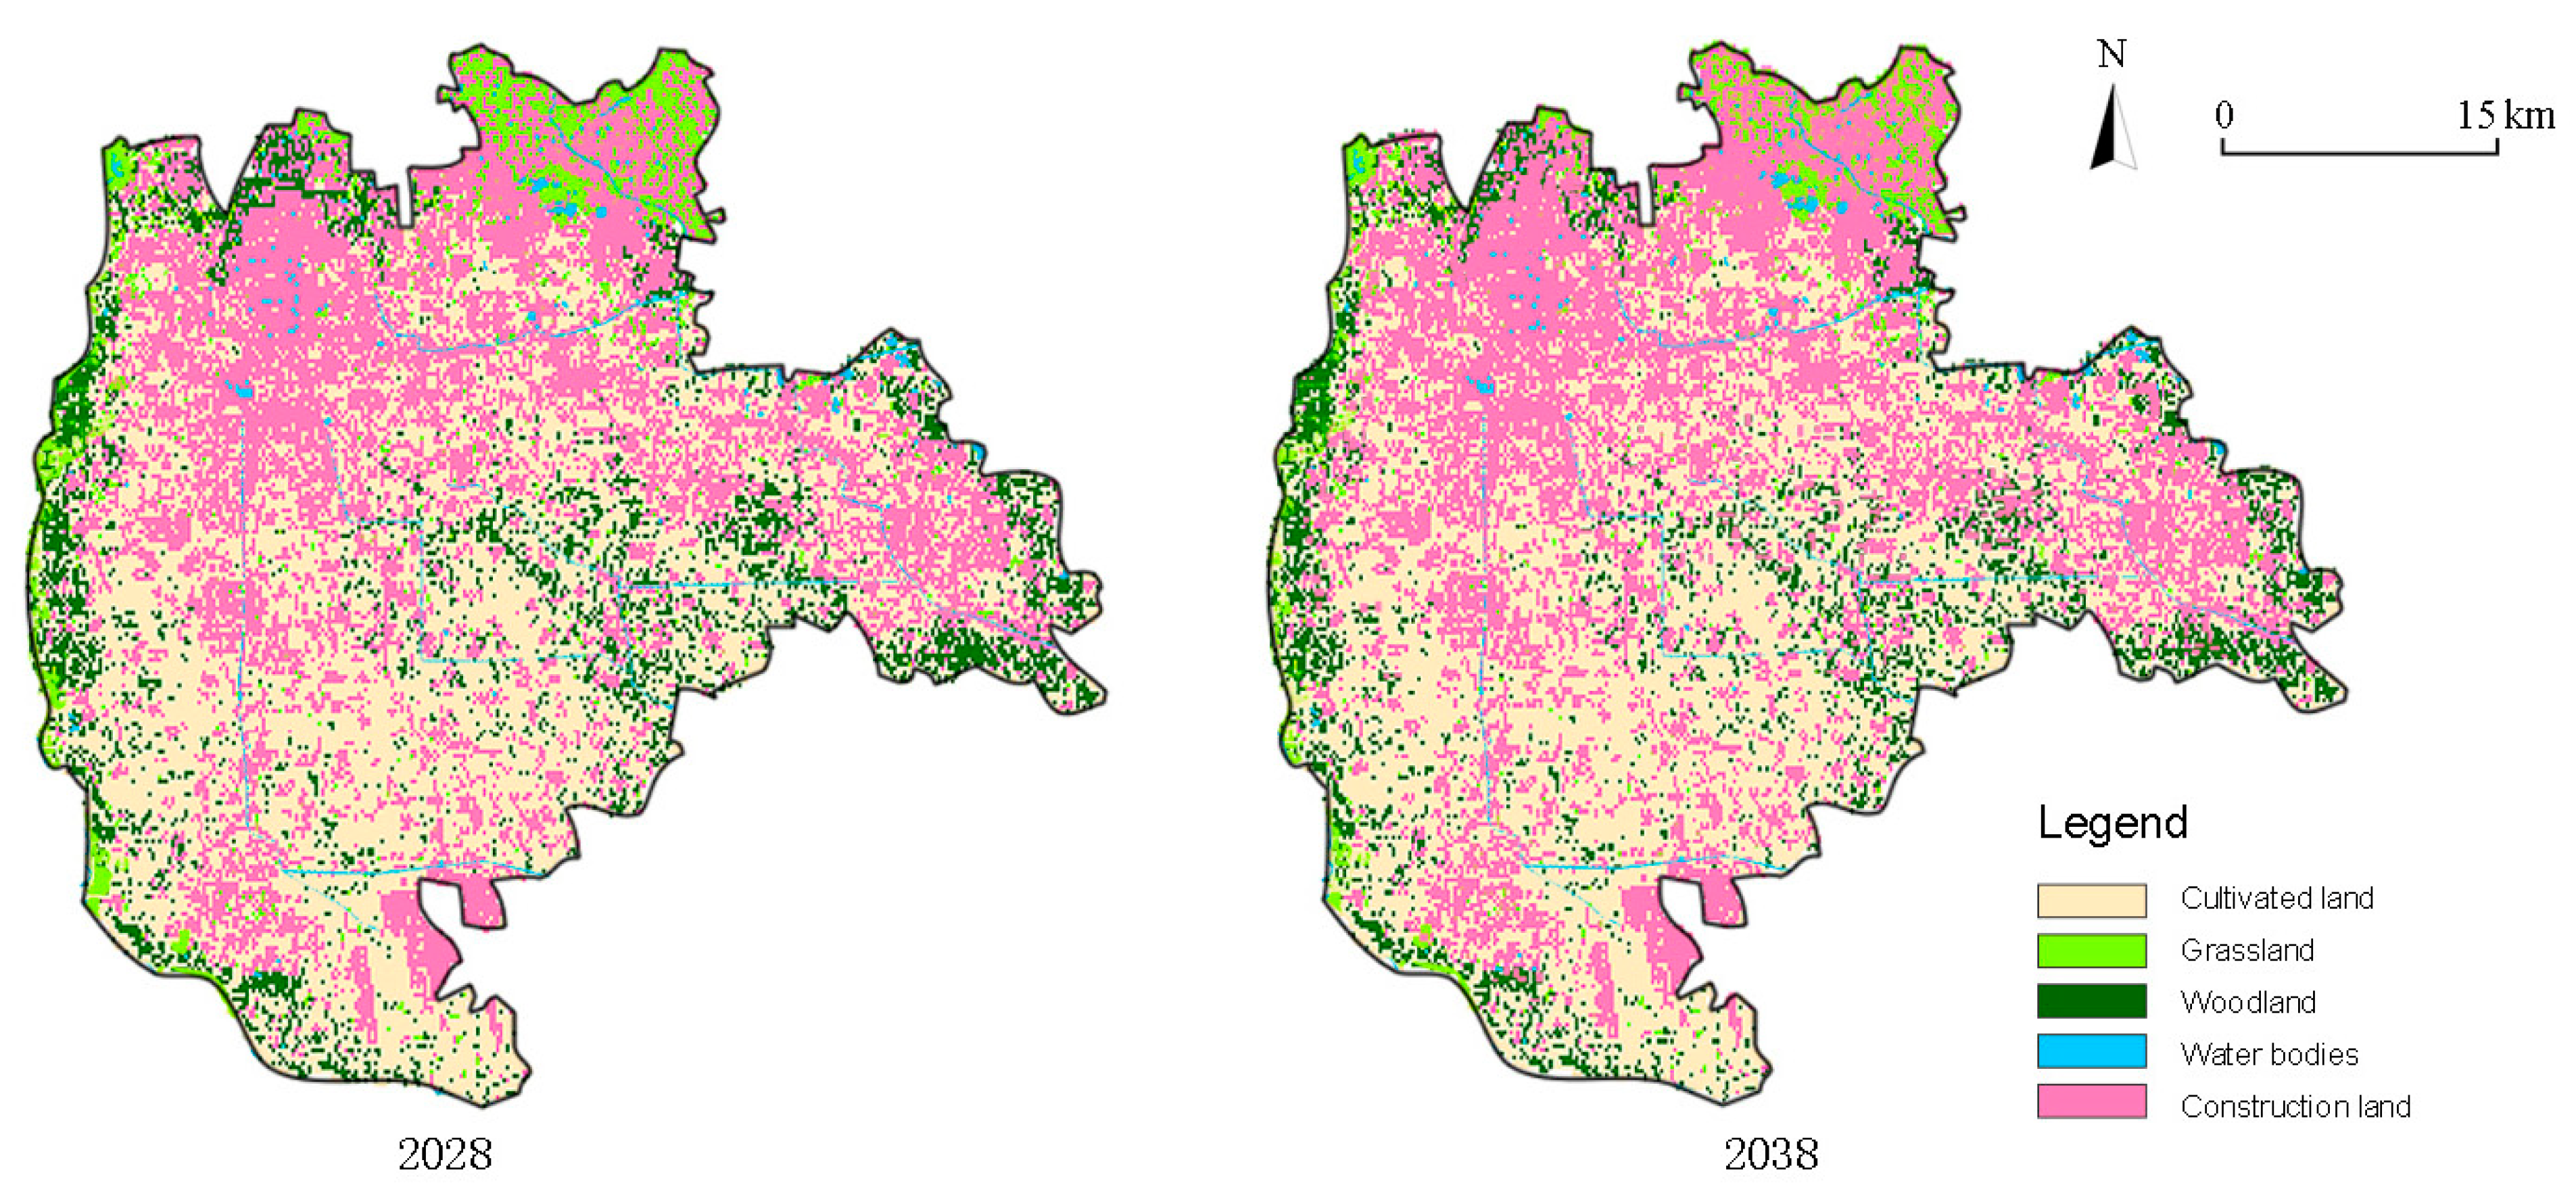
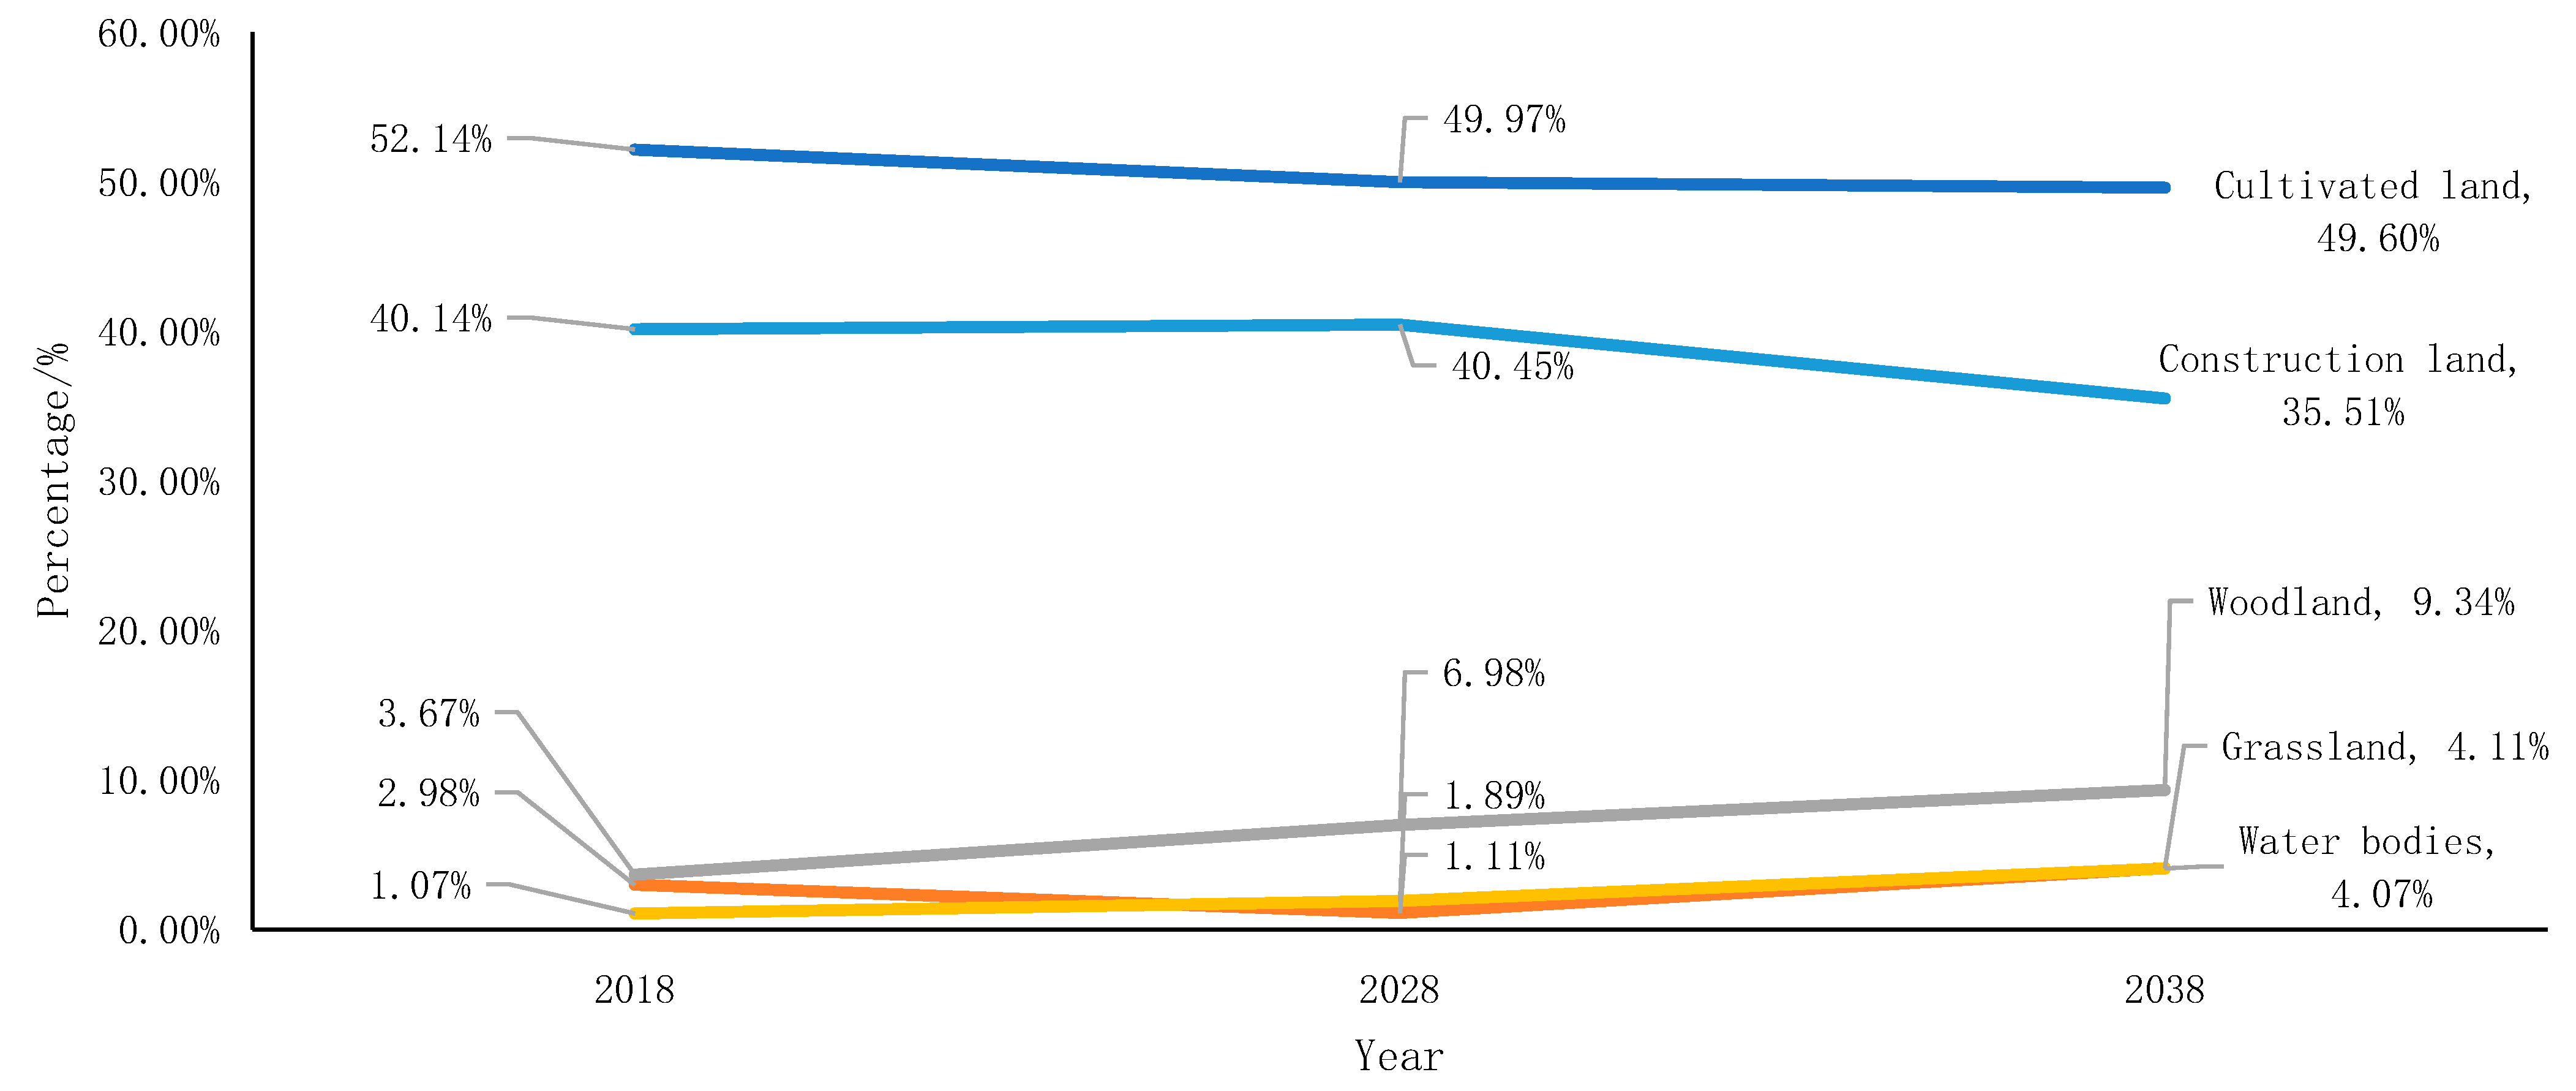
4.4. Cultivated Land Protection Scenario Simulation Results

The simulations for each land-use type in Daxing District in 2028 and 2038 are shown in Figure 6. Compared with the area of each type in 2018, the projected values for cultivated land and construction land decreased, while the projected values of grassland, woodland and water bodies increased. The area change for each land-use type is shown in Figure 7.
As a result, compared to the proportion of each type of land-use area in 2018 and 2028, construction land increased by 0.31%, woodland and water bodies increased by 3.31% and 0.81%, respectively, while grassland area decreased by 1.87%. By 2038, the area of construction land showed a slight contraction, with a decrease of 4.63%, while woodland, grassland and water bodies increased by 5.67%, 1.13% and 3.00%, respectively. The simulation showed that in 2028, the trend of increasing construction land was controlled, with some of the grassland converted into construction land. The area of woodland and water bodies slowly increased, and in 2038, the construction land started to decrease, while the proportion of woodland, grassland and water bodies gradually and steadily increased.

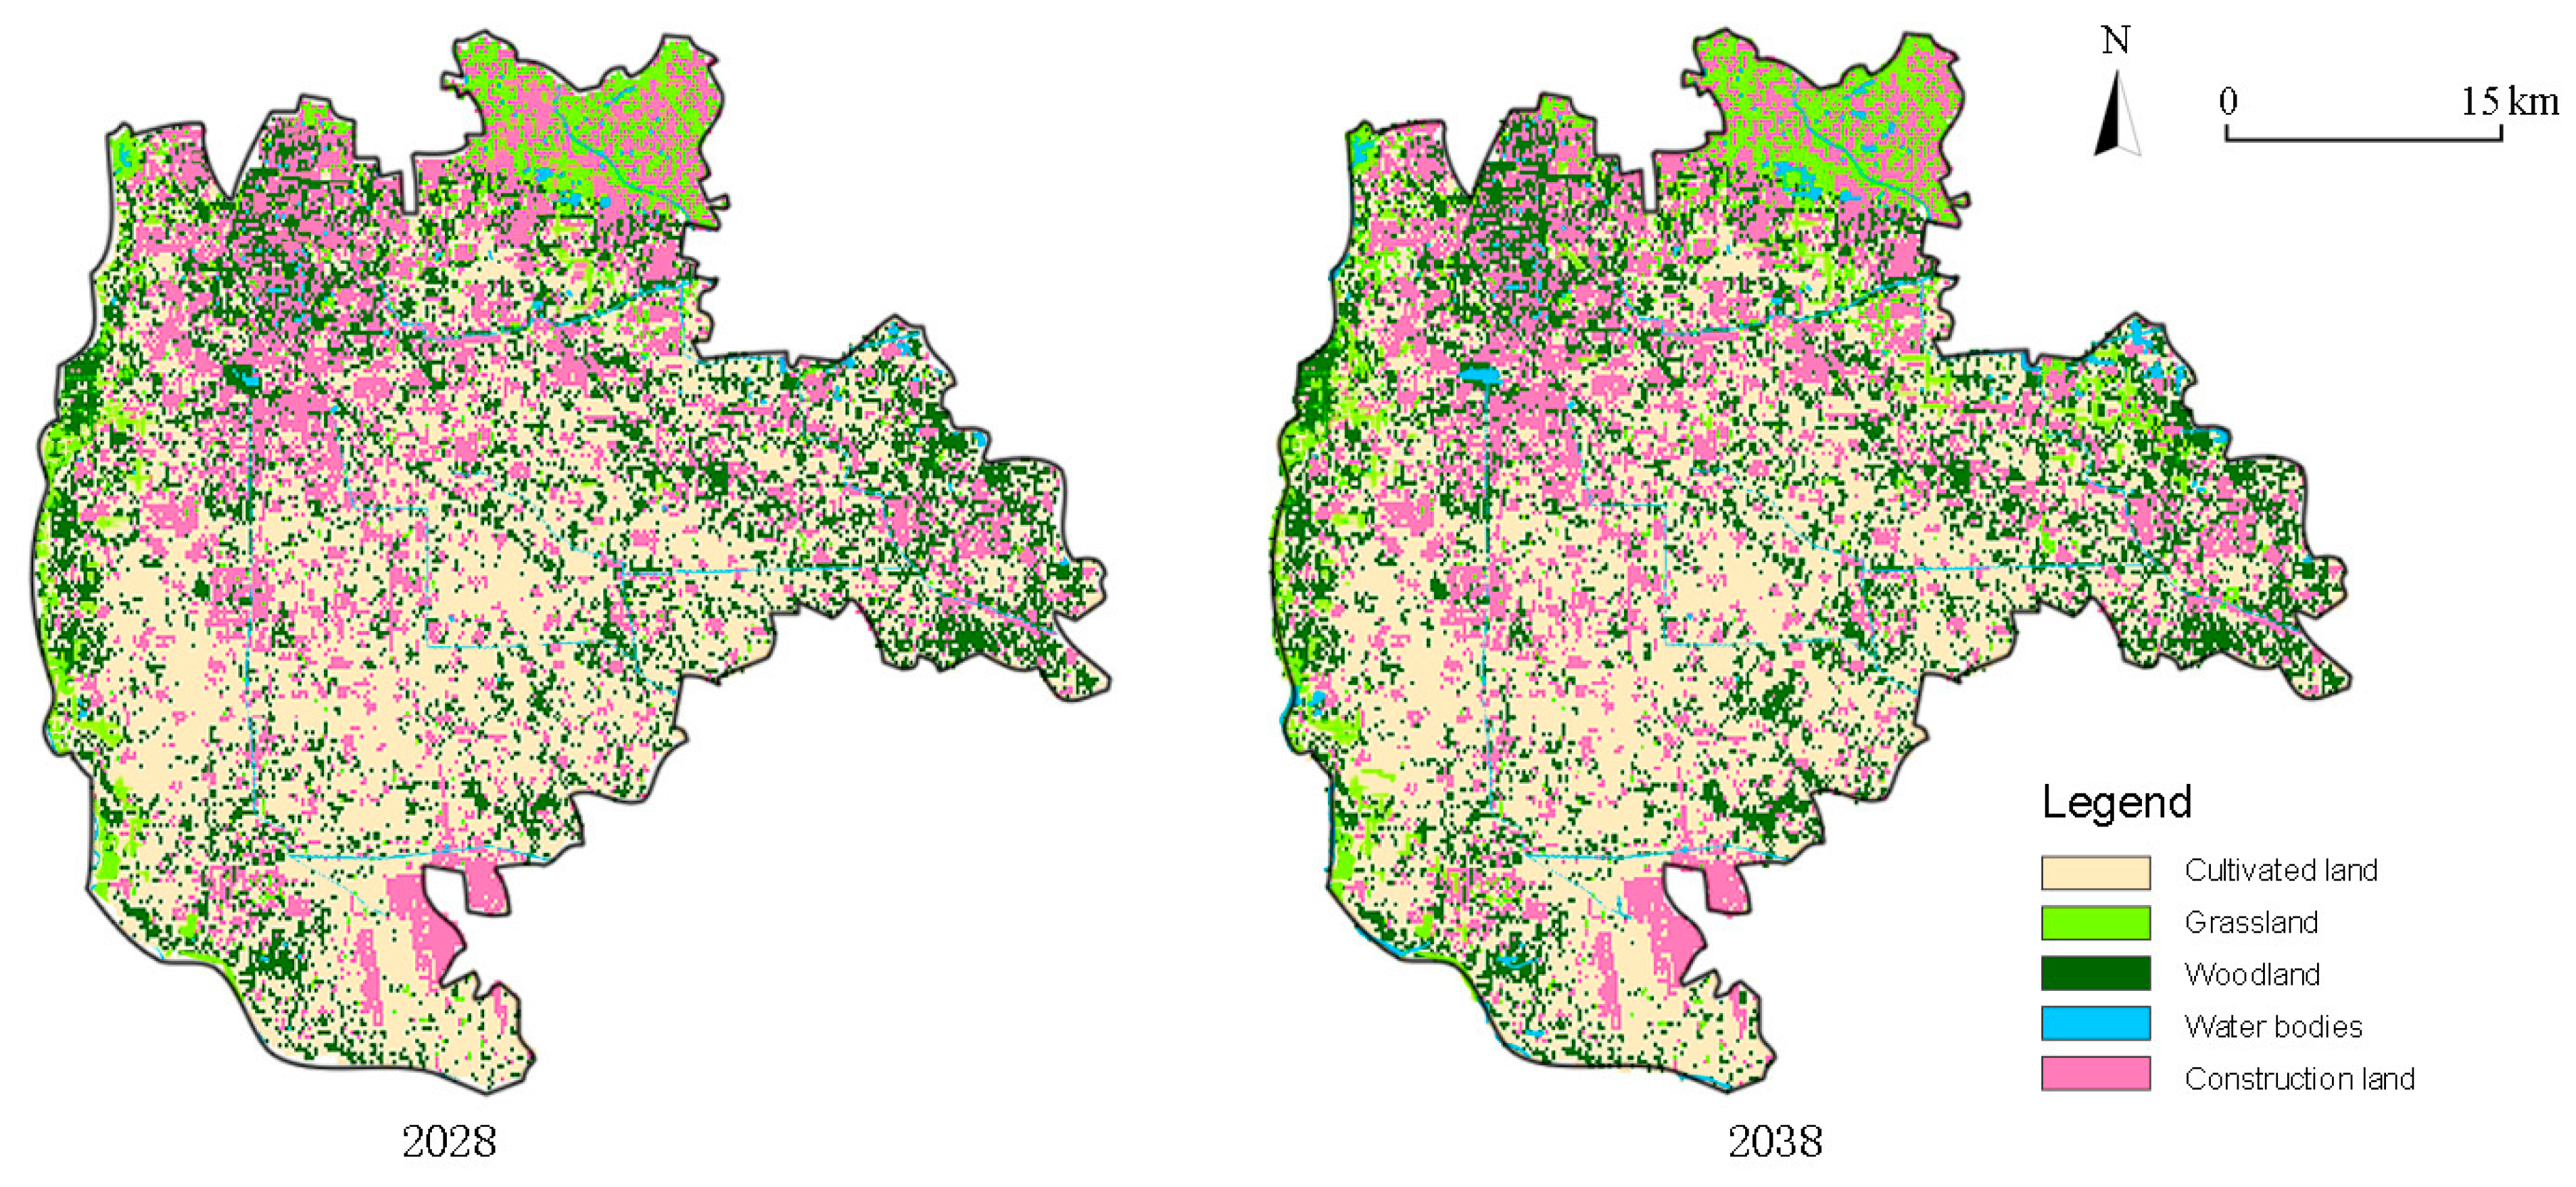
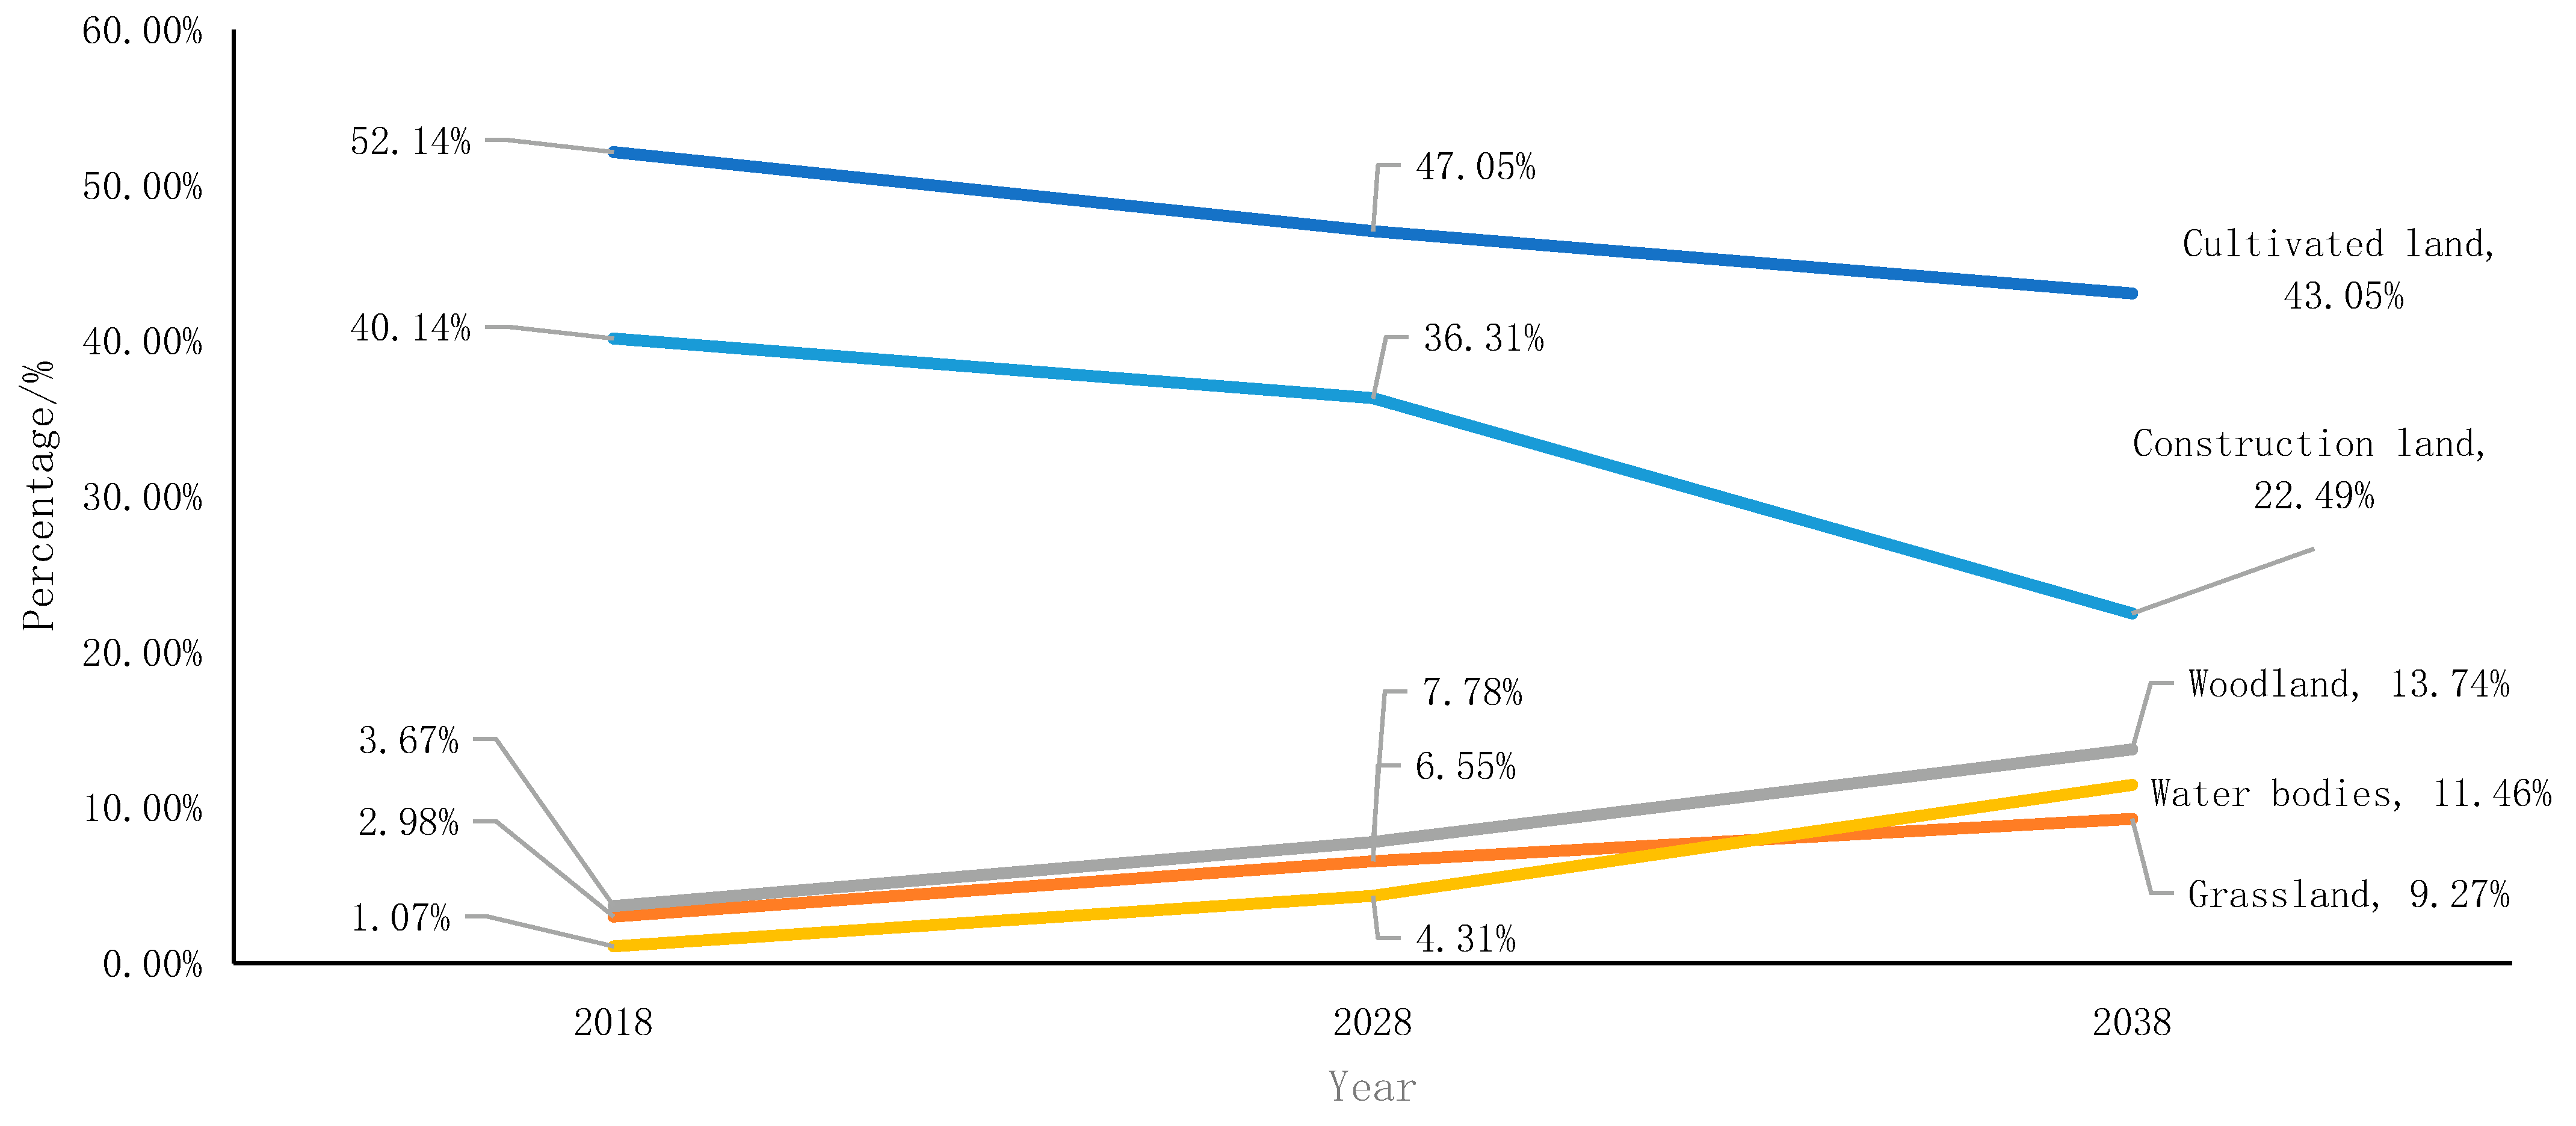
4.5. Cultivated Ecological Control Scenario Results

The simulations for each land-use type in Daxing District for 2028 and 2038 are shown in Figure 8. Compared with the area of each type in 2018, the projected values of cultivated land and construction land decreased, and the decrease was greater than that for the cultivated land protection scenario. On the other hand, the proportion of grassland, woodland and water bodies increased significantly, and the area of each type of land-use change is shown in Figure 9.
Under the ecological control scenario, following the principle of only increasing and not decreasing the area of ecological protection areas, the simulations showed that compared to 2018, in ten years, the proportion of cultivated land and construction land would decrease by 5.09% and 3.83%, respectively, while the proportion of woodland, grassland and water bodies would increase by 4.11%, 3.57% and 3.24%, respectively. In twenty years, the proportion of cultivated land and construction land would decrease by 9.09% and 17.65%, respectively, while the proportion of woodland, grassland and water bodies would increase by 3.24%. Grassland and the proportion of water bodies increased by 10.07%, 6.29% and 10.39%, respectively. In terms of the changing trend, woodland had the largest growth rate from 2018 to 2028, followed by grassland and water bodies, while the proportion of cultivated land and construction land showed a significant decrease. Between 2028 and 2038, woodland, grassland and water bodies continued to increase at a stable rate, while the rate of decrease in cultivated land slowed down, and construction land decreased significantly.

5. Discussion

This study assessed the past and future land use in Daxing District, Beijing. During the period 2008–2018, the area of cultivated land, woodland and water bodies decreased, and the area of grassland and construction land increased, with the largest decreases and increases in cultivated land and construction land, 131.86 km2 and 116.68 km2, respectively. As a typical urban fringe area in Beijing, Daxing District carried the function of supporting urban services and has the advantages of convenient transportation and low land prices close to the central city. Since 2004, the northern part of Daxing District, relying on its geographical advantages, has vigorously developed Daxing New Town and Yizhuang New Town while demolishing and relocating villages in the planning area for the construction of high-tech industrial parks and infrastructure, such as the Biomedical Industrial Park, New Media Industrial Park and New Energy Vehicle Industrial Park, etc. After the Beijing Olympic Games in 2008, Beijing entered a phase of rapid urbanisation. In the early stages of construction, it comprised low-end industries such as logistics, agricultural product trading and garment wholesaling, mainly in Huangcun Town, Xihongmen Town and Old Palace Town. These areas were dotted with many merchants, and the buildings were mostly simple bungalows, with hidden fire hazards, traffic congestion and a poor living environment, which were not conducive to the building of high-tech industries in Daxing District.
Since 2014, Daxing District has entered a period of great construction and development, focusing on the South of the City Action Plan, the transformation of key urban–rural areas and the construction of the new airport. Up to May 2017, the relocation work in Daxing District involved 11 towns, 149 villages, 45,100 households and 116,200 people, with many villages decaying and losing population, cultivated land being abandoned and degraded into grassland and the construction of industrial parks causing a significant increase in construction land. From 2008 to 2018, the level of urbanisation in the north gradually increased, but the industries and population were still dominated by low-end industries, agriculture and its related practitioners; the level of urbanisation in the south was lower, and land use was dominated by cultivated land, but with poor economic benefits.
Future projections showed that in the natural development scenario, from 2018 to 2028 and then to 2038, the area of cultivated land, woodland and water bodies would continue to decrease, while the area of grassland and construction land would display an increasing trend. The largest decrease in area share was in cultivated land at 216.10 km2, and the largest increase was in construction land at 143.54 km2. When the rapid urban expansion is allowed without restraint, land conflicts arise between green space and construction land, and a reasonable green buffer space cannot be retained between urban construction areas to form a continuous large ecological barrier. This has led to the erosion of cultivated land and the degradation of woodland and other areas of grassland. At the same time, under this land-use pattern, large areas of inefficient industries will be formed, preventing the region from transforming into a high-tech industry. Moreover, the scattered and urban villages will hinder the integrated development of urban and rural areas and the reform of rural revitalisation.
Under the cultivated land protection scenario, compared with 2018, in 2028, the trend of increasing construction land would be controlled, the rate of reduction in cultivated land would be slowed, some grassland would be converted into construction land, and the area of woodland and water bodies would slowly increase, which was in line with the current policy of “decongesting non-capital functions”. Moreover, in 2038, the construction land would start to decrease, and the proportion of woodland, grassland and water bodies would gradually and steadily increase. With an emphasis on ensuring a sufficient amount of permanent basic farmland, the scale of construction land can be gradually controlled within 20 years, while the improvement in the quality of cultivated land can also form an ecological barrier, which is conducive to the increase in the area of woodland, water bodies and grassland. It is recommended that (1) high-quality concentrated cultivated land in the central and northeastern parts of the city be protected, while key construction projects to be implemented shortly be avoided, which can, to a certain extent, contribute to the development of the regional economy and reduce the pressure on the protection of cultivated land, and (2) low-yielding cultivated land in the south be improved, the relationship between construction land and other lands and cultivated land and grassland and forest land be clarified, the pollution of cultivated land be removed and the quality of cultivated land be improved, such as the cultivated land in Panggezhuang Town and Yufa Town. It can achieve some of the development goals for 2035 in the Daxing Zoning Plan: to take over the appropriate functions of the central city and reduce the quantity and improve the quality of development, realise a new pattern of urban–rural integration, achieve the protection of the quantity, quality and ecology of cultivated land and form a mature model for the reform of the rural land system [32].
Under the ecological control scenario, the woodland would continue to grow at the highest rate from 2018 to 2028, followed by grassland and water bodies, with the proportion of cultivated land and construction land area showing some reduction. Between 2028 and 2038, the woodland, grassland and water bodies would continue to increase at a steady rate, while the rate of reduction in cultivated land would slow down, and construction land would be significantly reduced. After the strict designation and protection of ecological protection areas, combined with the reduction in construction land and the return of greenery, the woodland would grow rapidly, which was conducive to the formation of large ecological patches. Moreover, forest parks, scenic spots and other natural protection systems could be connected with the urban park system, which could comprehensively improve the quality of green ecological space in the whole region. The control of construction land and cultivated land was faster in this scenario than in the cultivated land protection scenario, and the cultivated land could be restored after the ecological quality of the area is improved. It is recommended to (1) take strictly legal and administrative protection of the ecological core protection area, such as the areas along the Yongding River, the Liuhezhuang Forest and the Nanhaizi Wetland Park, and (2) implement the “two lines and three zones” policy and strictly adhere to the planning of urban development boundaries, ecological control lines, concentrated construction zones, restricted construction zones and ecological control zones. It is possible to achieve some of the development goals of the Daxing Zoning Plan for 2035: to significantly improve the quality of public services and the living environment, create large concentrated forest patches, optimise the ecological quality of the area and enhance biodiversity [32].

6. Conclusions

The Daxing Zoning Plan (Territorial Spatial Planning) (2017–2035) positions Daxing as a demonstration area for the collaborative development of Beijing, Tianjin and Hebei, a leading area for scientific and technological innovation, a pioneering area for deepening reform in urban and rural development and a new gateway for international interaction in the capital, while land storage and improving the ecological environment are important strategies for the development of Daxing District. Daxing District will moderate the functions undertaken in the work of decentralisation of the central urban area of Beijing. Daxing District industry accounted for a relatively large share of warehousing. The logistics will be adjusted to high-tech industries, directly affecting the urban land-use pattern. In this study, the dynamic simulations of three models using the Markov chain and FLUS models were carried out, and the following conclusions were drawn: (1) The natural development scenario shows the future development of the city without policy constraints and other human interventions and provides a reference for the relevant authorities to formulate certain urban development policies. (2) The cultivated land protection and ecological control scenarios limit the expansion of construction land to a significant extent, with the cultivated land protection scenario controlling the total amount of cultivated land that is being encroached upon and helping to implement the national strategy of storing food using land and technology. (3) The ecological control scenario has a significant impact on the regional ecological environment and can help build a regional greenway system with a variety of levels and functions while creating a green cultural and health network system.
However, due to the complexity of this research topic, the present study still had certain shortcomings.
Only three urban constraint scenarios were considered in this study. In the future, more complete and more constraining conditions in terms of policies and regulation will be considered, and land-use changes under multiple constraints will be predicted and explored, taking into account historical changes and policy regulation. This will make the framework of land-use research in urban fringe areas more complete and provide reference values for development research in urban fringe areas.
Economic factors are important influencing factors for urban development. However, the control scenarios in this study mainly considered ecological factors, which could not balance the relationship between ecological, economic and social factors. This is precisely the concern of urban development policymakers and will be considered more comprehensively in subsequent studies.

Author Contributions

Conceptualisation, X.C. and X.H.; methodology, X.C. and S.W.; software, X.C. and X.H.; validation, X.C. and X.H.; formal analysis, X.H.; investigation, X.C.; resources, X.C.; data curation, X.H.; writing—original draft preparation, X.C. and X.H.; writing—review and editing, S.W.; visualisation, X.C.; supervision, S.W.; project administration, S.W.; funding acquisition, S.W. All authors have read and agreed to the published version of the manuscript.

Funding

This research was funded by the National Natural Science Foundation of China (grant number: 52108038), Territorial Spatial Planning and Design Project (project number: YJSY-DSTD2022008).

Institutional Review Board Statement

This study did not involve human subjects, animals, plants or cells.

Informed Consent Statement

The study did not involve human subjects.

Data Availability Statement

The datasets generated during and/or analysed during the current study are available from the corresponding author upon reasonable request.

Acknowledgments

We hereby thank the National Natural Science Foundation of China and Territorial Spatial Planning and Design Project for financial support for this research.

Conflicts of Interest

The authors declare no conflict of interest.

References

  1. Wang, S.Y. Research on the Landscape Ecological Planning and Design of the Urban Fringe Green Space D; Beijing Forestry University: Beijing, China, 2012. [Google Scholar]
  2. Liu, H.B.; Zhai, G.F.; Shi, Y.J. Analysis of land-use problems in urban fringe from the perspective of spatial reconstruction. In Rational Planning for Sustainable Development—2017 China Urban Planning Annual Conference Proceedings (16 Regional Planning and Urban Economy); Urban Planning Society of China: Guangdong, China, 2017; pp. 1162–1170. [Google Scholar]
  3. Guo, R.Q.; Lu, B.; Chen, K.L. Dynamic simulation of multi-scenario land-use change based on CLUMondo model: A case study of coastal cities in Guangxi. Remote Sens. Land Resour. 2020, 1, 176–183. [Google Scholar] [CrossRef]
  4. The Central Committee of the Communist Party of China State Council. The Central Committee of the Communist Party of China State Council issues the Strategic Plan for Rural Revitalization (2018–2022); The Central Committee of the Communist Party of China State Council: Beijing, China, 2018; Volume 29, pp. 9–47.
  5. Louis, H.; Fischer, K. Allgemeine Geomorphologie: Textteil u. gesonderter Bilderteil; Walter de Gruyter: Berlin, Germany, 1979. [Google Scholar]
  6. Muller, P.O. The Suburban Transformation of the Globalizing American City. Ann. Am. Acad. Polit. Soc. Sci. 1997, 551, 44–58. [Google Scholar] [CrossRef]
  7. Browder, J.O.; Bohland, J.R.; Scarpaci, J.L. Patterns of Development on the MetropolitanFringe: Urban Fringe Expansion in Bangkok, Jakarta, and Santiago. J. Am. Plan. Assoc. 1995, 61, 310–327. [Google Scholar] [CrossRef]
  8. Whitehand, J.W.R.; Morton, N.J. Urban Morphology and Planning: The Case of Fringe Belts. Cities 2004, 21, 275–289. [Google Scholar] [CrossRef]
  9. Phelps, N.A. Edge Cities. In Amsterdam: International Encyclopedia of Human Geography; Elsevier: Amsterdam, The Netherlands, 2009. [Google Scholar]
  10. Lin, Y.C.; Deng, X.Z.; Zhan, J.Y. Simulation of Regional Land Use Competition for Jiangxi Province. Resour. Sci. 2013, 35, 729–738. [Google Scholar]
  11. Wang, X.Y.; Zhou, Y.; Yu, J.N. Evolution of Green Infrastructure Layout and Waterlogging Risk Assessment Based on Cellular Automata Simulation of Urban Expansion: A Case Study of Wuhan City. Landsc. Archit. 2020, 27, 50–56. [Google Scholar] [CrossRef]
  12. Mondal, M.S.; Sharma, N.; Kappas, M.; Garg, P.K. Cellular automata (CA) contiguity filters impacts on ca Markov modeling of land use land cover change predictions results. Int. Arch. Photogramm. Remote Sens. Spat. Inf. Sci. 2020, 43, 1585–1591. [Google Scholar] [CrossRef]
  13. YI, D.; Zhao, X.M.; Guo, X.; Zhao, L.H.; Zhang, H.; Han, Y.; Subedi, R.; Luo, Z.J. Delimitation of urban development boundary based on ecological sensitivity evaluation and CA-Markov simulation in the plain city: A case of Nanchang, Jiangxi, China. Chin. J. Appl. Ecol. 2020, 31, 208–218. [Google Scholar] [CrossRef]
  14. Zhang, X.J.; Zhou, Q.G.; Wang, Z.L.; Wang, F.H. Simulation and prediction of land use evolution in the Three Gorges reservoir area based on MCE-CA-Markov. J. Agric. Eng. 2017, 33, 268–277. [Google Scholar]
  15. Long, Y. Study on the Dynamic Evolution and Feature of Landscape Pattern in Wuhan Urban Fringe. In Proceedings of the 2018 Annual Conference of the Chinese Society of Landscape Architecture, Guizhou, China, 20 October 2018; pp. 311–314. [Google Scholar]
  16. Aslan, N.; Koc-San, D. Spatiotemporal Land Use Change Analysis and Future Urban Growth Simulation Using Remote Sensing: A Case Study of Antalya. Int. Arch. Photogramm. Remote Sens. Spat. Inf. Sci. 2020, 43, 657–662. [Google Scholar] [CrossRef]
  17. Liu, X.; Zhao, Y.X.; Feng, X.M.; Wu, A.B.; Li, R.H. Simulation and optimization of multi-objective land use pattern based on CLUE-S model: An example from Beisan County, Langfang City, Hebei Province. Geogr. Geogr. Inf. Sci. 2018, 34, 92–98. [Google Scholar]
  18. Kucsicsa, G.; Popovici, E.-A.; Bălteanu, D.; Grigorescu, I.; Dumitraşcu, M.; Mitrică, B. Future Land Use/Cover Changes in Romania: Regional Simulations Based on CLUE-S Model and CORINE Land Cover Database. Landsc. Ecol. Eng. 2019, 15, 75–90. [Google Scholar] [CrossRef]
  19. Li, K.Y.; Zhang, Y.F.; Yang, Q.S. Simulation of spatial expansion of Xi’an city based on CA model and error analysis. Mapp. Sci. 2011, 36, 106–108+111. [Google Scholar] [CrossRef]
  20. Wu, J.S.; Feng, Z.; Huang, L.; Gao, Y.; Peng, J.; Huang, X.L. Sustainable land use scenario prediction based on CLUE-S model framework: An example from Yangquan suburban area. Resour. Sci. 2011, 33, 1699–1707. [Google Scholar]
  21. Liu, X.; Liang, X.; Li, X.; Xu, X.; Ou, J.; Chen, Y.; Li, S.; Wang, S.; Pei, F. A Future Land Use Simulation Model (FLUS) for Simulating Multiple Land Use Scenarios by Coupling Human and Natural Effects. Landsc. Urban Plan. 2017, 168, 94–116. [Google Scholar] [CrossRef]
  22. Li, Y.L. Research on Land Use Change and Simulation in Yubei District of Chongqing in the Context of Coordinated Development between Ecology and Economy. Master’s Thesis, Southwest University, Nanjing, China, 2019. [Google Scholar]
  23. Huo, J.; Shi, Z.; Zhu, W.; Xue, H.; Chen, X. A Multi-Scenario Simulation and Optimization of Land Use with a Markov–FLUS Coupling Model: A Case Study in Xiong’an New Area, China. Sustainability 2022, 14, 2425. [Google Scholar] [CrossRef]
  24. Zhang, Y.; Li, C.; Zhang, L.; Liu, J.; Li, R. Spatial Simulation of Land-Use Development of Feixi County, China, Based on Optimized Productive–Living–Ecological Functions. Sustainability 2022, 14, 6195. [Google Scholar] [CrossRef]
  25. Geomorphological Profile of Daxing District_Daxing Public Interest Geological Information_Beijing Municipal Commission of Planning and Natural Resources. Available online: http://ghzrzyw.beijing.gov.cn/ziranziyuanguanli/gyxdzzl/dx_gyxdzzl/202005/t20200511_1894545.html (accessed on 12 June 2022).
  26. Wu, Z.Z.; Song, J.P.; Wang, X.X.; Cheng, Y.; Zhang, N. On urbanization process and spatial expansion in the urban fringe of Beijing: A case study of Daxing District. Geogr. Res. 2008, 2, 285–293+483. [Google Scholar]
  27. Fang, L.N.; Chen, Y.J.; Song, J.P. The Evaluation of Land Use Benefit in Urban Fringe Area: An Example of Daxing District, Beijing. Chin. Agric. Sci. Bull. 2013, 29, 154–159. [Google Scholar]
  28. Daxing District Land Use Master Plan (2006–2020)_Daxing Master Plan_Beijing Municipal Commission of Planning and Natural Resources. Available online: http://ghzrzyw.beijing.gov.cn/zhengwuxinxi/ghcg/ztgh/dx_ztgh/201912/t20191213_1730430.html (accessed on 12 June 2022).
  29. Guo, H.; Cai, Y.; Yang, Z.; Zhu, Z.; Ouyang, Y. Dynamic Simulation of Coastal Wetlands for Guangdong-Hong Kong-Macao Greater Bay Area Based on Multi-Temporal Landsat Images and FLUS Model. Ecol. Indic. 2021, 125, 107559. [Google Scholar] [CrossRef]
  30. Wang, X.D.; Yao, Y.; Ren, S.L.; Shi, X.G. A coupled FLUS and Markov approach to simulating spatial patterns of land use in fast-growing cities. J. Geoinform. 2022, 24, 100–113. [Google Scholar]
  31. Jin, M.T.; Xu, L.P.; Xu, Q. Multi-scenario landscape ecological risk evaluation and prediction based on the FLUS-Markov model: An example from Kechu, South Xinjiang. Arid Zone Res. 2021, 38, 1793–1804. [Google Scholar] [CrossRef]
  32. Daxing Zoning Plan (Territorial Spatial Planning) (2017–2035) _Zoning Plan_Beijing Municipal Commission of Planning and Natural Resources. Available online: http://ghzrzyw.beijing.gov.cn/zhengwuxinxi/ghcg/fqgh/202002/t20200213_1630085.html (accessed on 21 August 2022).
  33. Hao, X.J. Land Use Pattern Characteristics, Dynamic Changes and Simulation in the Coal Mining Area of Northern Shanxi Province. Master’s Thesis, Shanxi University, Shanxi, China, 2020. [Google Scholar] [CrossRef]
  34. Hao, R. Analysis on Driving Forces of Land-Use Change and Simulation of Scenarios of Qinhuangdao. Master’s Thesis, Hebei Normal University, Hebei, China, 2017. [Google Scholar]
  35. Chuai, X.W. Carbon Effect Caused by Landuse Changes and Its Land Use Control in Coastal Regions—The Case Study of Coastal Region in Jiangsu Province D; Nanjing University: Nanjing, China, 2013. [Google Scholar]
  36. Wang, J.; Zhang, J.; Xiong, N.; Liang, B.; Wang, Z.; Cressey, E.L. Spatial and Temporal Variation, Simulation and Prediction of Land Use in Ecological Conservation Area of Western Beijing. Remote Sens. 2022, 14, 1452. [Google Scholar] [CrossRef]
  37. Lin, P.F.; Zheng, R.B.; Hong, X.; Zheng, X.; Zheng, W.L. Simulation of land use spatial layout based on FLUS model—A case study of Huadu District, Guangzhou. Territ. Nat. Resour. Study. 2019, 2, 3. [Google Scholar] [CrossRef]
  38. Xu, Y.Q.; Luo, D.; Guo, H.F.; Zhou, D. Multi-simulation of Spatial Distribution of Land Use Based on CLUE-S Model: A Case Study of Yuzhong County, Gansu Province. Acta Sci. Nat. Univ. Pekin. 2013, 49, 523–529. [Google Scholar] [CrossRef]
Figure 1. Land-use simulation framework based on the FLUS model coupled with the Markov chain model.
Sustainability 14 11428 g001
Figure 2. Driving factors for land use in Daxing District.
Sustainability 14 11428 g002
Figure 3. 2018 land-use status map of Daxing District and 2018 land-use simulation of Daxing District.
Sustainability 14 11428 g003
Figure 4. Simulation of various land-use types in 2028 and 2038 in Daxing District under the natural scenario.
Sustainability 14 11428 g004
Figure 5. Changes in proportion for the land-use area in Daxing District from 2018 to 2038 under the natural scenario.
Sustainability 14 11428 g005
Figure 6. Simulation of various land-use types in 2028 and 2038 for Daxing District under cultivated land protection.
Sustainability 14 11428 g006
Figure 7. Changes in proportion for the land-use area in Daxing District from 2018 to 2038 under the cultivated land protection scenario.
Sustainability 14 11428 g007
Figure 8. Simulation of various land-use types in 2028 and 2038 in Daxing District under the ecological control scenario.
Sustainability 14 11428 g008
Figure 9. Changes in proportion for the land-use area in Daxing District from 2018 to 2038 under the ecological control scenario.
Sustainability 14 11428 g009
Table 1. Data sources within this study.
CategoryData NameData FormatData SourceYear
Land databaseLand-use data 30 m × 30 m rasterInstitute of Geographical Sciences and Resources, Chinese Academy of Sciences
(Source: http://www.resdc.cn (accessed on 21 March 2022))
2008 and 2018
Natural environmental factorsElevationsDigital elevation model data (DEM)Geospatial Data Cloud
(http://www.gscloud.cn/search)
2008
SlopeCalculated from DEM data-
Slope directionCalculated from DEM data
Vegetation coverageNormalised difference vegetation index data (NDVI)Geospatial Data Cloud
(http://www.gscloud.cn/search)
Social factorsDistance to city centre30 m × 30 m raster data-
Distance to airport
Distance to
railway station
Distance to highway
Distance to
shopping mall
Distance to hospital
Population distribution 1 km × 1 km population distributionGeospatial Data Cloud
(http://www.gscloud.cn/search)
Economic factorsGDP per capita1 km × 1 km per capita GDP
Table 2. Land-use demand forecast of Daxing District in 2018 (grid: 1 = 23,000 m2).
-Cultivated LandGrasslandWoodlandWater
Bodies
Construction Land
2008 Actual29,28241648114812,975
2018 Actual23,5491646134445018,048
2018 Forecast23,5441643134444918,044
Table 3. Cost matrix for various land-use types in simulated conversion.
--Cultivated LandGrasslandWoodlandWater BodiesConstruction Land
Natural
development
scenarios
Cultivated land11101
Grassland11101
Woodland11101
Water bodies11110
Construction land00001
Cultivated land conservation
scenarios
Cultivated land10000
Grassland11101
Woodland11101
Water bodies11110
Construction land00001
Ecological
control scenarios
Cultivated land11100
Grassland11100
Woodland11100
Water bodies11010
Construction land00001
Table 4. Land-use type domain factor parameters.
Type of Land UseCultivated LandGrasslandWoodlandWater
Bodies
Construction Land
Domain Factor0.40.60.60.20.8
Table 5. Change in land-use area of Daxing district (km2).
Type of Land UseCultivated LandGrasslandWoodlandWater
Bodies
Construction Land
2008673.490.1037.9126.41298.42
2018541.6337.8630.9210.34415.10
Total change 2008–2018−131.8637.76−6.99−16.07116.68
Average annual change 2008–2018−13.23.78−0.70−1.6111.67
Table 6. Transfer matrix of land-use change area for Daxing District from 2008 to 2018.
--Cultivated LandGrasslandWoodlandWater
Bodies
Construction Land
Cultivated landArea/km2489.44 5.39 15.84 6.33 156.01
Proportion72.67%0.80%2.35%0.94%23.16%
GrasslandArea/km20.00 0.02 0.00 0.00 0.08
Proportion0.00%18.66%0.00%0.00%81.34%
WoodlandArea/km222.38 0.58 8.02 0.24 6.55
Proportion59.04%1.53%21.15%0.64%17.27%
Water bodies Area/km22.38 14.00 3.93 1.70 4.30
Proportion9.02%53.01%14.88%6.42%16.29%
Construction landArea/km227.32 17.81 3.12 2.05 248.07
Proportion9.15%5.97%1.04%0.69%83.13%
Table 7. Test for land-use change for Daxing District in 2018 as predicted using the Markov chain (km2).
2018Cultivated LandGrasslandWoodlandWater
Bodies
Construction Land
Predicted value541.5237.7930.9110.32415.01
Actual value541.6337.8630.9210.34415.10
Difference−0.11−0.07−0.01−0.02−0.09
Table 8. Comparison of land-use area and change ratio in Daxing District from 2018 to 2038 (km2).
Type of Land2018202820382018–20282028–2038
Cultivated land541.63450.80389.78−90.83−61.02
Grassland37.8642.1246.864.274.73
Woodland30.9225.1622.55−5.77−2.61
Water bodies10.348.808.45−1.53−0.35
Construction land415.10508.34567.0493.2458.70
Publisher’s Note: MDPI stays neutral with regard to jurisdictional claims in published maps and institutional affiliations.

