Analysis of the Characteristics of Real-World Emission Factors and VSP Distributions—A Case Study in Beijing
Abstract
:1. Introduction
2. Methodology
- (i)
- Massive second-by-second data of vehicle activity data of taxis in Beijing (Referred to as “BJ taxi”) are collected by employing the vehicle monitoring platform or GPS devices. The platform continuously collects emission factors and shares vehicle information through intelligent means, enabling analysis of typical vehicle driving conditions, and micro-emissions-based monitoring. The data of taxi CO, HC, and NOx emission rates (ER, g/s) are obtained based on portable emissions monitoring systems (PEMS). Both these types of data were necessary for modeling input parameters. In the VSP-based emission model, both the VSP distribution and emission rates are derived by using a VSP binning approach. The VSP distribution determines the traffic network, and the emission rates in various VSP bins represent the vehicle emissions under different power demands, which gather from PEMS or chassis dynamometers. The running exhaust emissions are estimated basically by multiplying the emission rates with the VSP distribution [10], as shown in Equation (1).
- (ii)
- The VSP distribution is established in accordance with the VSP interval differentiate patterns such as type of Op mode VSP interval, and different average speed by big data processing platform.
- (iii)
- Statistical analyses, such as Coefficient of Variation (CV), (Root Mean Square Error (RMSE), etc. are applied to quantify the differences of the VSP distribution of VSP distribution on emission factor. Finally, this study establishes different levels of emission factors and evaluates the accuracy of the results.
2.1. Data Sources
- (i)
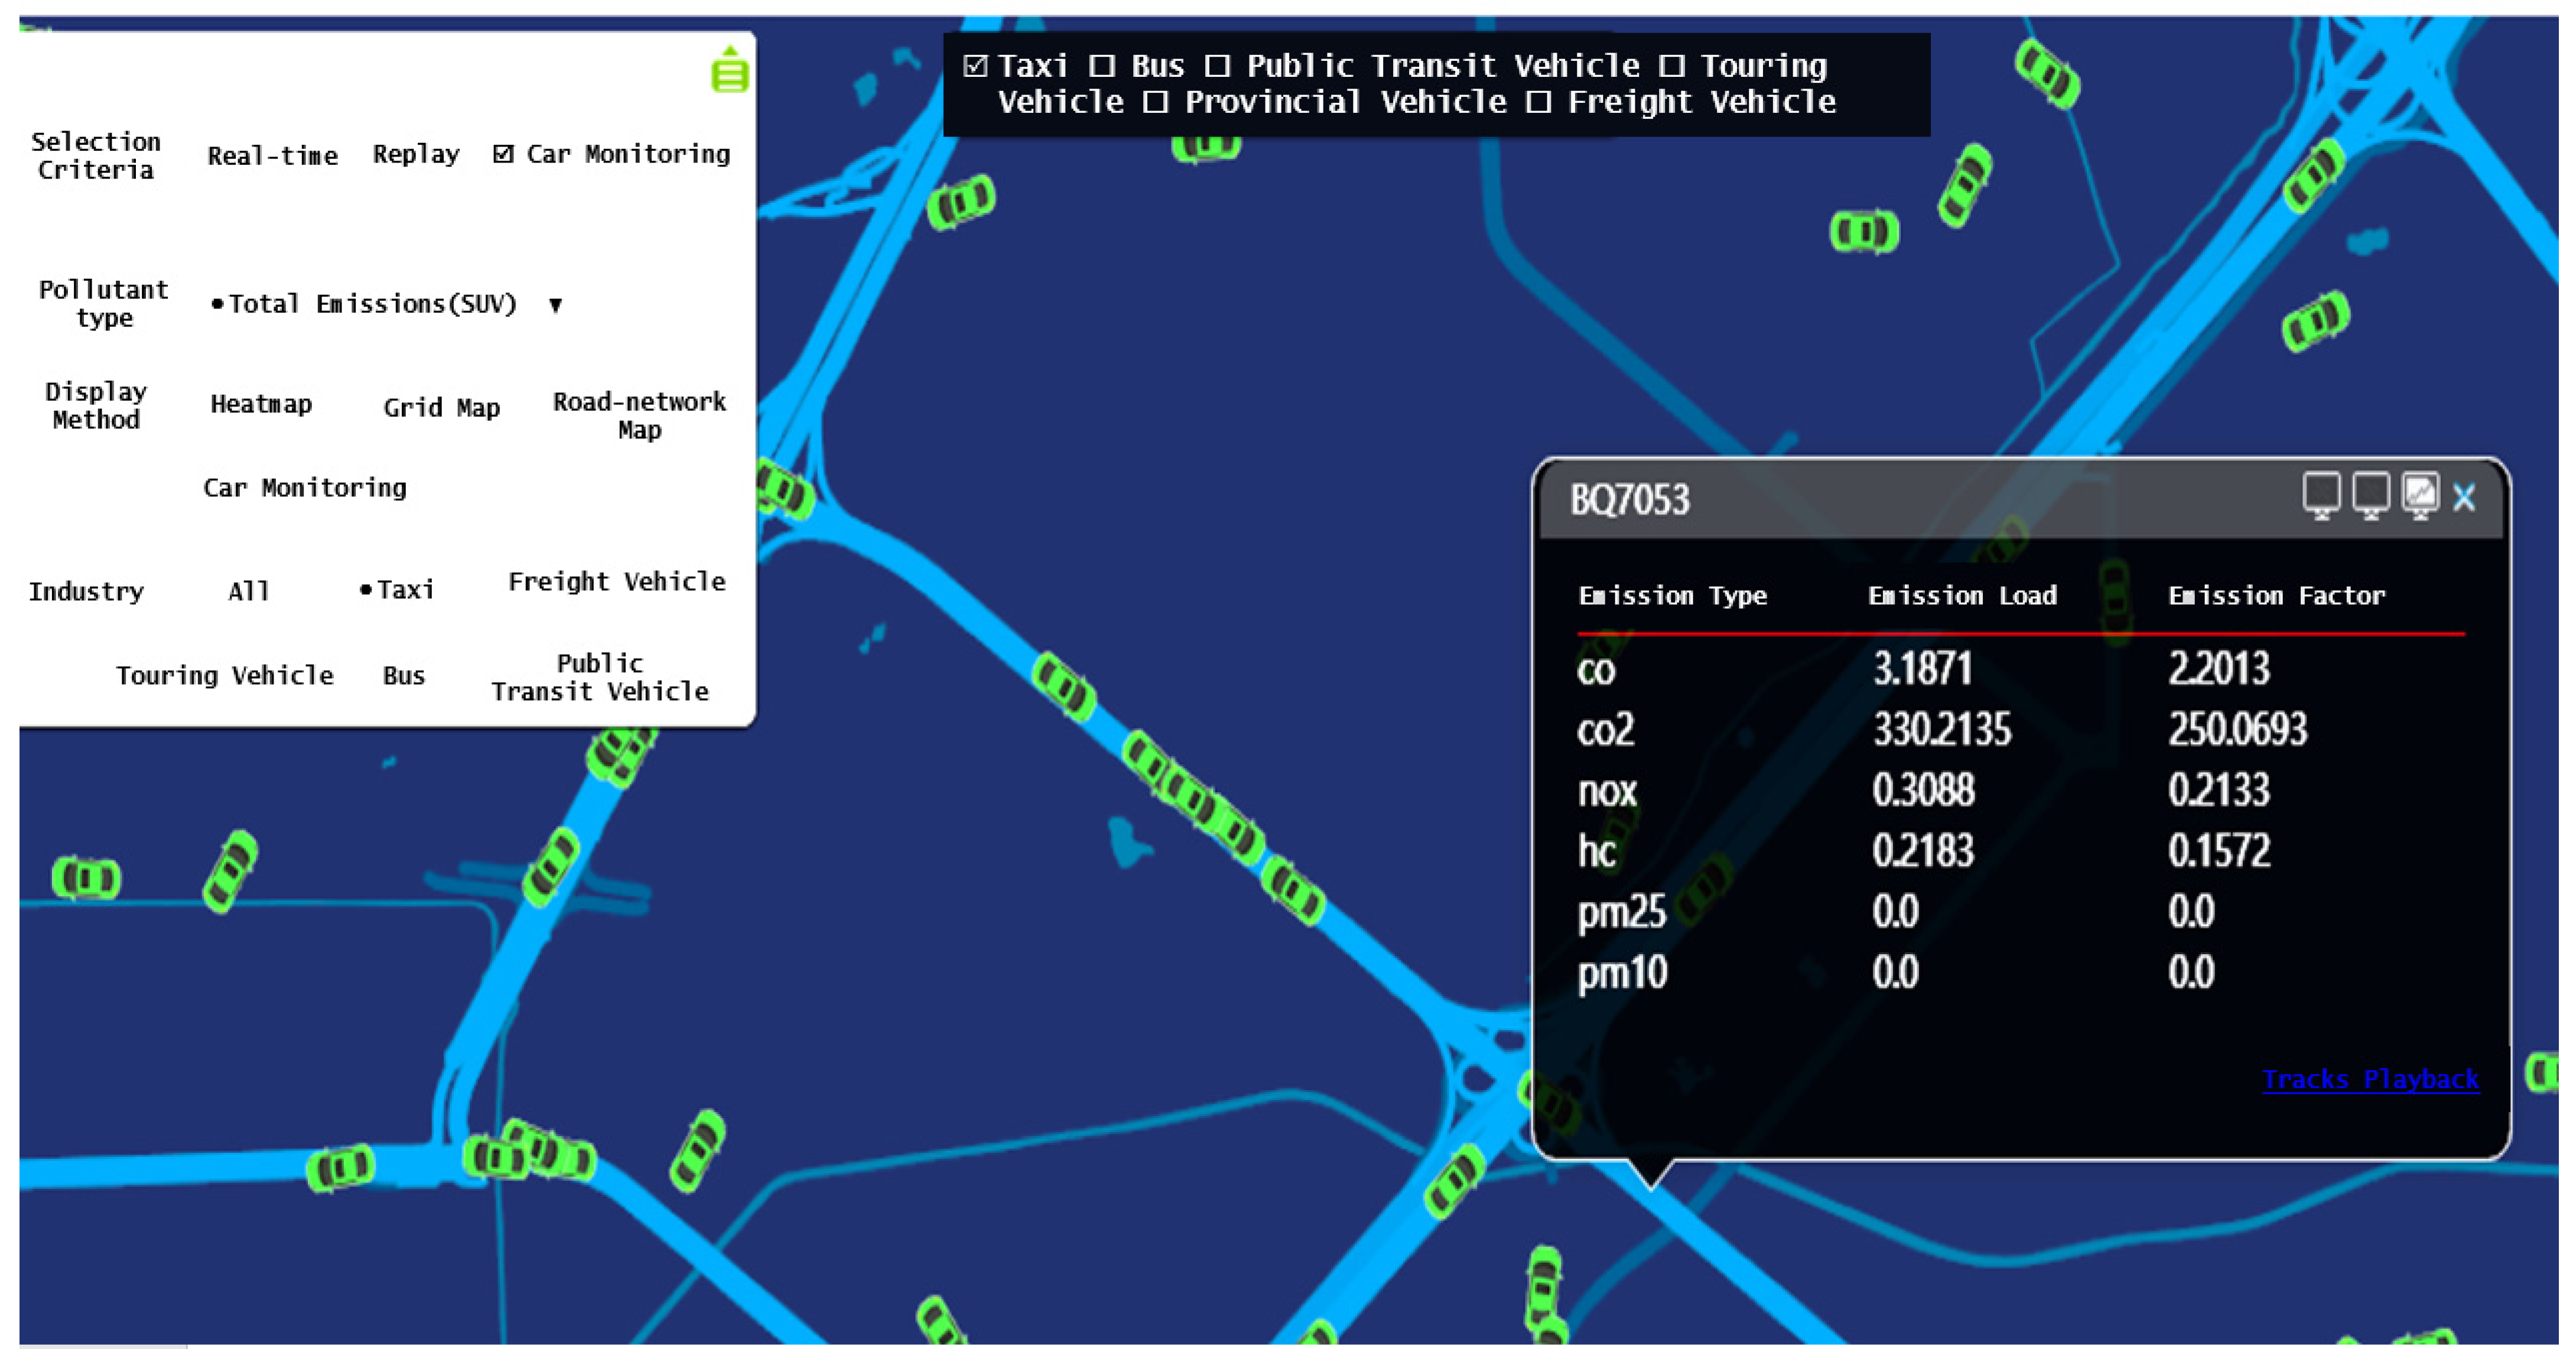
- Second-by-second vehicle activity data of the taxi car which is the key data in this study. A total of 22.7 billion records of second-by-second real-world activity data of BJ taxi were collected with GPS devices in Beijing Statistics and Monitoring Platform of Transport Energy Saving and Emission Reduction (BSMP-BTEC) over the past 6 months and stored in the database in Beijing Transport Institute (BTI). As shown in Figure 2, it is the interface diagram of Beijing’s transportation energy saving and emission reduction statistics and testing platform, which covers the full coverage of working conditions of 157 vehicle models and operating vehicle models. It can collect diversified traffic emission data. For the last eight years, we have selected three years of data at four-year intervals by using a longitudinal approach. The data are provided by more than 700 vehicles, as listed in Table 1. Other details about the data are listed as follows:
- Collection period, 2013–2017–2021
- Collection Time, from 0:00 a.m. to 12:00 p.m.
- Longitude and Latitude
- Instantaneous Speed, from 0 to 130 km/h
- Details about the activity data of the BJ taxi will be described below:
- (ii)
- Second-by-second emissions data of the 2-year-old taxi gasoline vehicles. In order to ensure the comparability of emissions under real operating conditions, a 2-year-old quasi-new vehicle was selected as the input of emission rate to remove the effect of emission rate on the difference of operating conditions. In this study, the emission rate is an crucial input parameter, but not the key research content. This study has constructed the emission rate database covering 23 VSP intervals based on the test data.
2.2. VSP Binning Method
3. Results and Discussion
3.1. VSP Distribution Analysis with Different Years
3.2. VSP Distribution Analysis with Different Cars
3.3. Emission Factors Analysis with Different Cars and Cycles
4. Conclusions and Recommendations
- (i)
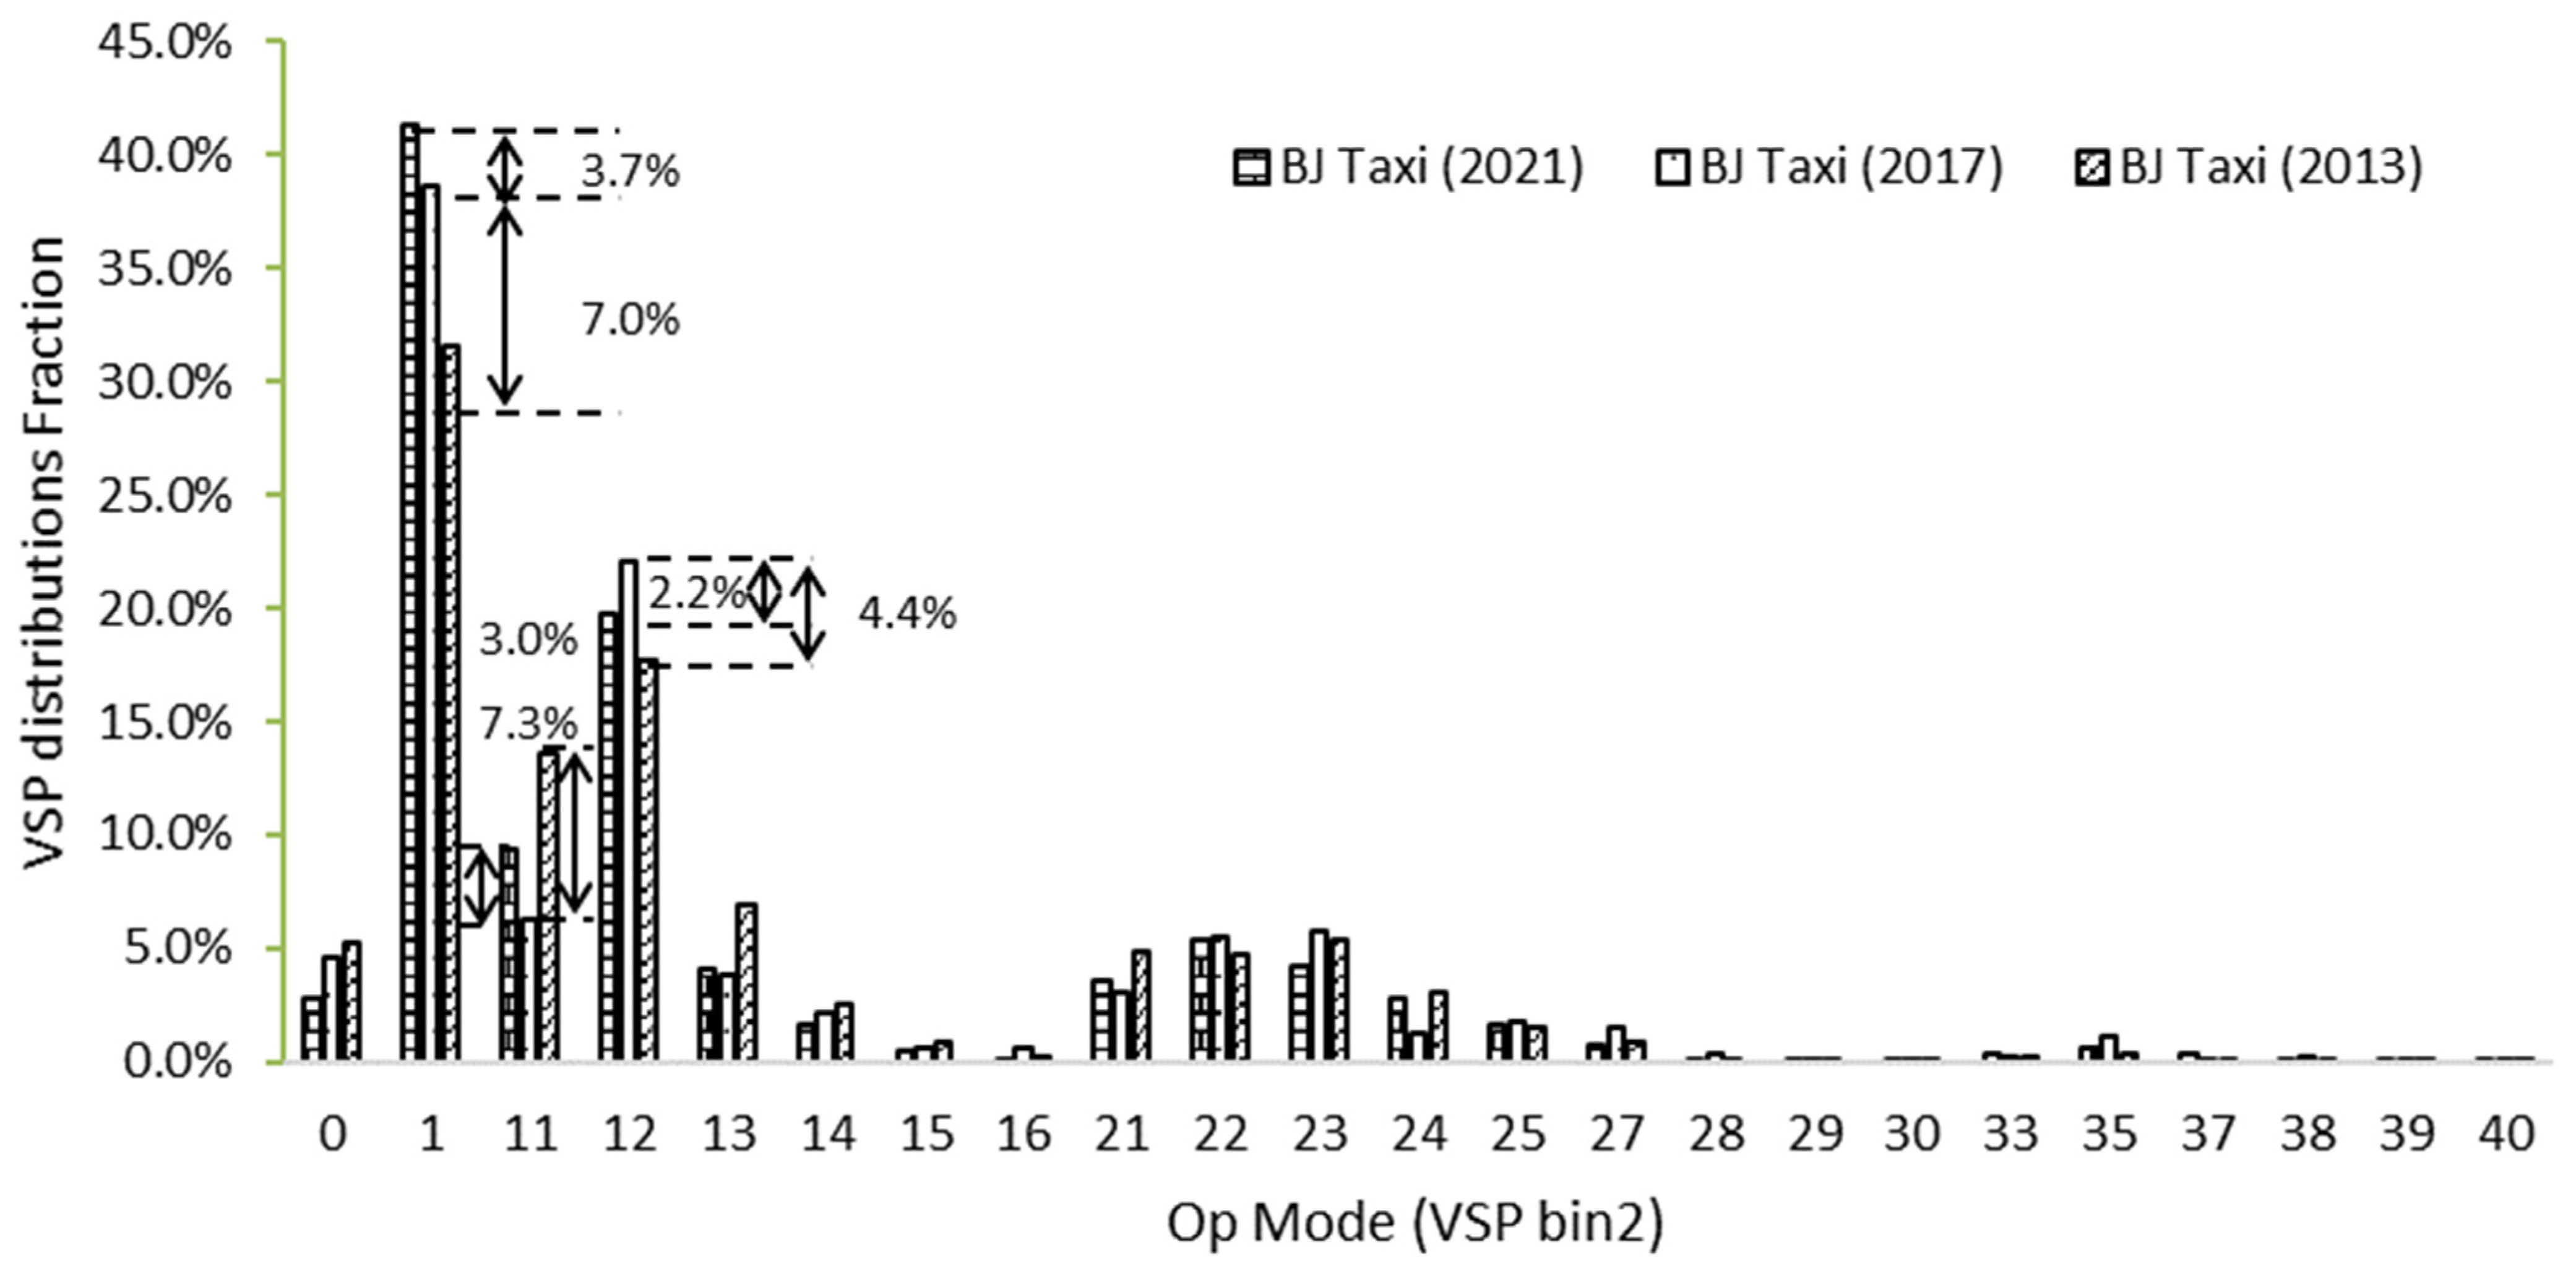
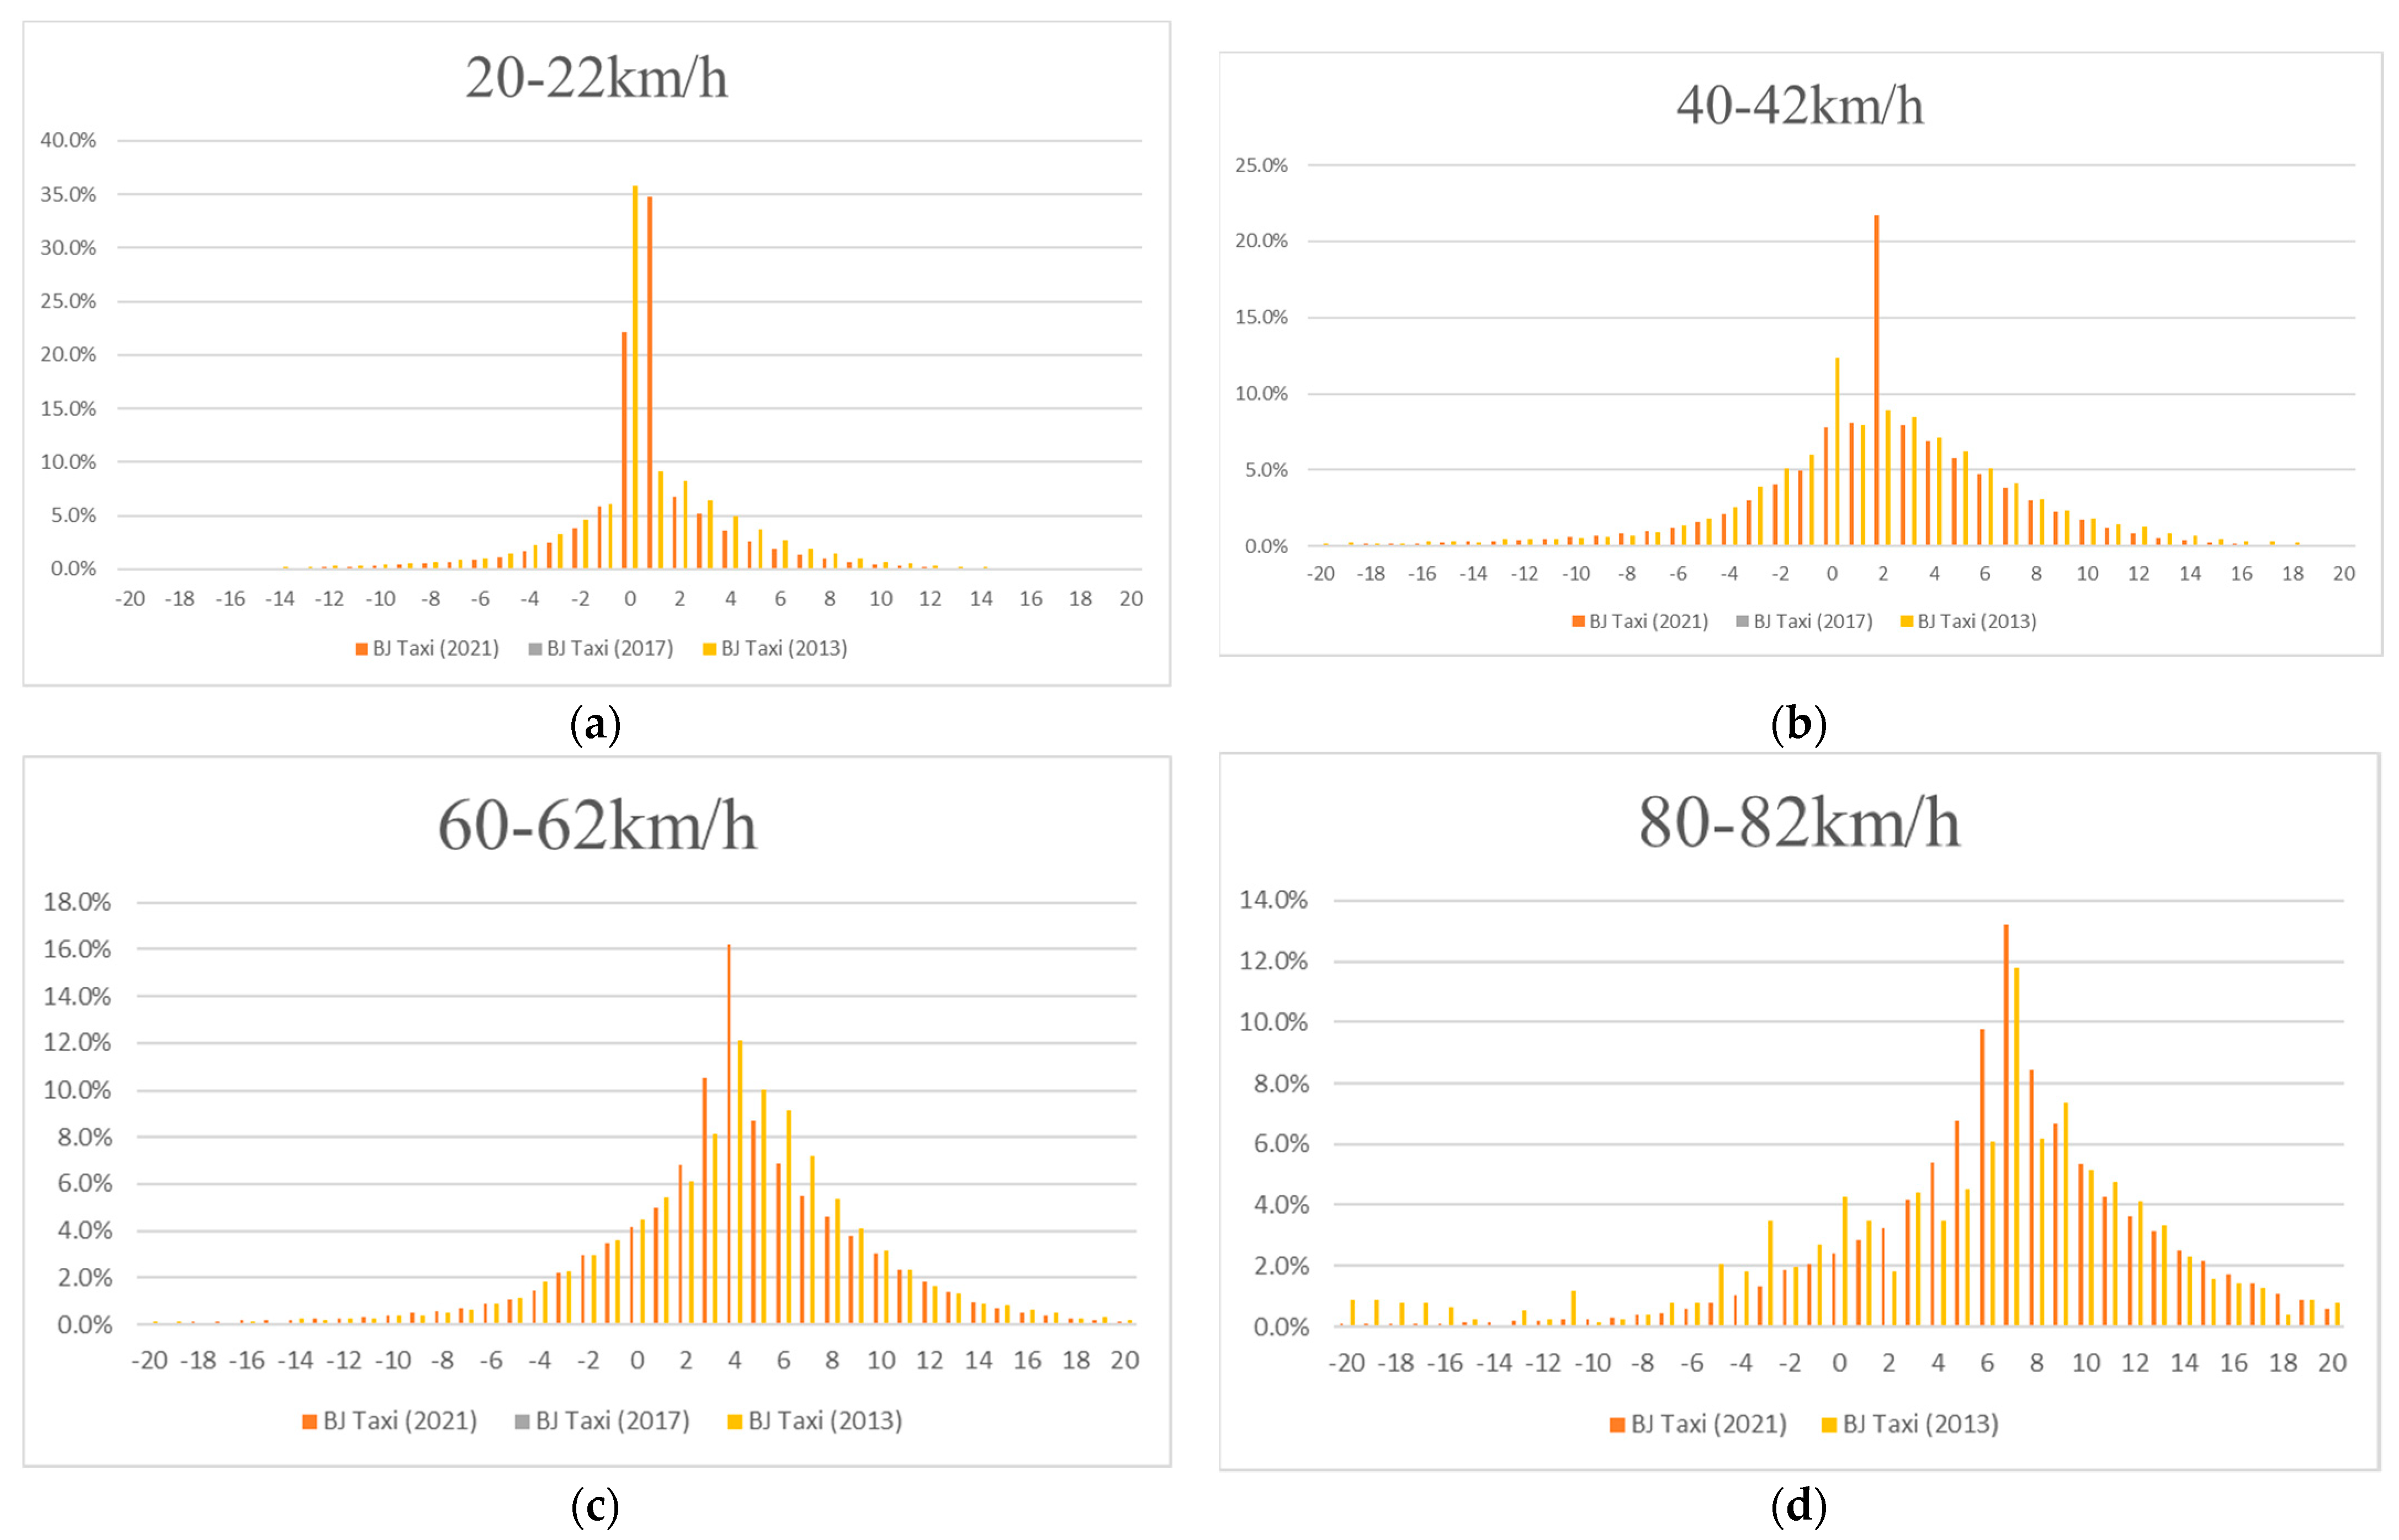
- The study of Beijing indicates that the distributions of the VSP, velocity, and the Op mode at a time interval within the annual level have superior correlations. In addition, driving conditions in 2021 are more eco-friendly; in contrast, the behaviors 10 years ago were more competitive. This is likely because of the improvement of driving customs and digital development.
- (ii)
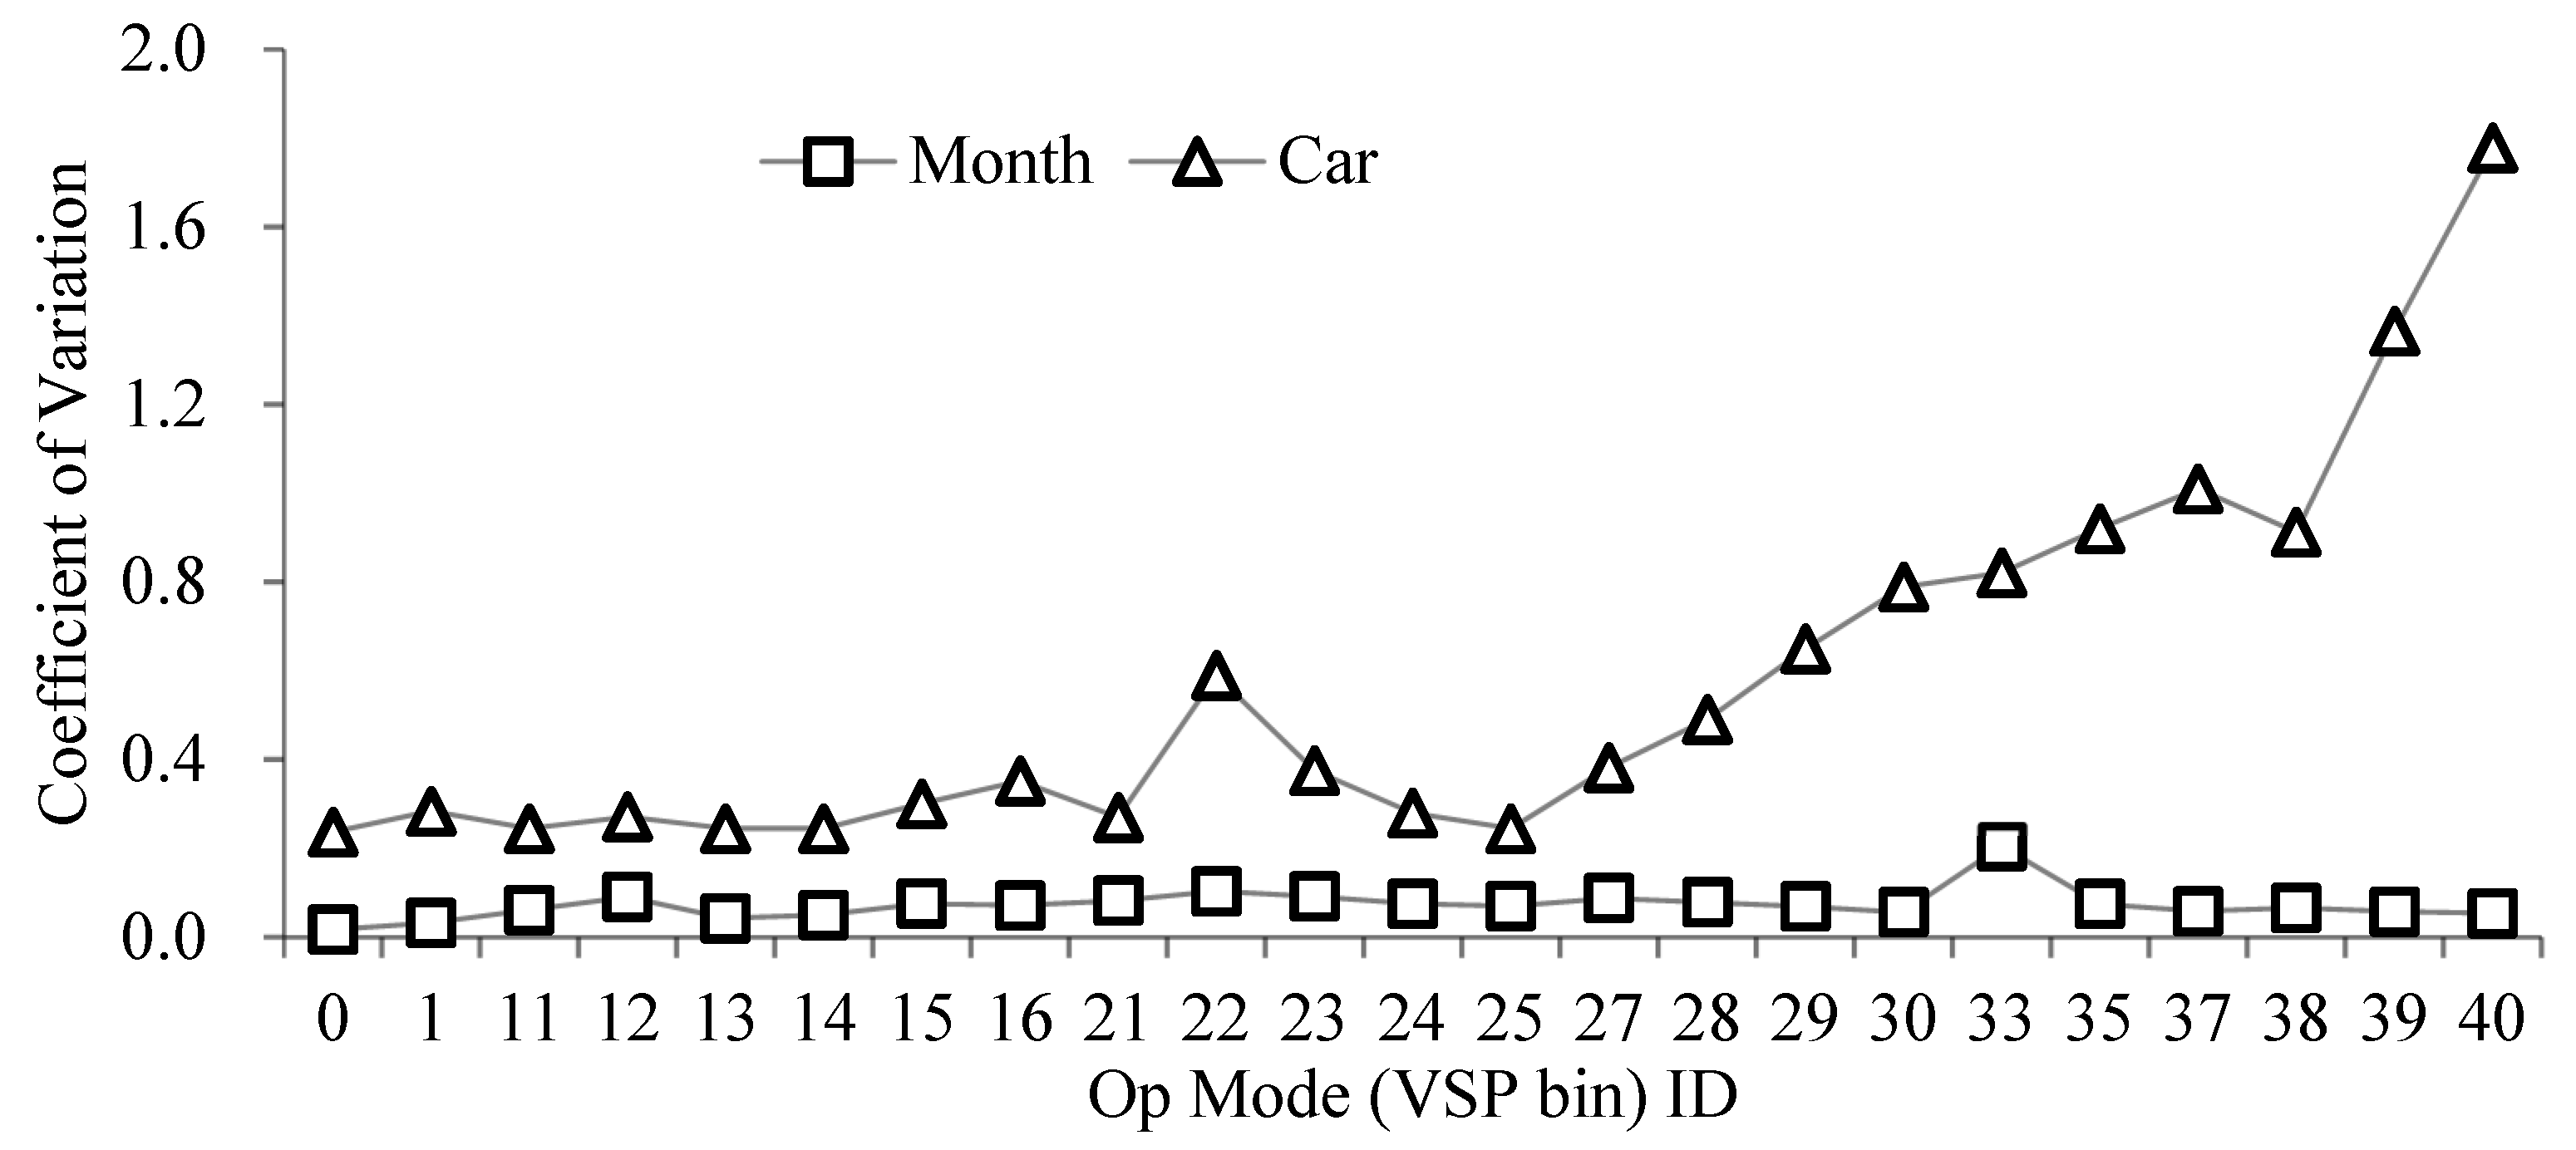
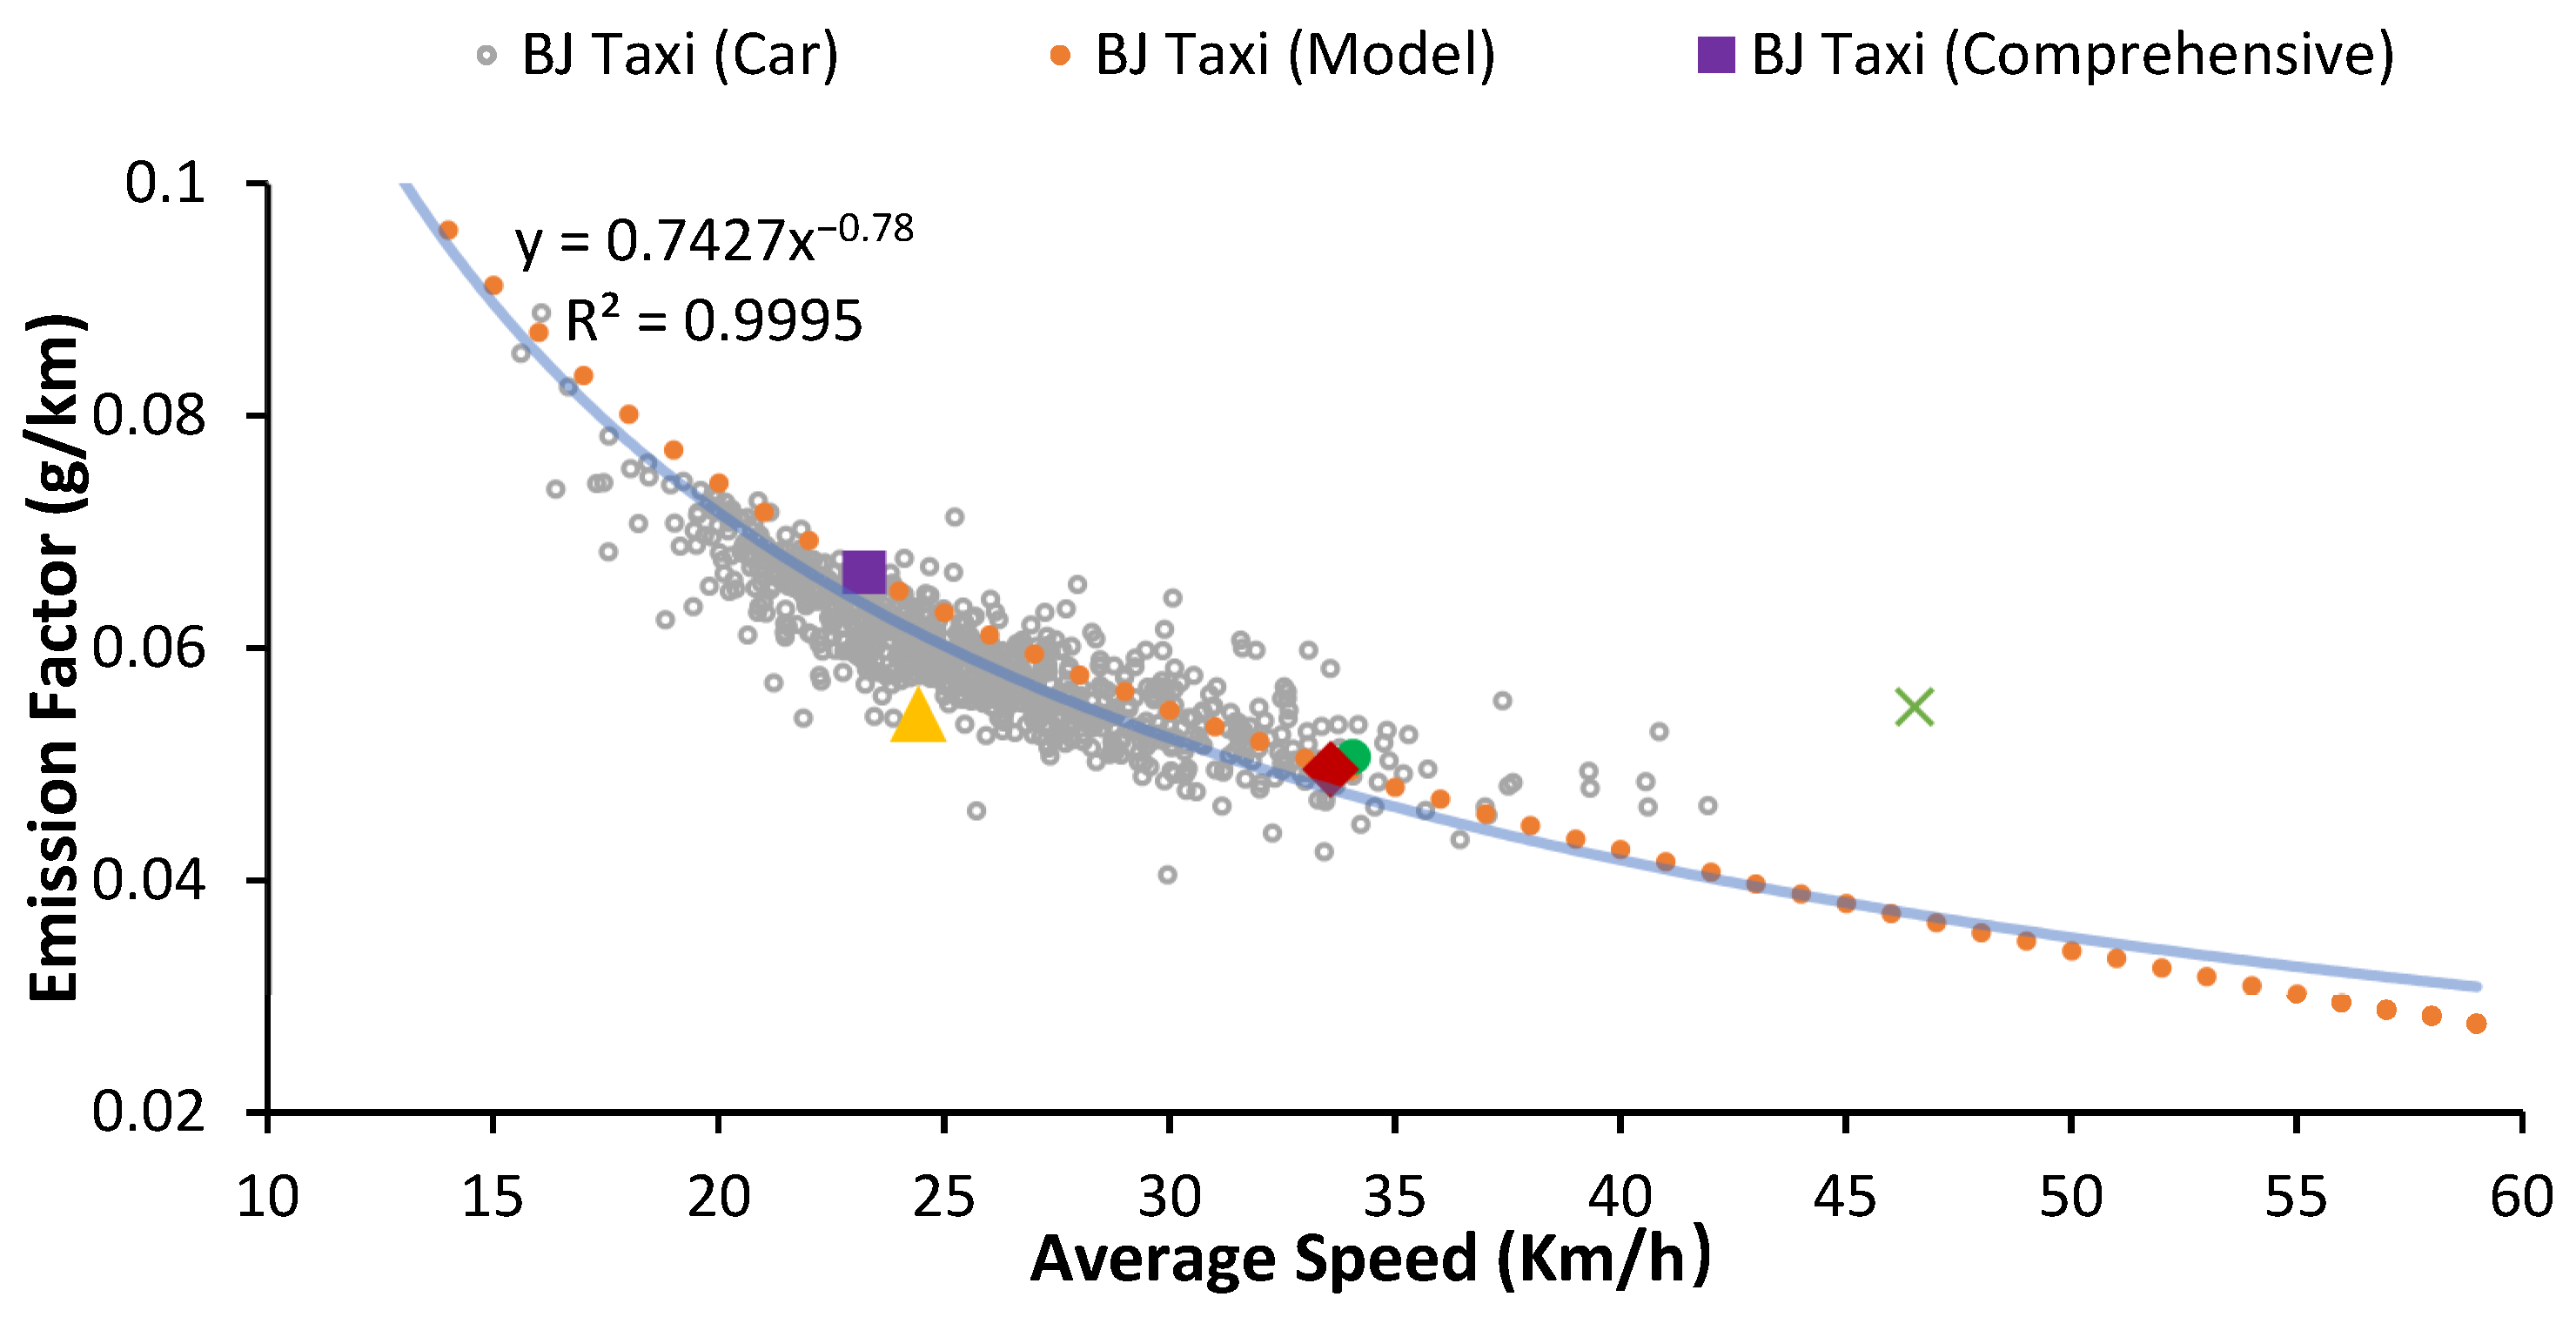
- With the information development, the acquired data of operating mode distribution can be used for a wider range of purposes. The study in units of cars demonstrates that the operating mode of the car has individual characteristics. The distributions of different cars in the same month are quite different. Despite the amount of data reaching a certain order of magnitude, it still cannot meet the demand for studying characteristics of the industry. However, the data of cars can be used for the evaluation of dynamic emissions of vehicles, such as estimating monthly emissions factors, evaluating the impact of driving behavior on emissions, and so on.
- (iii)
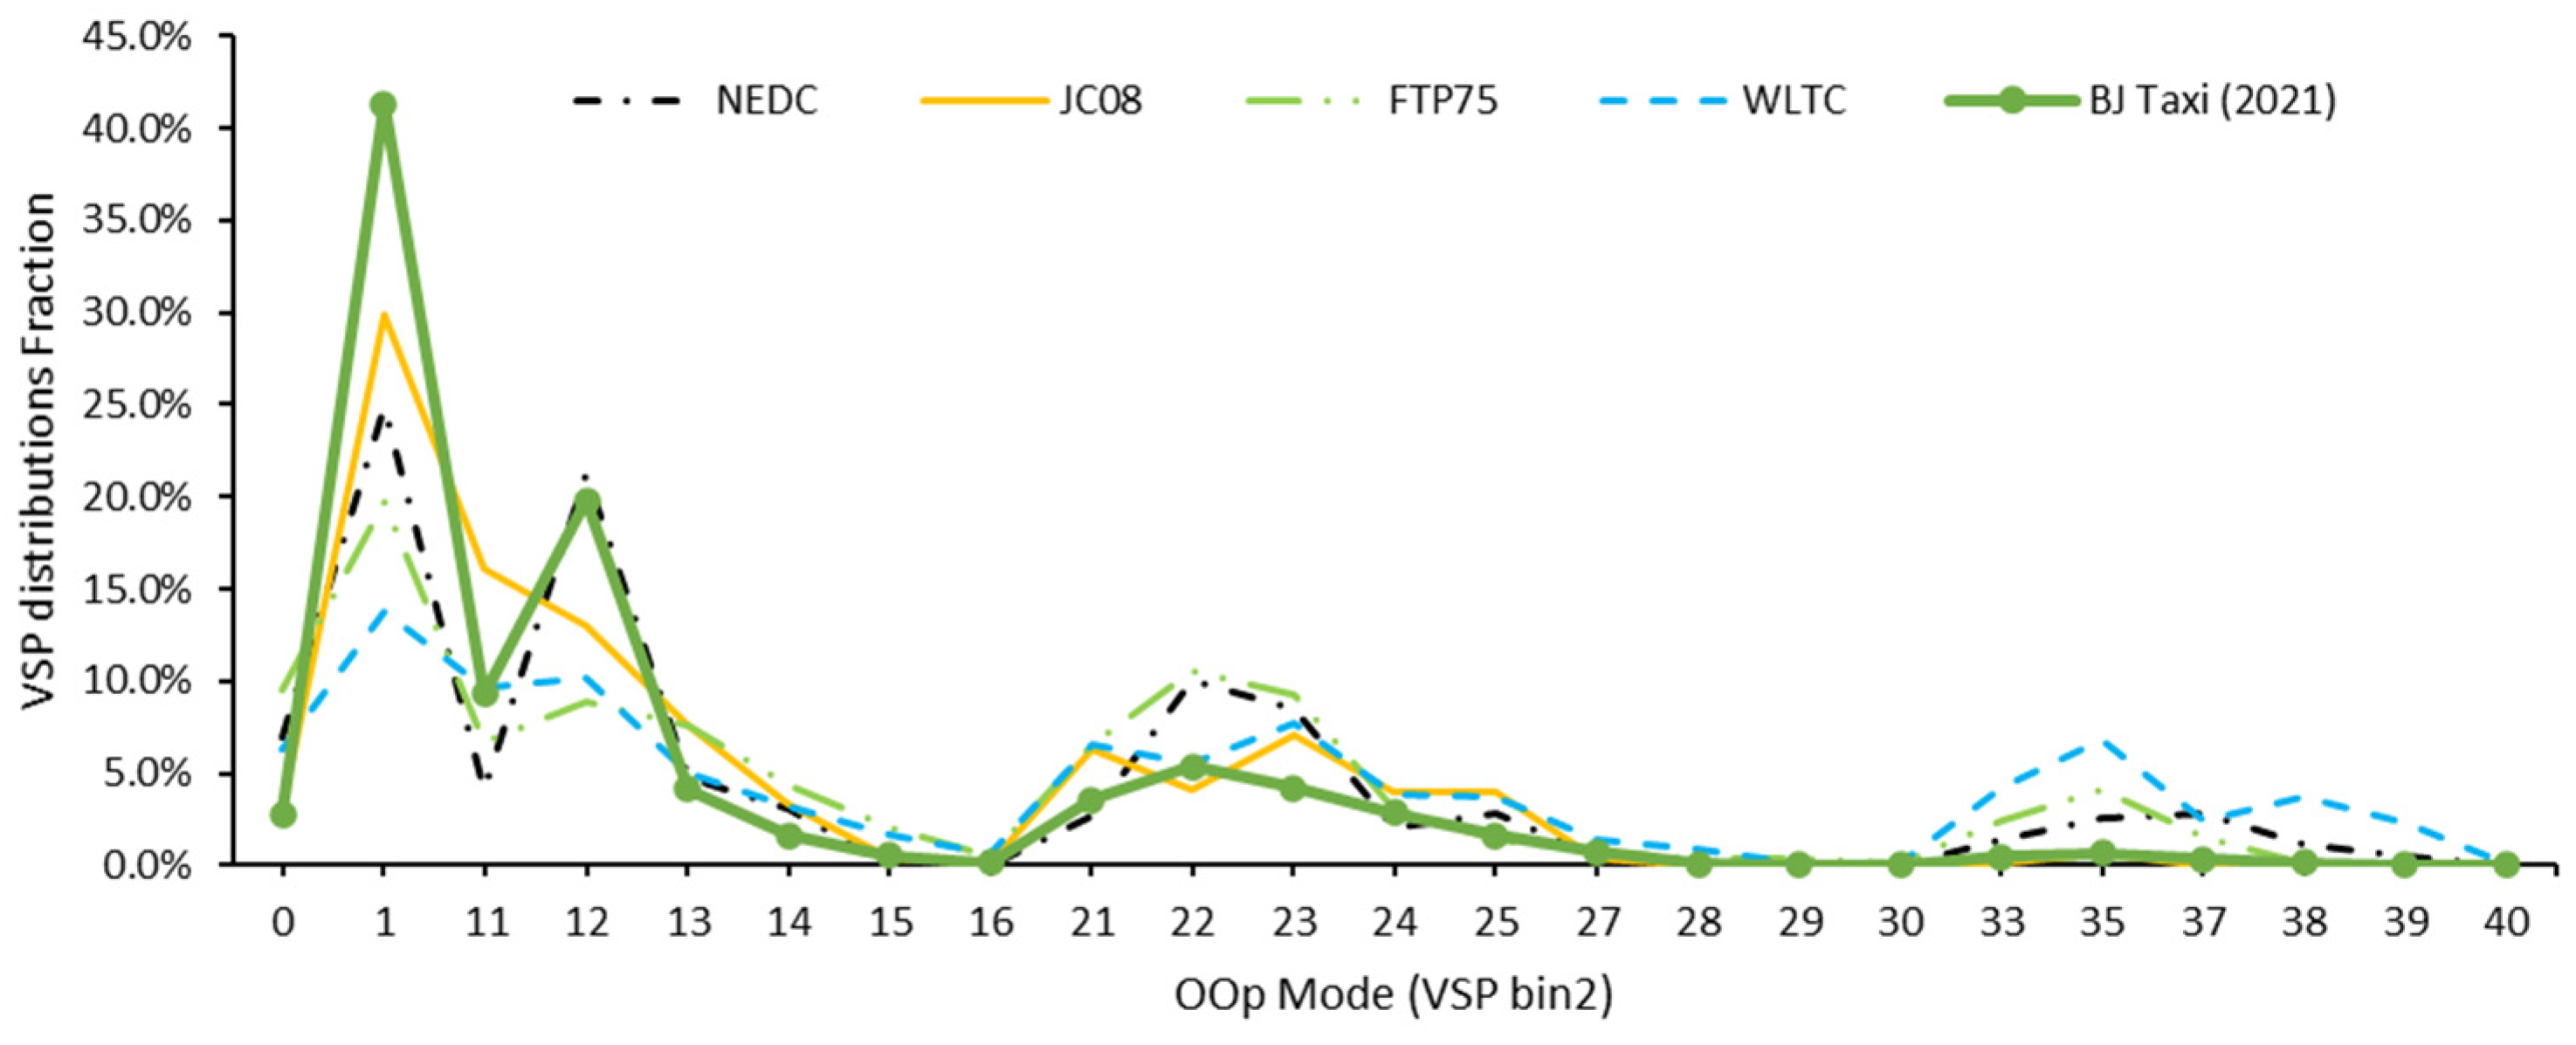
- Although typical operating modes can restrict the emission requirements of new cars in different areas, they cannot reflect the actual road emissions. Namely, such data cannot be used for the evaluation of actual road conditions, such as establishing localized emissions inventories, evaluating traffic policy emissions, and calculating other emissions that are sensitive to local operating modes.
Author Contributions
Funding
Institutional Review Board Statement
Informed Consent Statement
Data Availability Statement
Acknowledgments
Conflicts of Interest
References
- Environmental Protection Agency. User’s Guide to MOBILE6.1 and MOBILE 6.2; Environmental Protection Agency: Washington, DC, USA, 2003. [Google Scholar]
- The Handbook Emission Factors for Road Transport (HBEFA); Infras: Zurich, Switzerland, 2010.
- Eisinger, D.; Niemeier, D.; Kear, T. The California Department of Transportation/Air Resources Board Modeling Program (CAMP): New Research to Improve Speed Correction Factors and Mobile Source Emissions Modeling. In Proceedings of the 11th Annual Emission Inventory Conference, Atlanta, GA, USA, 16–18 April 2002. [Google Scholar]
- Brzezinski, D.J.; Enns, P.; Hart, C.J. Final Facility Specific Speed Correction Factors; US Environmental Protection Agency, Air and Radiation: Washington, DC, USA, 2001. [Google Scholar]
- Watson, H.C.; Milkins, E.E.; Braunsteins, J. Development of The Melbourne Peak Cycle. In Proceedings of the Conference on Traffic Energy & Emissions Melbourne, Melbourne, Australia, 19–21 May 1982. [Google Scholar]
- Sun, S.; Sun, L.; Liu, G.; Zou, C.; Wang, Y.; Wu, L.; Mao, H. Developing a vehicle emission inventory with high temporal-spatial resolution in Tianjin, China. Sci. Total Environ. 2021, 776, 145873. [Google Scholar] [CrossRef]
- Cui, Y.; Xu, H.; Zou, F.; Chen, Z.; Gong, K. Optimization based method to develop representative driving cycle for real-world fuel consumption estimation. Energy 2021, 235, 121434. [Google Scholar] [CrossRef]
- Jimenez-Palacios, J.L. Understanding and Quantifying Motor Vehicle Emissions with Vehicle Specific Power and TILDAS Remote Sensing. Ph.D. Thesis, Massachusetts Institute of Technology, Cambridge, MA, USA, 1999. [Google Scholar]
- Wang, X.; Song, G.; Zhai, Z.; Wu, Y.; Yin, H.; Yu, L. Effects of Vehicle Load on Emissions of Heavy-Duty Diesel Trucks: A Study Based on Real-World Data. Int. J. Environ. Res. Public Health 2021, 18, 3877. [Google Scholar] [CrossRef]
- US-EPA. MOVES2021 Highway Vehicle Population and Activity Data; EPA-420-R-21-004; US Environmental Protection Agency: Washington, DC, USA, 2021. [Google Scholar]
- Cappiello, A.; Chabini, I.; Nam, E.K.; Lue, A.; Abou Zeid, M. A statistical model of vehicle emissions and fuel consumption. In Proceedings of the IEEE International Conference on Intelligent Transportation Systems, Singapore, 6 September 2002; pp. 801–809. [Google Scholar]
- Yu, L.; Zhang, X.; Qiao, F.; Qi, Y. Genetic Algorithm-Based Approach to Develop Driving Schedules to Evaluate Greenhouse Gas Emissions from Light-Duty Vehicles. Transp. Res. Rec. J. Transp. Res. Board 2010, 2191, 166–173. [Google Scholar] [CrossRef]
- Zhang, Z.; Song, G.; Zhang, L.; Zhai, Z.; He, W.; Yu, L. How do errors occur when developing speed correction factors for emission modeling? Transp. Res. Part D Transp. Environ. 2021, 101, 103094. [Google Scholar] [CrossRef]
- Rosero, F.; Fonseca, N.; López, J.M.; Casanova, J. Effects of passenger load, road grade, and congestion level on real-world fuel consumption and emissions from compressed natural gas and diesel urban buses. Appl. Energy 2021, 282, 116195. [Google Scholar] [CrossRef]
- Acuto, F.; Coelho, M.C.; Fernandes, P.; Giuffrè, T.; Macioszek, E.; Granà, A. Assessing the Environmental Performances of Urban Roundabouts Using the VSP Methodology and AIMSUN. Energies 2022, 15, 1371. [Google Scholar] [CrossRef]
- Zhou, X.; Wang, H.; Huang, Z.; Bao, Y.; Zhou, G.; Liu, Y. Identifying spatiotemporal characteristics and driving factors for road traffic CO2 emissions. Sci. Total Environ. 2022, 834, 155270. [Google Scholar] [CrossRef]
- Mądziel, M.; Campisi, T.; Jaworski, A.; Kuszewski, H.; Woś, P. Assessing Vehicle Emissions from a Multi-Lane to Turbo Roundabout Conversion Using a Microsimulation Tool. Energies 2021, 14, 4399. [Google Scholar] [CrossRef]
- Jaworski, A.; Mądziel, M.; Kuszewski, H. Sustainable Public Transport Strategies—Decomposition of the Bus Fleet and Its Influence on the Decrease in Greenhouse Gas Emissions. Energies 2022, 15, 2238. [Google Scholar] [CrossRef]
- Zhao, Q.; Chen, Q.; Song, G.; Yu, L. Comparative study of VSP binning methods for estimating fuel consumptions of LDVs on urban roads. In AIP Conference Proceedings; AIP Publishing LLC: Melville, NY, USA, 2019; Volume 2066, p. 20059. [Google Scholar]
- Oswald, D.; Vu, A.; Williams, N.; Boriboonsomsin, K.; Barth, M.J.; Kunimura, Y.; Nagaya, T.; Yoshimatsu, H.; Fukuoka, N. Real-world Efficacy of a Haptic Accelerator Pedal-based Eco-driving System. In Proceedings of the 2021 IEEE International Intelligent Transportation Systems Conference (ITSC), Indianapolis, IN, USA, 19–22 September 2021; IEEE: Piscataway, NJ, USA, 2021; pp. 1541–1546. [Google Scholar]
- Zhai, Z.; Song, G.; Lu, H.; He, W.; Yu, L. Validation of temporal and spatial consistency of facility- and speed-specific vehicle-specific power distributions for emission estimation: A case study in Beijing, China. J. Air Waste Manag. Assoc. 2017, 67, 949–957. [Google Scholar] [CrossRef]
- Benesty, J.; Chen, J.; Huang, Y.; Cohen, I. Pearson correlation coefficient. In Noise Reduction in Speech Processing; Springer: Berlin/Heidelberg, Germany, 2009; pp. 1–4. [Google Scholar]
- Liu, D.; Deng, Q.; Ren, Z.; Zhou, Z.; Song, Z.; Huang, J.; Hu, R. Variation trends and principal component analysis of nitrogen oxide emissions from motor vehicles in Wuhan City from 2012 to 2017. Sci. Total Environ. 2020, 704, 134987. [Google Scholar] [CrossRef]


| Index | Year | ||
|---|---|---|---|
| 2013 | 2017 | 2021 | |
| Sample size (million Records) | 12.12 | 226.20 | 149.63 |
| Description | Operating Mode (VSP Bin) ID | |||||
|---|---|---|---|---|---|---|
| Mode Description | Braking | Idling | Low Speed Coasting | Moderate Speed Coasting | High Speed Coasting | |
| Vehicle Speed, vt (km/h) | - | [−1.6, 1.6) | [1.6, 40) | [40, 80) | [80, +∞) | |
| Vehicle Acceleration, at (m/s2) | at ≤ −0.9 | at > −0.9 | - | |||
| Vehicle Specific Power, VSPt (kW/tons) | (−∞, 0) | 0 | 1 | 11 | 21 | 33 |
| [0, 3) | - | 12 | 22 | |||
| [3, 6) | 13 | 23 | ||||
| [6, 9) | 14 | 24 | 35 | |||
| [9, 12) | 15 | 25 | ||||
| [12, 18) | 16 | 27 | 37 | |||
| [18, 24) | 28 | 38 | ||||
| [24, 30) | 29 | 39 | ||||
| [30, +∞) | 30 | 40 | ||||
| Index | Classification for Months | ||
|---|---|---|---|
| Speed Interval | VSP Bin | Speed Interval and VSP Bin | |
| Mean Correlation Coefficient () | 0.9951 | 0.9961 | 0.9892 |
| Cycles | Cycles Information | Emission Factor (g/km) | Compared with BJ Real-World | |||||
|---|---|---|---|---|---|---|---|---|
| Speed (km/h) | Idle Fraction (%) | NOx | CO | HC | NOx | CO | HC | |
| JC08 | 24.4 | 29.7 | 0.054 | 0.28 | 0.014 | −11% | −27% | −33% |
| FTP75 | 34.1 | 19.4 | 0.051 | 0.37 | 0.014 | −17% | −2% | −32% |
| WLTC | 46.5 | 13.0 | 0.055 | 0.61 | 0.022 | −10% | 62% | 5% |
| NEDC | 33.6 | 24.8 | 0.050 | 0.46 | 0.019 | −19% | 22% | −9% |
| BJ Taxi | 19.2 | 41.3 | 0.061 | 0.38 | 0.021 | 0% | 0% | 0% |
Publisher’s Note: MDPI stays neutral with regard to jurisdictional claims in published maps and institutional affiliations. |
© 2022 by the authors. Licensee MDPI, Basel, Switzerland. This article is an open access article distributed under the terms and conditions of the Creative Commons Attribution (CC BY) license (https://creativecommons.org/licenses/by/4.0/).
Share and Cite
He, W.; Duan, L.; Zhang, Z.; Zhao, X.; Cheng, Y. Analysis of the Characteristics of Real-World Emission Factors and VSP Distributions—A Case Study in Beijing. Sustainability 2022, 14, 11512. https://doi.org/10.3390/su141811512
He W, Duan L, Zhang Z, Zhao X, Cheng Y. Analysis of the Characteristics of Real-World Emission Factors and VSP Distributions—A Case Study in Beijing. Sustainability. 2022; 14(18):11512. https://doi.org/10.3390/su141811512
Chicago/Turabian StyleHe, Weinan, Lei Duan, Zhuoyuan Zhang, Xu Zhao, and Ying Cheng. 2022. "Analysis of the Characteristics of Real-World Emission Factors and VSP Distributions—A Case Study in Beijing" Sustainability 14, no. 18: 11512. https://doi.org/10.3390/su141811512
APA StyleHe, W., Duan, L., Zhang, Z., Zhao, X., & Cheng, Y. (2022). Analysis of the Characteristics of Real-World Emission Factors and VSP Distributions—A Case Study in Beijing. Sustainability, 14(18), 11512. https://doi.org/10.3390/su141811512


