
County Ecosystem Health Assessment Based on the VORS Model: A Case Study of 183 Counties in Sichuan Province, China

 , ,
, ,
Abstract
:1. Introduction
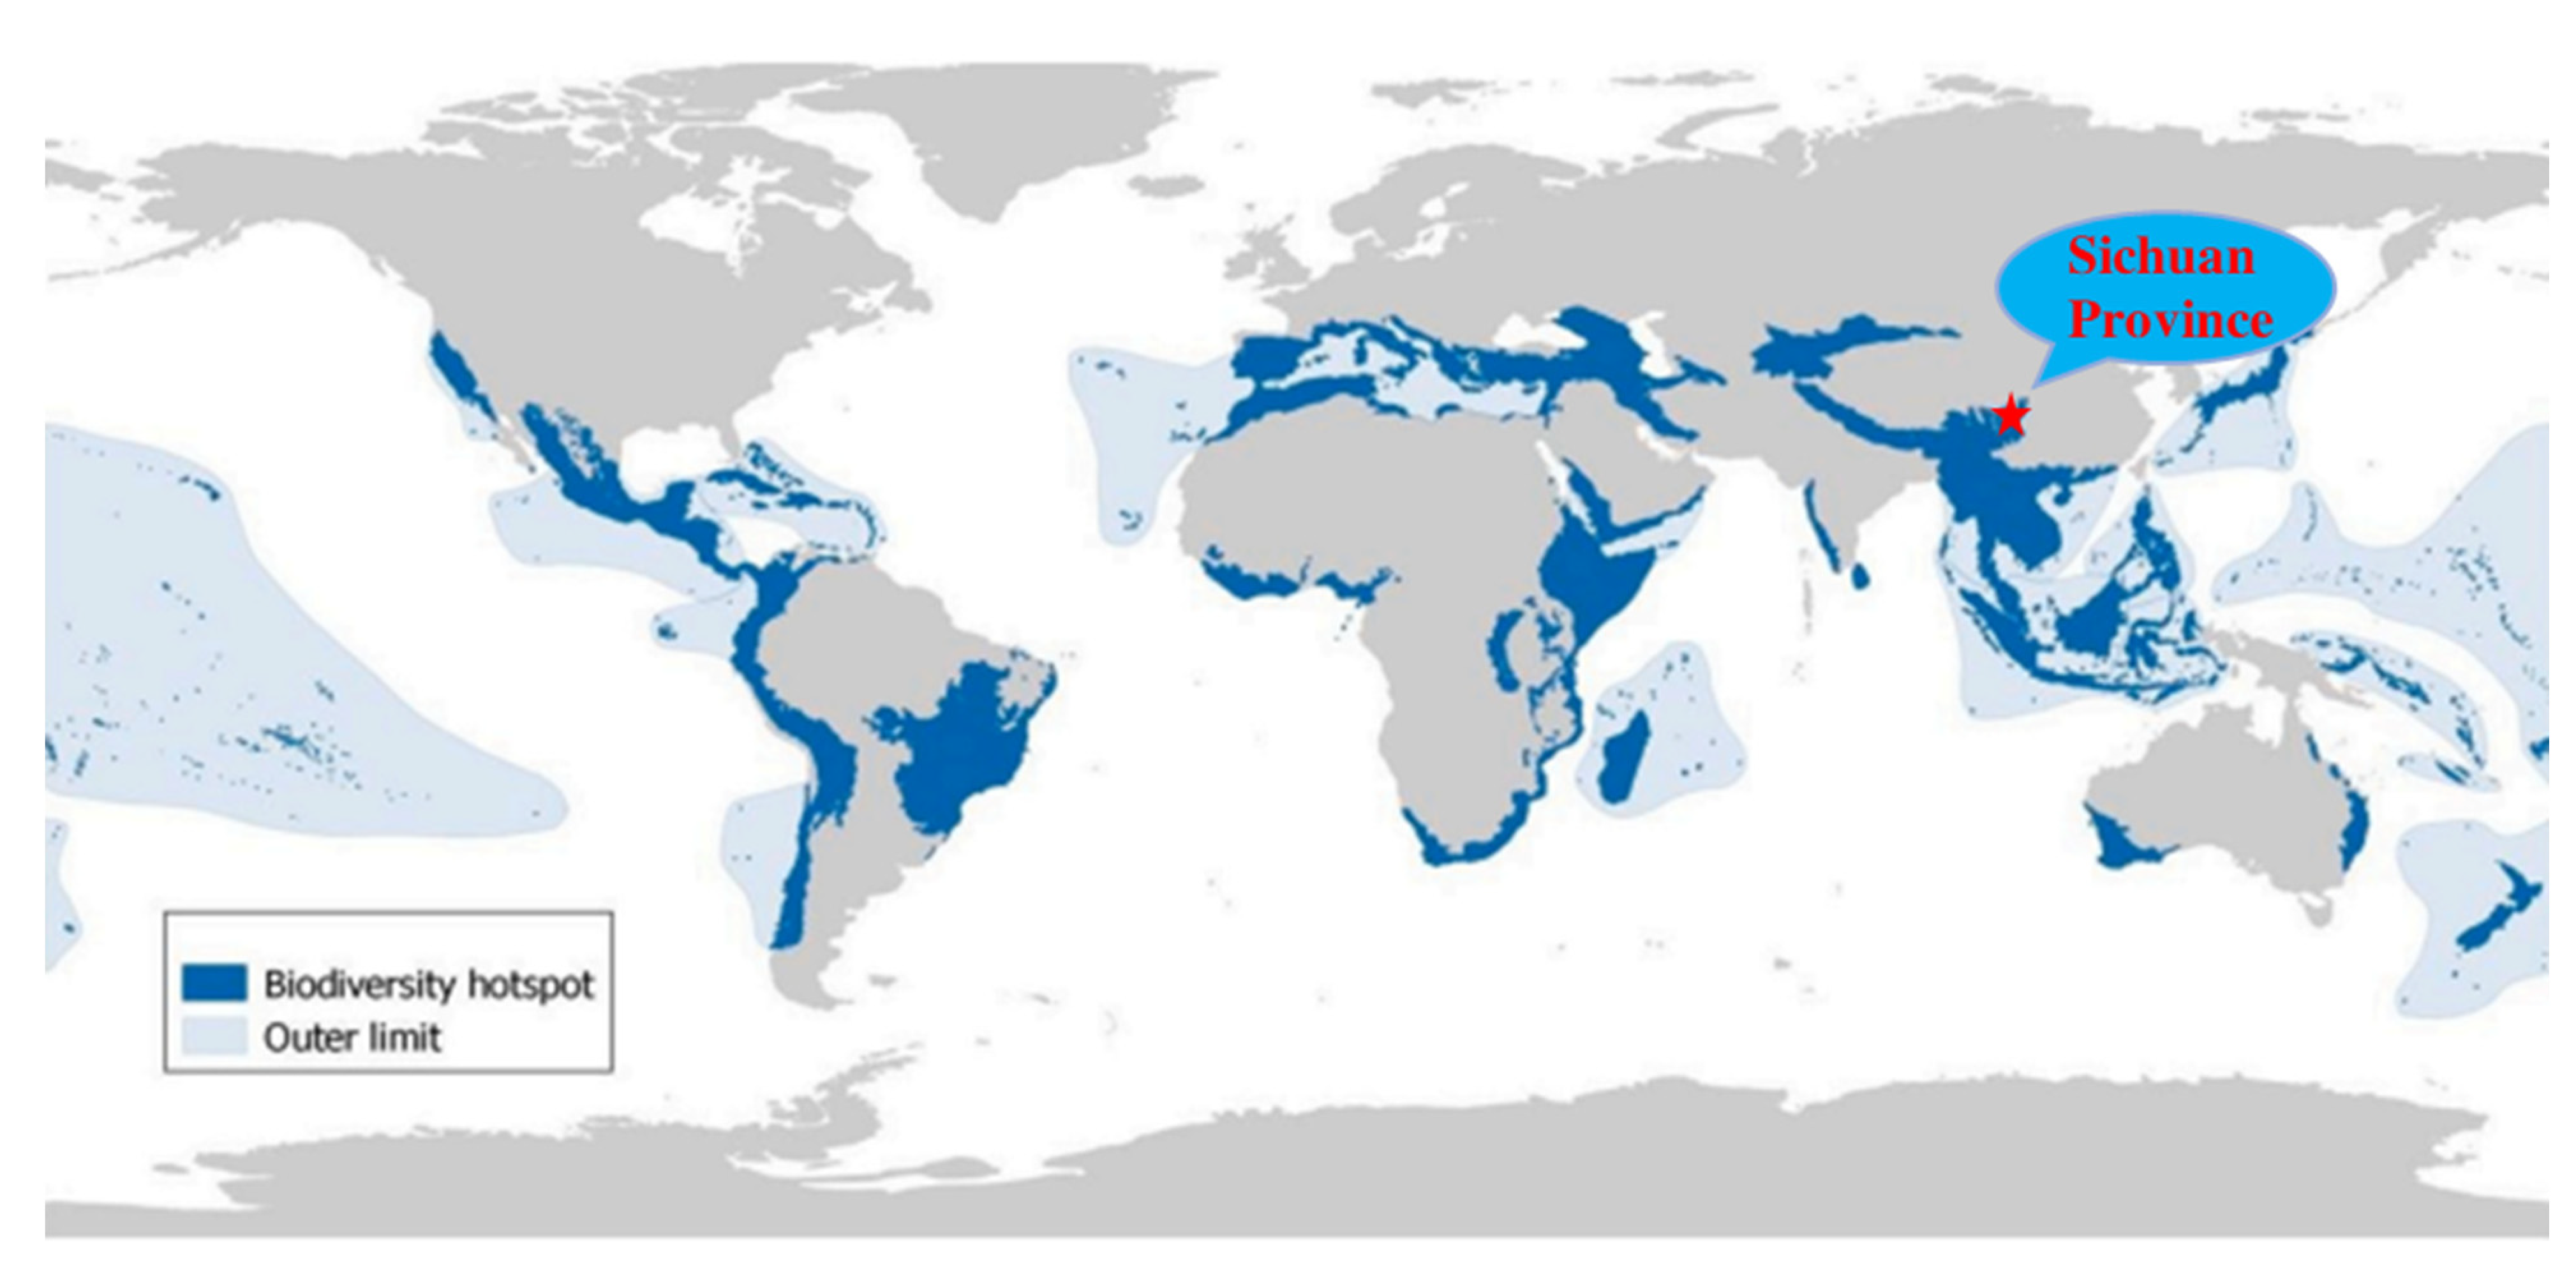
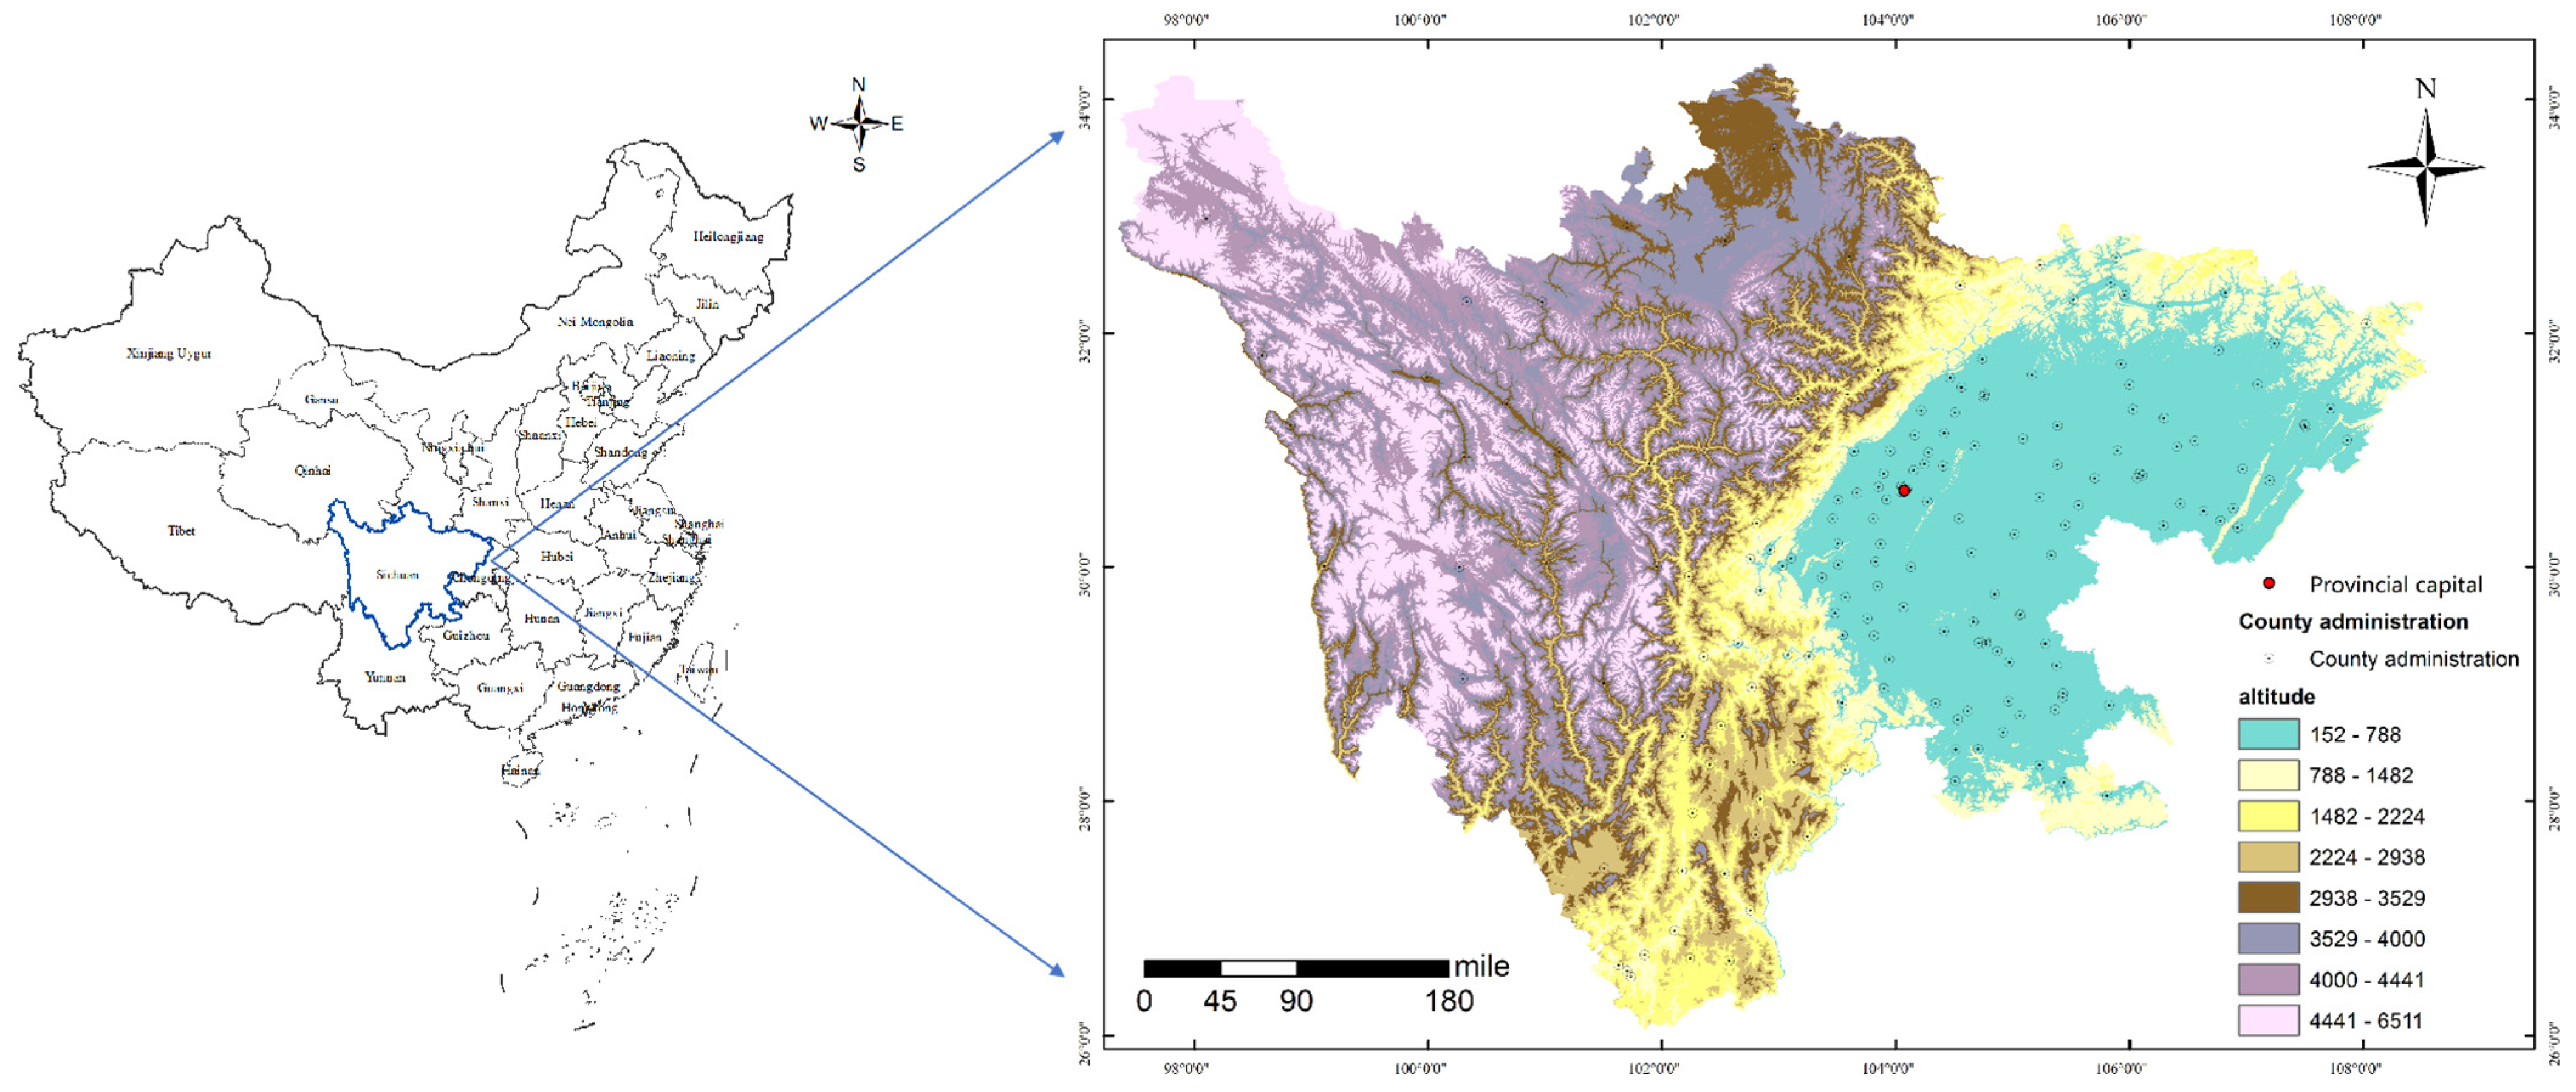
2. Study Area
3. Materials and Methods
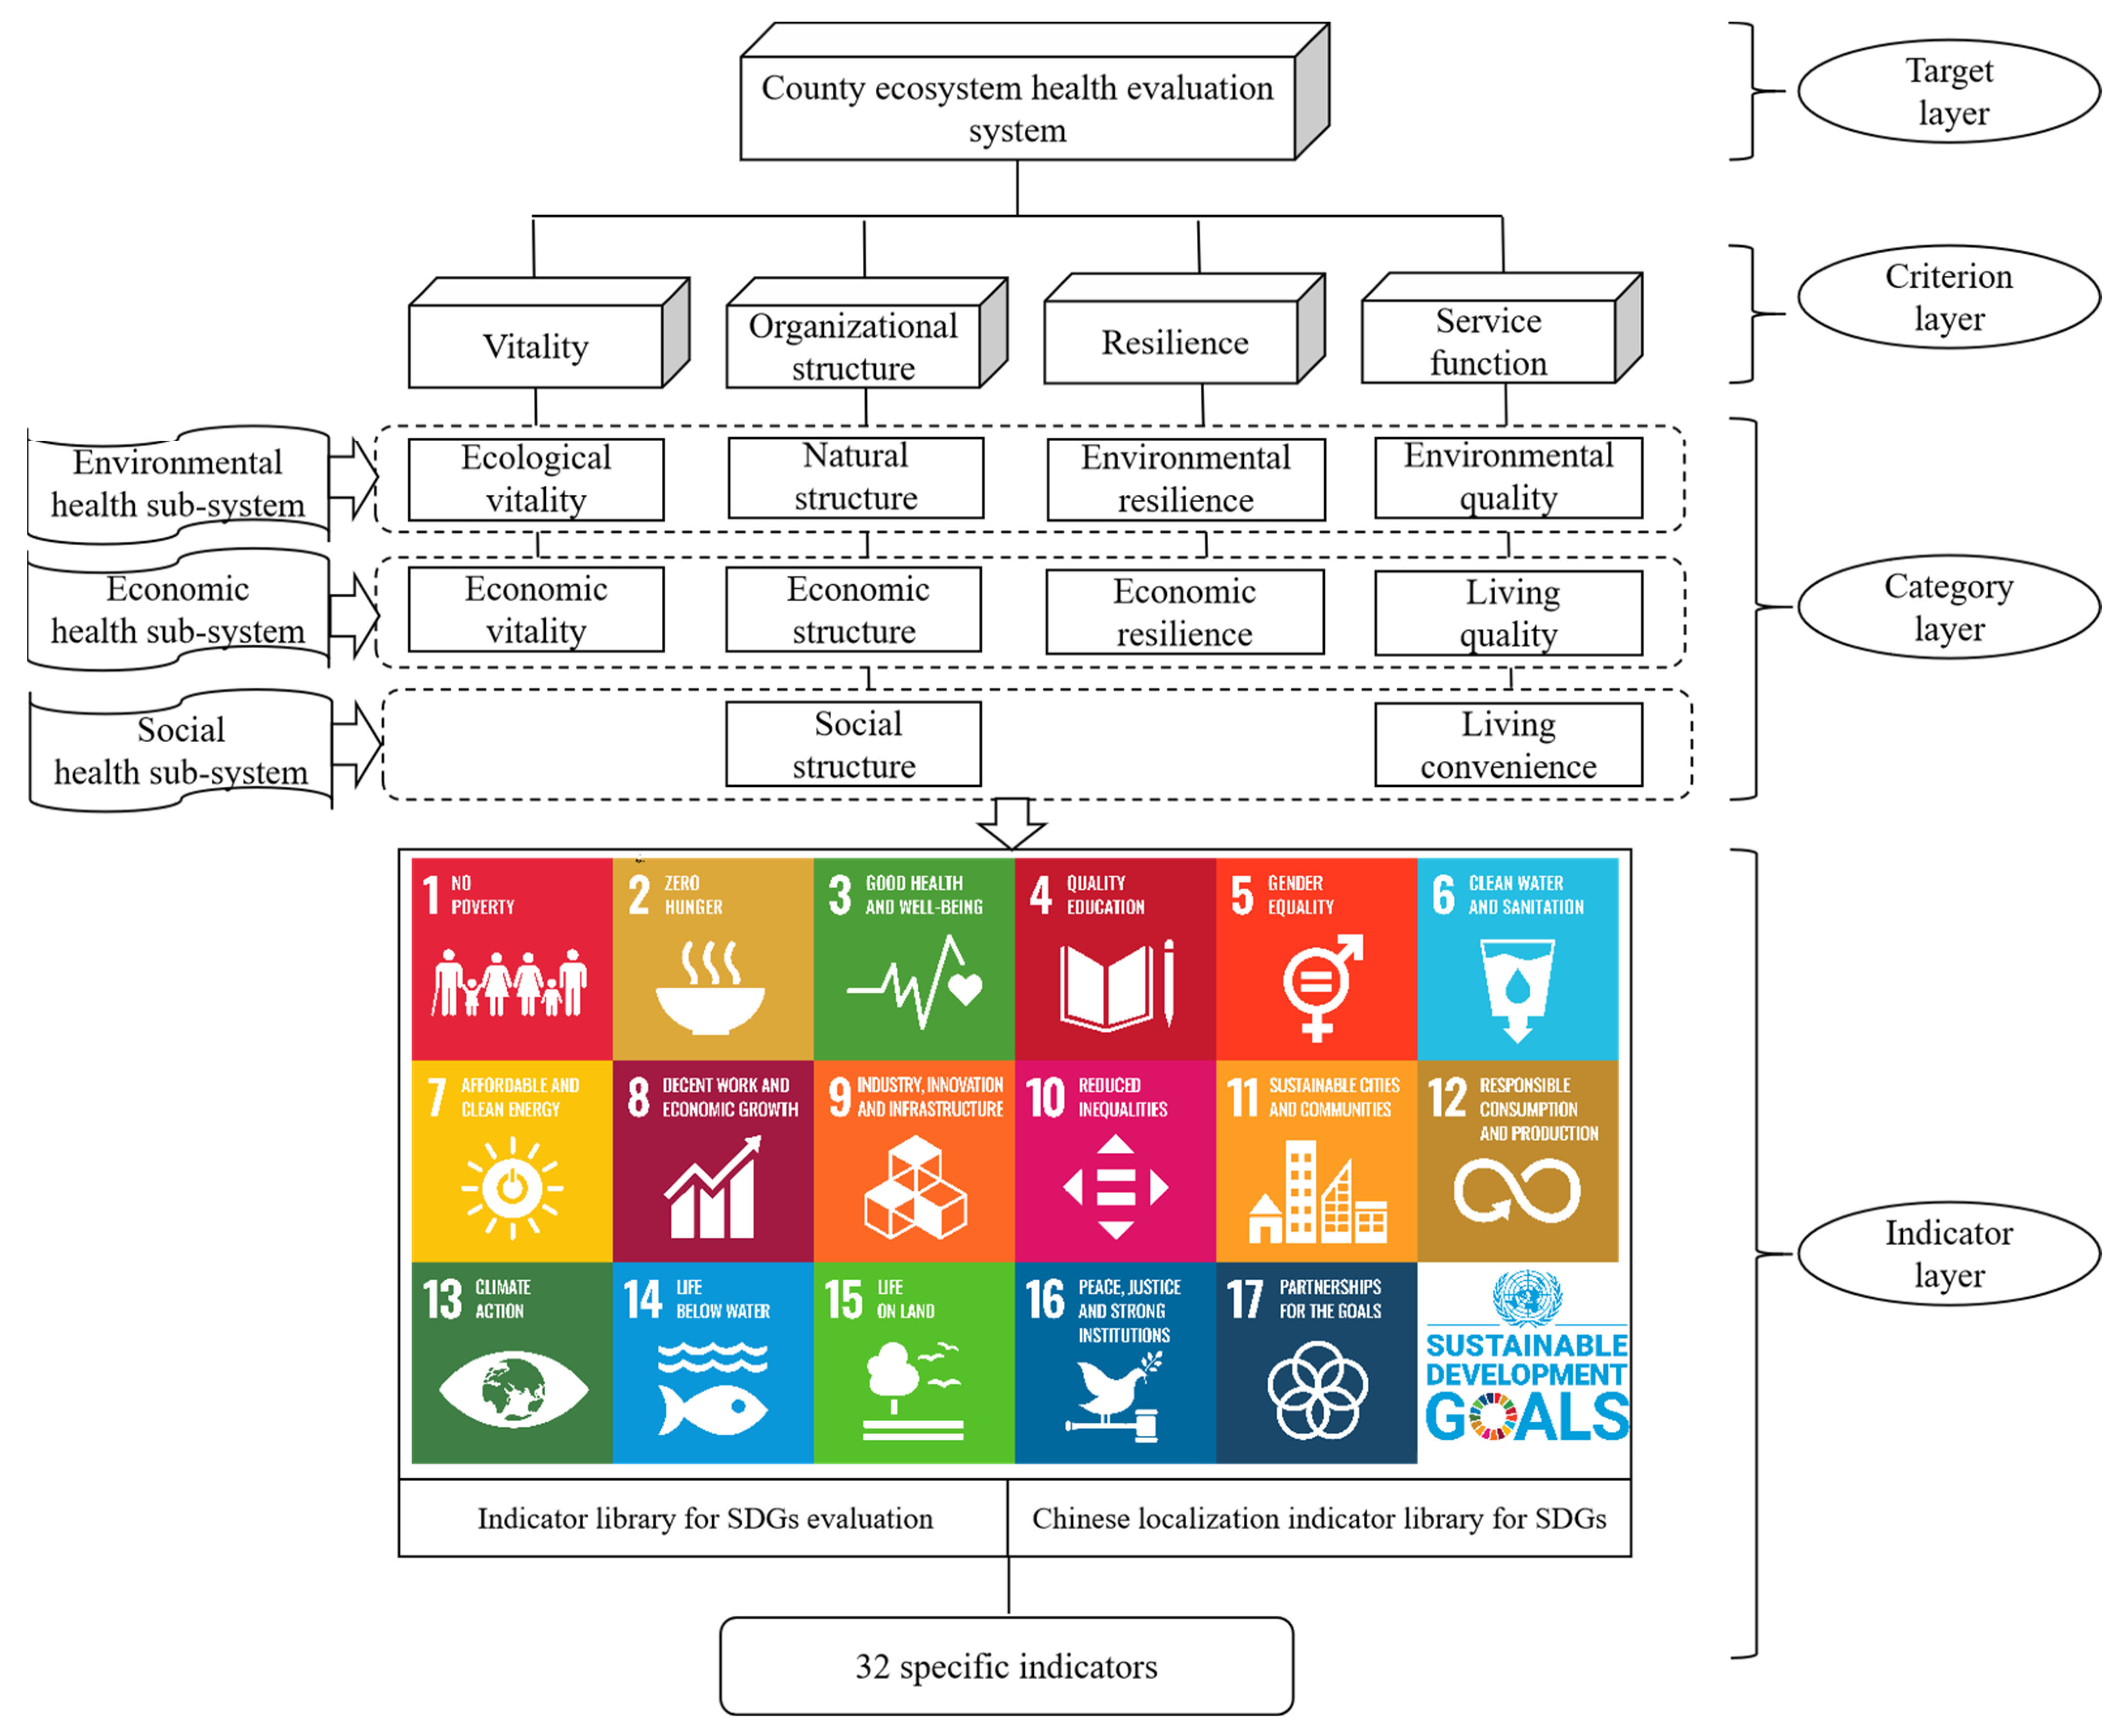
3.1. The Construction Method of the Index System
3.2. Evaluation Model
3.2.1. Standardization of Indicators
3.2.2. Weight Calculation
3.2.3. Weighted Method to Measure Ecosystem Health Level
3.3. Spatial Correlation Analysis Model
3.3.1. Global Spatial Correlation Analysis
3.3.2. Local Spatial Correlation Analysis
3.4. Diagnostic Models of Obstacle Factors
3.5. Data Sources
4. Results
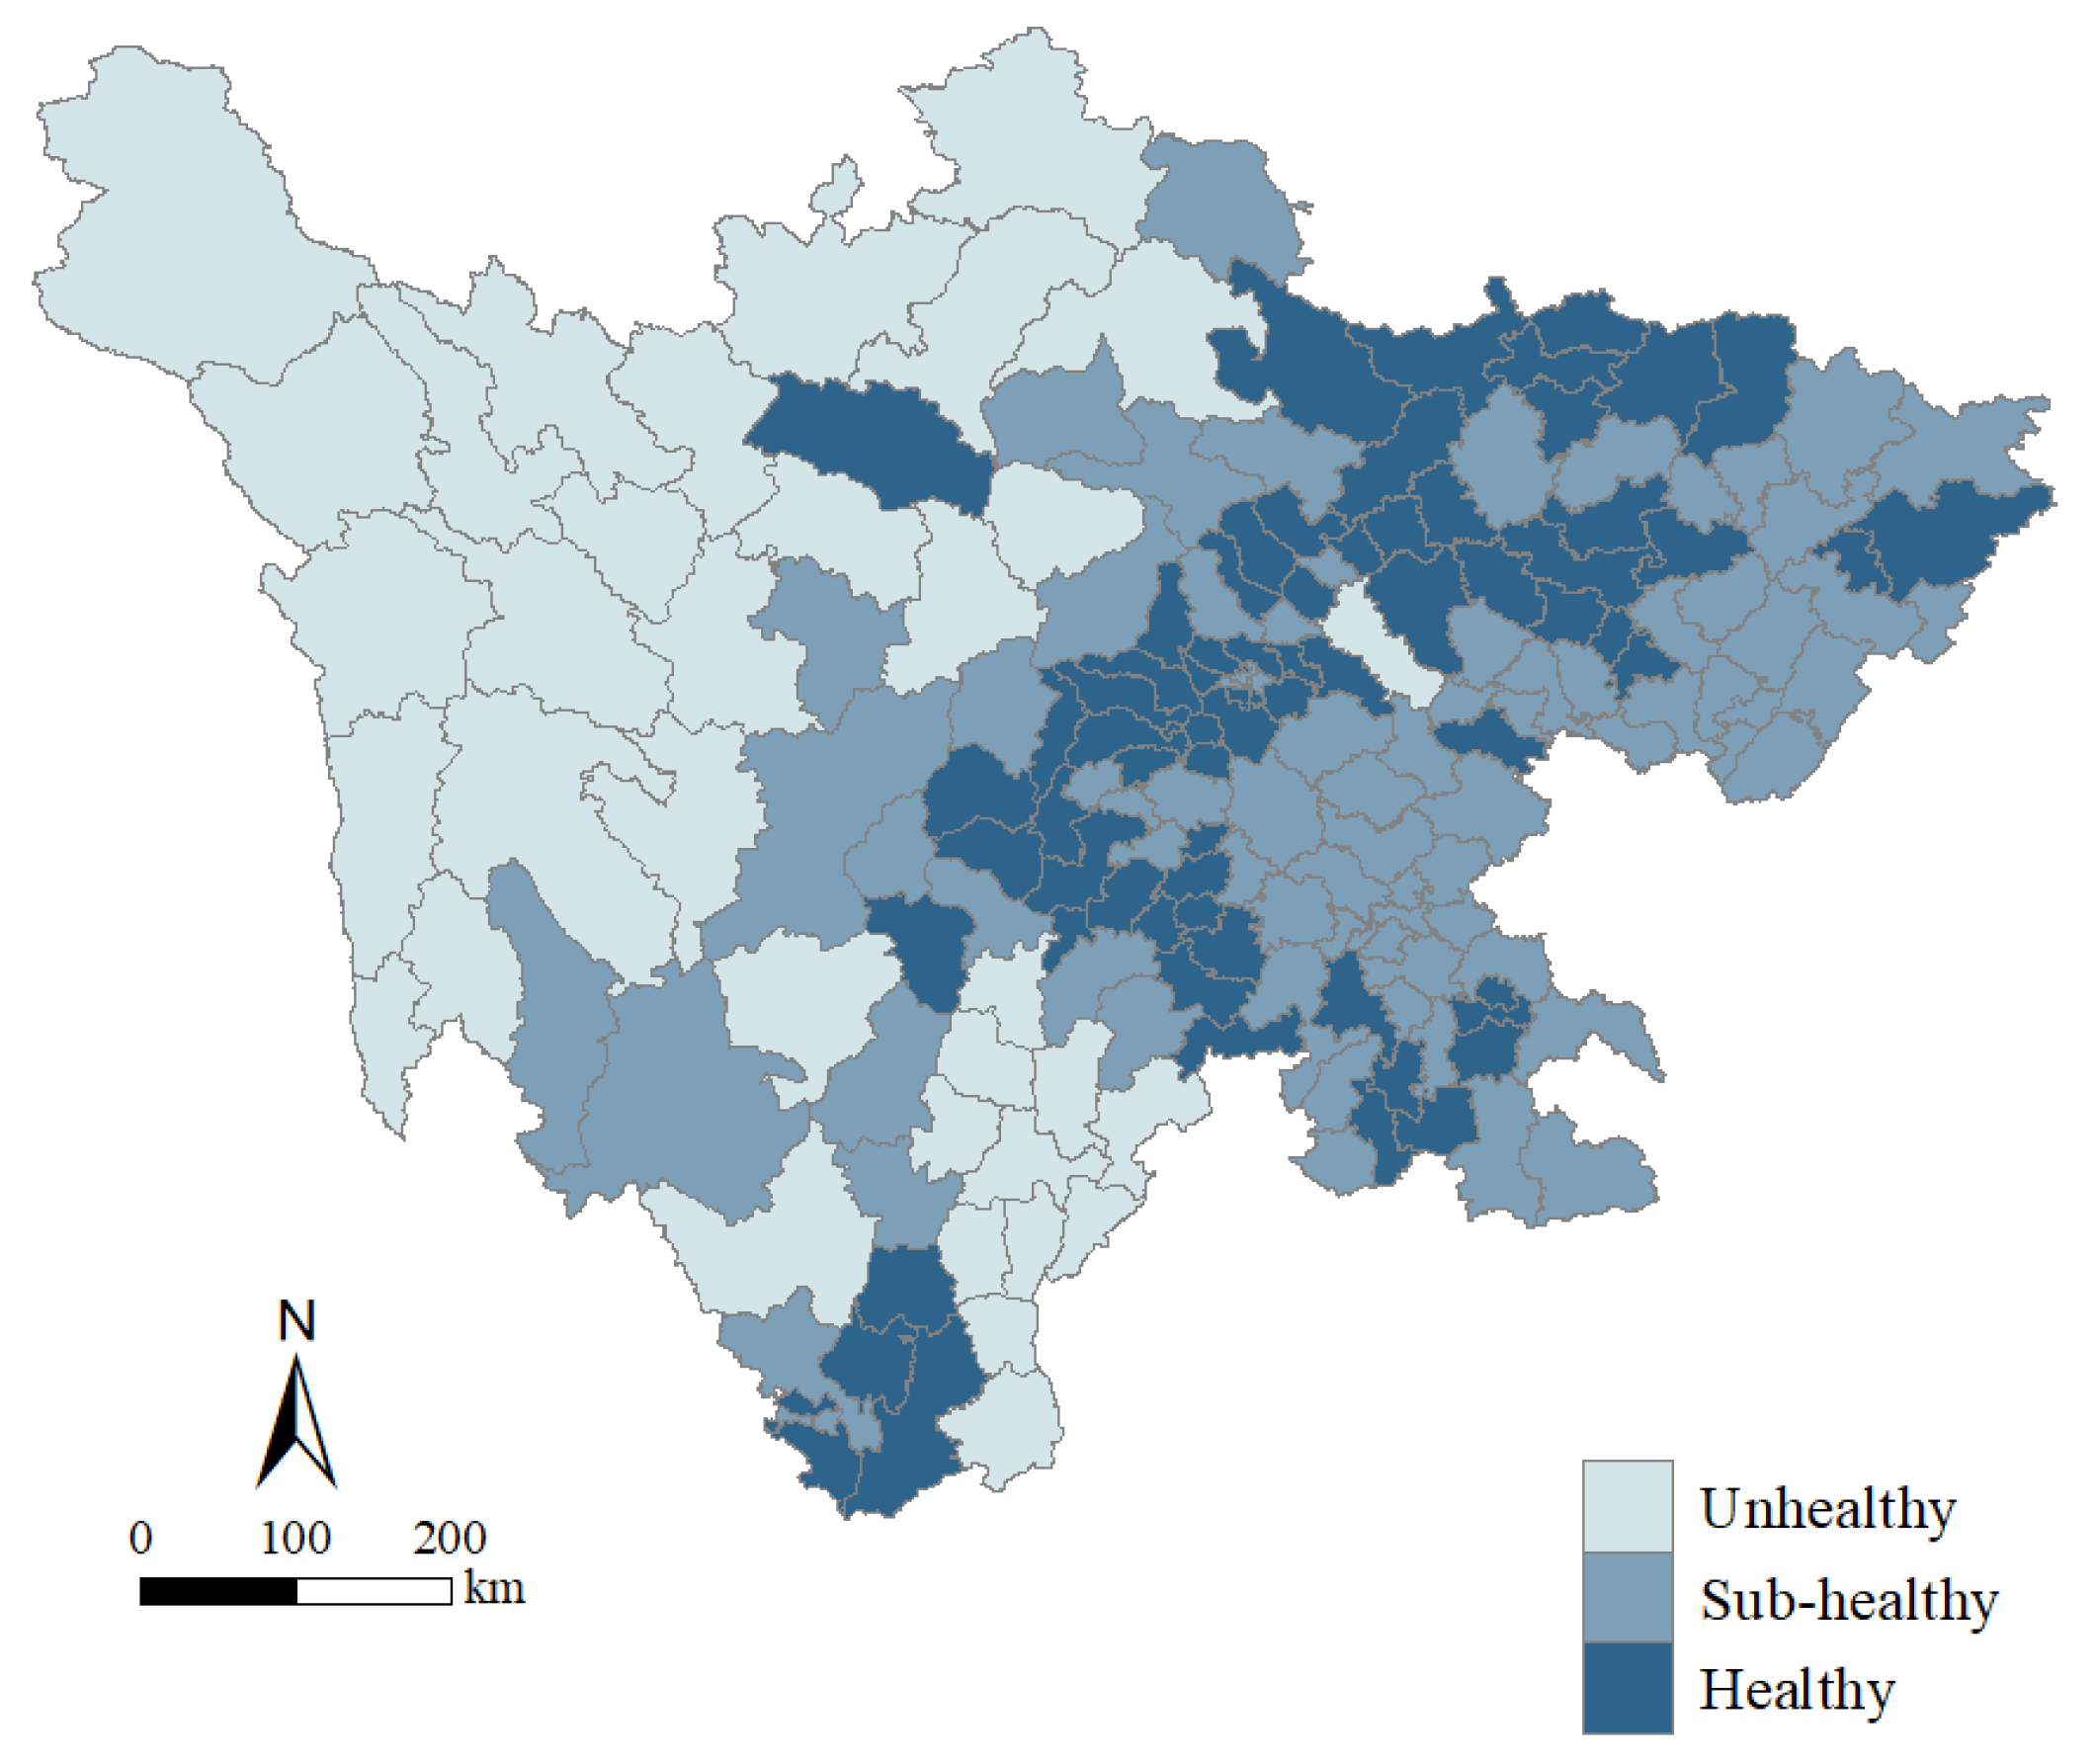
4.1. Measurement Results and Spatial Feature Analysis
4.2. Spatial Heterogeneity Analysis
4.3. Obstacle Model
5. Discussion
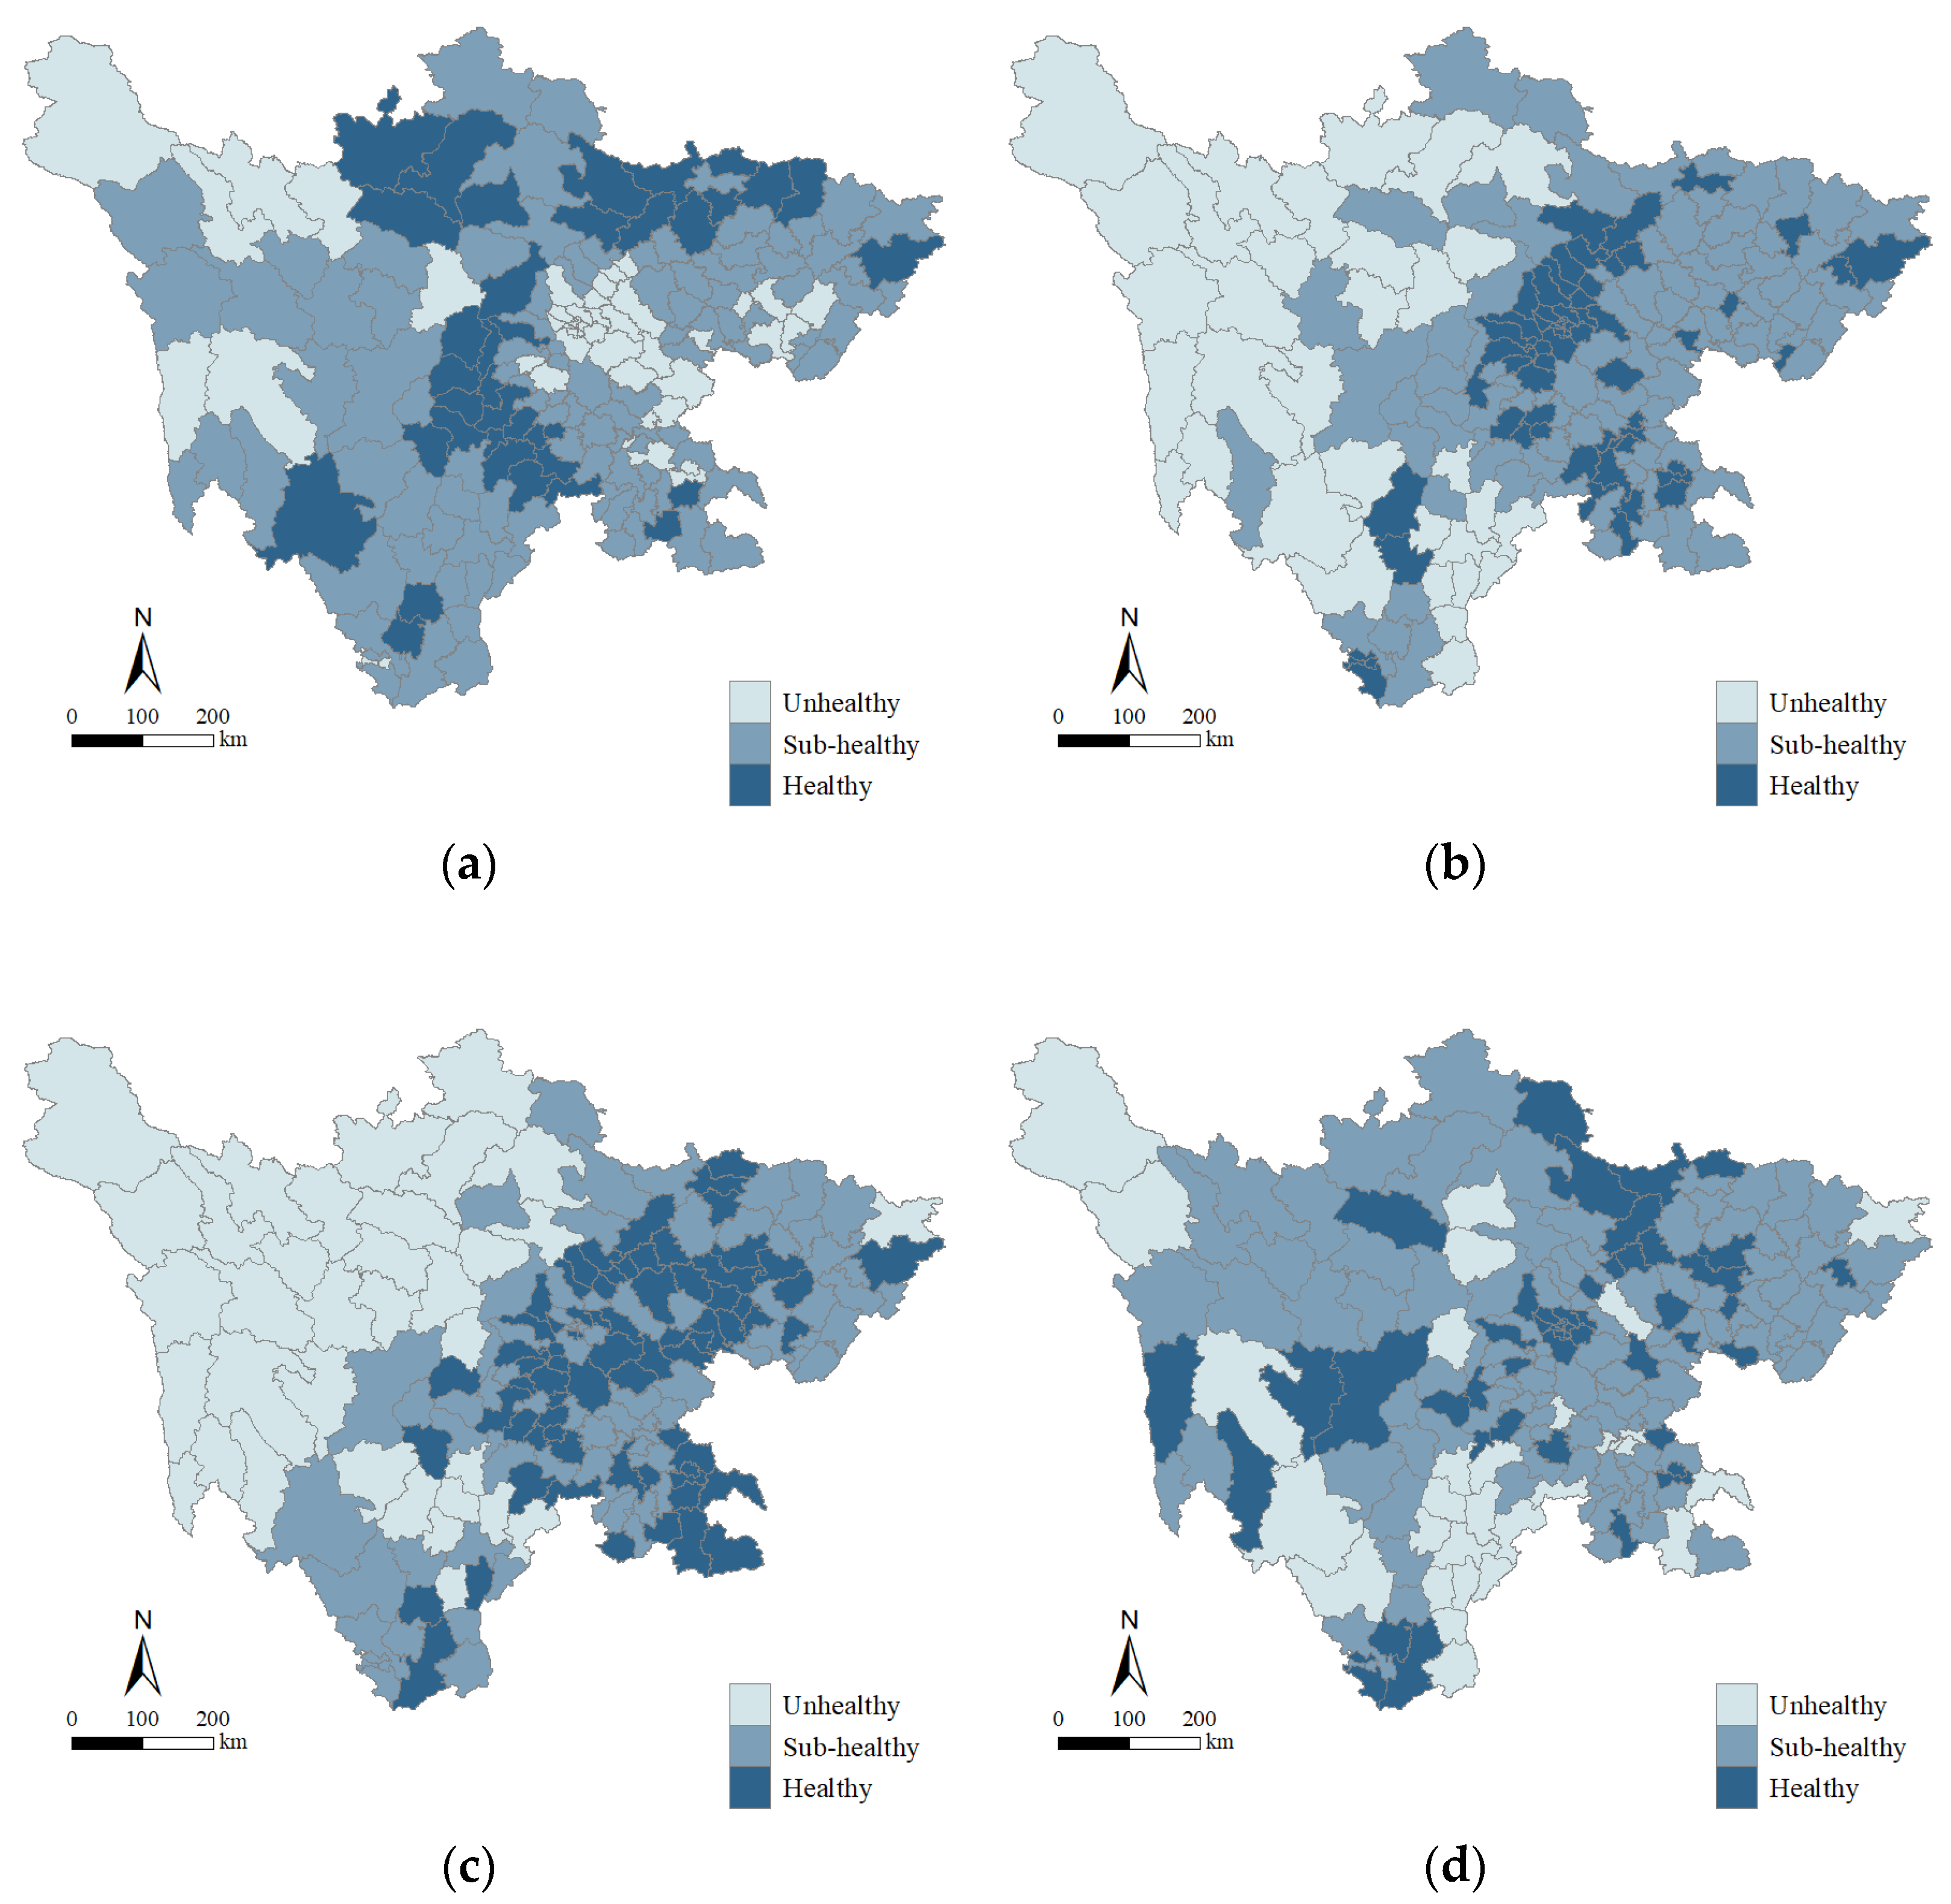
- (a)
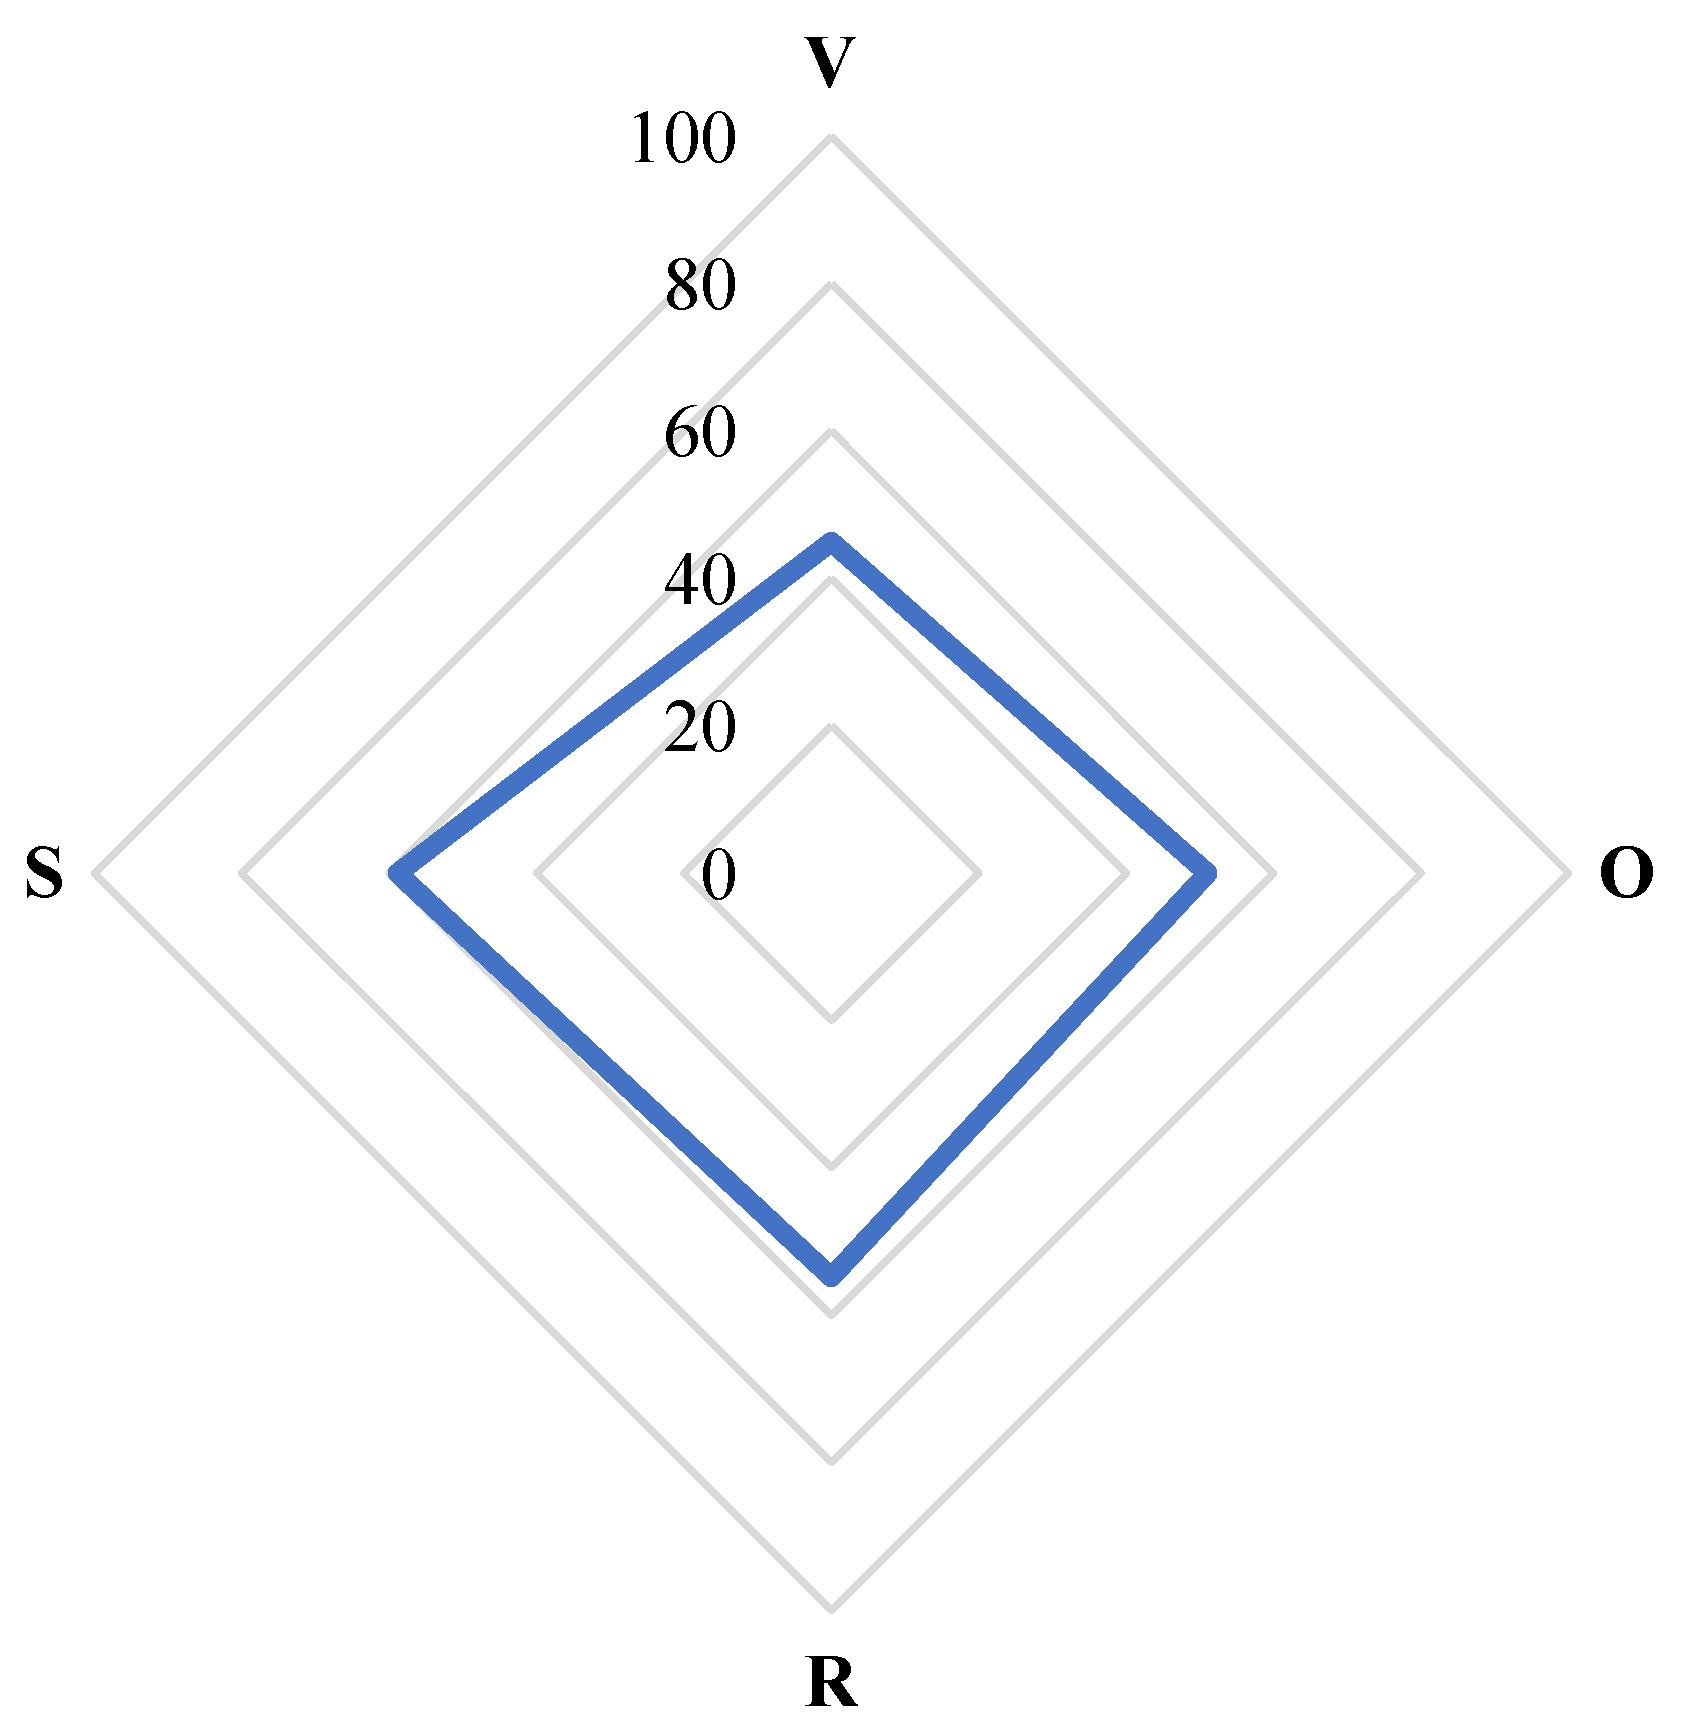
- The county ecosystems in Sichuan Province are generally at the sub-health level. The ecosystem health levels differ little among the counties and have significant spatial distribution characteristics. The healthy and sub-healthy counties are mainly distributed in the southeast of Sichuan, and the unhealthy counties in the northwest Sichuan. When improving the health of county-level urban ecosystems, Sichuan Province needs to pay special attention to the urban vitality of county-level cities, and take measures to expedite the economic and ecological vitality of county-level cities. In particular, in the southeastern region, the government should strive to improve the ecological vitality and environmental resilience of county-level cities and make up for the shortcomings of the healthy development of urban ecosystems. In the northwest, while maintaining environmental quality, the government should strive to increase the economic vitality required for the health of the urban ecosystem, continuously improve the quality of life of the people, and optimize the social and economic structure of the county seat.
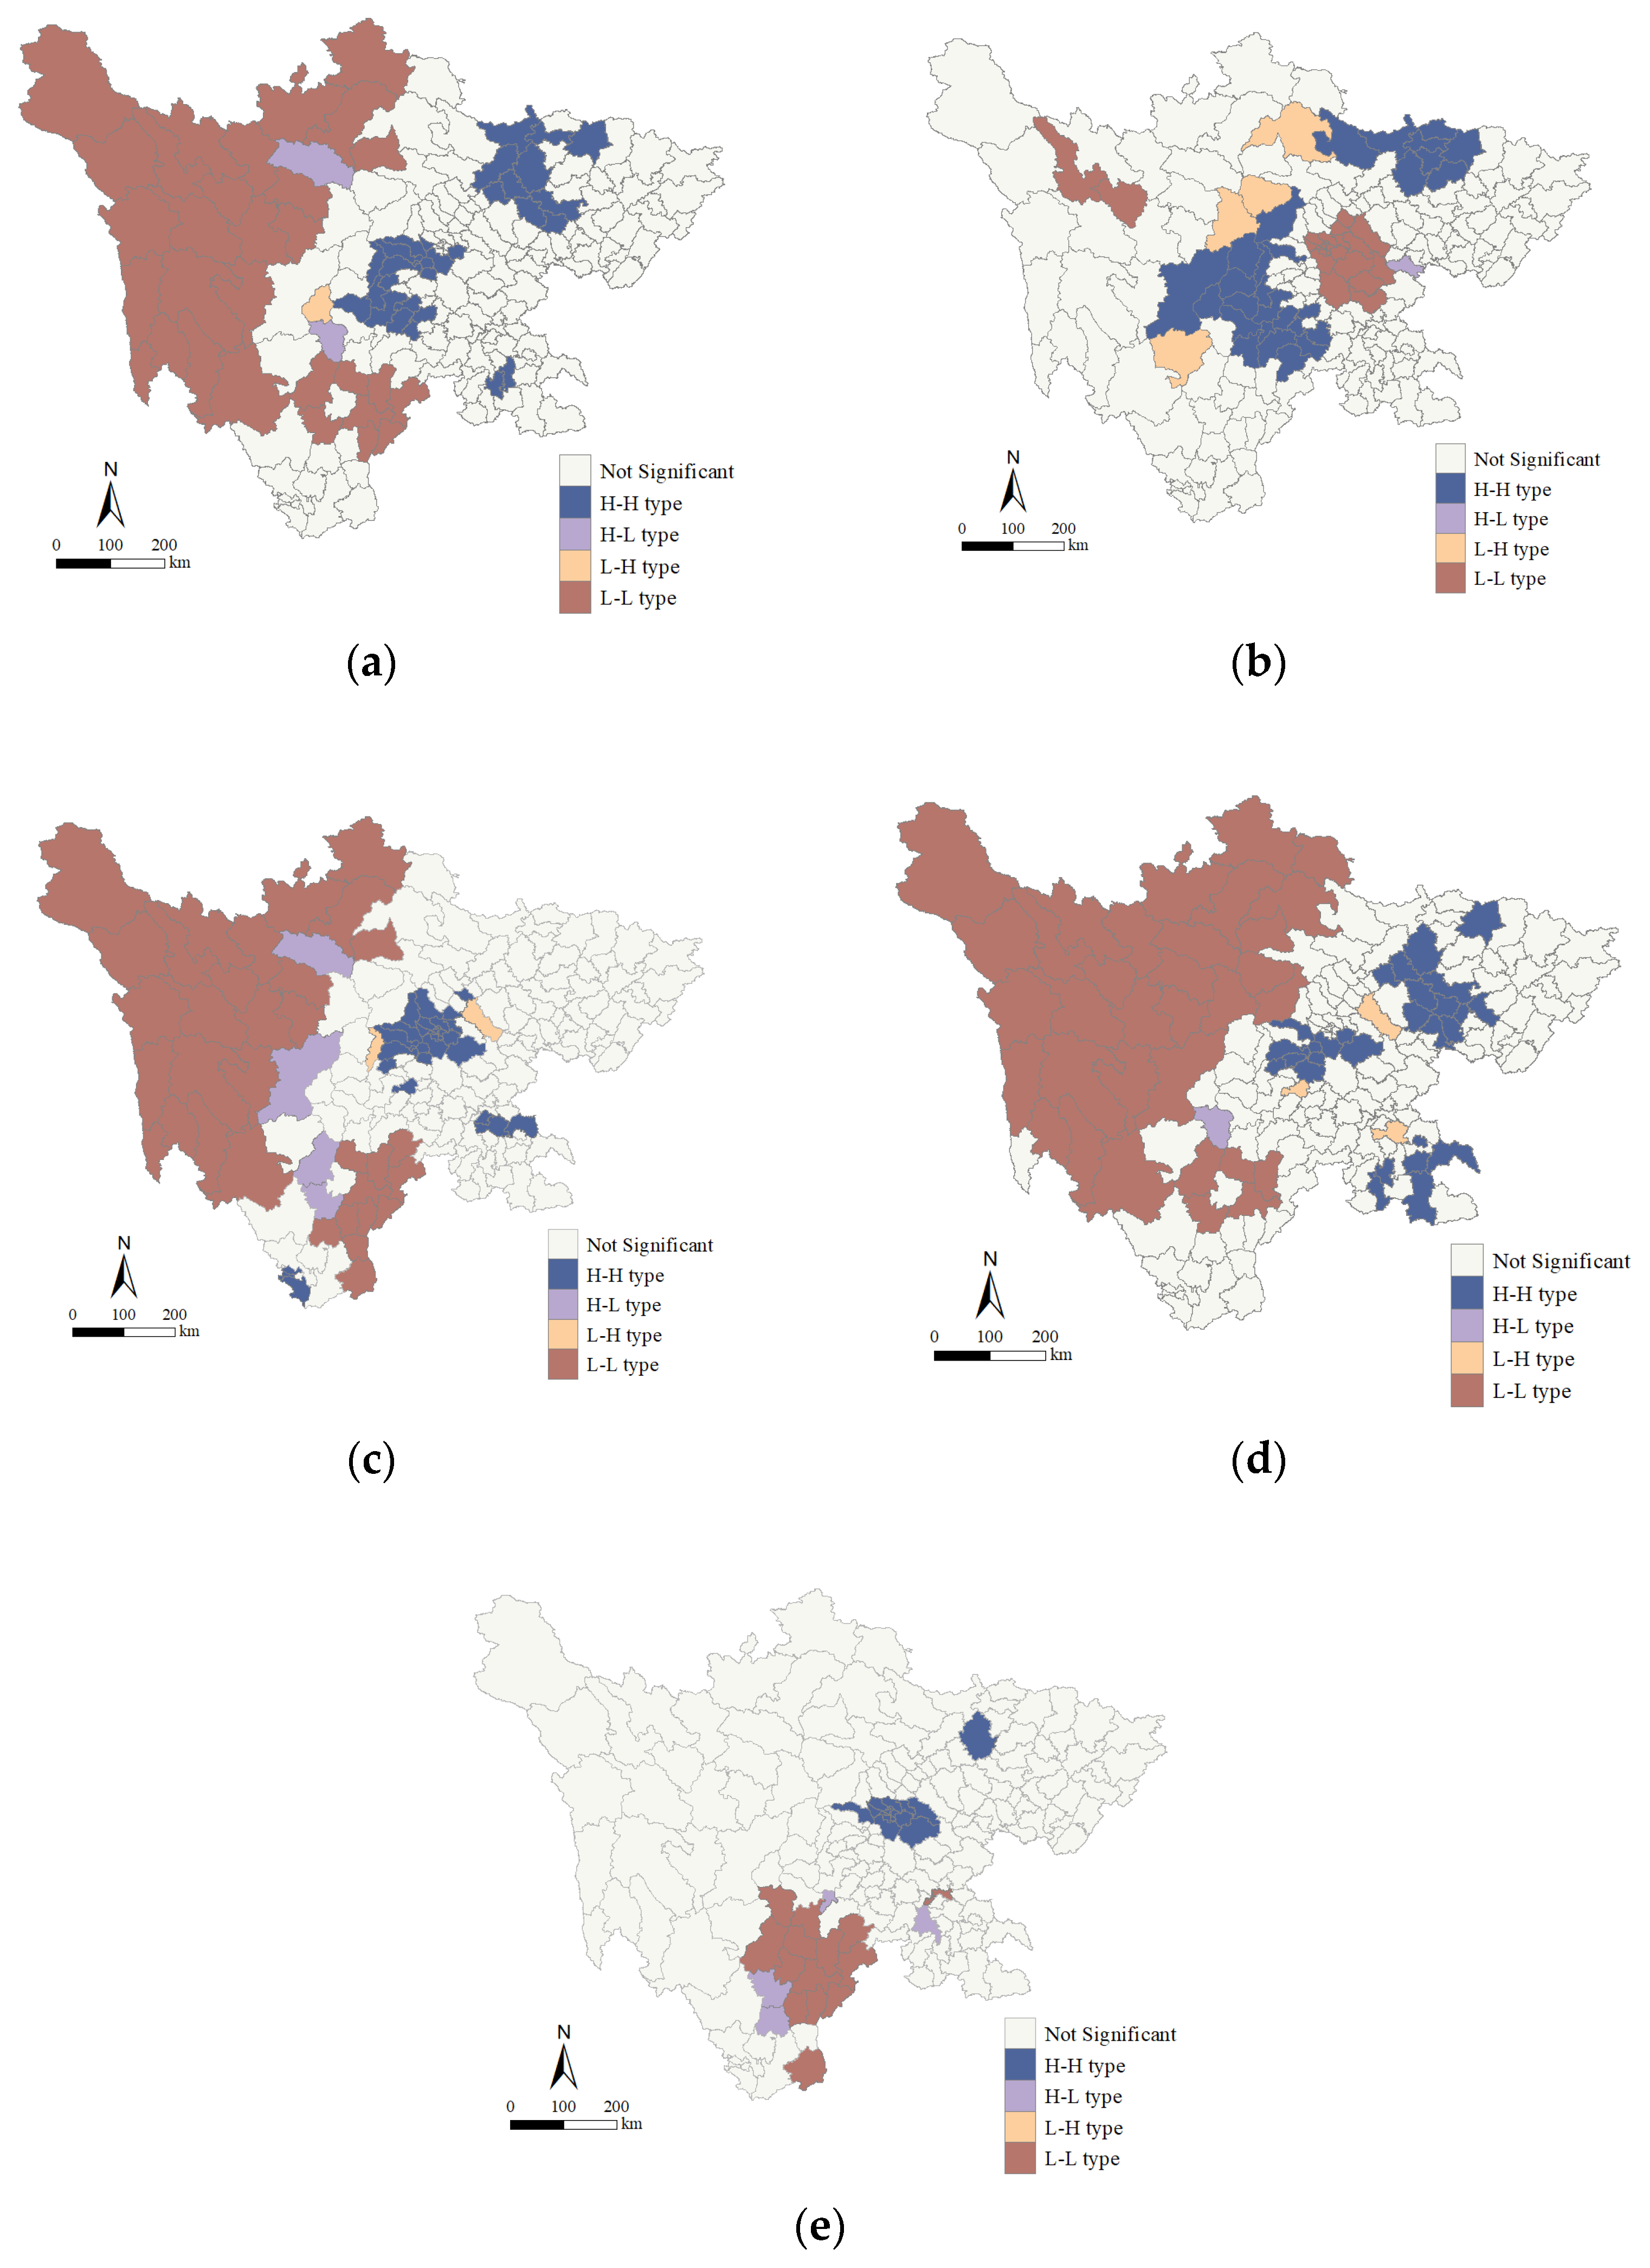
- (b)
- The ecosystem health level and the four criterion indicators have strong agglomeration in the spatial distribution, the correlation between counties is strong, and the global Moran’s I index is positive, with all > 0.4. The analysis of the LISA index showed that the local correlation between the health levels of ecosystems in each county in Sichuan was obvious, the H–H agglomeration area was distributed in the Chengdu–Mianyang area, and the L–L agglomeration area in the northwest Sichuan area. Almost all the criteria layer indicators showed different degrees of H–H agglomeration in the Chengdu plain and L–L in the northwestern Sichuan region. It is necessary to seize opportunities for coordinated regional development such as the construction of the Chengdu-Chongqing economic circle, strengthen the radiation and driving effect of counties with relatively healthy ecosystems such as Chengdu–Mianyang, and generate positive spillover effects with the help of spatial autocorrelation.
- (c)
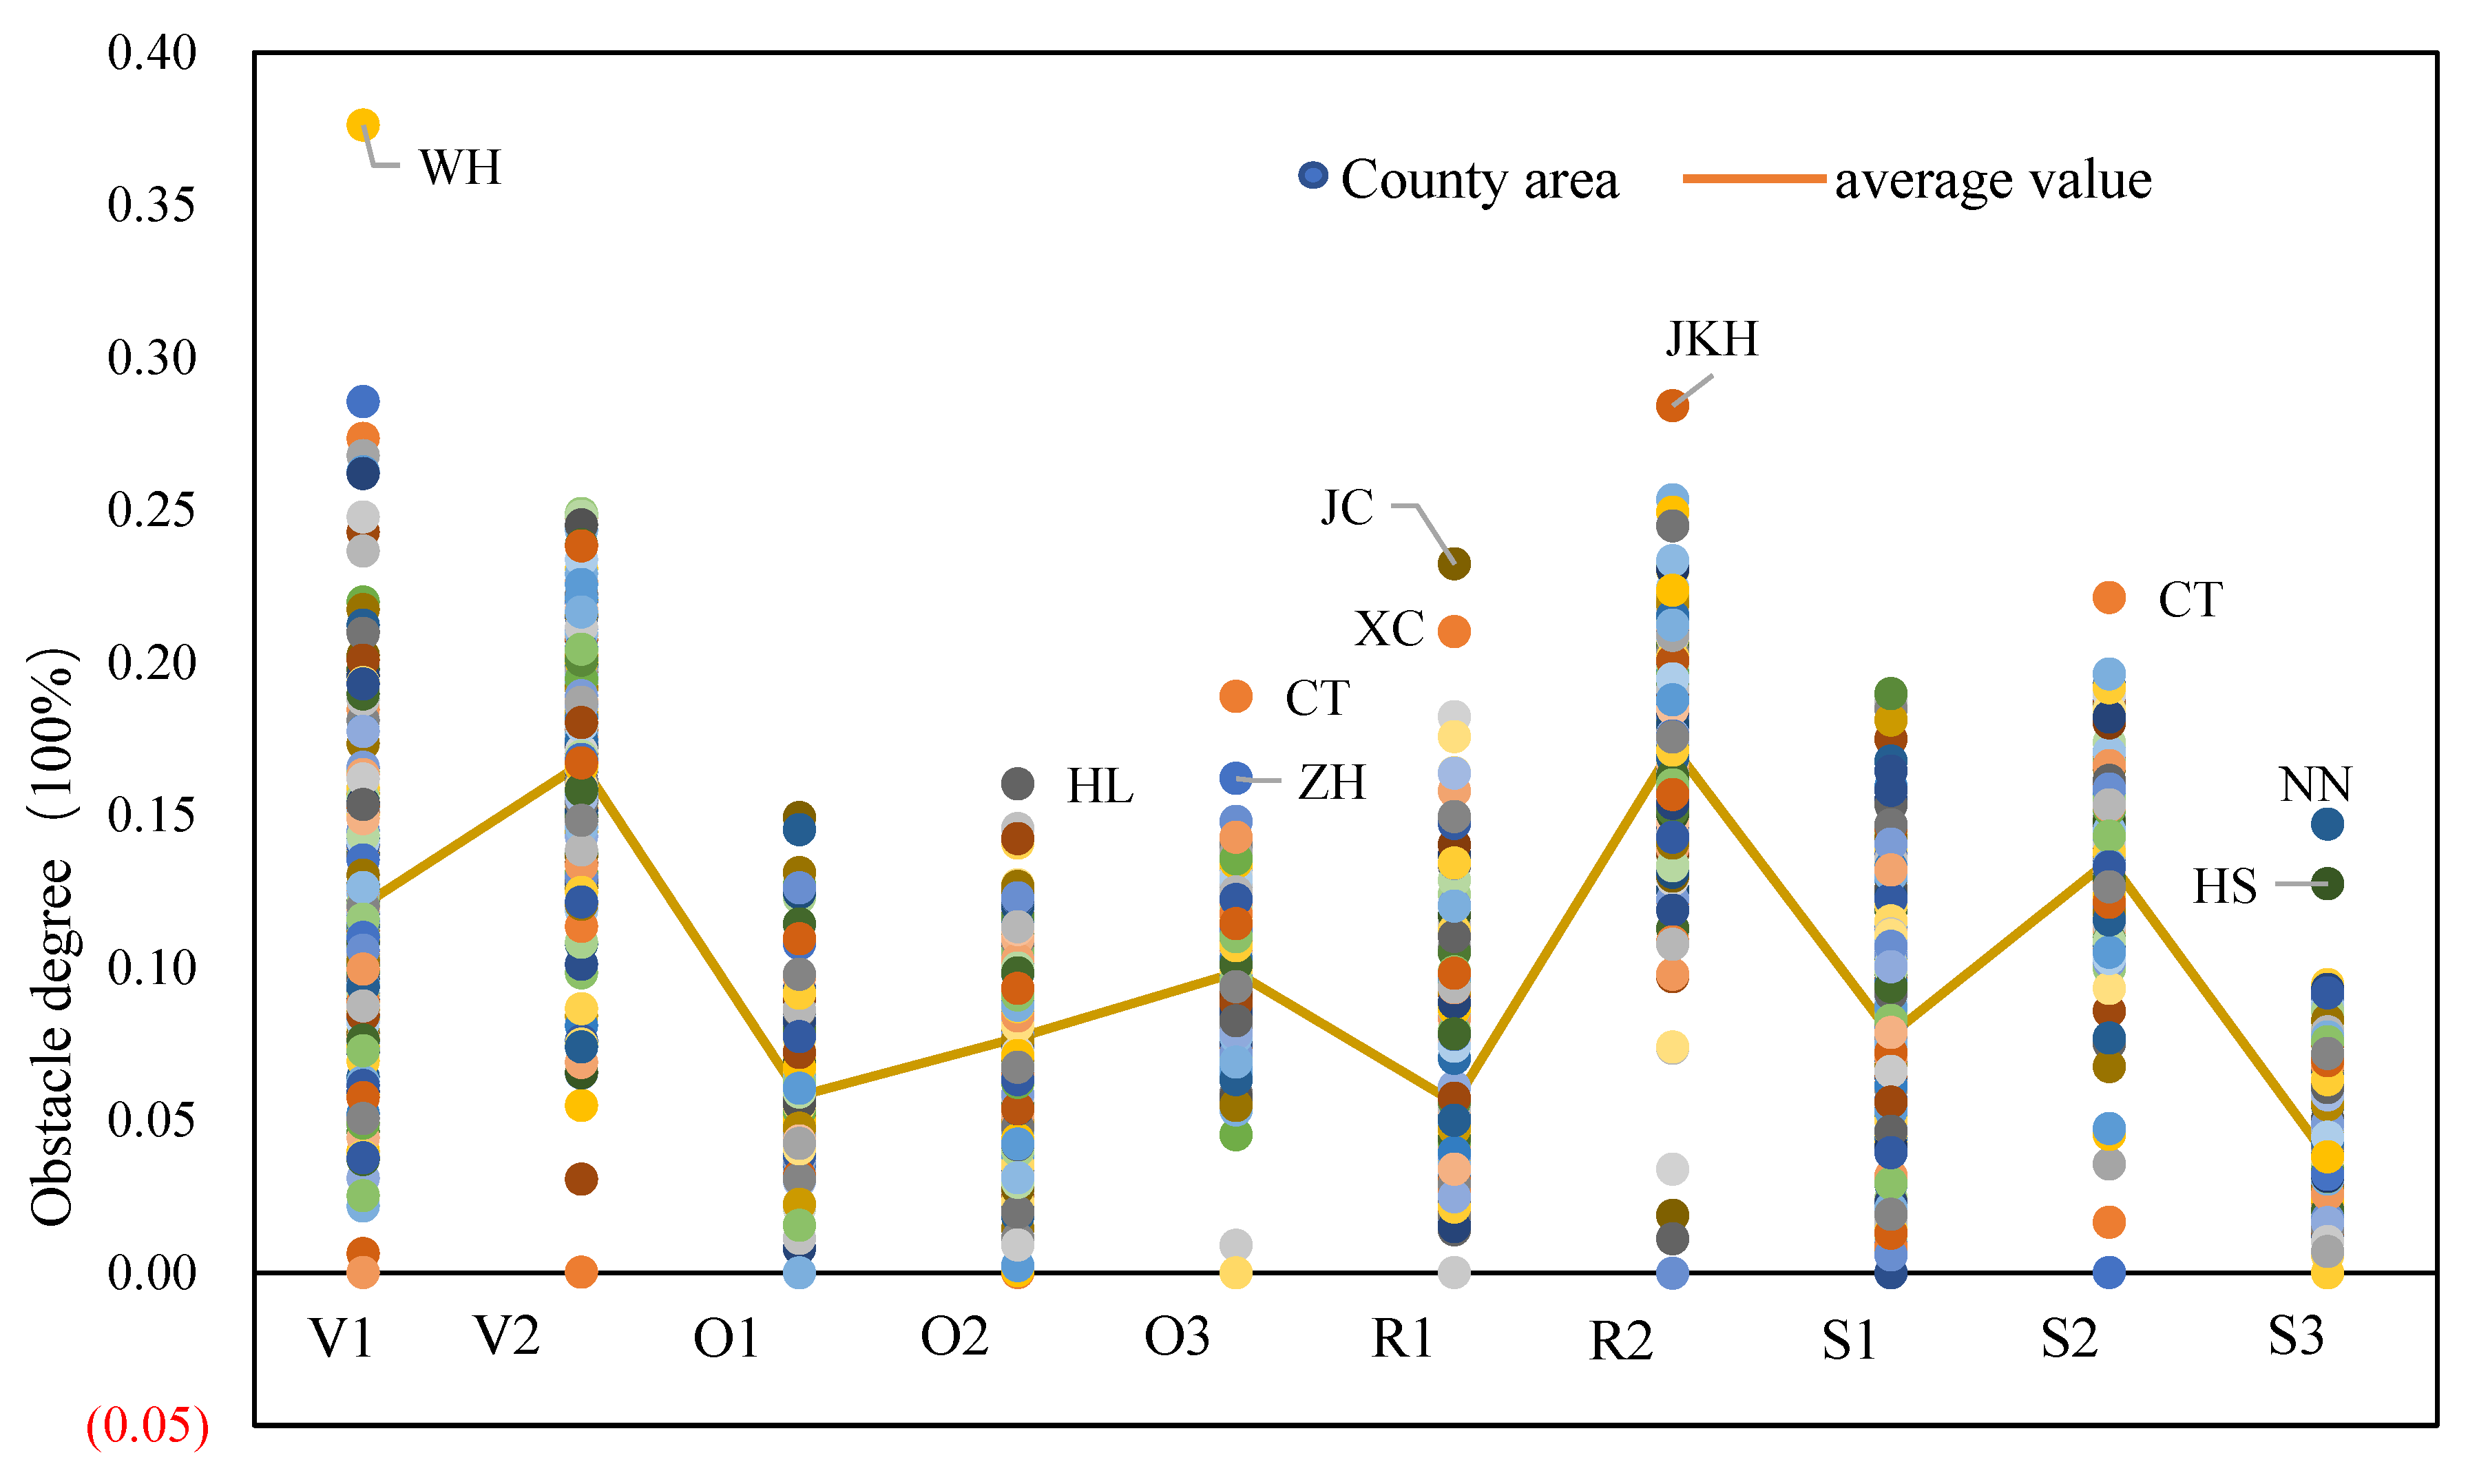
- The analysis of obstacles shows that economic development is still a shortcoming for the healthy development of ecosystems in Sichuan counties, and economic vitality, economic resilience, and quality of life are the largest obstacles. The ecological environment quality of most county units is out of sync with the social and economic quality. The counties with relatively developed social economies often lack consideration of environmental protection while developing the economy. Governments at all levels should actively take measures to effectively narrow the development gap between the ecological environment and social economy in each county, promote the decoupling of economic growth and environmental costs, explore differentiated and characteristic development paths according to local conditions, strengthen resource complementarity and functional integration, and achieve the organic unity of ecological benefits.
- (d)
- The Obstacle degree discussed in this article also help indicate where counties should work in the future. Counties with low levels of ecosystem health such as Xiangtang, Shiqu, Seda, and Meigu should focus on indicators with higher barriers, improve the treatment level of urban sewage and domestic waste, and increase the per capita disposable income of residents in order to promote the resilience and service function of the urban ecosystem. Counties need to take action to improve performance on indicators with higher barriers. For example, Wuhou should reduce its levels of pollution emissions, increase the density of its vegetation coverage and biological abundance, and effectively improve the ecological vitality of the region.
Author Contributions
Funding
Institutional Review Board Statement
Informed Consent Statement
Data Availability Statement
Acknowledgments
Conflicts of Interest
References
- Yi, Q.Y.; Zhang, Y.F.; Ding, M.H. Assessment of urban ecosystem health based on information entropy method. J. Nanning Norm. Univ. (Nat. Sci. Ed.) 2021, 38, 122–128. [Google Scholar] [CrossRef]
- Su, M.; Yang, Z.; Chen, B.; Liu, G.; Zhang, Y.; Zhang, L.; Xu, L.; Zhao, Y. Urban Ecosystem Health Assessment and Its Application in Management: A Multi-Scale Perspective. Entropy 2012, 15, 1–9. [Google Scholar] [CrossRef]
- Qin, Q.; Dai, W.; Chen, Z.X. Review of researches on the evaluation of urban ecosystem health in China. Saf. Environ. Eng. 2014, 21, 106. [Google Scholar]
- Tao, D.K.; Yang, C.; Lv, J.; Wang, X.J. Development path of new urbanization in county-level units under the background of territorial planning. City Plan. Rev. 2022, 46, 76. [Google Scholar]
- Li, X.L. Research on the Adjustment of Administrative Division to Adapt to the Future Urbanization Development. Reg. Econ. Rev. 2021, 32, 116–124. [Google Scholar] [CrossRef]
- Zhang, R.B.; Zhong, C.B. Smart city pilot projects, nearby pollution transfer, and green and low-carbon development. China Resour. Environ. 2022, 32, 91–104. [Google Scholar]
- Qian, J.; Li, J.Y. Coordinated Development between Regional Economy and Environment under the Ecosystem Health System. Ecol. Econ. 2017, 33, 179. [Google Scholar]
- Zhang, N.; Dou, S.Q.; Xu, Y.; Jing, J.L.; Zhang, H.B. Temporal spatial changes of ecosystem health in Guangxi in the past 14 years. J. Guilin Univ. Technol. 2021, 41, 370–378. [Google Scholar]
- Zhu, J.Y.; Lu, H.T.; Wang, H.F.; Yan, Y.; Tang, L.N. Ecosystem health assessment of the Wenchuan earthquake hard-hit disaster areas during the recovery period. Acta Ecol. Sin. 2018, 38, 9001–9011. [Google Scholar]
- Costanza, R. Toward an operational definition of health. Ecosyst. Health 1992, 6, 239–256. [Google Scholar]
- Li, H.; Huang, M.S.; Yao, L.; Chen, S.J. Dynamic assessment of urban ecosystem health in Hefei City based on emergy analysis. Chin. J. Ecol. 2011, 30, 183–188. [Google Scholar] [CrossRef]
- Liu, G.; Yang, Z.; Chen, B.; Zhang, Y.; Zhang, L.; Zhao, Y.; Jiang, M. Emergy-based urban ecosystem health assessment: A case study of Baotou, China. Commun. Nonlinear Sci. Numer. Simul. 2009, 14, 972–981. [Google Scholar] [CrossRef]
- Pan, Z.; He, J.; Liu, D.; Wang, J.; Guo, X. Ecosystem health assessment based on ecological integrity and ecosystem services demand in the Middle Reaches of the Yangtze River Economic Belt, China. Sci. Total Environ. 2021, 774, 144837. [Google Scholar] [CrossRef]
- Wang, Q.; Liu, M.; Tian, S.; Yuan, X.; Ma, Q.; Hao, H. Evaluation and improvement path of ecosystem health for resource-based city: A case study in China-Science Direct. Ecol. Indic. 2021, 128, 107852. [Google Scholar] [CrossRef]
- Guan, D.J.; Su, Y.; He, Z.C. Dynamic evaluation on urban ecosystem health based on fuzzy mathematics model. Res. Soil Water Conserv. 2014, 21, 150–156. [Google Scholar] [CrossRef]
- Zhao, S.; Chai, L.H.; Li, P.F.; Chen, H.X. Urban ecosystem health assessment model and its application: A case study of Tianjin. Acta Sci. Circumstantiae 2013, 33, 1173–1179. [Google Scholar] [CrossRef]
- Chen, K.L.; Su, M.X.; Li, S.C.; Lu, J.; Chen, Y.; Zhang, F.; Liu, Z. The health assessment of the urban ecosystem of Xining city. Geogr. Res. 2010, 29, 214–222. [Google Scholar]
- Guo, R.L.; Zheng, Q.Y.; Liu, J.; Li, M.R. Ecosystem health assessment of Chongqing City based on entropy and GM (1, 1) model. China Environ. Sci. 2012, 32, 1148–1152. [Google Scholar]
- Su, M.R.; Yang, Z.F.; Chen, B. Ecosystem health assessment of urban clusters: Method and application. Procedia Environ. Sci. 2012, 13, 1134–1142. [Google Scholar] [CrossRef] [Green Version]
- Ning, L.X.; Liang, X.Y.; Cheng, C.X. Spatiotemporal variations of ecosystem health of Jing-Jin-Ji region based on the PSR model. Ecol. Sci. 2021, 40, 1–12. [Google Scholar]
- Lu, Y.S.; Han, R.; Shi, Y.; Guo, Y. Ecosystem health assessment of Qiandongnan Miao and Dong Autonomous Prefecture. Acta Ecol. Sin. 2021, 41, 5557–5569. [Google Scholar]
- Xu, Z.Y. Spatial—Temporal dynamics of ecosystem health in Sichuan Province based on PSR model. Remote Sens. Land Resour. 2020, 32, 251–258. [Google Scholar]
- Yang, W.; Zhang, Z.; Sun, T.; Liu, H.; Shao, D. Marine ecological and environmental health assessment using the pressure-state-response framework at different spatial scales, China. Ecol. Indic. 2021, 121, 106965. [Google Scholar] [CrossRef]
- Corvalan, C.; Briggs, D.; Zielhuis, G.D. Decision-Making in Environment Health; E&FNSPON: London, UK, 2000; pp. 58–75. [Google Scholar]
- Lu, W.; Xu, C.; Wu, J.; Cheng, S. Ecological effect assessment based on the DPSIR model of a polluted urban river during restoration: A case study of the Nanfei River, China. Ecol. Indic. 2019, 96, 146–152. [Google Scholar] [CrossRef]
- Liu, Y.; Yang, C.; Tan, S.; Zhou, H.; Zeng, W. An approach to assess spatio-temporal heterogeneity of rural ecosystem health: A case study in Chongqing mountainous area, China. Ecol. Indic. 2022, 136, 108644. [Google Scholar] [CrossRef]
- Spiegel, J.M.; Bonet, M.; Yassi, A.; Molina, E.; Concepcion, M.; Mast, P. Developing Ecosystem Health Indicators in Centro Habana: A Community-based Approach. Ecosyst. Health 2001, 7, 15–26. [Google Scholar] [CrossRef]
- Zhao, R.; Shao, C.; He, R. Spatiotemporal Evolution of Ecosystem Health of China’s Provinces based on SDGs. Int. J. Environ. Res. Public Health 2021, 18, 10569. [Google Scholar] [CrossRef]
- Zhang, Y.; Yang, Z.; Li, W. Analyses of urban ecosystem based on information entropy. Ecol. Model. 2006, 197, 1–12. [Google Scholar] [CrossRef]
- Zhu, L.; Wang, T.L.; Xia, D. The identification of county-level rural territorial function types and research on rural revitalization path in Sichuan province. Trop. Geogr. 2021, 41, 870–880. [Google Scholar] [CrossRef]
- Wang, D.; Yang, T.; Li, Y.; Deng, F.; Dong, S.; Li, W.; He, Y.; Zhang, J.; Zou, L. Light Intensity-A Key Factor Affecting Flavonoid Content and Expression of Key Enzyme Genes of Flavonoid Synthesis in Tartary Buckwheat. Plants 2022, 11, 2165. [Google Scholar] [CrossRef]
- Holly, V.; David, H.; Nigel, M. Congruence between global crop wild relative hotspots and biodiversity hotspots. Biol. Conserv. 2022, 265, 109432. [Google Scholar]
- Rapport, D.J. Ecosystem health: Exploring the territory. Ecosyst. Health 1995, 1, 5–13. [Google Scholar]
- Rapport, D.J.; Costanza, R.; Mcmichar, A.J. Assessing ecosystem health. Trends Ecol. Evol. 1998, 13, 397–402. [Google Scholar] [CrossRef]
- Hancock, T. Urban Ecosystem and a Human Health: A paper prepared for the Seminar on CIID-IDRC and urban development in Latin America, Montevideo, Uruguay. Ecol. Model. 2000, 4, 143–150. [Google Scholar]
- Farber, S.C.; Costanza, R.; Wilson, M.A. Economic and ecological concepts for valuing ecosystem services. Ecol. Econ. 2002, 41, 375–392. [Google Scholar] [CrossRef]
- United Nations. SDG Indicators: Global Indicator Framework for the Sustainable Development Goals and Targets of the 2030 Agenda for Sustainable Development; United Nations: New York, NY, USA, 2015; pp. 34–45. [Google Scholar]
- Qiao, C.; Wang, Y.; Li, C.; Yan, B. Application of Extension Theory Based on Improved Entropy Weight Method to Rock Slope Analysis in Cold Regions. Geotech. Geol. Eng. 2021, 39, 4315–4327. [Google Scholar] [CrossRef]
- Yi, X.; Jue, W.; Huan, H. Does economic development bring more livability? Evidence from Jiangsu Province, China. J. Clean. Prod. 2021, 293, 126187. [Google Scholar] [CrossRef]
- Ye, Y.; Qiu, H. Environmental and social benefits, and their coupling coordination in urban wetland parks. Urban For. Urban Green. 2021, 60, 127043. [Google Scholar] [CrossRef]
- Gao, J.L.; Shao, C.F.; Chen, S.H.; Wei, Z.Z. Evaluation of sustainable development of tourism cities based on SDGs and tourism competitiveness index: Analysis of 221 prefecture-level cities in China. Sustainability 2021, 13, 12338. [Google Scholar] [CrossRef]
- Feng, Y.; Chen, X.; Gao, F.; Liu, Y. Impacts of changing scale on Getis-Ord Gi* hotspots of CPUE: A case study of the neon flying squid (Ommastrephes bartramii) in the northwest Pacific ocean. Acta Oceanol. Sin. 2018, 37, 67–76. [Google Scholar] [CrossRef]
- Namayande, M.S.; Nejadkoorki, F.; Namayande, S.M.; Dehghan, H. Spatial hotspot analysis of acute myocardial infarction events in an urban population: A correlation study of health problems and industrial installation. Iran. J. Public Health 2016, 45, 94–101. [Google Scholar] [PubMed]
- Wang, Z.; Yang, Y.; Wang, Y.J.; Yang, R.L. Analysis of the Pattern of cold Hot spots in Urban space Expansion based on the least-resistance Model-a case study of Suzhou-Xichang Region. Econ. Geogr. 2016, 36, 57–64. [Google Scholar]
- Zhao, A.Z.; Wang, D.L.; Wang, J.J.; Hu, X.F. Coupling Coordination Degree and Obstacle Factor Diagnosis of Urbanization Tourism Ecological Environment in Beijing Tianjin Hebei Urban Agglomeration. Soil Water Conserv. Res. 2021, 28, 333–341. [Google Scholar]
- Serrano-Gómez, V.; García-García, Ó.; Pinasa, V.G.I.; Fernández-Liporace, M.; Hernández-Mendo, A.; Rial-Boubeta, A. Measuring Perceived Service Quality and Its Impact on Golf Courses Performance According to Types of Facilities and User Profile. Sustainability 2020, 12, 5746. [Google Scholar] [CrossRef]

| Criterion Layer | Category Layer | Indicator Layer | Indicator Attributes | Corresponding SDG Goals | Weight |
|---|---|---|---|---|---|
| Vitality (V) | Ecological vitality (V1) | Biological richness index (V11) | Positive | SDG15 | 0.031 |
| Vegetation coverage index (V12) | Positive | SDG15 | 0.025 | ||
| Water network denseness index (V13) | Positive | SDG15 | 0.025 | ||
| Land stress index (V14) | Positive | SDG15 | 0.025 | ||
| Pollution load index (V15) | Positive | SDG15 | 0.019 | ||
| Economic vitality (V2) | GDP per capita (V21) | Positive | SDG8 | 0.031 | |
| Growth rate of GDP per capita (V22) | Positive | SDG8 | 0.031 | ||
| Growth rate of GDP (V23) | Positive | SDG8 | 0.032 | ||
| The growth rate of fixed asset investment in the whole society (V24) | Positive | SDG8 | 0.031 | ||
| Organizational structure (O) | Natural structure (O1) | Per capita green area of parks (O11) | Positive | SDG15 | 0.041 |
| Green coverage in built-up areas (O12) | Positive | SDG15 | 0.042 | ||
| Economic structure (O2) | The share of secondary industry in GDP (O21) | Positive | SDG9 | 0.041 | |
| The share of tertiary industry in GDP (O22) | Positive | SDG9, SDG8 | 0.042 | ||
| Social structure (O3) | Population density (O31) | Negative | SDG11 | 0.028 | |
| Urban–rural income ratio (O32) | Negative | SDG10 | 0.028 | ||
| Urbanization rate (O33) | Positive | SDG11 | 0.027 | ||
| Resilience (R) | Environmental resilience (R1) | Sewage treatment rate (R11) | Positive | SDG6 | 0.042 |
| Domestic waste disposal rate (R12) | Positive | sdg12 | 0.042 | ||
| Park green space service radius coverage (R13) | Positive | SDG11 | 0.042 | ||
| Economic resilience (R2) | Growth rate of industrial added value above designated size (R21) | Positive | SDG9 | 0.061 | |
| The rate of change in the proportion of tertiary production (R22) | Positive | SDG9 | 0.063 | ||
| Service function (S) | Environmental quality (S1) | Intensity of fertilizer use (S11) | Negative | SDG12 | 0.017 |
| Concentration of PM2.5 (S12) | Negative | SDG11 | 0.016 | ||
| Percentage of days with good air quality (S13) | Positive | SDG11 | 0.017 | ||
| Proportion of monitoring sections with good water quality (S21) | Positive | SDG6 | 0.017 | ||
| Average concentration of O3 (S22) | Negative | SDG11 | 0.017 | ||
| Living quality (S2) | Urban per capita disposable income (S23) | Positive | SDG8 | 0.027 | |
| Rural per capita disposable income (S24) | Positive | SDG8 | 0.028 | ||
| Living convenience (S3) | Road area rate in built-up area (S31) | Positive | SDG11 | 0.021 | |
| Gas penetration rate (S32) | Positive | SDG7 | 0.021 | ||
| Water penetration rate (S33) | Positive | SDG6 | 0.021 | ||
| Public water supply penetration rate (S34) | Positive | SDG6 | 0.021 |
| Project | Moran’s I | Z-Value | p-Value |
|---|---|---|---|
| Vitality (V) | 0.59 | 12.88 | 0 |
| Organizational structure (O) | 0.60 | 13.20 | 0 |
| Resilience (R) | 0.56 | 12.23 | 0 |
| Service function (S) | 0.46 | 10.24 | 0 |
| Ecosystem health (E) | 0.52 | 11.48 | 0 |
Publisher’s Note: MDPI stays neutral with regard to jurisdictional claims in published maps and institutional affiliations. |
© 2022 by the authors. Licensee MDPI, Basel, Switzerland. This article is an open access article distributed under the terms and conditions of the Creative Commons Attribution (CC BY) license (https://creativecommons.org/licenses/by/4.0/).
Share and Cite
He, R.; Huang, X.; Ye, X.; Pan, Z.; Wang, H.; Luo, B.; Liu, D.; Hu, X. County Ecosystem Health Assessment Based on the VORS Model: A Case Study of 183 Counties in Sichuan Province, China. Sustainability 2022, 14, 11565. https://doi.org/10.3390/su141811565
He R, Huang X, Ye X, Pan Z, Wang H, Luo B, Liu D, Hu X. County Ecosystem Health Assessment Based on the VORS Model: A Case Study of 183 Counties in Sichuan Province, China. Sustainability. 2022; 14(18):11565. https://doi.org/10.3390/su141811565
Chicago/Turabian StyleHe, Rong, Xintong Huang, Xiaoying Ye, Zhe Pan, Heng Wang, Bin Luo, Dongmei Liu, and Xinxin Hu. 2022. "County Ecosystem Health Assessment Based on the VORS Model: A Case Study of 183 Counties in Sichuan Province, China" Sustainability 14, no. 18: 11565. https://doi.org/10.3390/su141811565
APA StyleHe, R., Huang, X., Ye, X., Pan, Z., Wang, H., Luo, B., Liu, D., & Hu, X. (2022). County Ecosystem Health Assessment Based on the VORS Model: A Case Study of 183 Counties in Sichuan Province, China. Sustainability, 14(18), 11565. https://doi.org/10.3390/su141811565