Article

Evolution of the Relationship between Runoff and Sediment Transport during Flood Event in the Chabagou Watershed of the Loess Plateau

State Key Laboratory of Eco-Hydraulics in Northwest Arid Region of China, Xi’an University of Technology, Xi’an 710048, China
*
Author to whom correspondence should be addressed.
Sustainability 2022, 14(18), 11573; https://doi.org/10.3390/su141811573
Submission received: 14 August 2022 / Revised: 9 September 2022 / Accepted: 13 September 2022 / Published: 15 September 2022

Abstract

:
Research on flood events is one of the most important parts to study runoff and sediment transport in the typical watershed on the Loess Plateau. Based on 101 floods in Period I (PD-I, 1970 to 1990) and Period II (PD-II, 2006 to 2018), and combined with rainfall data, the study indicated the evolution of runoff and sediment transport characteristics during flood events in the Chabagou watershed, and reveal its influencing factors in both periods. Results showed: (1) Sediment yield (SY) increased linearly with runoff amount (RA), and the increasing rate of SY in PD-II was around 20% of PD-I, the relationship between peak flow (PF) and sediment concentration (SC) was the power function, and the SC in PD-II was lower than that in PD-I under the same PF. (2) SY was more sensitive to P (precipitation) of the flood event than rainfall intensity (RI), and the sensitivity of RA and SY to P in PD-II was greater than that in PD-I. The sediment delivery modulus (SDM) with rainfall erosivity (RE) was also linear, and the increasing rate of SDM in PD-II was 27% of PD-I. (3) The better improvement of the underlying surface not only raised the threshold of RA and corresponded with peak SC, but also shortened the duration of high sediment concentration and lowered the sediment transportation capacity by contrasting the flood processes.

1. Introduction

Climate change and human activities have played insidious effects on rainstorm and flood events around the world [1,2]. Because of frequent rainstorm and flood events, soil and water loss has become more serious in the middle reaches of the Yellow River, with landslides and debris flows [3,4]. Therefore, understanding the relationship between runoff and sediment in typical watershed and its change trend has great significance to control soil and water loss on the Loess Plateau [5,6]. As is known to all, the underlying surface of the Loess Plateau has drastically changed over the last few decades [7,8], which resulted in ongoing changes in runoff and sediment in the Yellow River [9]. This has had a substantial impact not only on runoff and sediment transport but also on the Yellow River Basin’s ecological security and the socio-economic long-term development [10,11]. Therefore, several studies have been performed on the law of runoff and sediment yield in the Yellow River Basin under the continuously changing environment [12,13]. Moreover, such research mainly gives focus to the effects of annual runoff and sediment change on human activities and climate change [14,15]. However, in the Loess Plateau, soil erosion is mainly triggered by rainstorms [16,17]. Moreover, the annual scale research can weaken or hide the responses of a variety of magnitude floods to soil and water conservation measures in the watershed.
In general, rainstorms are frequently followed by flood, and both of them are always present with good consistency [18]. Furthermore, rainstorms can affect runoff and sediment transportation [19], as well as their interactions [20]. However, early flood research was primarily focused on the characteristics of water and sediment process. The ecological engineering construction on the Loess Plateau, like vegetation and check dam, significantly changed the underlying surface condition and flood process, which were given less consideration by the academic community [21,22].
Gu et al. [23] investigated two flood events in the Yanhe River Basin in 1977 and 2013. He found that the flood event in 2013 had a changing pattern of slow rise and slow fall, and that the runoff amount and sediment yield all reduced considerably when compared with the flood event in 1977. And he believed that the fundamental cause for the shift in runoff and sediment in the flooding process was the restoration of vegetation in the basin. The flood event “7.26” in 2017 that occurred in Wuding River Basin has a similar situation with the Yanhe River (On 26 July 2017, a severe rainstorm and flood the maximum daily precipitation reached 256.8 mm, and the rainfall lasted for more than 24 h. The maximum peak flow of Wuding River outlet station was 4500 m3 s−1). Soil and water conservation measures can limit peak flow [24]. The findings of Mo et al. [25] in the Chabagou watershed revealed that changes in underlying surface conditions, particularly for check dam construction, have several effects on flood processes of various magnitudes, with the main effects being a reduction in peak flow of large and medium floods, and a flattening of the flood curve for small floods. Based on 98 flood events in the Chabagou watershed, Yu et al. [26] assessed the runoff and sediment transport procedures, and concluded that the regulation function of conservation measures, such as check dams, was powerful in the early stage of their lifespan, but gradually reduced after long-term use, and eventually altered the entire runoff and sediment transportation rules. Furthermore, changes in underlying surface conditions can alter erosion dynamics in a watershed, which is mostly manifested in the influence on runoff erosion power [27,28]. On the other hand, studies regarding the relationships between runoff and sediment that are driven by runoff erosion dynamics of flood events need to be enhanced.
Based on 101 flood events and corresponding precipitation, runoff, and sediment data, the study revealed the characteristics of runoff and sediment in the Chabagou watershed in different periods, then clarified the functions of rainfall, erosion dynamics and underlying surface conditions to sediment transport.

2. Materials and Methods

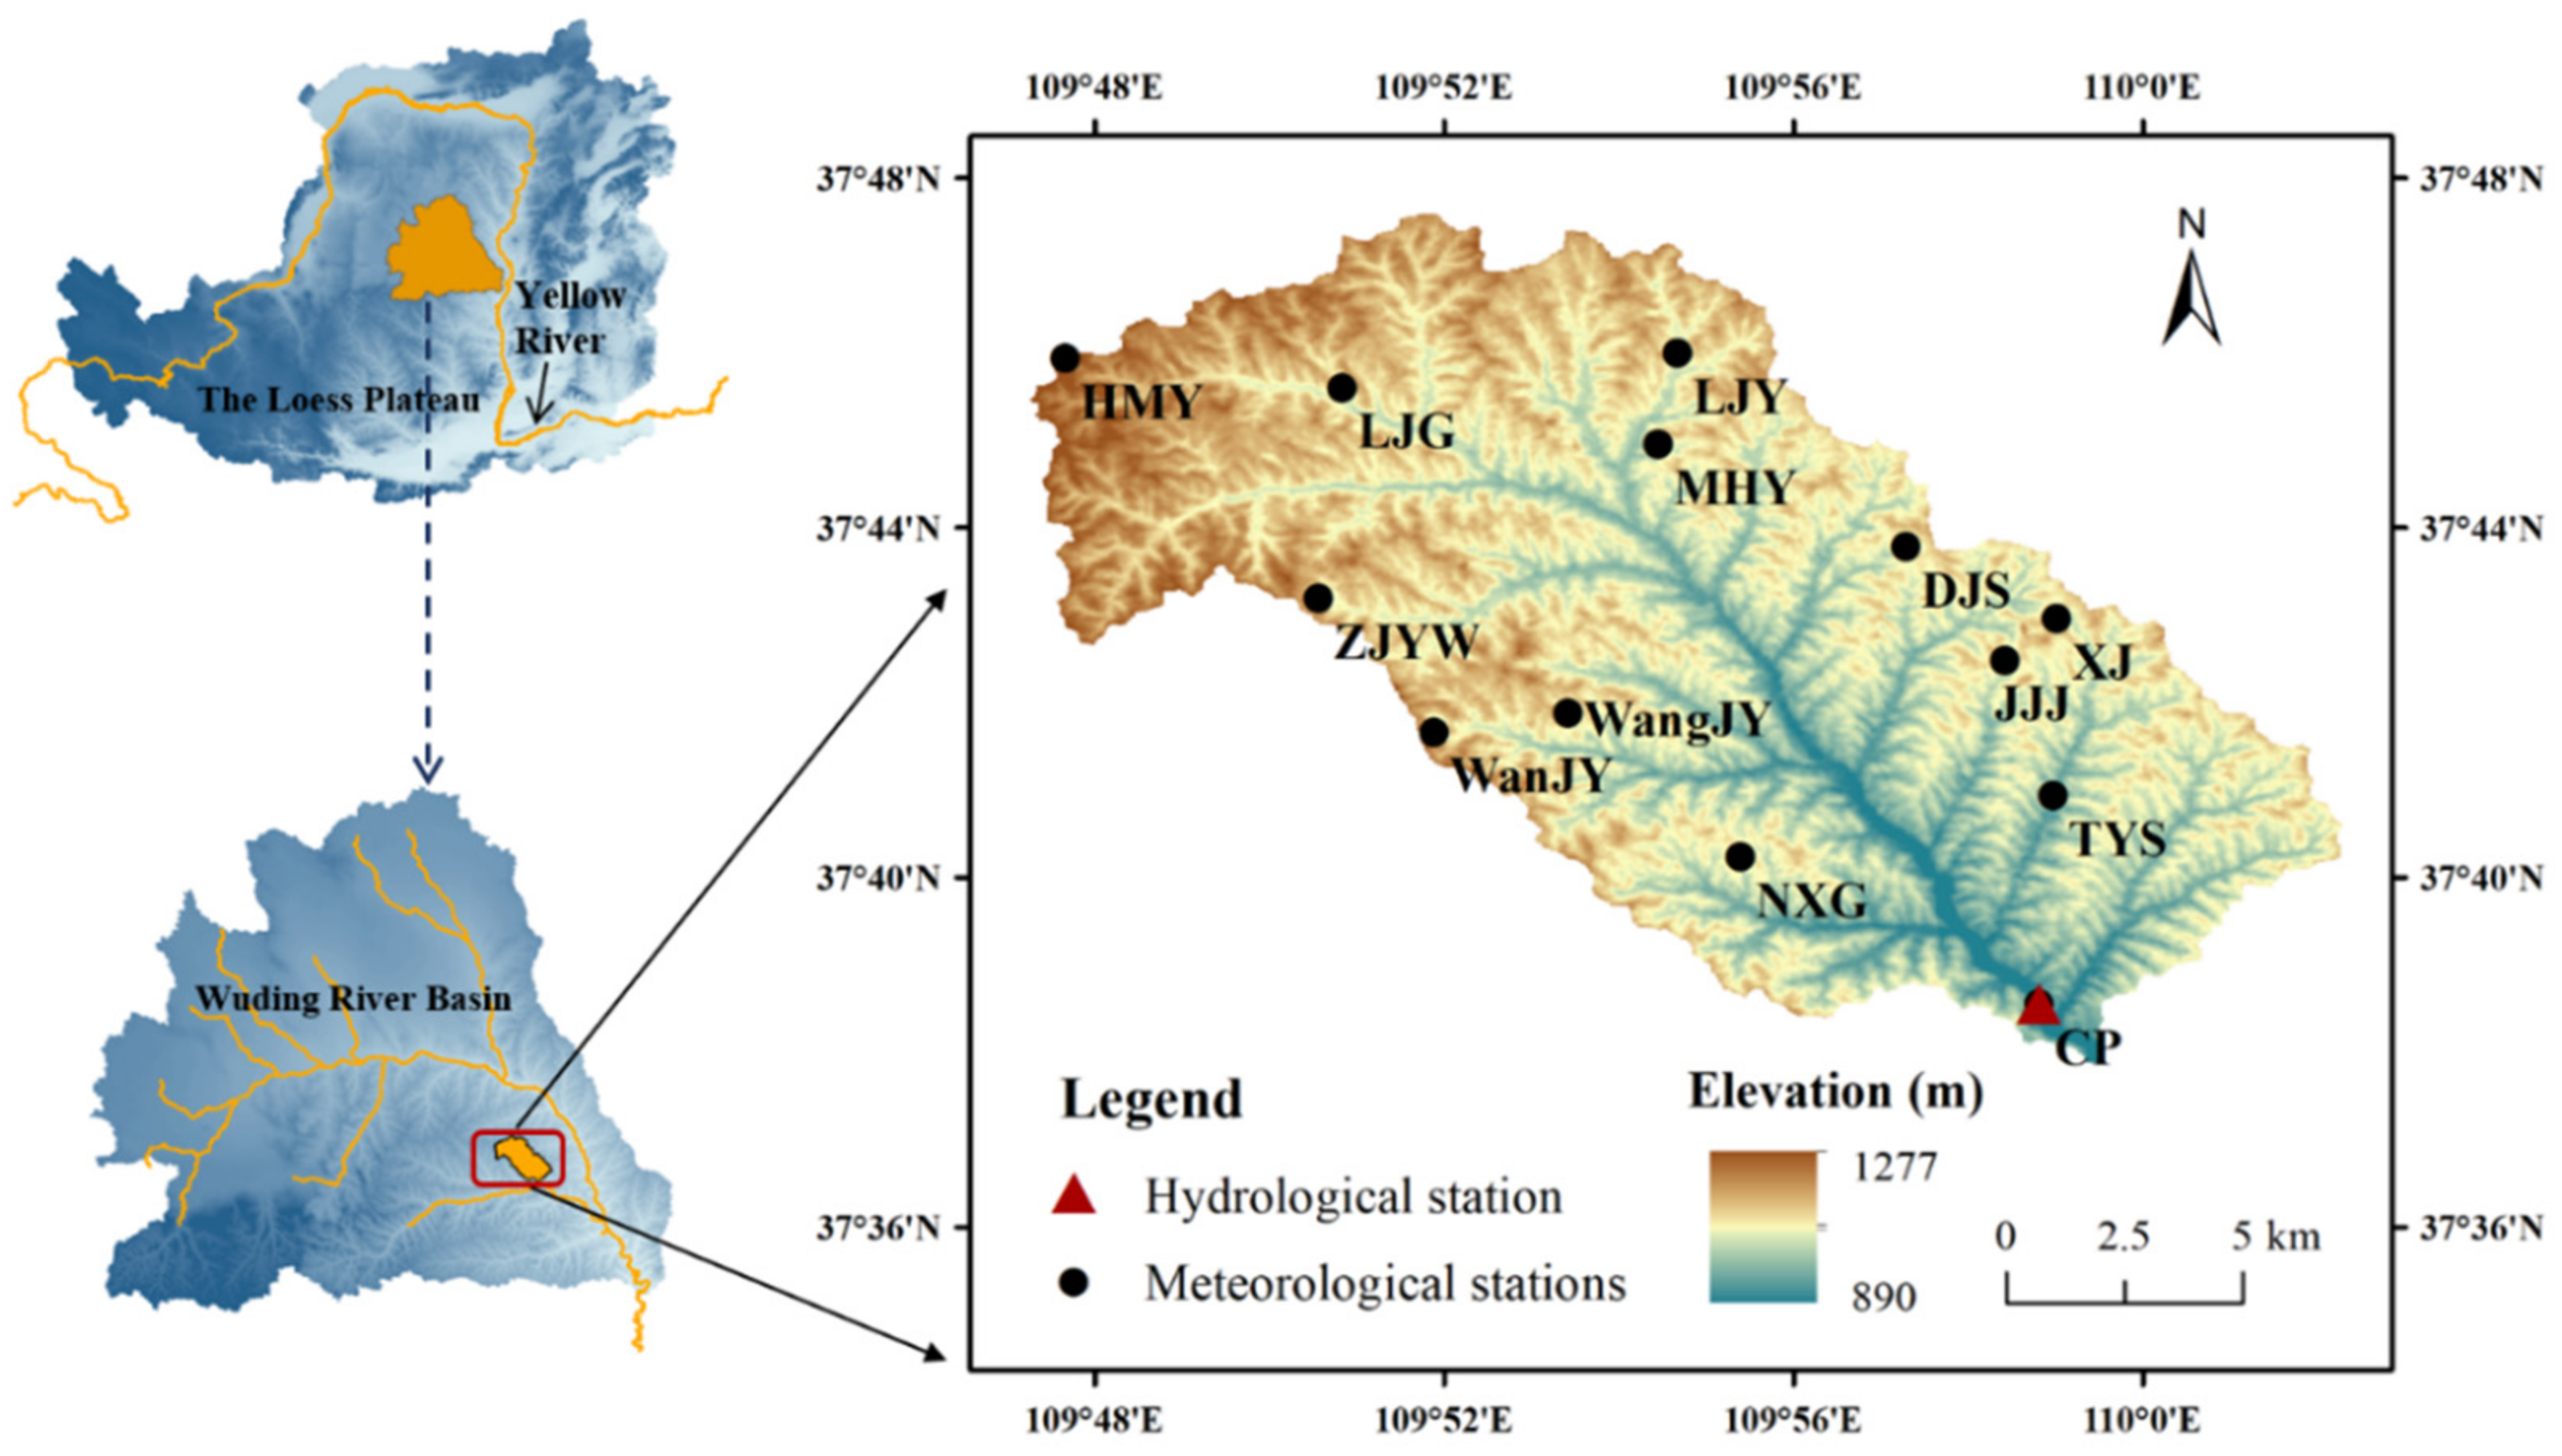
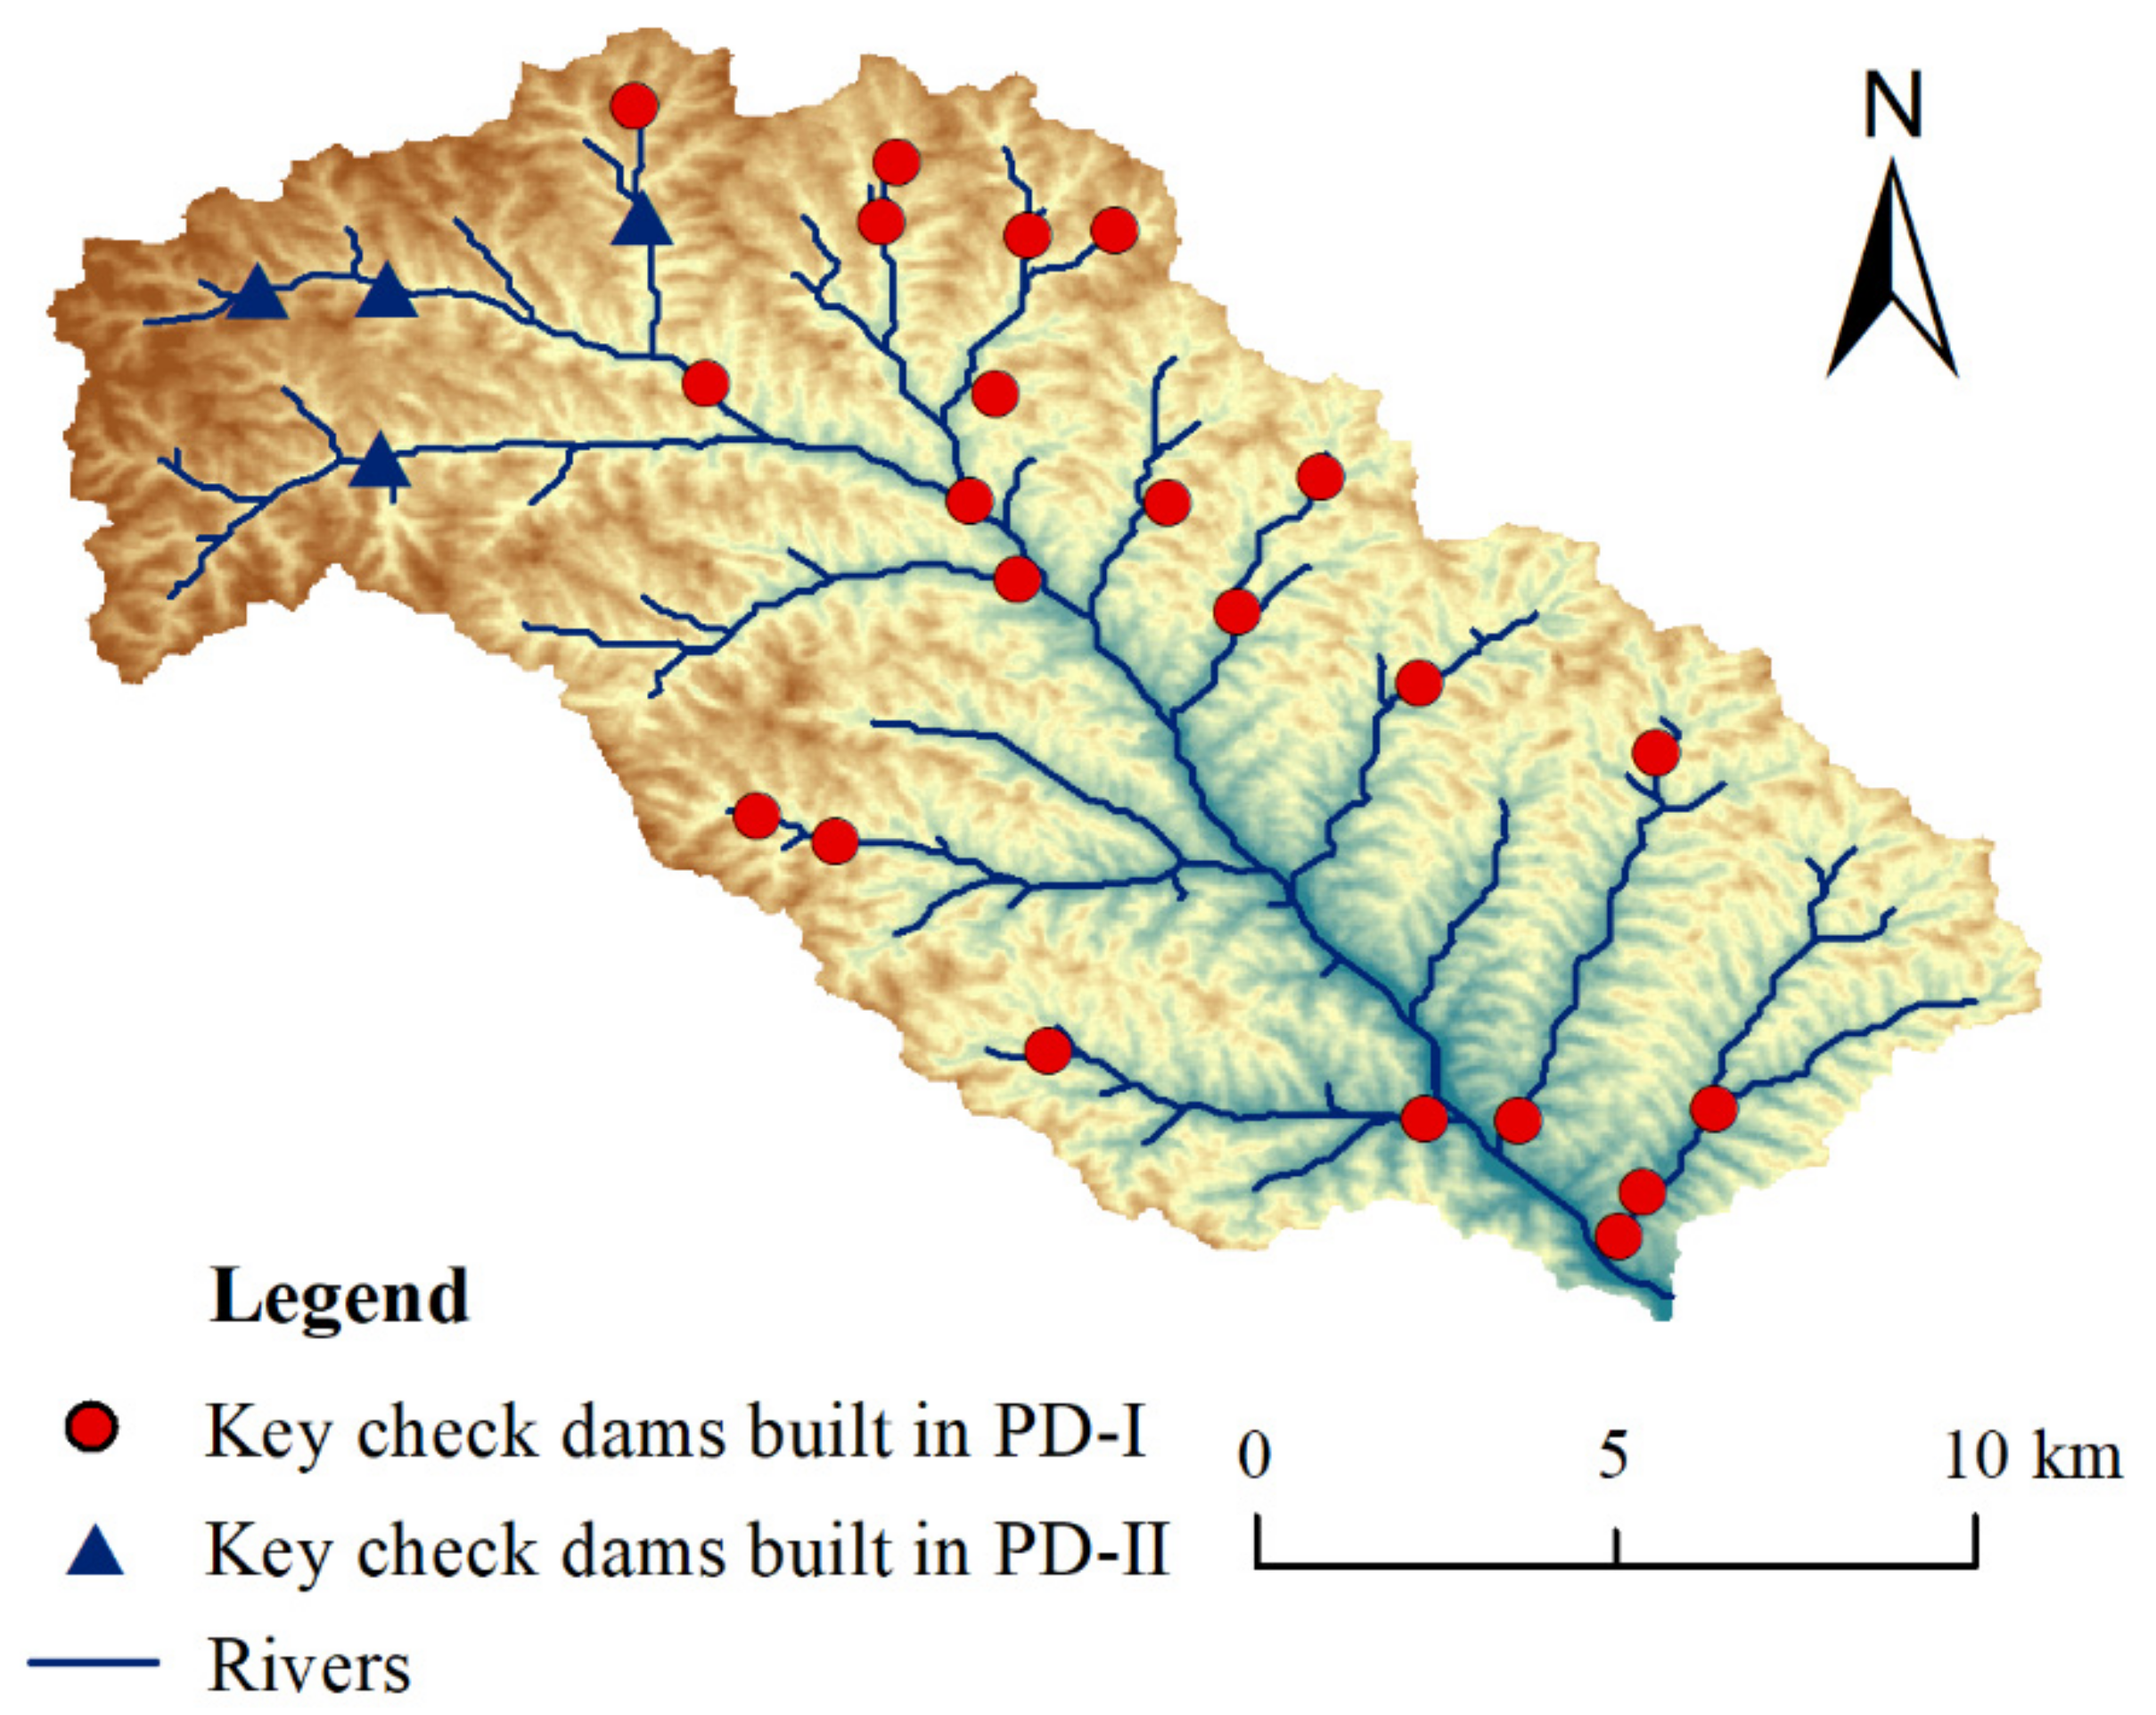
2.1. Site Description

The Chabagou watershed is located in the heart of the Loess Plateau in Northwest China and is a tributary of the Wuding River Basin (Figure 1), the drainage area is 205 km2, and the watershed is a symmetrical shape. The chief gully is 24.1 km long with an average altitude of 1080 m. The watershed’s gully development is quite high, with gully density reaching 1.05 km km−2. As a result, the landform is complicated and fragmented. The climate in the watershed is dry continental with less rainfall. The average annual precipitation is 476.60 mm, with most of it falling between June and September. The soil is made up of loess, has a loose structure, and is quickly eroded. The flood of 1970 was the biggest calamity in the past 60 years, with a maximum peak flow of 640 m3 s−1, and a sediment yield of 2.5 × 10⁶ t. Although the flood No. 100 in 2017 was the worst in recent years, the flood’s highest peak flow was only 339 m3 s−1, with a sediment yield of 1.0 × 10⁶ t.

2.2. Data Sources

The precipitation, runoff, and sediment concentration data of flood events were all obtained from the Yellow River Basin Hydrological Yearbook (two periods: 1970 to 1990 and 2006 to 2018, respectively), and precipitation data, in millimetres, was recorded on every hour. Runoff and sediment concentration data was accorded by Hourly Process Line, units were m3 s−1 and kg m−3, separately. The flood event was selected based on its flood process, which included a complete rising and declining stage with the peak flow of more than 5 m3 s−1. Finally, 101 flood events were chosen out of 34 years and numbered according to their chronological sequence. Since the data have two periods, 101 flood events are also segregated into two periods: Period I (PD-I) and Period II (PD-II). PD-I, contained 79 flood events (No. 1 to No. 79), and the degree of ecological governance was less. The degree of ecological governance was high in PD-II, which included 22 floods (No. 80 to No. 101).

2.3. Methods

2.3.1. Sediment Yield (SY)

SY of flood event can be obtained according to the following formula:
SY = n = 2 n 1 2 q n 1 s n 1 + q n s n t n t n 1   ( n = 2 ,   3 , , m 1 ,   m )
where SY represents the sediment yield of a single flood event, the unit is kg; q and s represent the runoff amount (m3 s−1) and sediment yield (kg m−3) of a single flood event at a certain moment.

2.3.2. Rainfall Erosivity (RE)

In order to determine the RE, a single rainfall event must be selected initially. The Loess Plateau’s rainfall event criteria are that the interval time of the rainfall event is more than 6 h [29]. Then, pick up the character indices as precipitation (P) and rainfall intensity (RI) from chosen erosive rainfall events. Finally, in order to compute the RE of erosive rainfall episodes, the study considered the method provided by Zhang et al. [30].
RE = r = 1 l ( e r Δ V r )
e r = 0.29 1 0.72 exp 0.05 i r
where ir represents the intensity of breakpoint, the unit is mm h−1; er represents unit rainfall kinetic energy, MJ ha−1 mm−1; ΔVr represents the breakpoint precipitation (mm); and l represents the number of breakpoints, no unit.

2.3.3. Runoff Erosion Power (REP)

In order to determine the REP of a flood event, Zhang et al. [31] suggested a formula.
REP = Q m H
where H represents runoff depth, the unit is m; Qm represents peak flow modulus (m3 s−1 km−2); and REP represents the runoff erosion power (m4 s−1 km−2).

2.3.4. Elastic Coefficient

The elastic coefficient approach, which is based on the Budyko hypothesis, has been frequently used in recent years in major basins to quantify the key driving factors of runoff and sediment change [32].
The P elasticity of Q presented in Equation (5) is a variable depending on P and Q.
ε P Q = Δ Q i / Q ¯ Δ P i / P ¯ = ( Q i Q ¯ ) / Q ¯ ( P i P ¯ ) / P ¯
where Qi represents the runoff amount of a flood event, and the unit is m3; Pi represents precipitation of the flood event (mm); Q ¯ represents the average value of runoff amount at some time (m3); P ¯ represents the average precipitation value at some time (mm).

3. Results

3.1. Characteristics of RA and SY in Both Periods

In PD-I, there were a total of 79 flood events, with an average of around 4 events per annum. In PD-II, there were 22 flood events, with an average of 1.7 events per annum. As shown in Table 1, the average value of P in PD-II was 44.6 mm which was 62.2% more than that in PD-I. P went up in PD-II but RI reduced. The average value of RI in PD-II was 5.14 mm h−1 which was −20.9% less than that in PD-I. RA amplified with an increase of P. The average value of RA in PD-II was 86.1% more than that in PD-I. On the other hand, changing trend of SY did not respond to the RA. The average value of SY in PD-II was −48.3% less than that in PD-I.
Compared with PD-I, the greatest value of RA in PD-II was 837.37 × 10⁴ m3, with a change rate of 158.9%, and the greatest value of SY was 101.23 × 10⁴ t, with a change rate of −60.1%. SY did not increase with RA, in fact, it has decreased. In addition, the increase in P was more than the decrease in RI. This meant that, rather than the rainfall energy predicted by RI, soil loss in the watershed was mostly dependent on runoff created by rainstorm. In addition, the purpose of the underlying surface condition that continuously improved was to trap sediment rather than store runoff [33,34].

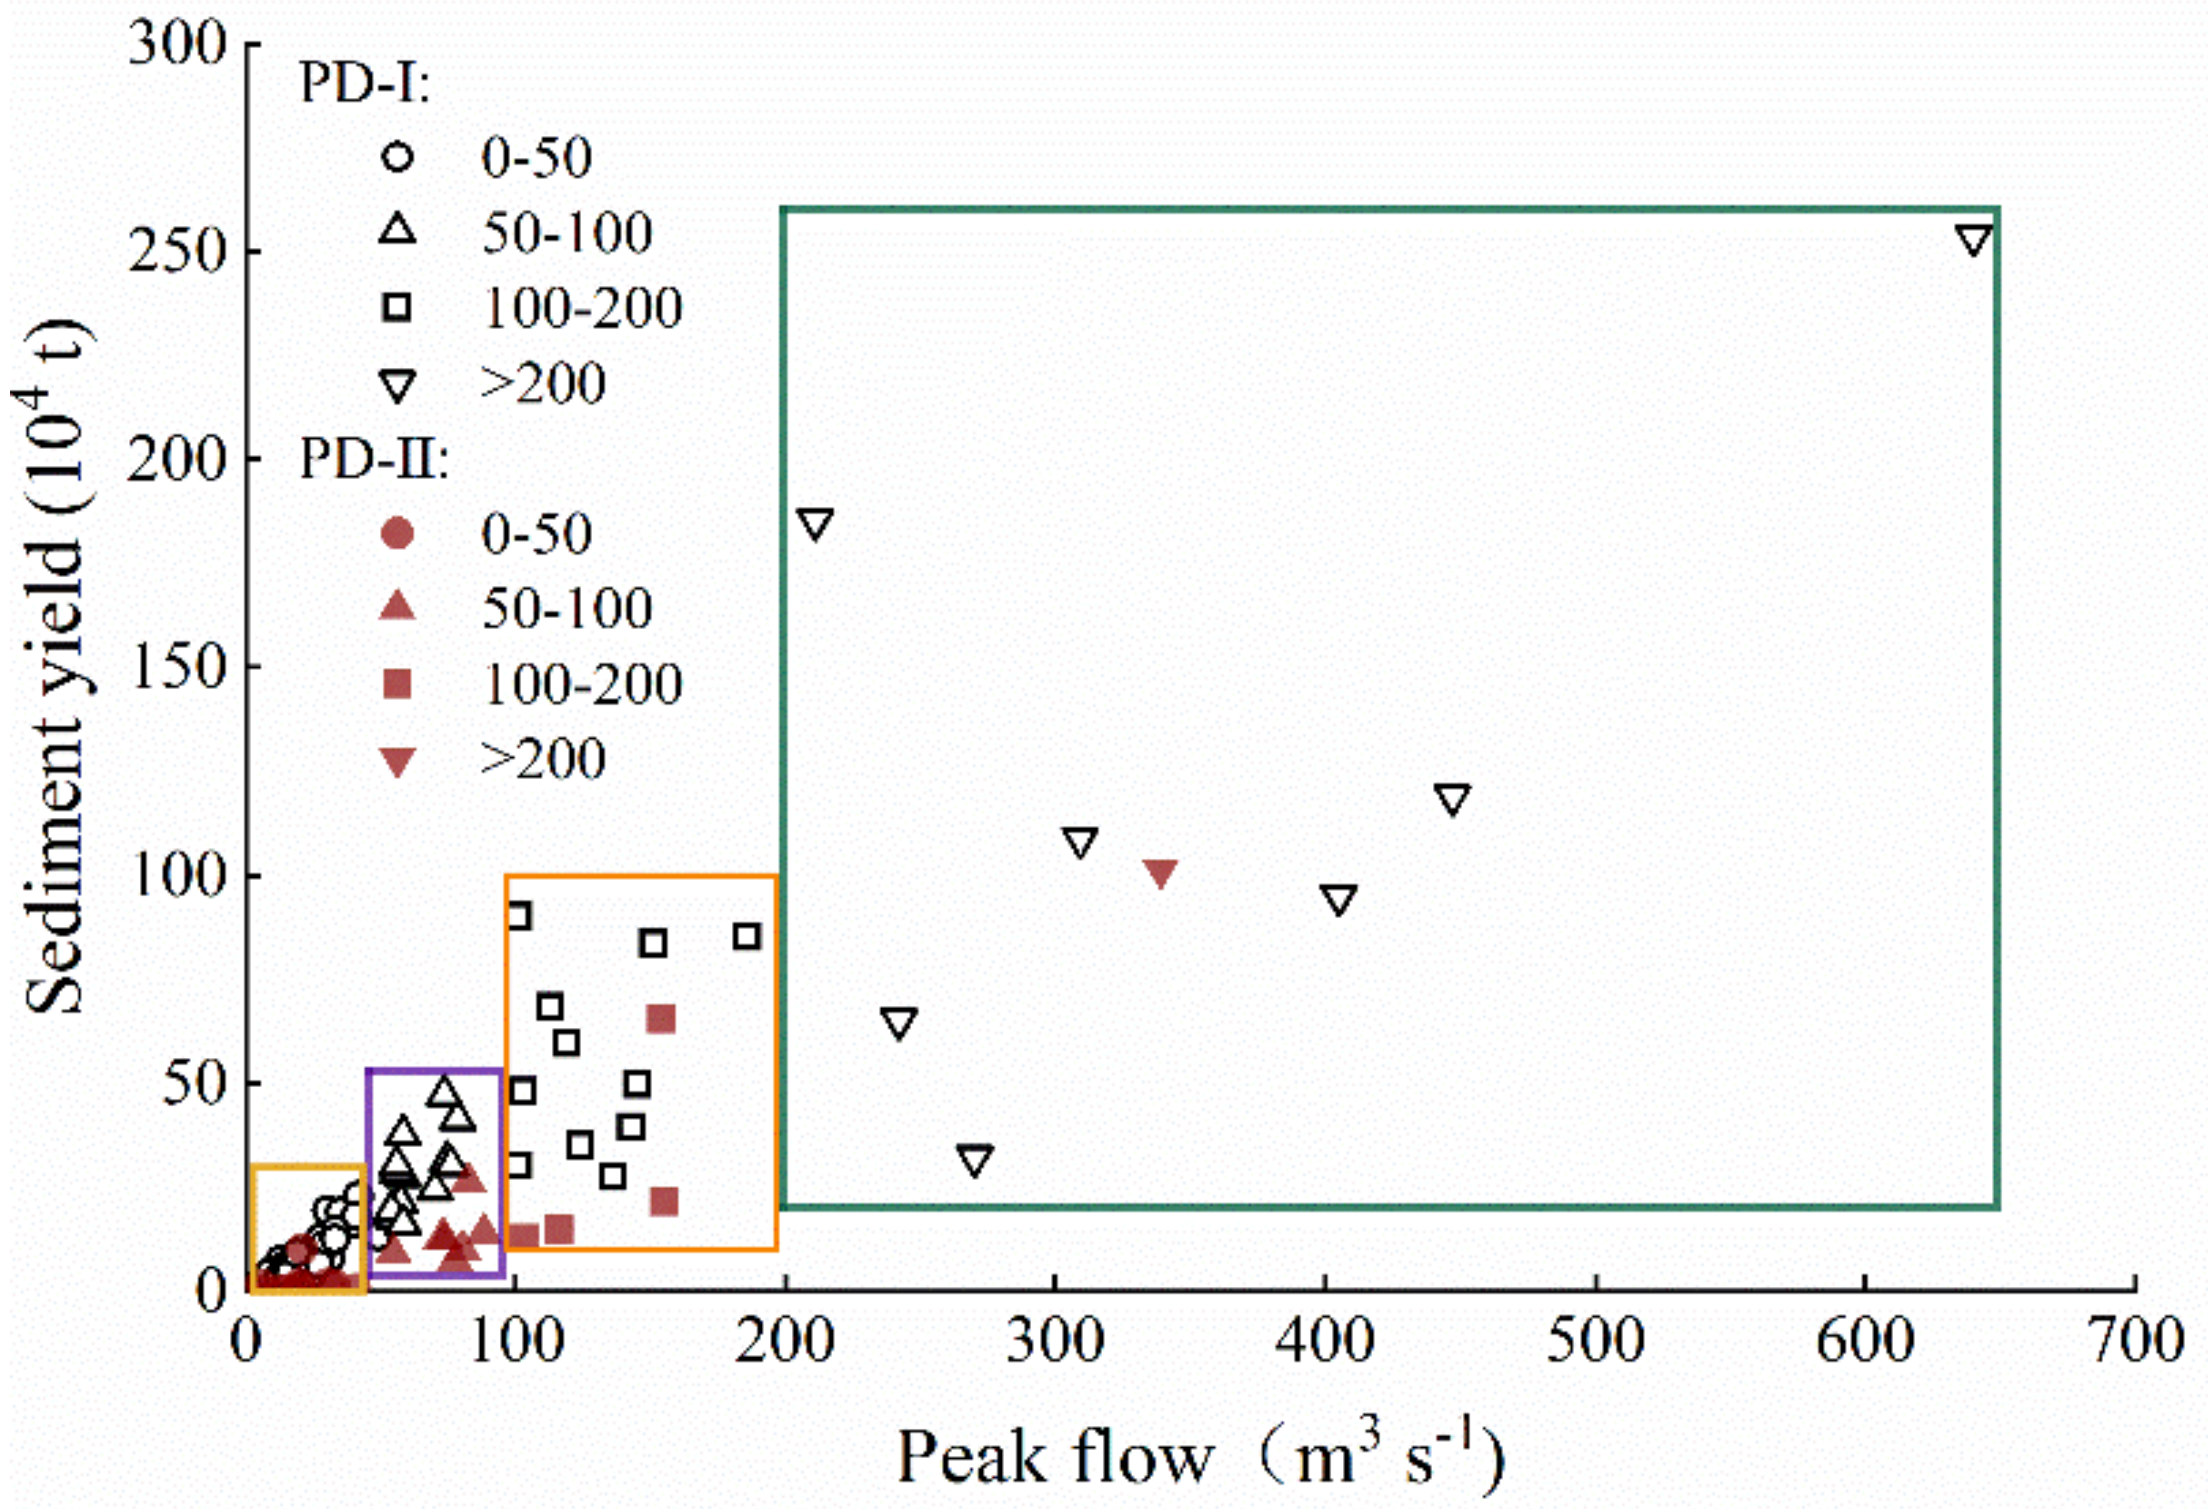
3.2. Characteristics of Peak Flow in Both Periods

The Statistical features of peak flow (PF) were reflected in Table 2. The frequency of flood events reduced as PF rose over both periods, although the fraction of SY and average sediment modulus increased. When PF was less than 50 m3 s−1, the frequency of flood events in both periods was the highest in all four classifications, but the proportion of SY and the average sediment modulus were the lowest. When PF goes up 200 m3 s−1, the frequency of flood events in both periods was the lowest in all four classifications, but the proportion of the average sediment modulus was the largest. The frequency of flood events and the fraction of SY in PD-I were all lower than in PD-II when PF was in two classes of 50 to 100 m3 s−1 and 100 to 200 m3 s−1. In contrast to the four classifications in Table 2, the average sediment modulus of the flood event in PD-I was higher than that in PD-II. It reflects that the erosion ability of the flood event in PD-I was stronger than that in PD-II and created more soil loss under the same peak flow. The increase in PF, on the other hand, and the difference in average sediment modulus between the two periods reduced gradually.
Figure 2 represents the relationships between SY and PF. When PF was from 5 to 50 m3 s−1, the SY in both periods were all lower than 30.00 × 10⁴ t. When PF was between 50 and 100 m3 s−1, the SY in both periods was less than 50 × 104 t, with the maximum value in PD-I being 47.23 × 10⁴ t and the maximum value in PD-II being 26.34 × 10⁴ t. When PF was between 100 and 200 m3 s−1, the SY in both periods were all lower than 100.00 × 10⁴ t, the maximum value in PD-I was 90.10 × 10⁴ t, and the maximum value in PD-II was 65.56 × 10⁴ t. When PF was higher than 200 m3 s−1, only one flood event was found in PD-II. Moreover, the maximum value of PF (640 m3 s−1) in PD-I was 1.89 times higher than that (339 m3 s−1) in PD-II, while SY was 2.5 times less than that in PD-II.
In general, the Chabagou watershed’s changing law of peak flow and sediment output still follows the rules that more runoff generates more sediment and less runoff generates less sediment. In PD-II, the PF and SY were overall less than in PD-I, especially when PF was higher than 200 m3 s−1. This is in line with the findings of Fu et al. [24], who studied the Chabagou watershed.

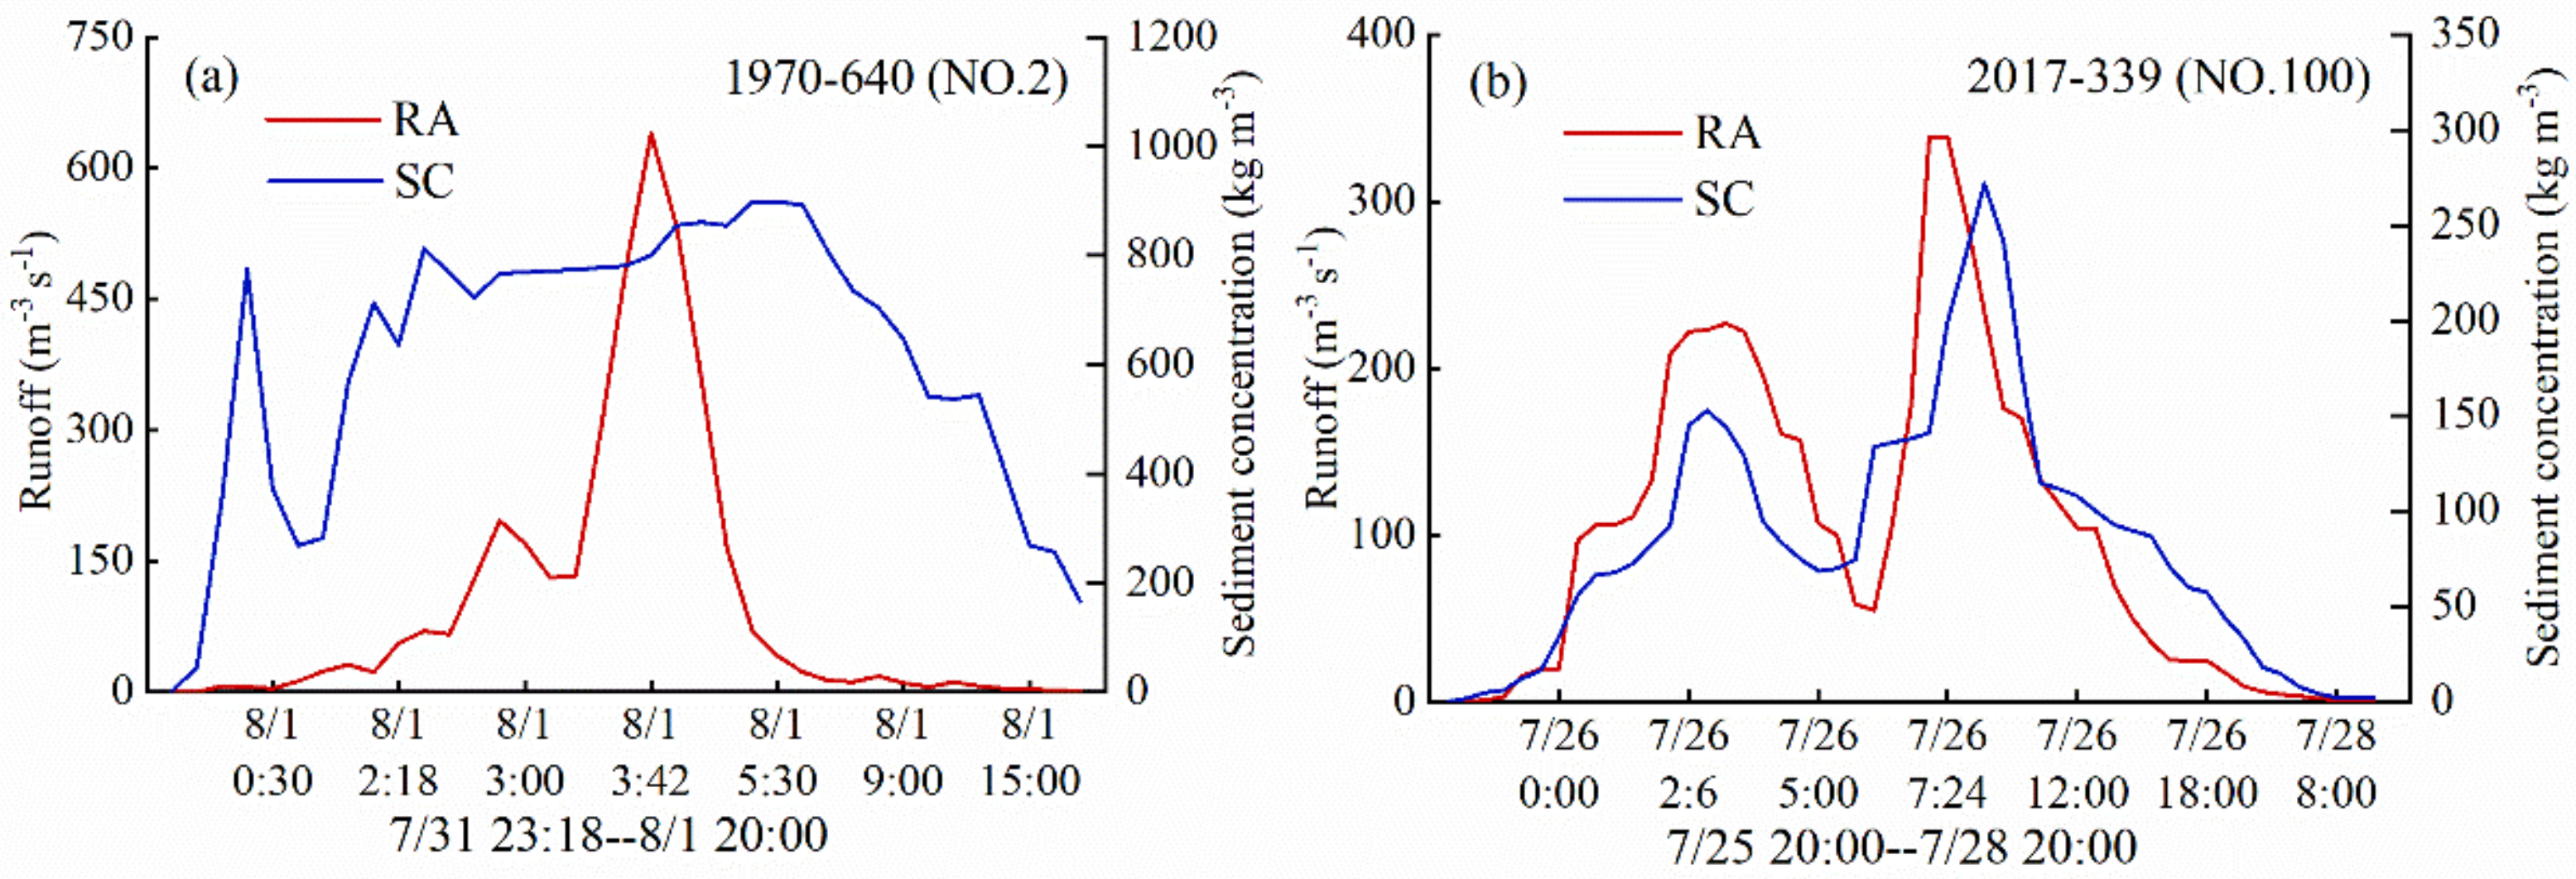
3.3. Relationship between Runoff Process and Sediment Transport in Both Periods

Figure 3 depicted the linear fitting results of RA and SY throughout both periods. It can determine that the relationship between RA and SY has a clear difference in terms of PD-I and PD-II. Although SY in both periods all went up with RA, the increasing rate of SY in PD-II was around 20% of PD-I. For every 10 × 104 m3 increase in RA, the SY in PD-I went up by 6.1 × 10⁴ t, and that in PD-II increased by 1.3 × 10⁴ t. In PD-I, the increasing rate of SY was 4.8 times that in PD-II.
In addition to this, the study fitted the link between PF and sediment concentration (SC) and discovered that the relationship between PF and SC followed the shape of a power function (Figure 4). In PD-I, the PF and SC were all significantly higher than that in PD-II. The SC in PD-I moved up rapidly with PF when it had less than 50 m3 s−1. The growing rate of SC in PD-I gradually slowed down, when the PF was higher than 50 m3 s−1. This is in line with the research outcomes of Zhang et al. [31]: the change of SC was quite stable when at higher PF; the SC changed significantly when at lower PF. On the other hand, the SC in PD-II had no clear turning point and maintained a reasonably stable increasing rate with the increase of PF.
Check dam construction in the Chabagou watershed is founded in the 1970s. However, the Chabagou watershed’s vegetation condition was poor at the time due to frequent agricultural operations. When a rainstorm hit, substantial soil erosion on slope farmland caused a sharp increase in SC, even though the PF was still low, and it quickly achieved saturation. Even if the PF remains raised, the SC will not continue to increase. On the other hand, in PD-II, after ten years of vegetation construction, vegetation coverage of the Chabagou watershed went up significantly. It lowered the sediment carrying capacity of runoff efficiently [35]. As a result, the SC in PD-II was always less than in PD-I, but the increasing rate of SC in PD-II was more than that in PD-I when the PF surpassed 200 m3 s−1 [36,37].

4. Discussion

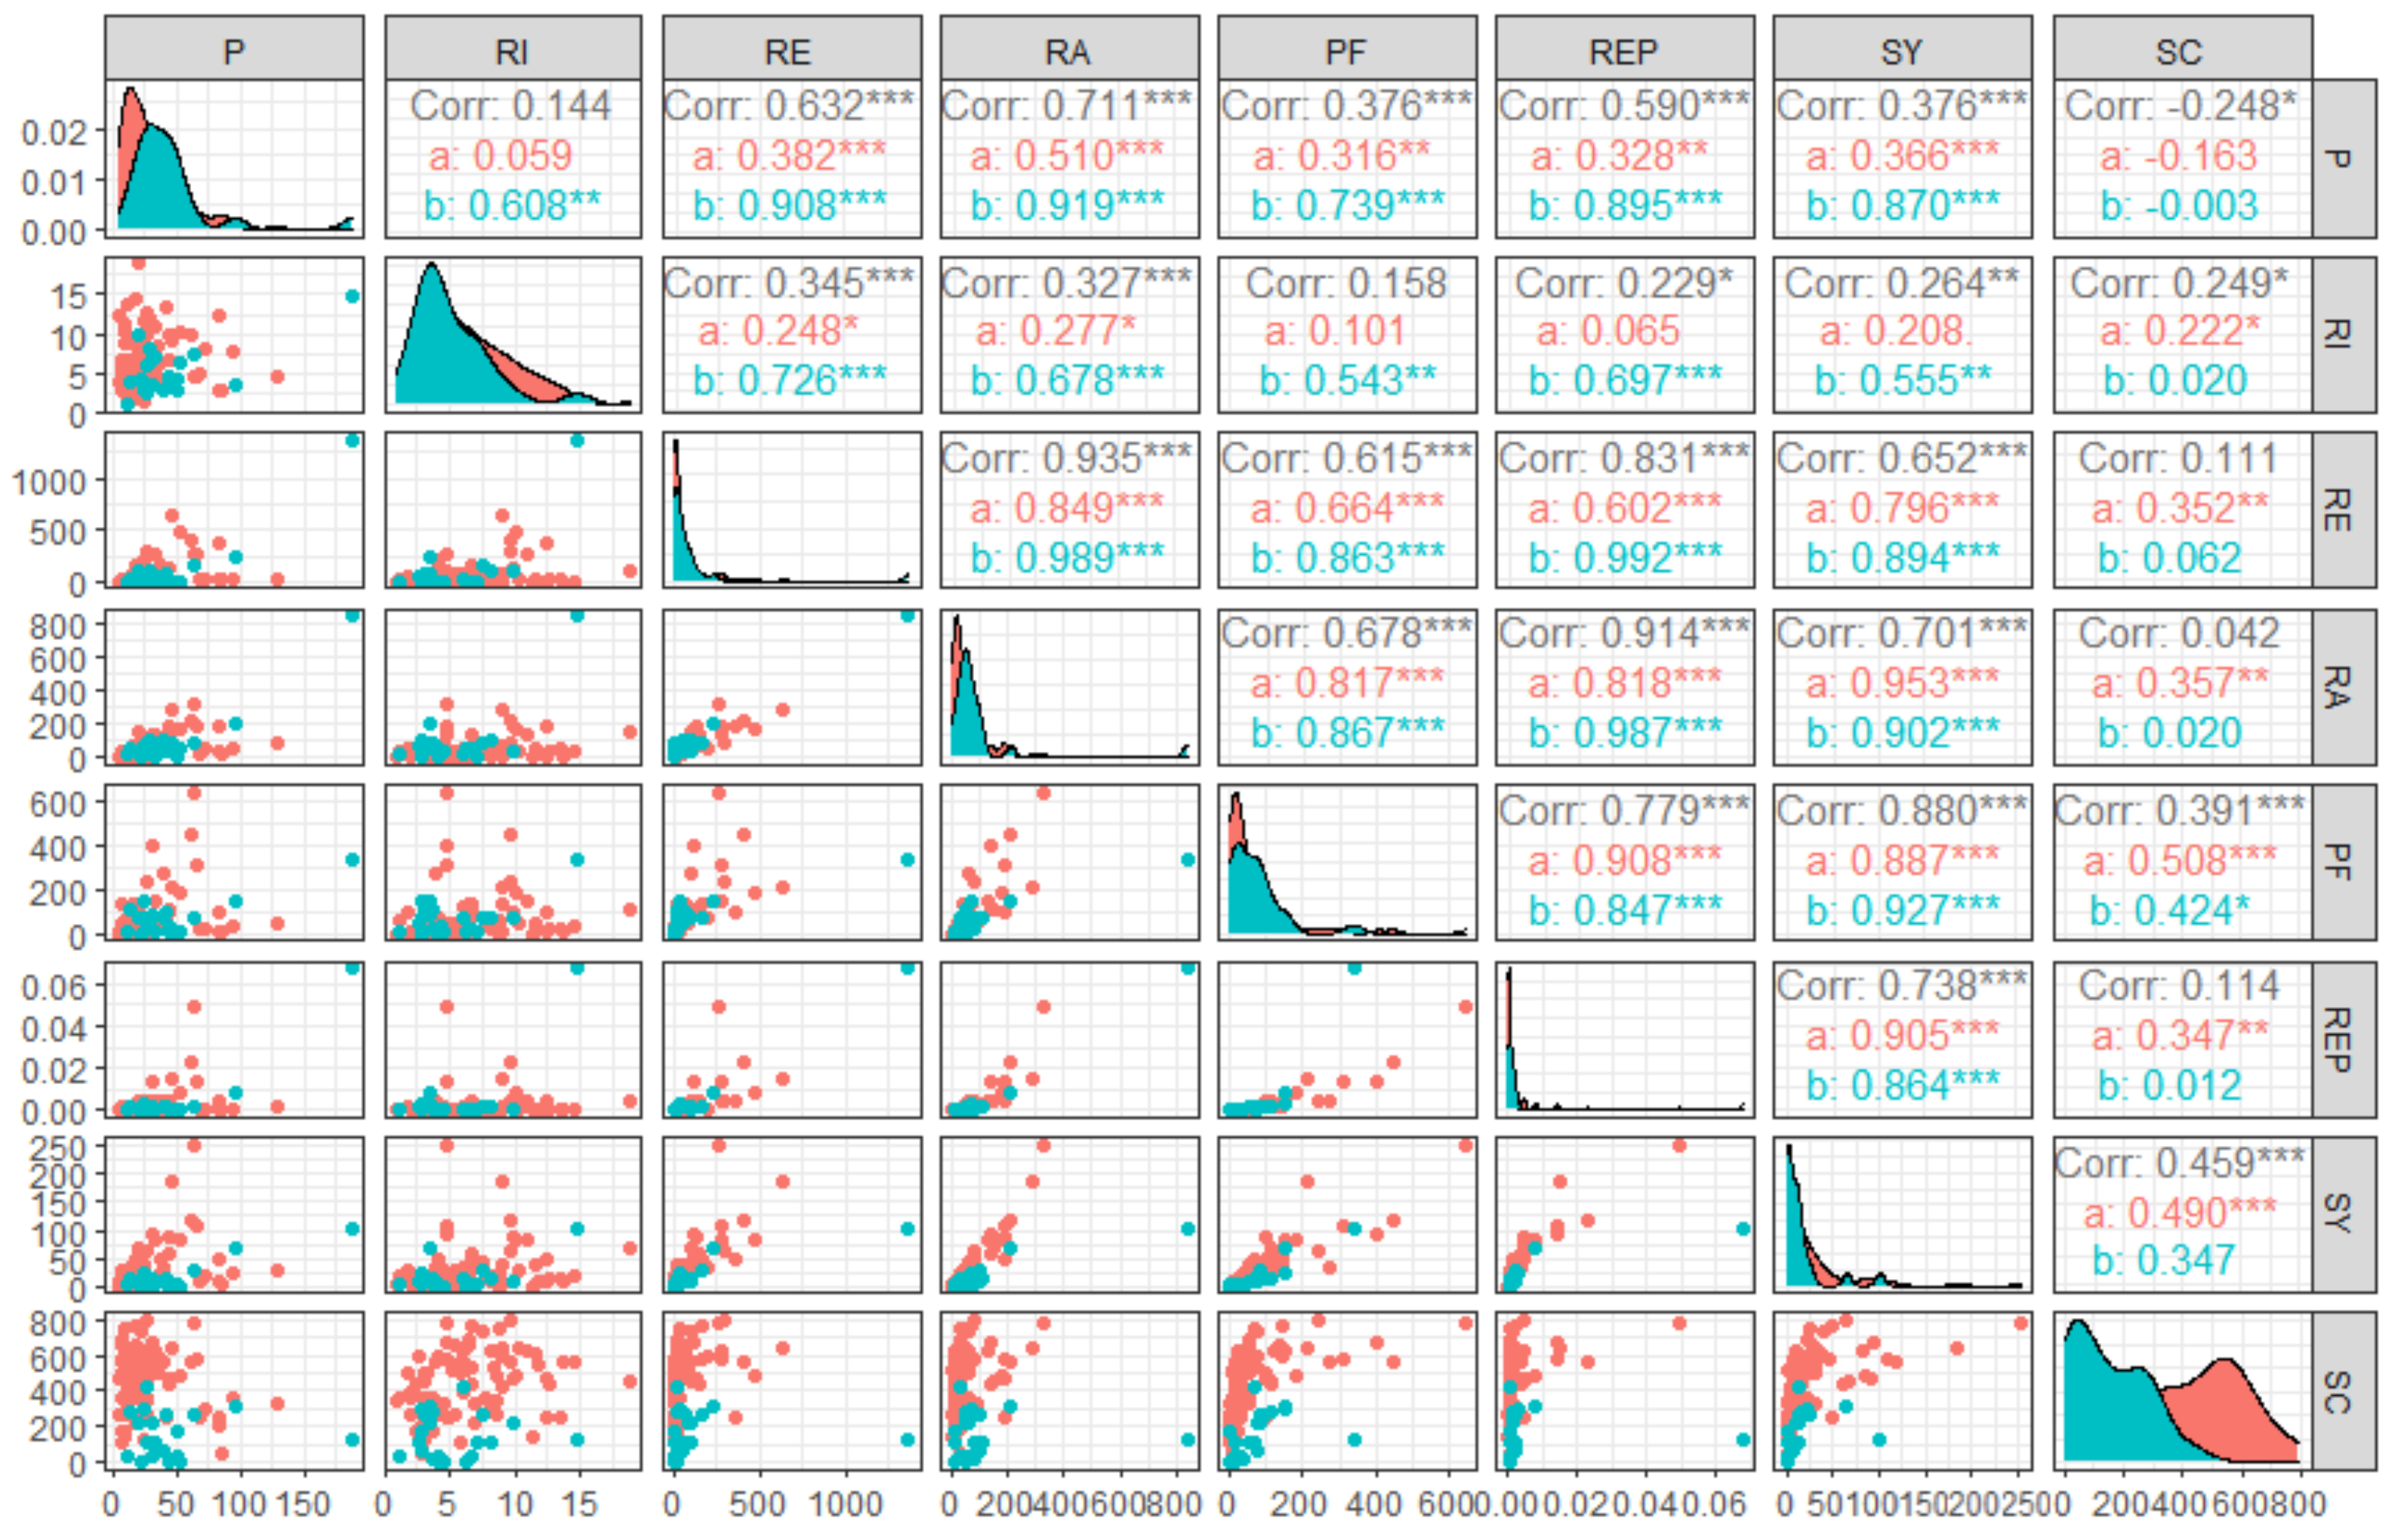
4.1. Influence of Precipitation Related Indices on Hydrological Factors

In recent years, the changing trend in the Yellow River Basin’s water and sediment status, particularly in the middle reaches, has been placed downward [38]. As a result, the change characters of water and sediment and the driving mechanism of the Yellow River have gained the attention of scholars [39]. The correlation analysis represented that SY in both periods has a direct relationship with P and RE at the 0.001 significance level (Figure 5). In PD-I, RI has no association with SY, while in PD-II, the correlation coefficient between SY and RI was 0.555 at the 0.05 significance level. The connections between SY and RI in both periods were not as close as other rainfall-related indicators.
The outcomes from correlational analysis reflected that SY in both periods has a direct relationship with RA, REP, and PF at the 0.001 significance level. The correlation coefficients between SY and RA, PF, and REP in PD-I were 0.953, 0.887, and 0.905, respectively. In PD-II, their correlation coefficients were 0.902, 0.927 and 0.864, respectively. It can be determined that the correlations between SY and RA, PF, and REP in the both periods have achieved a significant level. On the other hand, correlation coefficients between SY and PF in PD-II were more than that in PD-I.
In contrast to SY, correlation coefficients between SC and precipitation and runoff related indices in both periods were all quite low. However, in PD-I, the majority of correlation coefficients between SC and precipitation and runoff related indices were greater than in PD-II. Except for P, all of the correlations between SC and the other indices were significant at or above the 0.05 significance level. In PD-I, this indicates that rainfall and runoff have a greater influence on SC. This is primarily due to the underlying surface condition of that period [40].
In PD-I, the sensitivity of RA to P and RI was 0.71 and 0.61, and the sensitivity of SY to P and RI in PD-I was 0.62 and 0.55, respectively. In PD-II, the sensitivity of RA to P and RI was 1.96 and 2.03, and the sensitivity of SY to P and RI was 1.75 and 1.57, respectively. The sensitivity of RA and SY to P and RI in PD-II was greater than that in PD-I. In addition, the sensitivity of SY to P in both periods was greater than that of RI. Similar findings in the Wuding River watershed revealed that the contribution of P to RA and SY was 77.0% and less than 50%, respectively [41]. Studies in similar watersheds also discovered that the RA and SY of flood events are more closely related to extreme rainstorms [18,42].

4.2. Effects of Erosion Dynamics on Sediment Delivery Modulus

RI and REP are the significant erosion dynamic indicators that affect the sediment delivery of flood events [31]. Using regression analysis, the researchers characterised the link between erosion dynamic indices and sediment delivery modulus (SDM) in the Chabagou watershed. The outcomes (Figure 6a) reflected that the SDM of flood events in both periods increased with the growth of RE. However, the increasing rate of SDM in PD-II was significantly less than that in PD-I. For every 10 MJ mm ha−1 h−1 increase of RE, SDM went up by 2.75 × 10⁴ t in PD-I, while it only increased by 0.75 × 10⁴ t in PD-II. The difference of SDM in both periods reached approximately 2.00 × 10⁴ t. The average value of RE in PD-II was 107.22 MJ mm ha−1 h−1, which is higher than 65.74 MJ mm ha−1 h−1 in PD-I. RE has a maximum value of 1366.93 MJ·mm·ha−1·h−1 in PD-II, which is 2.15 times the highest value in PD-I (635.94 MJ mm ha−1 h−1). Furthermore, the CV (coefficients of variation) of RE of a rainstorm in both periods were 1.81 and 2.75, respectively, which related to strong variation. It suggests that, in the context of global climate change, rainstorms that caused floods in the Chabagou watershed have likewise shown an exceptional trend [43].
As shown in Figure 6b, SDM in both periods went up with the increase of REP. In comparison to the PD-II, the distribution of SDM in PD-I was denser. In addition, when REP was more than 8 × 10⁻³ m4 s−1 km−2, the distribution of SDM in both periods was almost concentrated on the fitting curve. The distribution of SDM in both periods reflected the feature of “concentrated on high value and dispersed at low value”. The variation in SDM between the two periods was primarily responsible for the Chabagou watershed’s underlying state, altering at various times. In PD-I, check dam predominated in ecological engineering constructions in the Chabagou watershed, while vegetation construction was quite unique. On the other hand, in PD-II, the Project of Returning Farmland to Forest (Grassland) has been running for over eight years, and the vegetation condition in the Chabagou watershed is steadily improving. Finally, the interaction between water and sediment in the watershed has shifted significantly.
Furthermore, in PD-I, the SDM-RE determination coefficient equation was 0.6338, which was less than in PD-II. In PD-I, the SDM-REP determination coefficient equation was 0.9435, which was more than that in PD-II. On the watershed scale, RE had a great influence on SDM in PD-II, whereas REP’s impact on SDM was clearer in PD-I.

4.3. Effects of Conservation Measures on Sediment Yield

The effects of underlying surface change on RA and SY are mostly related to vegetation restoration, check dam building, and so on. During a rainstorm, check dam may manage the flood flow process, combat gully development, and limit sediment generation, considerably reducing runoff and sediment transport capacity in the watershed [44]. Figure 7 also demonstrates the function of a check dam. According to the results of the National Water Conservancy Survey in 2011, the control area of key check dams was 92 km2 in the Chabagou watershed. In PD-I, 22 key check dams in the Chabagou watershed were running. Among them, there is one key check dam located at the chief gully, 15 key check dams located at the branch gully, and six key check dams located at the secondary branch gully. In PD-II, the watershed’s 24 key check dams were operational, with a total storage capacity of around 10 million m3. Two key check dams lost efficiency, and 4 new key check dams were built in the upper reaches of the Chabagou watershed.
In general, check dam-controlled sediment production accounts for 42% to 80% of the whole watershed [45]. Even during extreme rainstorms, like the flood No. 100 in the Wuding River watershed in 2017, the check dam still played an effective role in sediment trapping [46]. During flood No. 100, the sediment trapping capacity of the check dam is predicted to account for 80% of the sediment output created in the whole Chabagou watershed [47]. The reason for this is that check dam can diminish soil erosion due to the backwater effect, and then promote sediment deposition and reduce soil loss in the watershed during flood events [48]. The check dam still served to lower peak flow, hold floodwater, reduce sediment delivery, and fix gully development after silt up storage capacity [49]. In order to determine the key reason behind the sharp decrease in sediment delivery in the Yellow River, various studies were performed which showed that the driving factor for sediment delivery changing from 1970 to 1990 was the engineering construction of terraces, check dams, and reservoirs; while after 1990, the driving factor has slowly changed to large-scale vegetation restoration [50].
To better reflect the influence of the underlying surface on the flood process, a flood with the maximum value of PF was selected from each of the periods, which was flood No. 2 in PD-I and No. 100 in PD-II, respectively. The whole duration of the No. 2 that occurred in 1970 was 7/31 23:18 to 8/1 20:00, and the No. 100 in 2017 was from 25 July at 8:00 p.m. to 28 July at 8:00 p.m.
After 42 min, the first peak SC of the No. 2 appeared, but RA did not increase significantly at this point. After 2 h of the first peak, a high SC appeared and lasted 6.5 h. After 3.5 h of PF appeared, the SC decreased gradually. The whole process of RA showed a sharp increase and decrease (Figure 8a). However, the No. 100 had double PF and double peak SC (Figure 8b). The process of SC and RA during flooding were relatively synchronous. After 4.3 h of the first PF, the second PF appeared, which was also the highest PF of No. 100.
In Table 3, P, RI and RE of the No. 2 were 62.88 mm, 4.71 mm h−1 and 260.42 MJ mm ha−1 h−1, respectively, and the No. 100 were 187.37 mm, 14.77 mm h−1 and 1366.93 MJ mm ha−1 h−1, respectively. Compared with the No. 2, more precipitation of the No. 100 did not induce more RA and SC. The PF was 640 m3 s−1, and the maximum SC was up to 898 kg m−3. The SY of the No. 2 was 253.62 × 10⁴ t. However, the No. 100’s PF was 339 m3 s−1 and the peak SC was 235 kg m−3, the reduction of SY up to 60.01%.
In Figure 8, the first peak SC of the No. 2 was 713 kg m−3, and RA at this point was 23 m3 s−1. However, the peak SC of the No. 100 was 153 kg m−3, and RA was 227 m3 s−1. The better improvement of the underlying surface not only raised the threshold of RA corresponding with peak SC, but also shortened the duration of high sediment concentration, which lowered the sediment transportation capacity [7,51].

5. Conclusions

By examining 101 flood events, this study evaluated the relationship between runoff and sediment of flood events in the Chabagou watershed for both periods and received the following conclusions:
(1)
In comparison to PD-I, the P of flood event rose by 62.2% in PD-II, RA increased by 86.1%, but SY fell by 48.3%. When PF was less than 50 m3 s−1, the number of flood events in both periods was highest, the fraction of SY was lowest, and the average value of SDM was the lowest. When PF was higher than 200 m3 s−1, the frequency of flood events in both periods was the least and the average value of SDM was the highest. 8.9% of flood events in PD-I added 38.8% of sediment yield, and 4.4% of flood events in PD-II added 30.8% to the sediment yield.
(2)
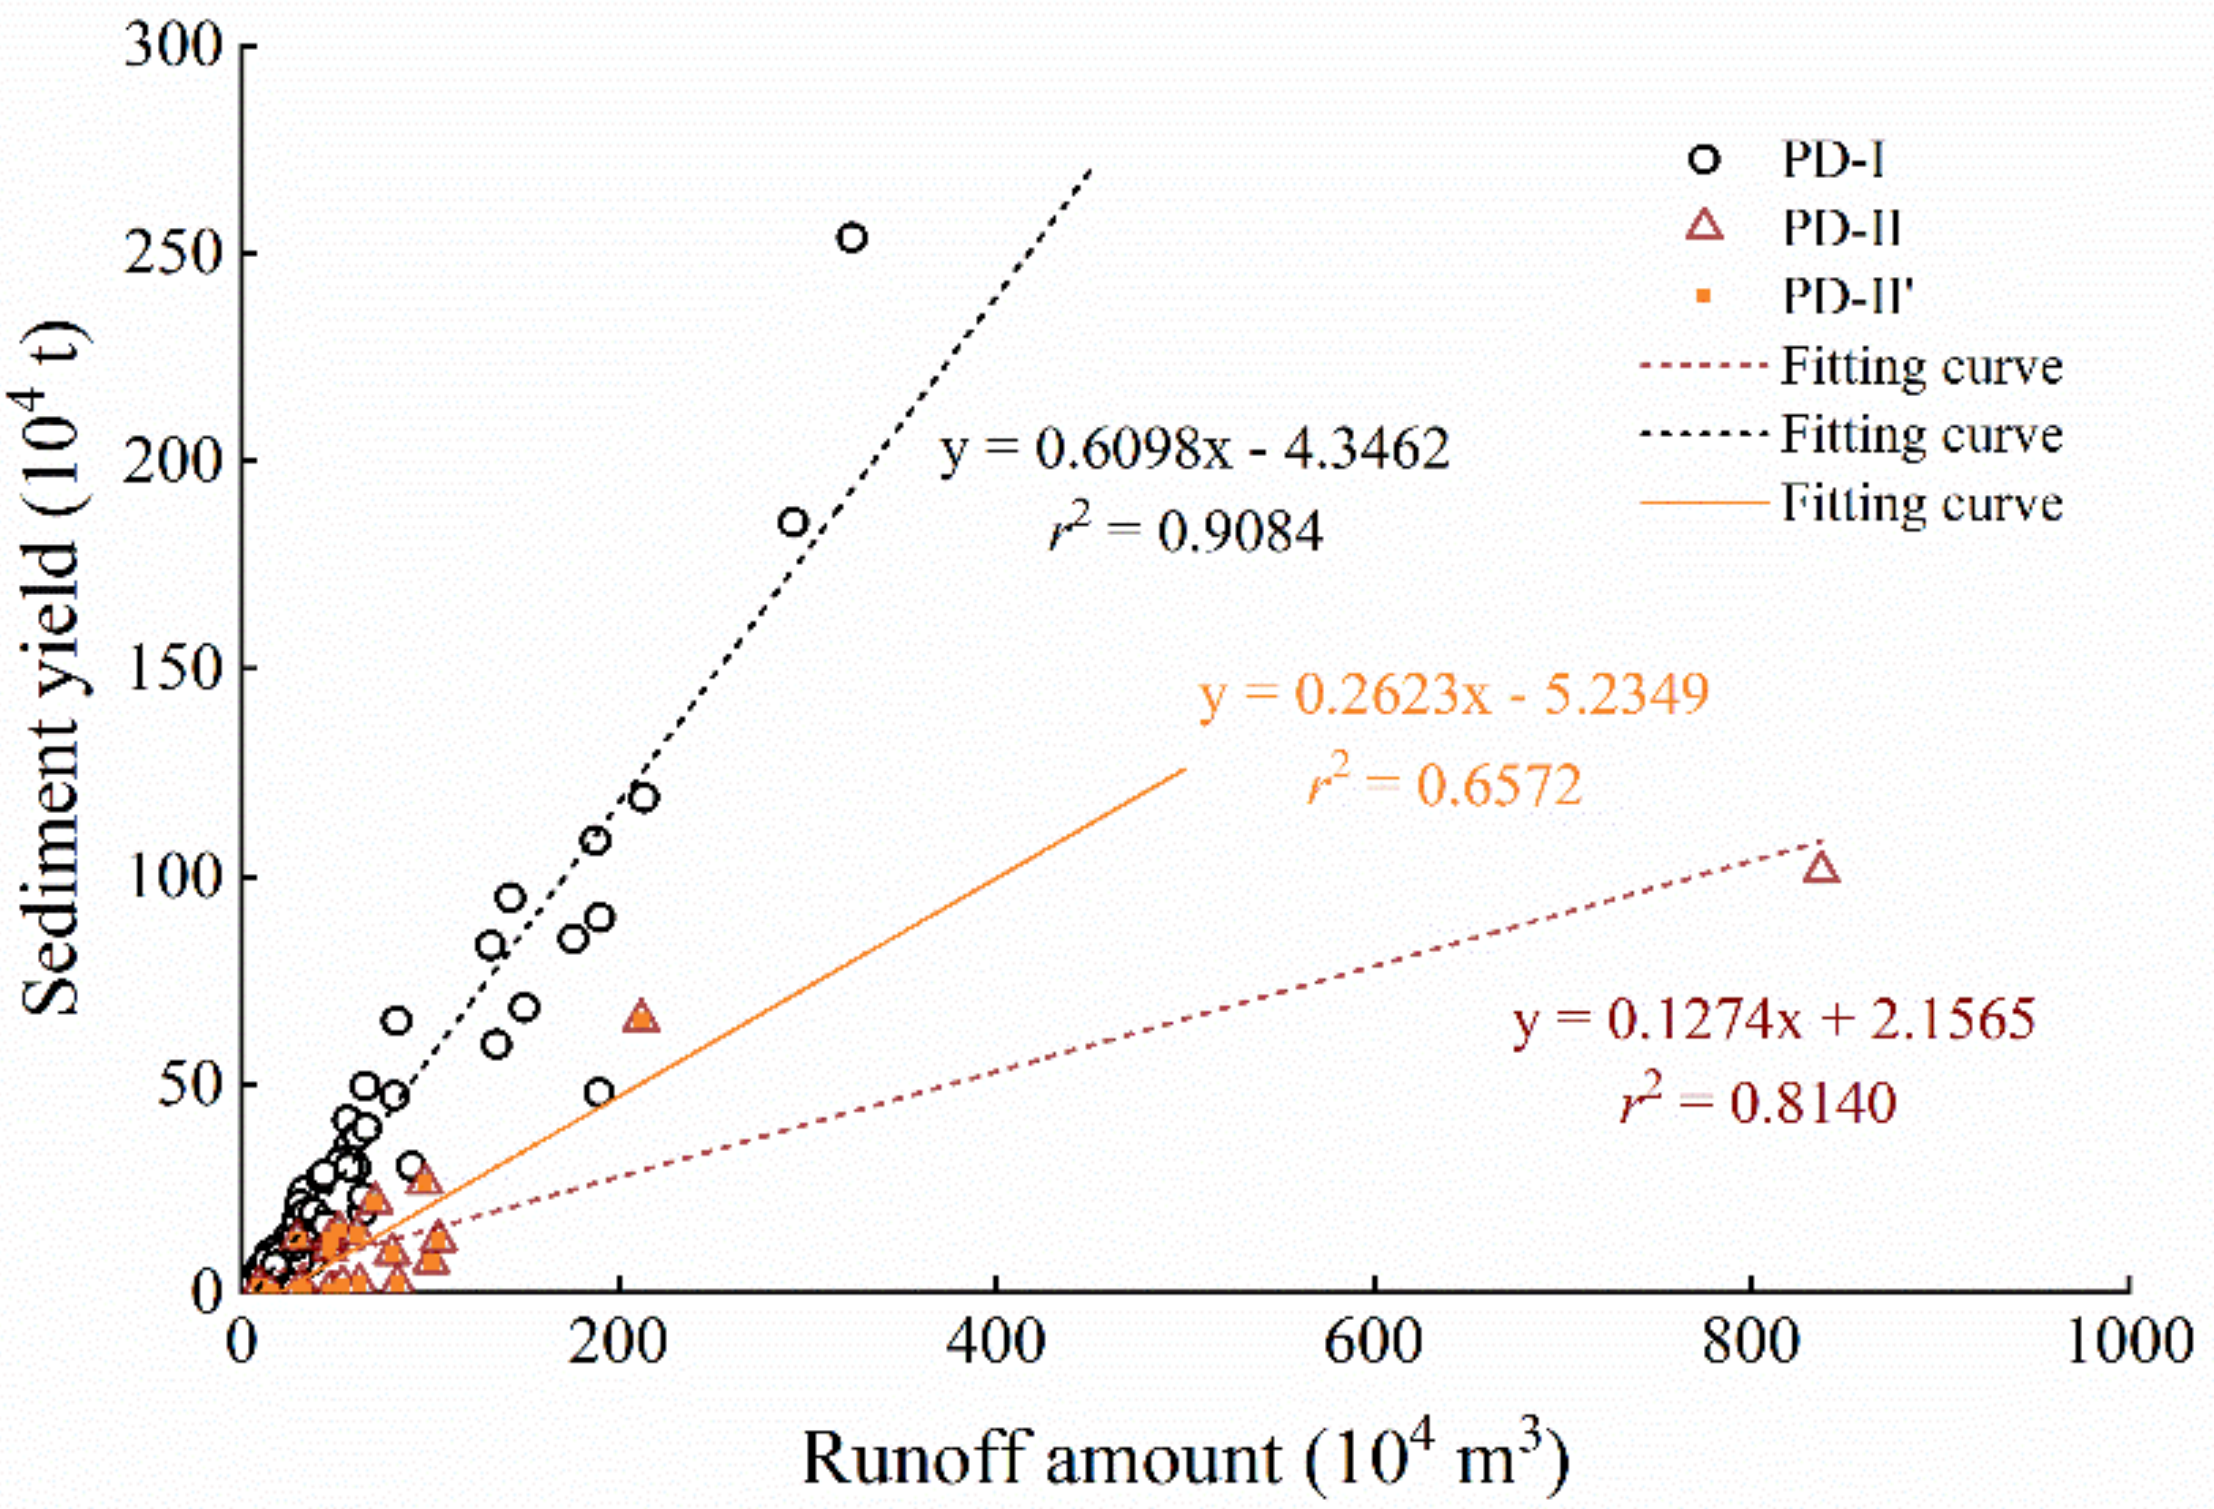
In the two-period linear relationship, the SY of flood events went up with RA. As a power function relationship, SC grew with PF during both periods. When PF in PD-I was less than 50 m3 s−1, SC went up rapidly; but when PF was higher than 200 m3 s−1, the increasing rate of SC gradually slowed down and the sediment concentration growth also reduced. In PD-II, SC increased with the increase of PF, and the increasing rate of SC was relatively stable. SY was more sensitive to P of the flood event than rainfall intensity (RI), and the sensitivity of RA and SY to P in PD-II was greater than that in PD-I.
(3)
The SDM of flood events rose linearly with RE in both periods, and was power function relationship with REP. Under these two relationships, the increasing rate of SDM in PD-II was clearly less than that in PD-I, and the SDM distribution was more concentrated in PD-I, with the characteristic of “concentrate on high value and disperse at low value”.
(4)
The improvement of the underlying surface not only raised the threshold of RA corresponding with peak SC, but also shortened the duration of high sediment concentration and lowered the sediment transportation capacity.

Author Contributions

Conceptualization: Q.Y. and H.G.; methodology and software: K.L. and Y.H.; formal analysis: H.G.; resources and data curation: Y.H.; writing—original draft preparation and writing—review and editing: Q.Y.; visualization: Y.H. and Q.Y.; supervision: Z.L.; funding acquisition: H.G. All authors have read and agreed to the published version of the manuscript.

Funding

This research was funded by the National Natural Science Foundation of China, grant number 41877077, 42177336.

Institutional Review Board Statement

Not applicable.

Informed Consent Statement

Informed consent was obtained from all subjects involved in the study.

Data Availability Statement

Original data is available from the Yellow River Basin Hydrological Yearbook.

Acknowledgments

We express our thanks to Yellow River Institute of Hydraulic Research (YRIHR) for providing data, as well as the anonymous reviewers and editors for providing constructive suggestions that improved the manuscript greatly.

Conflicts of Interest

The authors declare that they have no conflict of interest.

References

  1. González-Lemos, S.; Jiménez-Sánchez, M.; Stoll, H.M. Sediment transport during recent cave flooding events and characterization of speleothem archives of past flooding. Geomorphology 2015, 228, 87–100. [Google Scholar] [CrossRef]
  2. Ochoa, P.A.; Fries, A.; Mejía, D.; Burneo, J.I.; Ruíz-Sinoga, J.D.; Cerdà, A. Effects of Climate, Land Cover and Topography on Soil Erosion Risk in a Semiarid Basin of the Andes. Catena 2016, 140, 31–42. [Google Scholar] [CrossRef]
  3. Prokešová, R.; Horáčková, Š.; Snopková, Z. Surface runoff response to long-term land use changes: Spatial rearrangement of runoff-generating areas reveals a shift in flash flood drivers. Sci. Total Environ. 2022, 815, 151591. [Google Scholar] [CrossRef] [PubMed]
  4. Boardman, J. Soil Erosion and Flooding on the Eastern South Downs, Southern England, 1976-2001. Trans. Inst. Br. Geogr. 2003, 28, 176–196. [Google Scholar] [CrossRef]
  5. Fan, X.; Shi, C.; Shao, W.; Zhou, Y. The Suspended Sediment Dynamics in the Inner-Mongolia Reaches of the Upper Yellow River. Catena 2013, 109, 72–82. [Google Scholar] [CrossRef]
  6. Wang, Y.; Wang, S.; Wang, C.; Zhao, W. Runoff Sensitivity Increases with Land Use/Cover Change Contributing to Runoff Decline across the Middle Reaches of the Yellow River Basin. J. Hydrol. 2021, 600, 126536. [Google Scholar] [CrossRef]
  7. Buendia, C.; Bussi, G.; Tuset, J.; Vericat, D.; Sabater, S.; Palau, A.; Batalla, R.J. Effects of Afforestation on Runoff and Sediment Load in an Upland Mediterranean Catchment. Sci. Total Environ. 2016, 540, 144–157. [Google Scholar] [CrossRef]
  8. He, Y.; Wang, F.; Mu, X.; Guo, L.; Gao, P.; Zhao, G. Human Activity and Climate Variability Impacts on Sediment Discharge and Runoff in the Yellow River of China. Theor. Appl. Climatol. 2017, 129, 645–654. [Google Scholar] [CrossRef]
  9. Hu, C.; Zhang, S.; Zhang, X. Research on Water and Sediment Regulation of the Yellow River under New Situation. Eng. Sci. 2022, 24, 122–130. [Google Scholar] [CrossRef]
  10. Hu, C.; Zhang, X. Several Key Questions in the Researches of Runoff and Sediment Changes and Trend Predictions in the Yellow River. J. Hydraul. Eng. 2018, 49, 1028–1039. [Google Scholar]
  11. Li, L.; Ni, J.; Chang, F.; Yue, Y.; Frolova, N.; Magritsky, D.; Borthwick, A.G.L.; Ciais, P.; Wang, Y.; Zheng, C.; et al. Global Trends in Water and Sediment Fluxes of the World’s Large Rivers. Sci. Bull. 2020, 65, 62–69. [Google Scholar] [CrossRef] [Green Version]
  12. Shi, C.; Zhou, Y.; Fan, X.; Shao, W. A Study on the Annual Runoff Change and Its Relationship with Water and Soil Conservation Practices and Climate Change in the Middle Yellow River Basin. Catena 2013, 100, 31–41. [Google Scholar] [CrossRef]
  13. Liang, W.; Bai, D.; Wang, F.; Fu, B.; Yan, J.; Wang, S.; Yang, Y.; Long, D.; Feng, M. Quantifying the Impacts of Climate Change and Ecological Restoration on Streamflow Changes Based on a Budyko Hydrological Model in China’s Loess Plateau. Water Resour. Res. 2015, 51, 6500–6519. [Google Scholar] [CrossRef]
  14. Xu, X.; Yang, H.; Yang, D.; Ma, H. Assessing the Impacts of Climate Variability and Human Activities on Annual Runoff in the Luan River Basin, China. Hydrol. Res. 2013, 44, 940–952. [Google Scholar] [CrossRef]
  15. Tian, P.; Zhai, J.; Zhao, G.; Mu, X. Dynamics of Runoff and Suspended Sediment Transport in a Highly Erodible Catchment on the Chinese Loess Plateau. Land Degrad. Dev. 2016, 27, 839–850. [Google Scholar] [CrossRef]
  16. Rodrigo Comino, J.; Senciales, J.M.; Ramos, M.C.; Martínez-Casasnovas, J.A.; Lasanta, T.; Brevik, E.C.; Ries, J.B.; Ruiz Sinoga, J.D. Understanding Soil Erosion Processes in Mediterranean Sloping Vineyards (Montes de Málaga, Spain). Geoderma 2017, 296, 47–59. [Google Scholar] [CrossRef]
  17. Hu, J.; Zhao, G.; Mu, X.; Hörmann, G.; Tian, P.; Gao, P.; Sun, W. Effect of Soil and Water Conservation Measures on Regime-Based Suspended Sediment Load during Floods. Sustain. Cities Soc. 2020, 55, 102044. [Google Scholar] [CrossRef]
  18. Ran, Q.; Zong, X.; Ye, S.; Gao, J.; Hong, Y. Dominant Mechanism for Annual Maximum Flood and Sediment Events Generation in the Yellow River Basin. Catena 2020, 187, 104376. [Google Scholar] [CrossRef]
  19. An, J.; Zheng, F.L.; Han, Y. Effects of Rainstorm Patterns on Runoff and Sediment Yield Processes. Soil Sci. 2014, 179, 293–303. [Google Scholar] [CrossRef]
  20. Borga, M.; Stoffel, M.; Marchi, L.; Marra, F.; Jakob, M. Hydrogeomorphic Response to Extreme Rainfall in Headwater Systems: Flash Floods and Debris Flows. J. Hydrol. 2014, 518, 194–205. [Google Scholar] [CrossRef]
  21. Liu, J.H.; Wang, G.Q.; Li, H.H.; Gong, J.G.; Han, J.Y. Water and Sediment Evolution in Areas with High and Coarse Sediment Yield of the Loess Plateau. Int. J. Sediment Res. 2013, 28, 448–457. [Google Scholar] [CrossRef]
  22. Zeng, X.; Sun, K.; Wang, C.; An, C.; Lei, H.; Li, P.; Fu, X. Regulating Effect of Check Dams on Erosion Dynamics and Sediment Transport during Flooding. J. Tsinghua Univ. (Sci. Technol.) 2022, 2003–2005. [Google Scholar] [CrossRef]
  23. Gu, C.; Mu, X.; Sun, W.; Gao, P.; Zhao, G. Comparative Analysis of the Responses of Rainstorm Flood and Sediment Yield to Vegetation Rehabilitation in the Yanhe River Basin. J. Nat. Resour. 2017, 32, 1755–1767. [Google Scholar]
  24. Fu, S.; Yang, Y.; Liu, B.; Liu, H.; Liu, J.; Liu, L.; Li, P. Peak Flow Rate Response to Vegetation and Terraces under Extreme Rainstorms. Agric. Ecosyst. Environ. 2020, 288, 106714. [Google Scholar] [CrossRef]
  25. Mo, S.; Gong, Y.; Li, J.; Shen, B. Impact of Human Activities on Flood Process in Chabagou Basin of the Loess Plateau, China. J. Basic Sci. Eng. 2019, 27, 492–508. [Google Scholar]
  26. Yu, W.; Ding, W.; Liu, Y.; Kang, J.; Guo, Y. Runoff and Sediment Relationship in Chabagou Catchment Based on Sediment Dynamics in Typical Single Flood Event. J. Yangze River Sci. Res. Inst. 2020, 37, 20–26. [Google Scholar]
  27. Lu, K.; Li, Z.; Li, P.; Ju, H. Rediction of Watershed Sediment Transport for Single Rainstorm Based on Runoff Erosion Power. J. Yangze River Sci. Res. Inst. 2008, 25, 31–34. [Google Scholar]
  28. Zhang, L.T.; Li, Z.B.; Wang, H.; Xiao, J.B. Influence of Intra-Event-Based Flood Regime on Sediment Flow Behavior from a Typical Agro-Catchment of the Chinese Loess Plateau. J. Hydrol. 2016, 538, 71–81. [Google Scholar] [CrossRef]
  29. Wang, W.; Yin, S.; Yuan, Y. Comparison of Event and Daily Precipitations. J. Beijing Norm. Univ. (Nat. Sci.) 2018, 54, 224–231. [Google Scholar]
  30. Zhang, W.; Xie, Y.; Liu, B. Estimation of Rainfall Erosivity Using Rainfall Amount and Rainfall Intensity. Geogr. Res. 2002, 21, 384–390. [Google Scholar]
  31. Zhang, L.T.; Li, Z.B.; Wang, S.S. Spatial Scale Effect on Sediment Dynamics in Basin-Wide Floods within a Typical Agro-Watershed: A Case Study in the Hilly Loess Region of the Chinese Loess Plateau. Sci. Total Environ. 2016, 572, 476–486. [Google Scholar] [CrossRef] [PubMed]
  32. Sankarasubramanian, A.; Vogel, R.M.; Limbrunner, J.F. Climate Elasticity of Streamflow in the United States. Water Resour. Res. 2001, 37, 1771–1781. [Google Scholar] [CrossRef]
  33. Huang, M.; Zhang, L.; Gallichand, J. Runoff Responses to Afforestation in a Watershed of the Loess Plateau, China. Hydrol. Process. 2003, 17, 2599–2609. [Google Scholar] [CrossRef]
  34. Li, C.; Pan, C. The Relative Importance of Different Grass Components in Controlling Runoff and Erosion on a Hillslope under Simulated Rainfall. J. Hydrol. 2018, 558, 90–103. [Google Scholar] [CrossRef]
  35. Mu, H.; Yu, X.; Fu, S.; Yu, B.; Liu, Y.; Zhang, G. Effect of Stem Cover on Hydraulic Parameters of Overland Flow. J. Hydrol. 2019, 577, 123964. [Google Scholar] [CrossRef]
  36. Yuan, S.; Li, Z.; Chen, L.; Li, P.; Zhang, Z.; Zhang, J.; Wang, A.; Yu, K. Effects of a Check Dam System on the Runoff Generation and Concentration Processes of a Catchment on the Loess Plateau. Int. Soil Water Conserv. Res. 2022, 10, 86–98. [Google Scholar] [CrossRef]
  37. Liu, X.Y.; Wang, F.G.; Yang, S.T.; Li, X.Y.; Ma, H.B.; He, X.Z. Sediment Reduction Effect of Level Terrace in the Hilly-Gully Region in the Loess Plateau. Shuili Xuebao/J. Hydraul. Eng. 2014, 45, 793–800. [Google Scholar]
  38. Gao, Z.L.; Fu, Y.L.; Li, Y.H.; Liu, J.X.; Chen, N.; Zhang, X.P. Trends of Streamflow, Sediment Load and Their Dynamic Relation for the Catchments in the Middle Reaches of the Yellow River over the Past Five Decades. Hydrol. Earth Syst. Sci. 2012, 16, 3219–3231. [Google Scholar] [CrossRef] [Green Version]
  39. Shi, H.; Wang, G. Impacts of Climate Change and Hydraulic Structures on Runoff and Sediment Discharge in the Middle Yellow River. Hydrol. Process. 2015, 29, 3236–3246. [Google Scholar] [CrossRef]
  40. Chang, J.; Wei, J.; Wang, Y.; Yuan, M.; Guo, J. Precipitation and Runoff Variations in the Yellow River Basin of China. J. Hydroinformatics 2017, 19, 138–155. [Google Scholar] [CrossRef]
  41. Xue, F.; Zhang, X.; Zhang, L.; Liu, B.; Yang, Q.; Yi, H.; He, L.; Zou, Y.; He, J.; Xu, X.; et al. Attribution Recognition of Streamflow and Sediment Changes Based on the Budyko Hypothesis and Fractal Theory: A Case Study in the Beiluo River Basin. Acta Geogr. Sin. 2022, 77, 79–92. [Google Scholar]
  42. Nadal-Romero, E.; Regüés, D.; Latron, J. Relationships among rainfall, runoff, and suspended sediment in a small catchment with badlands. Catena 2008, 74, 127–136. [Google Scholar] [CrossRef]
  43. Li, S.; Wang, C.; Yan, J.; Liu, X. Variability of the Event-Based Extreme Precipitation in the South and North Qinling Mountains. Acta Geogr. Sin. 2020, 75, 989–1007. [Google Scholar]
  44. Li, P.; Xu, G.; Lu, K.; Zhang, X.; Shi, P.; Bai, L.; Ren, Z.; Pang, G.; Xiao, L.; Gao, H.; et al. Runoff Change and Sediment Source during Rainstorms in an Ecologically Constructed Watershed on the Loess Plateau, China. Sci. Total Environ. 2019, 664, 968–974. [Google Scholar] [CrossRef] [PubMed]
  45. Zhao, G.; Kondolf, G.M.; Mu, X.; Han, M.; He, Z.; Rubin, Z.; Wang, F.; Gao, P.; Sun, W. Sediment Yield Reduction Associated with Land Use Changes and Check Dams in a Catchment of the Loess Plateau, China. Catena 2017, 148, 126–137. [Google Scholar] [CrossRef]
  46. Liu, X.; Gao, Y.; Ma, S.; Dong, G. Sediment Reduction of Warping Dams and Its Timeliness in the Loess Plateau. J. Hydraul. Eng. 2018, 49, 145–155. [Google Scholar]
  47. Bai, L.; Wang, N.; Jiao, J.; Chen, Y.; Tang, B.; Wang, H.; Chen, Y.; Yan, X.; Wang, Z. Soil Erosion and Sediment Interception by Check Dams in a Watershed for an Extreme Rainstorm on the Loess Plateau, China. Int. J. Sediment Res. 2020, 35, 408–416. [Google Scholar] [CrossRef]
  48. Ran, Q.; Tang, H.; Wang, F.; Gao, J. Numerical Modelling Shows an Old Check-Dam Still Attenuates Flooding and Sediment Transport. Earth Surf. Process. Landforms 2021, 46, 1549–1567. [Google Scholar] [CrossRef]
  49. Yuan, S.; Li, Z.; Chen, L.; Li, P.; Zhang, Z. Influence of Check Dams on Flood Hydrology across Varying Stages of Their Lifespan in a Highly Erodible Catchment, Loess Plateau of China. Catena 2022, 210, 105864. [Google Scholar] [CrossRef]
  50. Wang, S.; Fu, B.; Piao, S.; Lü, Y.; Ciais, P.; Feng, X.; Wang, Y. Reduced Sediment Transport in the Yellow River Due to Anthropogenic Changes. Nat. Geosci. 2016, 9, 38–41. [Google Scholar] [CrossRef]
  51. Zhang, J.; Gao, G.; Fu, B.; Gupta, H.V. Formulating an Elasticity Approach to Quantify the Effects of Climate Variability and Ecological Restoration on Sediment Discharge Change in the Loess Plateau, China. Water Resour. Res. 2019, 55, 9604–9622. [Google Scholar] [CrossRef]
Figure 1. Location of Chabagou watershed. Niuxuegou (NXG), Wangjiayan (WangJY), Wanjiayan (WanJY), and Zhujiayangwan (ZJYW), while eight other rainfall stations are found on the right side of the chief gully, Taoyuanshan (TYS), Xiaoji (XJ), Jijiajian (JJJ), Dujiashan (DJS), Mahuyan (MHY), Lijiayan (LJY), Liujiawa (LJW) and Heminyan (HMY). Caoping (CP) is the one hydrologic station.
Sustainability 14 11573 g001
Figure 2. SY changes with PF at four classifications.
Sustainability 14 11573 g002
Figure 3. Relationships between RA and SY in both periods. The red line is the fitting curve obtained by all the values of PD-II, and the orange line is the fitting curve obtained by all the values of PD-II′. The difference between PD-II and PD-II′ is flood No. 100, which is one extreme value (837.371 × 10⁴ m3, 101.23 × 10⁴ t) in PD-II. In this article, we use the red line for analysis.
Sustainability 14 11573 g003
Figure 4. Relationships between PF and SC in both periods. The red line is the fitting curve obtained by all the values of PD-II, and the orange line is the fitting curve obtained by all the values of PD-II′. The difference between PD-II and PD-II′ is flood No. 100, which is one extreme value (339 m3 s−1, 235 kg m−3) in PD-II. In this article, we use the red line for analysis.
Sustainability 14 11573 g004
Figure 5. Correlation coefficients between precipitation related indices and hydrological factors. *** Correlation is significant at the 0.001 level (two-tailed); ** Correlation is significant at the 0.01 level (two-tailed); * Correlation is significant at the 0.05 level (two-tailed). a and b represent the correlation coefficient of PD-I and PD-II, respectively.
Sustainability 14 11573 g005
Figure 6. Relationships between erosion dynamics and SDM; (a) was the relationship between SDM and RE, (b) was the relationship between SDM and REP. SDM = sediment yield (t)/drainage area (km2).
Sustainability 14 11573 g006
Figure 7. Location of key check dams in the Chabagou watershed.
Sustainability 14 11573 g007
Figure 8. Processes of SC and RA of two flood events in both periods. The PF of two flood events was the highest in each of the periods. In (a), “1970-640” (No. 2, in PD-I) represents one flood event in 1970 with a PF of 640 m3 s−1, in (b), “2017-339” (No. 100, in PD-II) represents one flood event in 2017 with a PF of 339 m3 s−1. The red line represents RA and the blue line represents SC.
Sustainability 14 11573 g008
Table 1. Hydrological characteristics of flood events in both periods.
Statistic IndicesP (mm)RI (mm h−1)RA (104 m3)SY (104 t)
MeanMaximumMeanMaximumMeanMaximumMeanMaximum
PeriodPD-I27.5127.66.5018.8852.07323.4728.02253.62
PD-II44.6187.45.1414.7796.89837.3714.50101.23
Change17.159.7−1.36−4.1144.82513.90−13.52−152.39
Change rate (%)62.246.8−20.9−21.886.1158.9−48.3−60.1
Note. Precipitation (P), Rainfall Intensity (RI), Runoff Amount (RA), Sediment Yield (SY).
Table 2. Characteristics of flood event under four classifications.
Classification of PF (m3 s−1)PD-IPD-II
Frequency of Flood Event (%)Proportion of SY (%)Average Sediment Modulus (t km1)Frequency of Flood Event (%)Proportion of SY (%)Average Sediment Modulus (t km1)
5 ≤ PF < 5060.816.540045.510.750
50 ≤ PF < 10016.516.9140030.428.1600
100 ≤ PF < 20013.927.9270017.434.81400
PF ≥ 2008.938.860004.430.85000
Table 3. Hydrological characteristics of two flood events in both periods.
Flood EventsP (mm)RI (mm h−1)RE (MJ mm ha−1 h−1)PF (m3 s−1)FD (h)Peak SC (kg m−3)
No. 262.884.71260.4264020.7898
No. 100187.3714.771366.9333972272
Note. Precipitation (P), Rainfall Intensity (RI), Rainfall Erosivity (RE), Peak Flow (PF), Flood Duration (FD), Peak Sediment Concentration (Peak SC).
Publisher’s Note: MDPI stays neutral with regard to jurisdictional claims in published maps and institutional affiliations.

