Abstract
The modal analysis of a long-span transmission tower was carried out using a finite element method, and then its aeroelastic model was established by the discrete stiffness method for wind tunnel tests. The displacement and acceleration of the aeroelastic model were measured by a vision-based displacement measuring instrument and accelerometer, respectively. Also, the wind-induced responses of the tower were conducted by finite element calculation, with which the results of the wind tunnel tests are compared. The gust response factor was calculated and compared with those from the specifications and other studies. The results show that the vision-based displacement instrument can record well the vibration of the model tower in the wind tunnel. The acceleration of the tower is dominated by the first-order resonant response, whereas the displacement is dominated by the background response. The displacement and acceleration in the longitudinal and transversal directions are almost equal, indicating that the crosswind and along-wind responses are of the same magnitude. The displacement atop the tower obtained from the test after considering the Reynolds number correction almost coincided with that from the numerical simulation. The gust response factor of the tower obtained via wind tunnel tests is smaller than that of the codes and close to that found via finite element calculations.
1. Introduction
Transmission tower line systems are sensitive to wind loads, and their main cause of damage is strong wind [1,2,3,4]. Therefore, the transmission tower’s wind-resistant design is critical for systems’ safety. In addition to the static effect caused by the mean wind load, the vibration of the transmission tower is caused by the fluctuating wind load. Generally, investigation methods for the wind resistance of transmission towers mainly include field measurement, numerical simulation, and wind tunnel tests.
Field measurement is one of the most direct and effective methods. Ballio et al. [5] conducted a field measurement on a transmission tower of 100 m high that was built more than 60 years ago. The study shows that the responses of the transmission tower in the crosswind and along-wind directions are of the same magnitude. Liu et al. [6] analyzed the coupling phenomenon between the tower and line using field measurements and discussed the occurrence mechanism between the tower frame and conductors. He and Yang [7] obtained the first natural frequency and corresponding modal shape of a transmission tower by field measurement. Although field measurement has the ability to obtain an on-the-spot, wind-induced response of the transmission tower, it is costly and time-consuming due to the particular location of the transmission tower, especially in mountainous areas.
Numerical simulation is another means to calculate the wind-induced response of a transmission tower, in which the quasi-static assumption is generally prescribed. The simulation can be mainly divided into time domain and frequency domain based on the method it uses. Yasui et al. [8] carried out an analytical study on a suspension and a tension tower based on the simulated fluctuating wind velocities and concluded that the conductors could have an influence on the response on the transmission tower. Loredo-Souza and Davenport [9] performed dynamic analysis of a transmission tower using artificial wind load simulation and the finite element method. Yao et al. [10] also used a self-compiled vector finite element program to calculate the transmission tower’s response and simulate the collapse procedure of the tower under strong wind excitation. Alternatively, the frequency domain method can also be used to attain the dynamic response of the latticed towers. Zhu et al. [11] employed a frequency domain model to calculate the responses of a guyed mast and drew the conclusion that good agreement could be achieved between the wind tunnel tests and the frequency domain model. Obviously, numerical simulation is more convenient and cost-effective to investigate the wind-induced response of the transmission tower compared with field measurement. However, the wind load on the transmission tower cannot be accurately estimated due to the quasi-static assumption adopted in the numerical simulation.
Compared with the above two methods, the wind tunnel test can be more convenient in obtaining the wind-induced response of the transmission tower, in which the simulation of the wind load’s action on the transmission tower can be more direct and realistic. Wind tunnel tests on the transmission tower usually can be divided into the high-frequency force balance (HFFB) test and the aeroelastic model test. Yang et al. [12] and Carril et al. [13] used high-frequency balances to test wind loads acting on transmission towers. However, the aeroelastic effect of the tower under the wind excitation cannot be addressed by the HFFB test because the test model is a rigid body. Therefore, the aeroelastic model test of a transmission tower based on the similarity principle is the most feasible method to directly obtain the response of transmission towers.
Several wind tunnel tests based on aeroelastic models have been conducted to study the wind-induced response of transmission towers. Wang et al. [14] conducted a wind tunnel test and numerical simulations of a single-rod transmission tower. In their work, the result of the aeroelastic wind tunnel tests was verified by comparing it with that of the simulation. Deng et al. [15], Cheng et al. [16], and Fu et al. [17] also used similar methods to study the wind-induced responses of different transmission towers by using the discrete stiffness method, in which the mass and tensile rigidity of each member are considered in the test. Li et al. [18] proposed an aeroelastic model design method of a complicated steel truss arch tower and conducted sensitivity analysis under skew incident winds through a wind tunnel test. The aeroelastic wind tunnel test can also be used for the tower-line system. Guo et al. [19] designed an aeroelastic model of a tower-line system using the discrete stiffness method and tested the acceleration and displacement by using the accelerometers and laser displacement meters. They discussed the difference between the responses of a single tower and tower-line system. Xiong et al. [20] identified total structural damping, including structural and aerodynamic damping, through aeroelastic model wind tunnel tests and fitted them into empirical formulas. Zhao et al. [21] conducted aeroelastic model tests on a high-voltage transmission tower-line system and reproduced the collapse of tower-line system in the wind tunnel. Song et al. [22] investigated the performance of two-span, six-bundled conductors by an aeroelastic model and found that the wind direction, wind velocity, and length of insulator have a significant influence on the wind-induced tension and swing angle of the insulator. Besides the discrete stiffness method, Li et al. [23], Liang et al. [24], and Xiao et al. [25] designed the aeroelastic model of a transmission tower by using the rigid segment model combined with the V-shaped spring method and measured the displacement and acceleration of the model tower.
Although many aeroelastic wind tunnel tests have been conducted, there exists a displacement testing issue that needs to be discussed. In order to measure the displacement of a model tower in a wind tunnel, the laser-based measuring technique is generally employed [14,15,16,17,18,19,20,21,22,23,24,25]. However, in order to install the laser displacement meter, a high pole is needed to fix the laser instrument. Therefore, the high pole with laser displacement meter will be placed in the wind tunnel and will vibrate in the same way as the model tower when the wind blows. As a result, the displacement of the model tower may be distorted, and the testing accuracy is difficult to guarantee. Thus, a vision-based displacement measuring technique may be an alternative choice and will be used in the present study.
This study conducts aeroelastic model wind tunnel tests on a long-span transmission tower. The modal analysis of the tower was carried out using the finite element method, and then its aeroelastic model was designed and fabricated based on the discrete stiffness method. A new measurement method, i.e., a vision-based displacement measurement system, is proposed to obtain the displacement of the transmission tower in the wind tunnel test. Furthermore, the displacement of the tower is compared with that obtained by the accelerometer and finite element calculations to verify the accuracy of the vision-based displacement measurement. Finally, the gust response factor is provided and compared with those calculated by the specifications and other studies.
2. Finite Element Modeling of a Transmission Tower
The long-span transmission tower in the 500 kV and 220 kV mixed four-circuit transmission line from Ningbo to Zhoushan, China was adopted for illustration. The lattice-type steel transmission tower is 380 m high, with a nominal height of 293 m and a foundation of 69.2 m × 69.2 m. The tower is composed of the main rod, diagonal rod and diaphragm. The main rods under 293 m are concrete-filled steel tubes with a maximum diameter of 2.3 m at the bottom. The main rod above 293 m, diagonal rod, and diaphragm are all thin-walled steel tubes. The layout of the long-span transmission tower is shown in Figure 1.
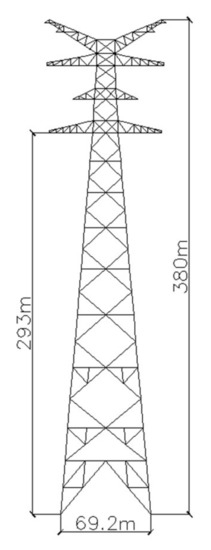
Figure 1.
Layout of transmission tower.
The transmission tower was modeled by the finite element software ANSYS 17.2 (ANSYS Inc., Canonsburg, PA, USA). Figure 2 shows the three-dimensional model built in ANSYS. Both the thin-walled and concrete-filled steel tubes were modeled by the Beam188 element, whose section area and inertia moment were automatically calculated according to their section size. Each component of the diagonal rod and diaphragm is modeled with a Beam 188 element. The main rod is meshed with the beam 188 element in such way that they connect the nodes of the diagonal rod and diaphragm, but they are not further meshed. The gusset plate and other auxiliary components, such as the ladder and bolts, do not affect the structural rigidity; therefore, only its mass was considered in the modeling, and the Mass21 element is used for simulation.
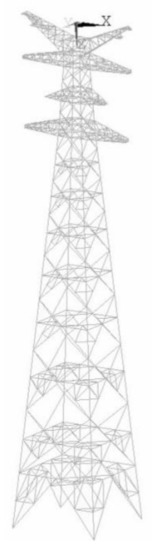
Figure 2.
Three-dimensional finite element model of tower.
The modal analysis is carried out in ANSYS with the Block Lanczos method. Table 1 shows the first six natural frequencies and modes of the tower. It can be seen that the frequencies of the first x-direction and first y-direction bending modes are close.

Table 1.
Frequency of the tower.
3. Aeroelastic Model Test
3.1. Aeroelastic Model
According to the height of the tower and the size of the wind tunnel test section, the selected geometric scale ratio CL was set as 1:200 for the aeroelastic model. The maximum blockage ratio of the model is 1.1%, indicating that the distortion effect and acceleration effect caused by the model blockage can be ignored. The design of the aeroelastic model strictly met criteria such as geometric similarity and other similarities, such as the Strouhal number, Froude number, and Cauchy number. The mass parameter and damping ratio were also met. Due to the geometric scale, the Reynolds (Re) numbers, defined as Re = VD/ν, where V is the mean wind speed of the flow, D is the characteristic length herein equaling the mean outer diameter of the tubular member, and ν is the kinetic air viscosity, could not be met. The influence of Reynolds numbers will be compensated for in the following section. The Fround (Fr) numbers, defined as Fr = gD/V2, where g is the gravitational acceleration, are not met in the present study. However, since gravity has little effect on the wind-induced vibration of the tower, the influence of the Froude number could be neglected. Table 2 shows the similar parameters of the aeroelastic model. The structure density similarity coefficient is 2, and the frequency similarity coefficient Cf is 58.
Table 2.
Scaling ratios for the aeroelastic model.
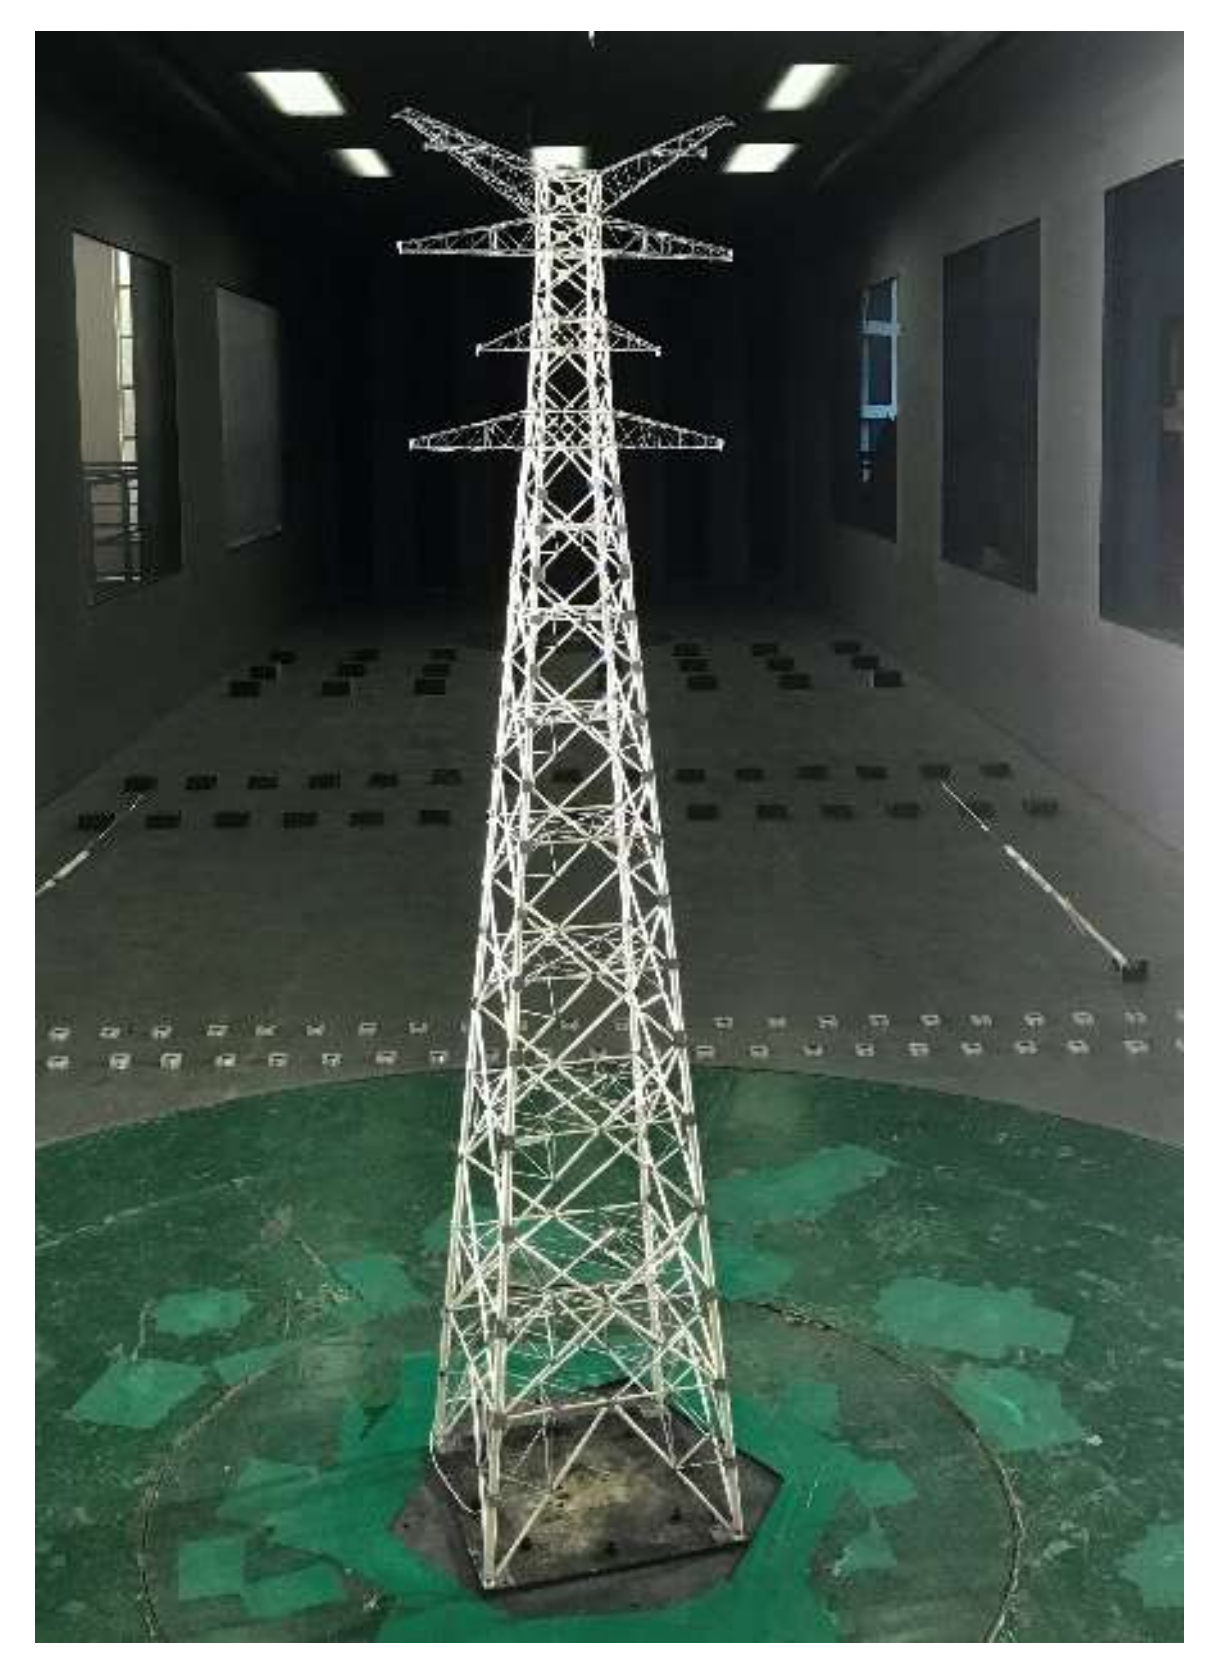
According to the discrete stiffness method, the tensile stiffness and geometric size of each rod can be modeled separately. The rods of the aeroelastic model were made by the core part and the outer part. The core part was made by stainless-steel capillary with small outer diameter and wall thickness of 0.1–0.25 mm to model the tensile stiffness. The elastic modulus of the stainless-steel capillary is 200 GPa. The outer part was made by nonrigid texture paper to achieve geometric similarity so that the windward area of each rod is fulfilled after considering the similarity principle. The gusset plate does not contribute to the tower’s stiffness, but its mass and area affect the tower’s mass distribution and projected area. Therefore, the mass of the gusset plate is considered with additional concentrated mass attached on the node after modeling the shape of the gusset plate with sheet copper. Figure 3 shows the aeroelastic model of the electrical transmission tower in the wind tunnel.

Figure 3.
Aeroelastic model of tower in wind tunnel.
3.2. Measuring Points and Test Methods
In the test, two resonating frequency acceleration sensors were arranged at the top of the tower, each with a mass of 4 g. The National Instruments data acquisition system (NI PXle-1071, National Instruments, Austin, TX, USA) was used for acceleration signal acquisition and analysis; its sampling frequency was set at 2048 Hz. A noncontact vision-based measuring instrument made by the IMETRUM Company was used to test the tower’s displacement in the x- and y-directions, and the sampling frequency was 100 Hz. According to the Nyquist sampling theorem [26], if the sampling frequency is more than twice the highest frequency of the original signal, the complete information in the digital signal can be completely preserved in the sampling process. The wind-induced response of the tower is mainly dominated by the first two modes, and the maximum frequency of the model is below 35 Hz. Therefore, the sampling frequency of acceleration and displacement meets the requirements of the aeroelastic tests.
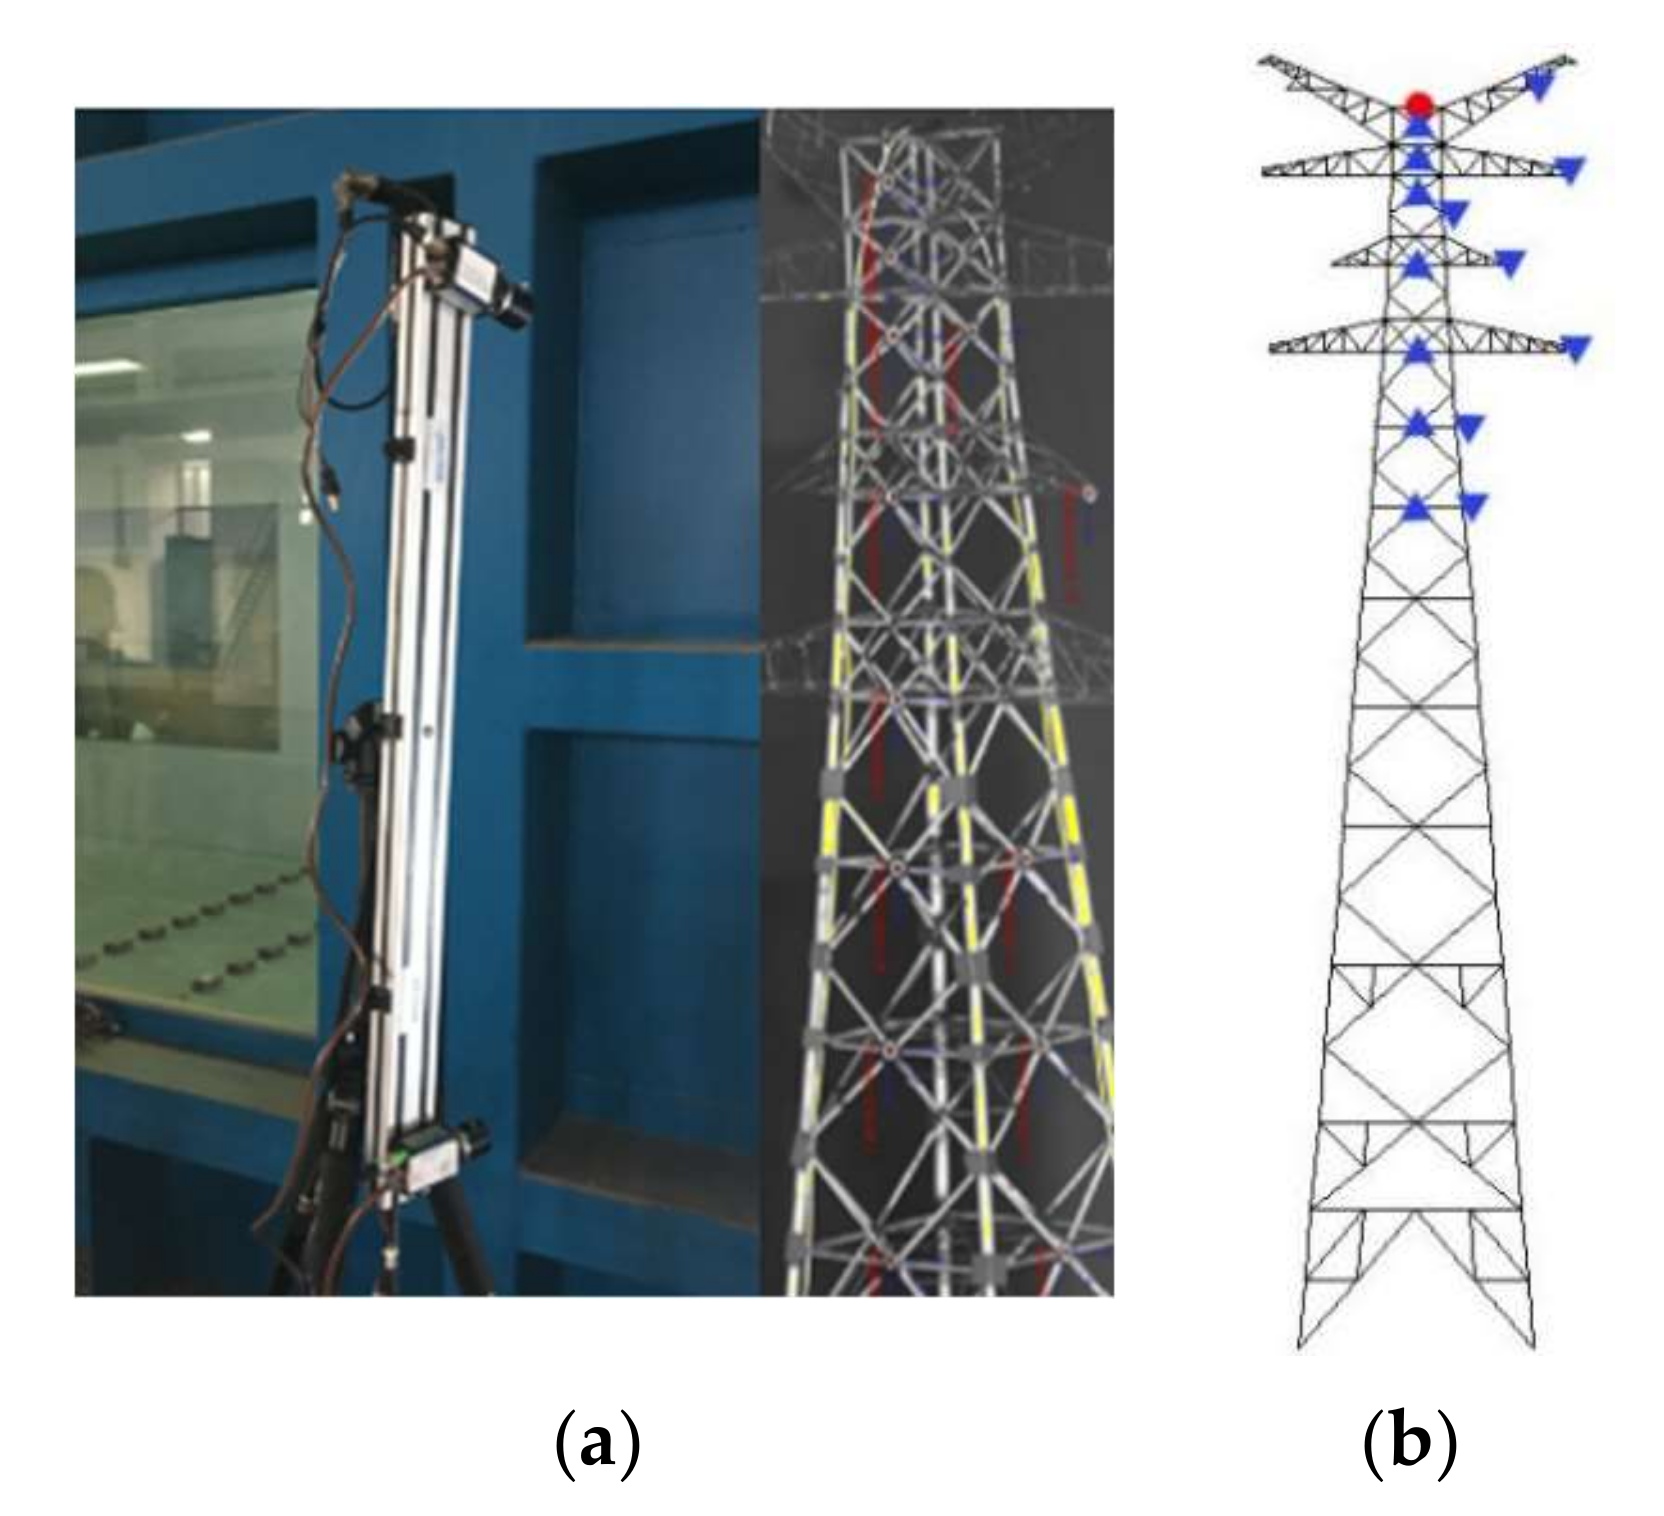
To increase the recognition accuracy of the vision-based measuring instrument, paper targets were arranged at the measuring point. The vision-based measuring instrument was arranged outside the wind tunnel (Figure 4a). Figure 4b shows the arrangement of measuring points. The circle in Figure 4b indicates the position of the acceleration measuring point, and the triangle indicates the position of the displacement measuring point.

Figure 4.
Displacement and acceleration measurements in wind tunnel test: (a) Video measuring instrument; (b) Arrangement of test points.
3.3. Natural Frequency and Damping
The first two natural vibration modes of the tower are first-order bending in the x- and y-directions, as shown in Table 1. Calibration tests of the aeroelastic model were conducted by the hammer excitation method to obtain the natural vibration characteristics of the model tower. The fast Fourier transform (FFT) method was applied to identify the first two frequencies. Moreover, the damping ratios of the model were identified by the empirical mode decomposition (EMD), random decrement technique (RDT), and Hilbert transformation methods.
After obtaining the Intrinsic Mode Function (IMF) component by the EMD method, the free vibration decay signal X(t) is extracted by the RDT method and Hilbert transform to Y(t):
where P is the Cauchy principal of the generalized integral, and an analytic signal can be formed from X(t) and Y(t):
The instantaneous amplitude b(t) and instantaneous phase θ(t) are obtained from the Hilbert transform as follows:
For a single-degree-of-freedom system with small damping, logarithmic and differential operators are introduced for the amplitude and phase:
where is the damping ratio, C is a constant, w is the instantaneous frequency, and wd is the frequency of the system with damping. The damping ratio can be identified as:
where p1 is the slope of ln(b(t)), and p2 is the slope of θ(t).
Table 3 shows the frequencies and damping ratios of the aeroelastic model. It can be seen that the measured frequencies of the model are close to the target frequency. The errors of the first two frequencies are −1.68% and −1.30%, indicating that the model was made reasonably and met the requirements of the similarity principle.
Table 3.
Frequencies and damping ratios of the aeroelastic model tower.
3.4. Wind Field and Test Conditions
The wind tunnel tests of the tower were conducted in a ZD-1 boundary layer wind tunnel at Zhejiang University, China. The cross-section of the test section is 4 m wide and 3 m high. According to GB 50009-2012 [27], the typical landform of the tower is open terrain, which is Category-A according to GB 50009-2012. The profiles of the mean wind speed and the longitudinal turbulence intensity were taken as the simulated targets of the wind field and have the following forms:
where V(z) and I(z) are the mean wind speed and turbulence intensity at elevation z, respectively, V10 and I10 are the reference mean wind speed and turbulence intensity at reference elevation 10 m, respectively, and α is the power-law exponent. For open terrain, I10 = 0.12 and α = 0.12, according to GB 50009-2012.
Figure 5 shows the profiles of the mean wind speed V and turbulence Iu, in which VH is the reference wind speed with a value of 61.665 m/s at the height of 300 m, corresponding to the height in the wind tunnel of 1.5 m, according to the similarity principle. In the following test, the wind-induced responses of the tower were tested at seven wind speeds (6 m/s, 8 m/s, 10 m/s, 12 m/s, 14 m/s, 16 m/s, and 18 m/s) at the reference height of 1.3 m under wind incidence angles of 0°~90° at an interval of 15°. The testing speeds correspond to 21.05 m/s, 28.07 m/s 35.08 m/s, 42.10 m/s, 49.12 m/s, 56.13 m/s, and 63.15 m/s for the prototype according to the similarity principle. Figure 6 shows the definition of wind incidence angle. In the wind tunnel test, the change of the wind incidence angle was realized by rotating the turning table with the model fixed. When changing the wind incidence angle, it takes about two minutes to stabilize the wind field before measuring the displacement and acceleration.
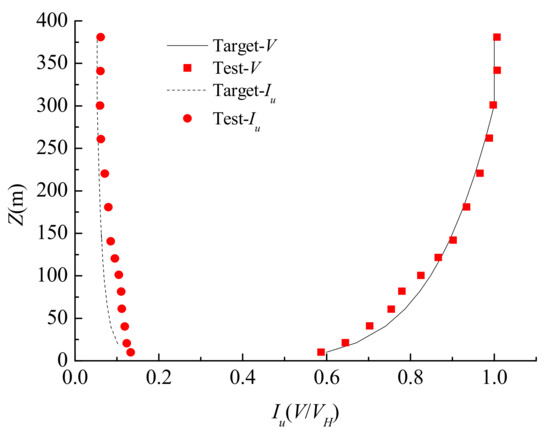
Figure 5.
Profiles of mean wind speed and turbulence intensity.
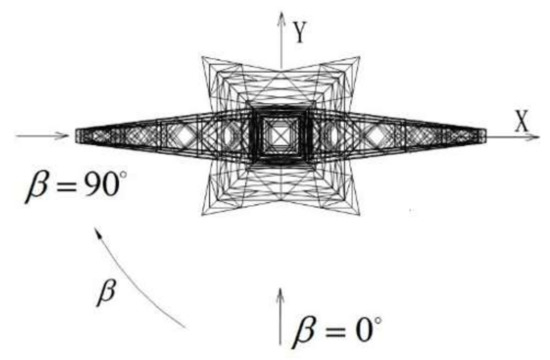
Figure 6.
Definition of wind incidence angle.
4. Results of Wind-Induced Response
4.1. Verification of Test Results
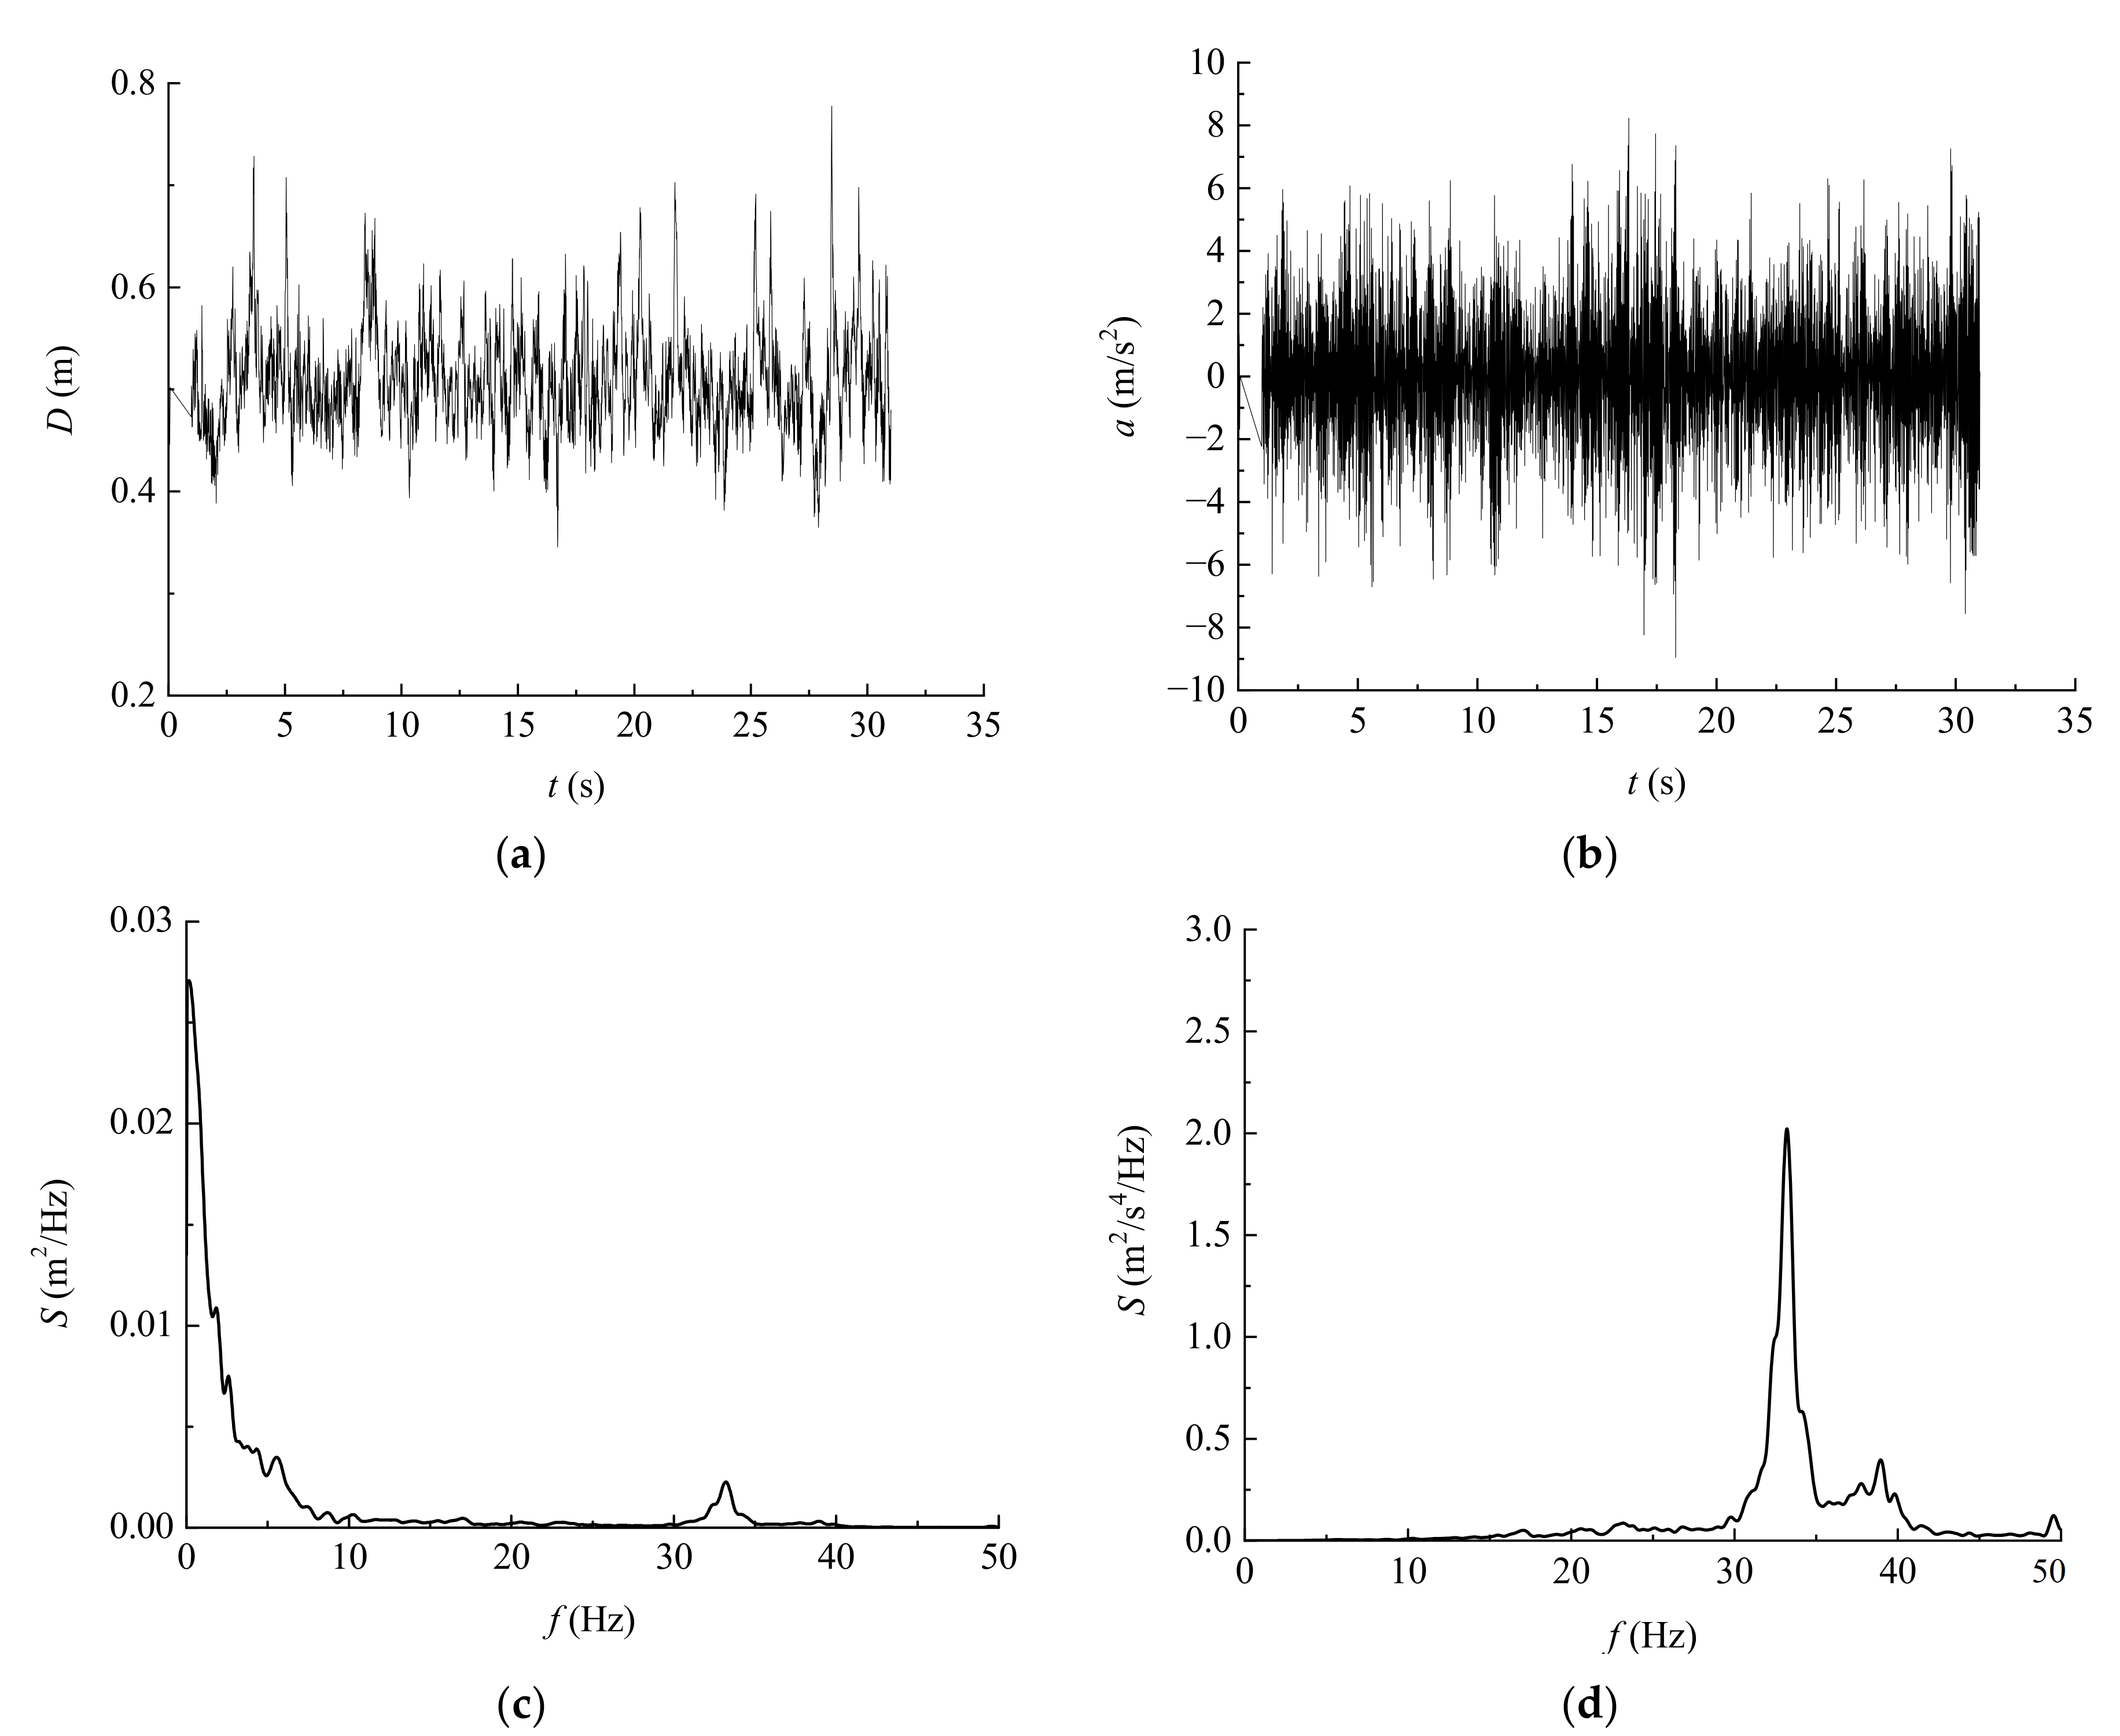
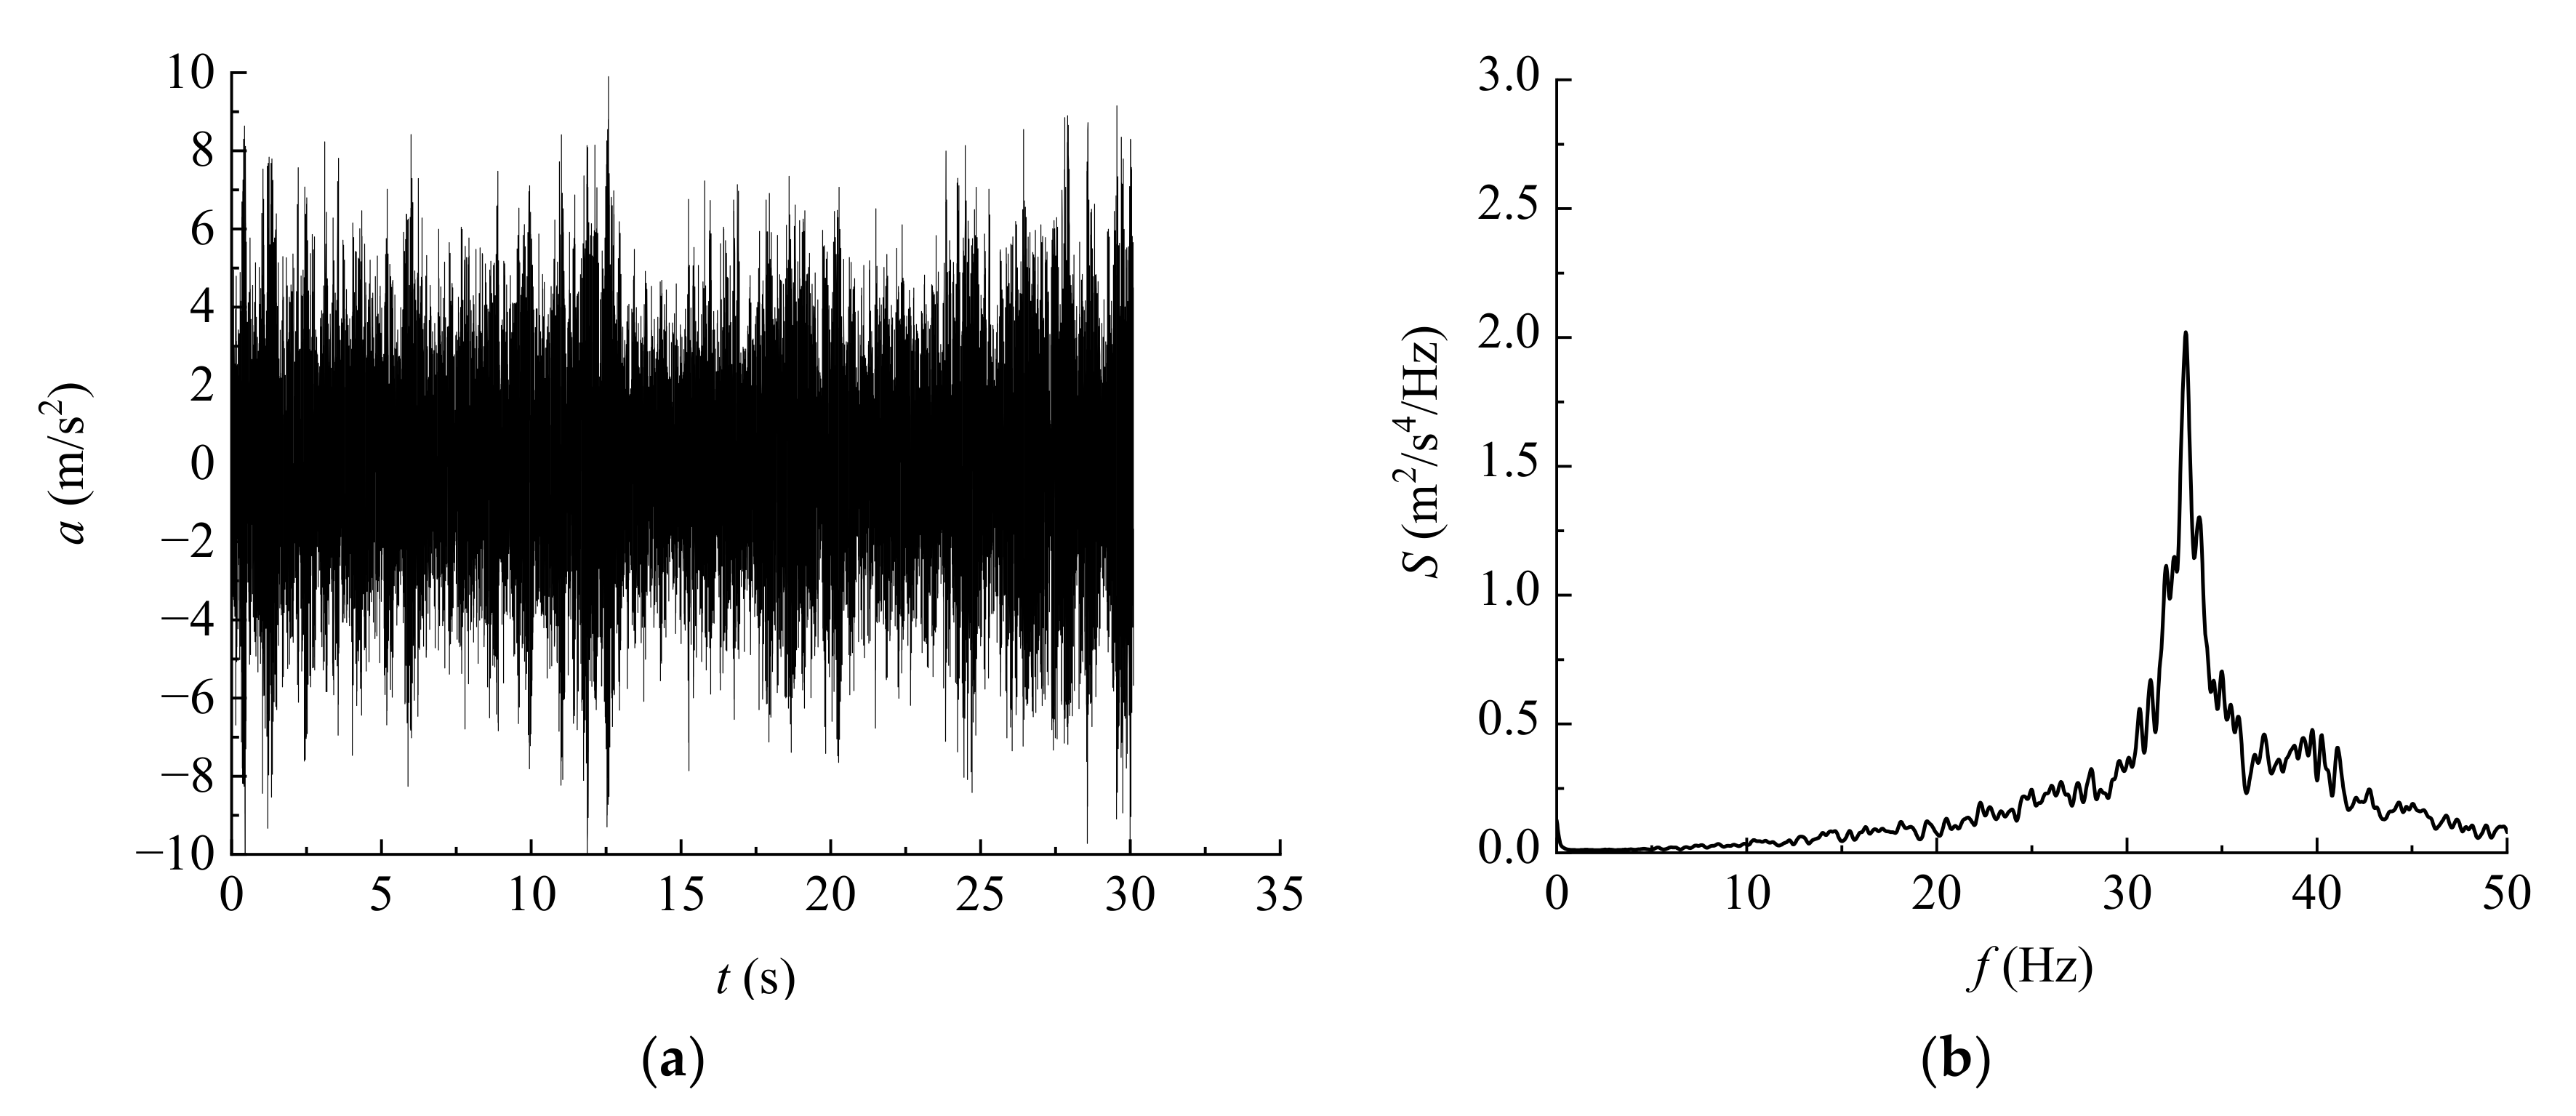
In the following discussion, all data are converted from model data to prototype data by the similarity ratio shown in Table 2. Figure 7a shows the wind-induced displacement atop the tower obtained by the vision-based measuring instrument in the y-direction at a 0° wind incidence angle and a wind speed of 63.15 m/s at 260 m. The acceleration time history a(t) (see Figure 7b) is obtained using the central difference method. Taking constant time step , the acceleration at time i is
where D is displacement and the subscripts i + 1, i and i − 1 are the time spots.

Figure 7.
Wind-induced response obtained by vision-based measurement at 0° (V = 63.15 m/s at 260 m): (a) Displacement atop tower; (b) Acceleration atop tower; (c) Displacement power spectra atop tower; (d) Acceleration power spectra atop tower.
Figure 8 shows the acceleration obtained by the accelerometer. It can be inferred from Figure 7b and Figure 8a that the standard deviations of the acceleration are 2.46 m/s2 (at the height of 359.5 m), calculated by displacement, and 2.47 m/s2 (at the height of 365 m), measured by the accelerometer. The two accelerations nearly coincide, indicating that vision-based displacement testing result is credible.
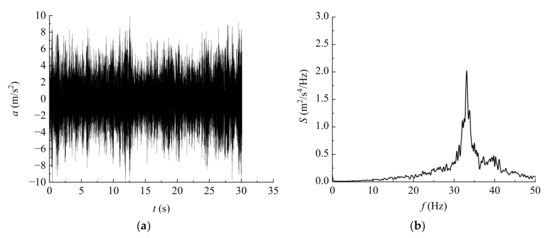
Figure 8.
Wind-induced response obtained by accelerometer at 0° (V = 63.15 m/s at 260 m): (a) Acceleration atop tower; (b) Acceleration power spectra atop tower.
The displacement and acceleration can be expressed as the power spectrums and are shown in Figure 7c,d and Figure 8b,c. The Welch algorithm is used herein, which returns the power spectral density (PSD) estimate of the input signal found using Welch’s overlapped segment averaging estimator. The input signal is divided into the longest possible segments to obtain as close to but not exceeding 8 segments with 50% overlap. Each segment is windowed with a Hamming window. The frequency spectrum of the displacement shows that the displacement is dominated by the background response. In addition, the frequency spectrum of the acceleration shows that the acceleration is mainly dominated by the first-order resonant response.
4.2. Acceleration Response
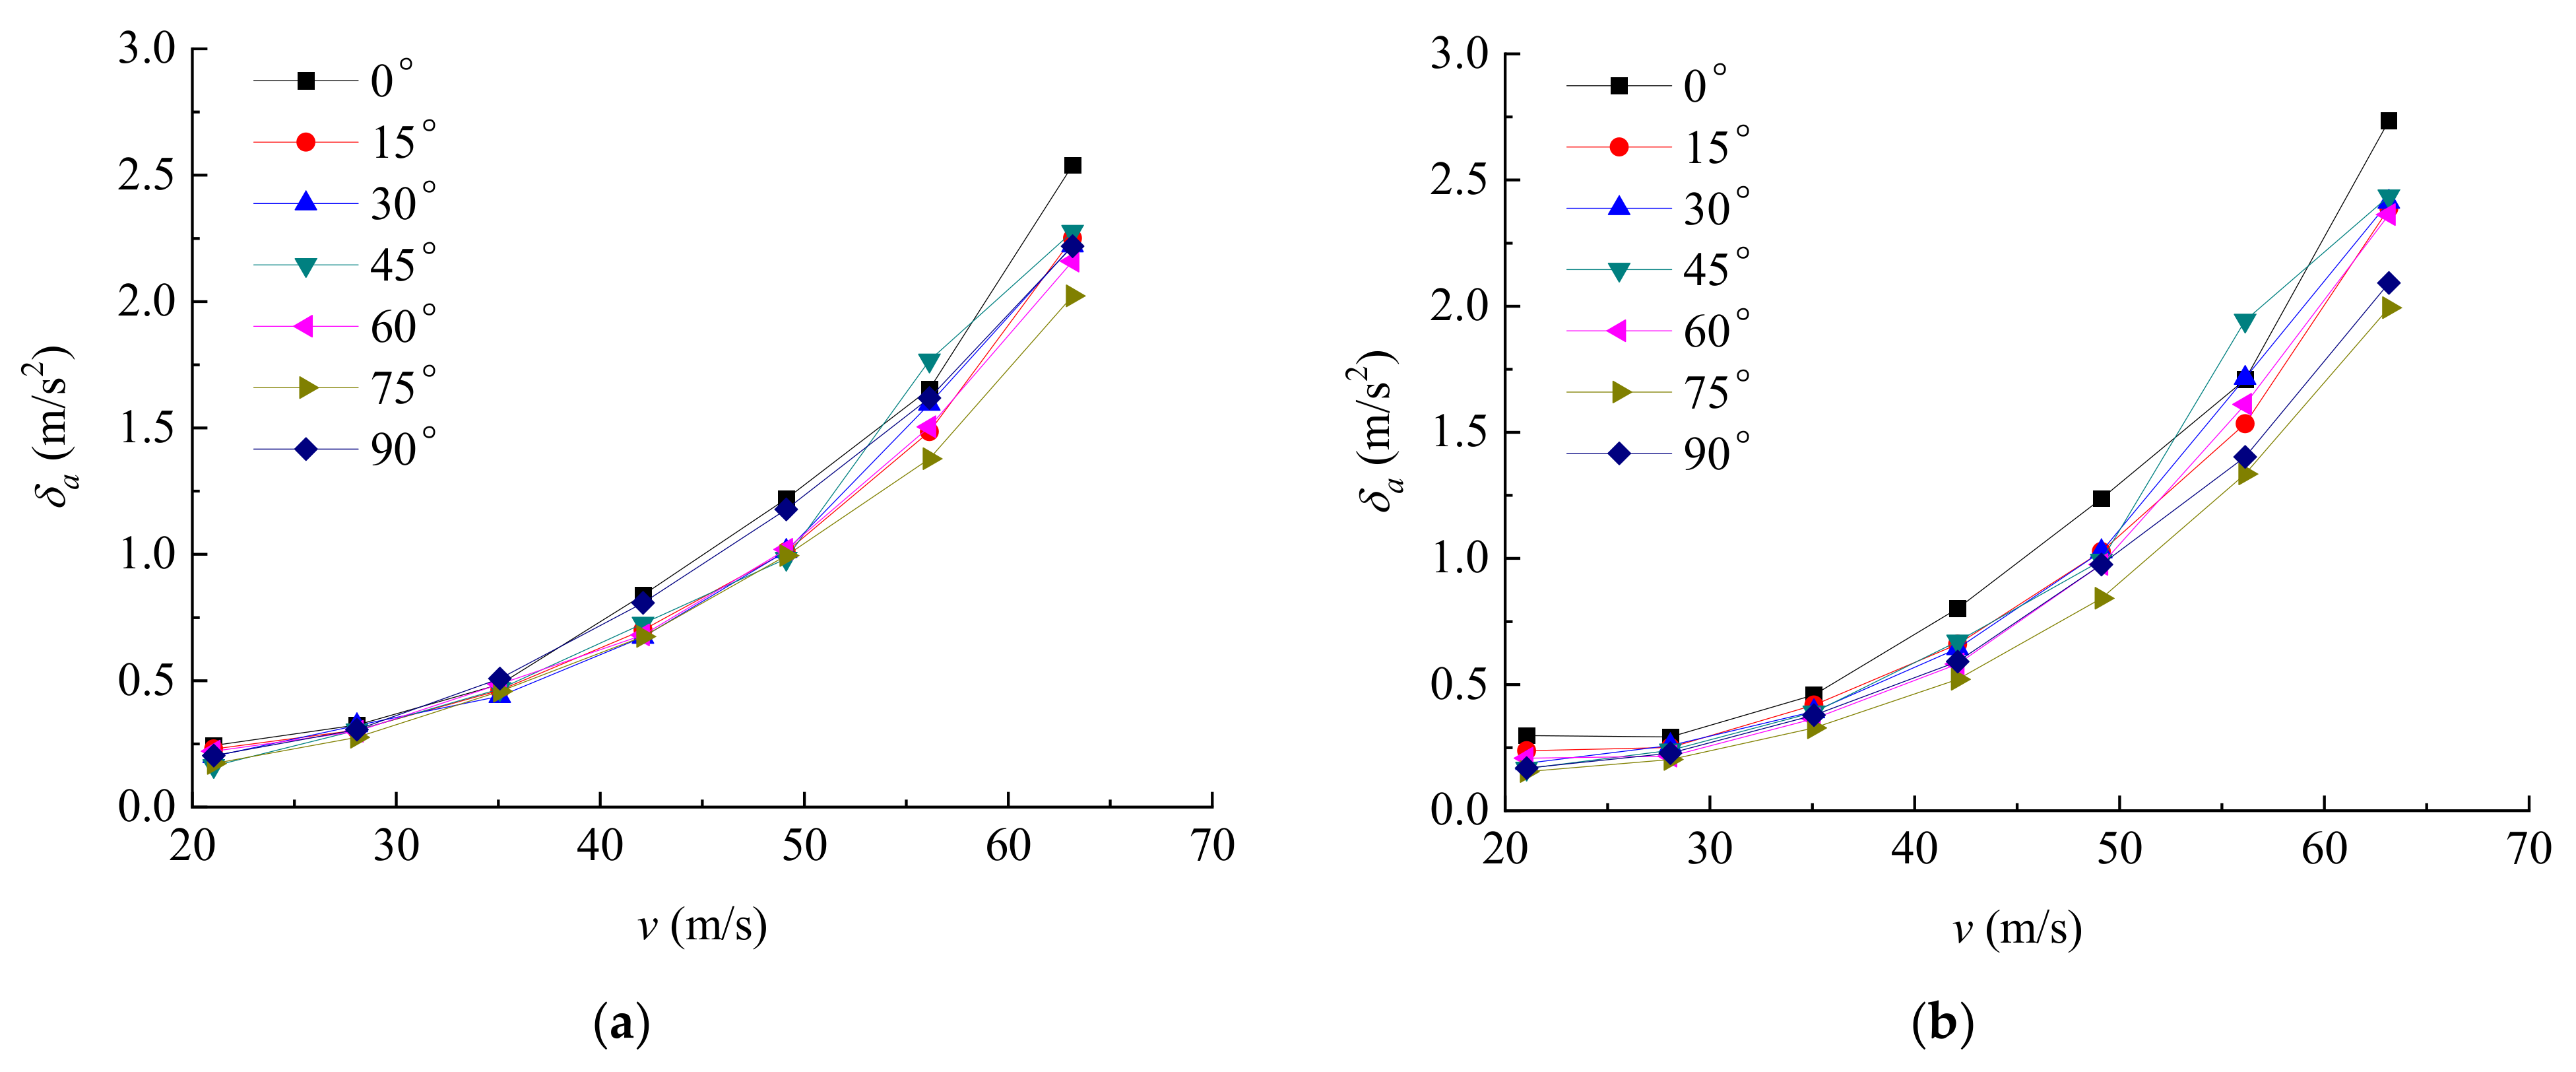
Figure 9 shows the standard deviations of accelerations atop the tower with various wind speeds. It can be found that the accelerations increase with an increase of wind speed. The accelerations in the x-direction and y-direction at various wind incidence angles are almost equal, indicating that the crosswind and along-wind responses are of the same magnitude; similar results can also be found in the field measurement done by Ballio et al. [5] In the structural design of tower, the responses both in the x-direction and y-direction should be considered.
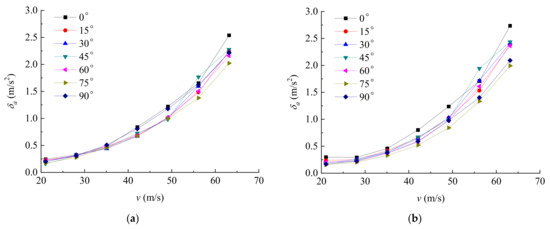
Figure 9.
Acceleration responses of the top of the transmission tower: (a) y-direction; (b) x-direction.
4.3. Displacement Response
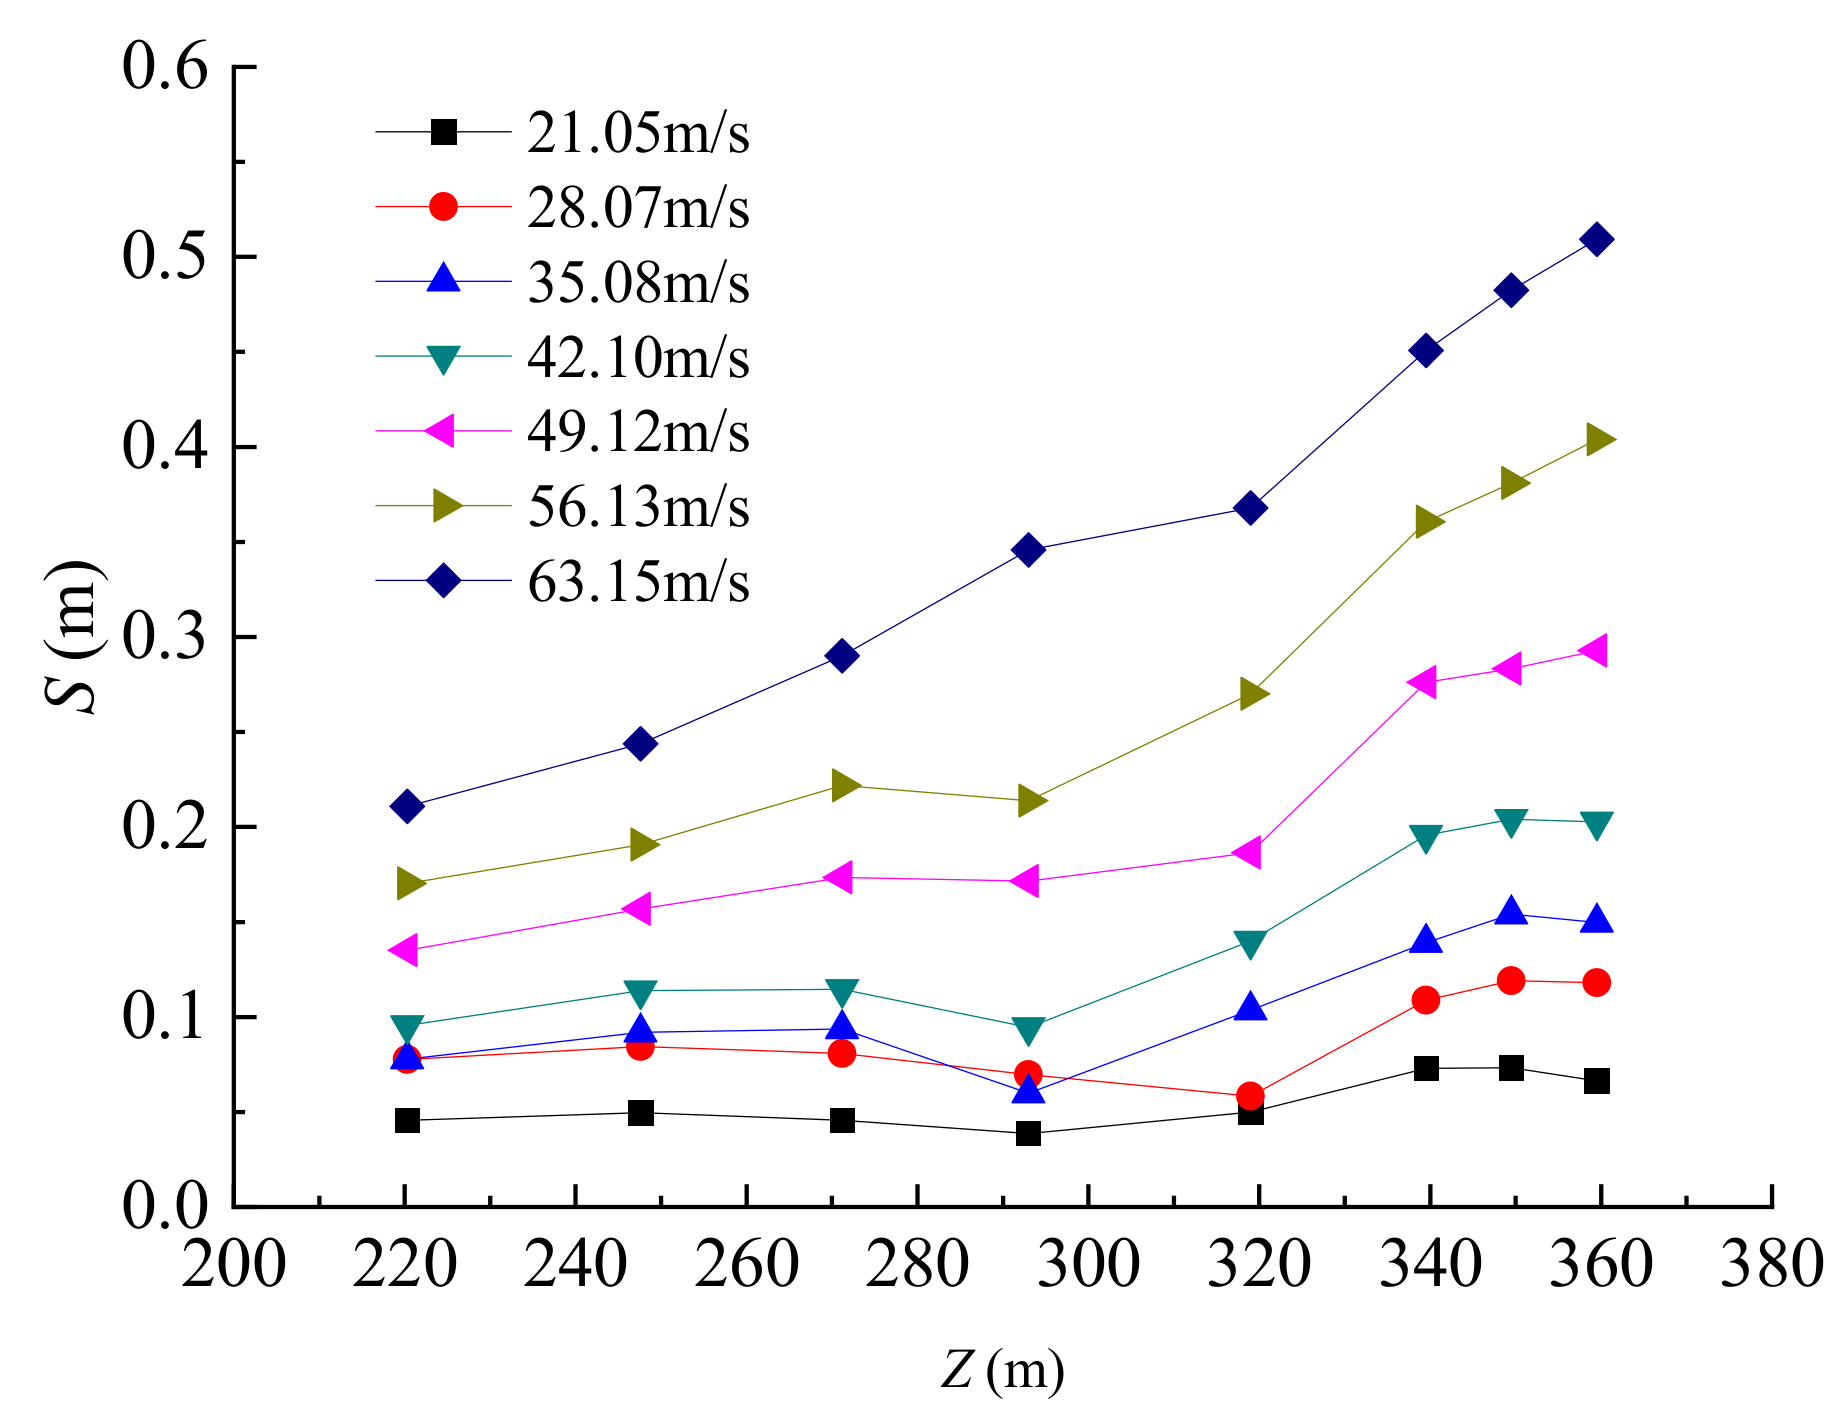
Figure 10 shows the mean displacement in the y-direction when the wind incidence angle is 0°. The displacement increases with the increase of height and has a rapid increase at the height of about 293 m. This may be due to the fact that the crossarms are located at this height, which makes the projected area increase suddenly. The displacements also increase with the increase of the wind speed. When the wind speed is 56.13 m/s at the 260 m, the maximum displacement is 0.41 m at the height of 359.5 m. Considering the wind load correction factor due to the Reynolds number of 0.75 [28], the maximum displacement can then be determined as 0.37 m. According to the finite element calculation result, the maximum displacement is 0.38 m at 365 m. The two displacements almost coincide.
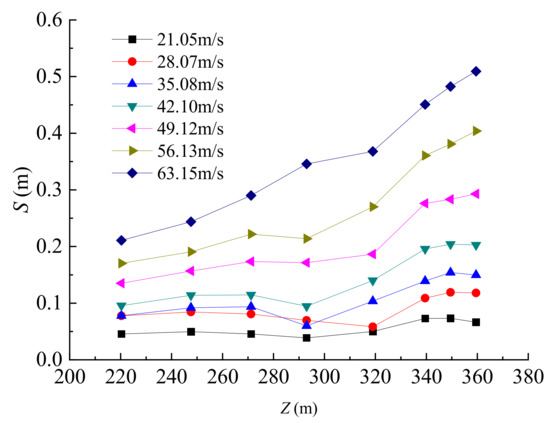
Figure 10.
Mean displacement in y-direction at 0°wind incidence angle.
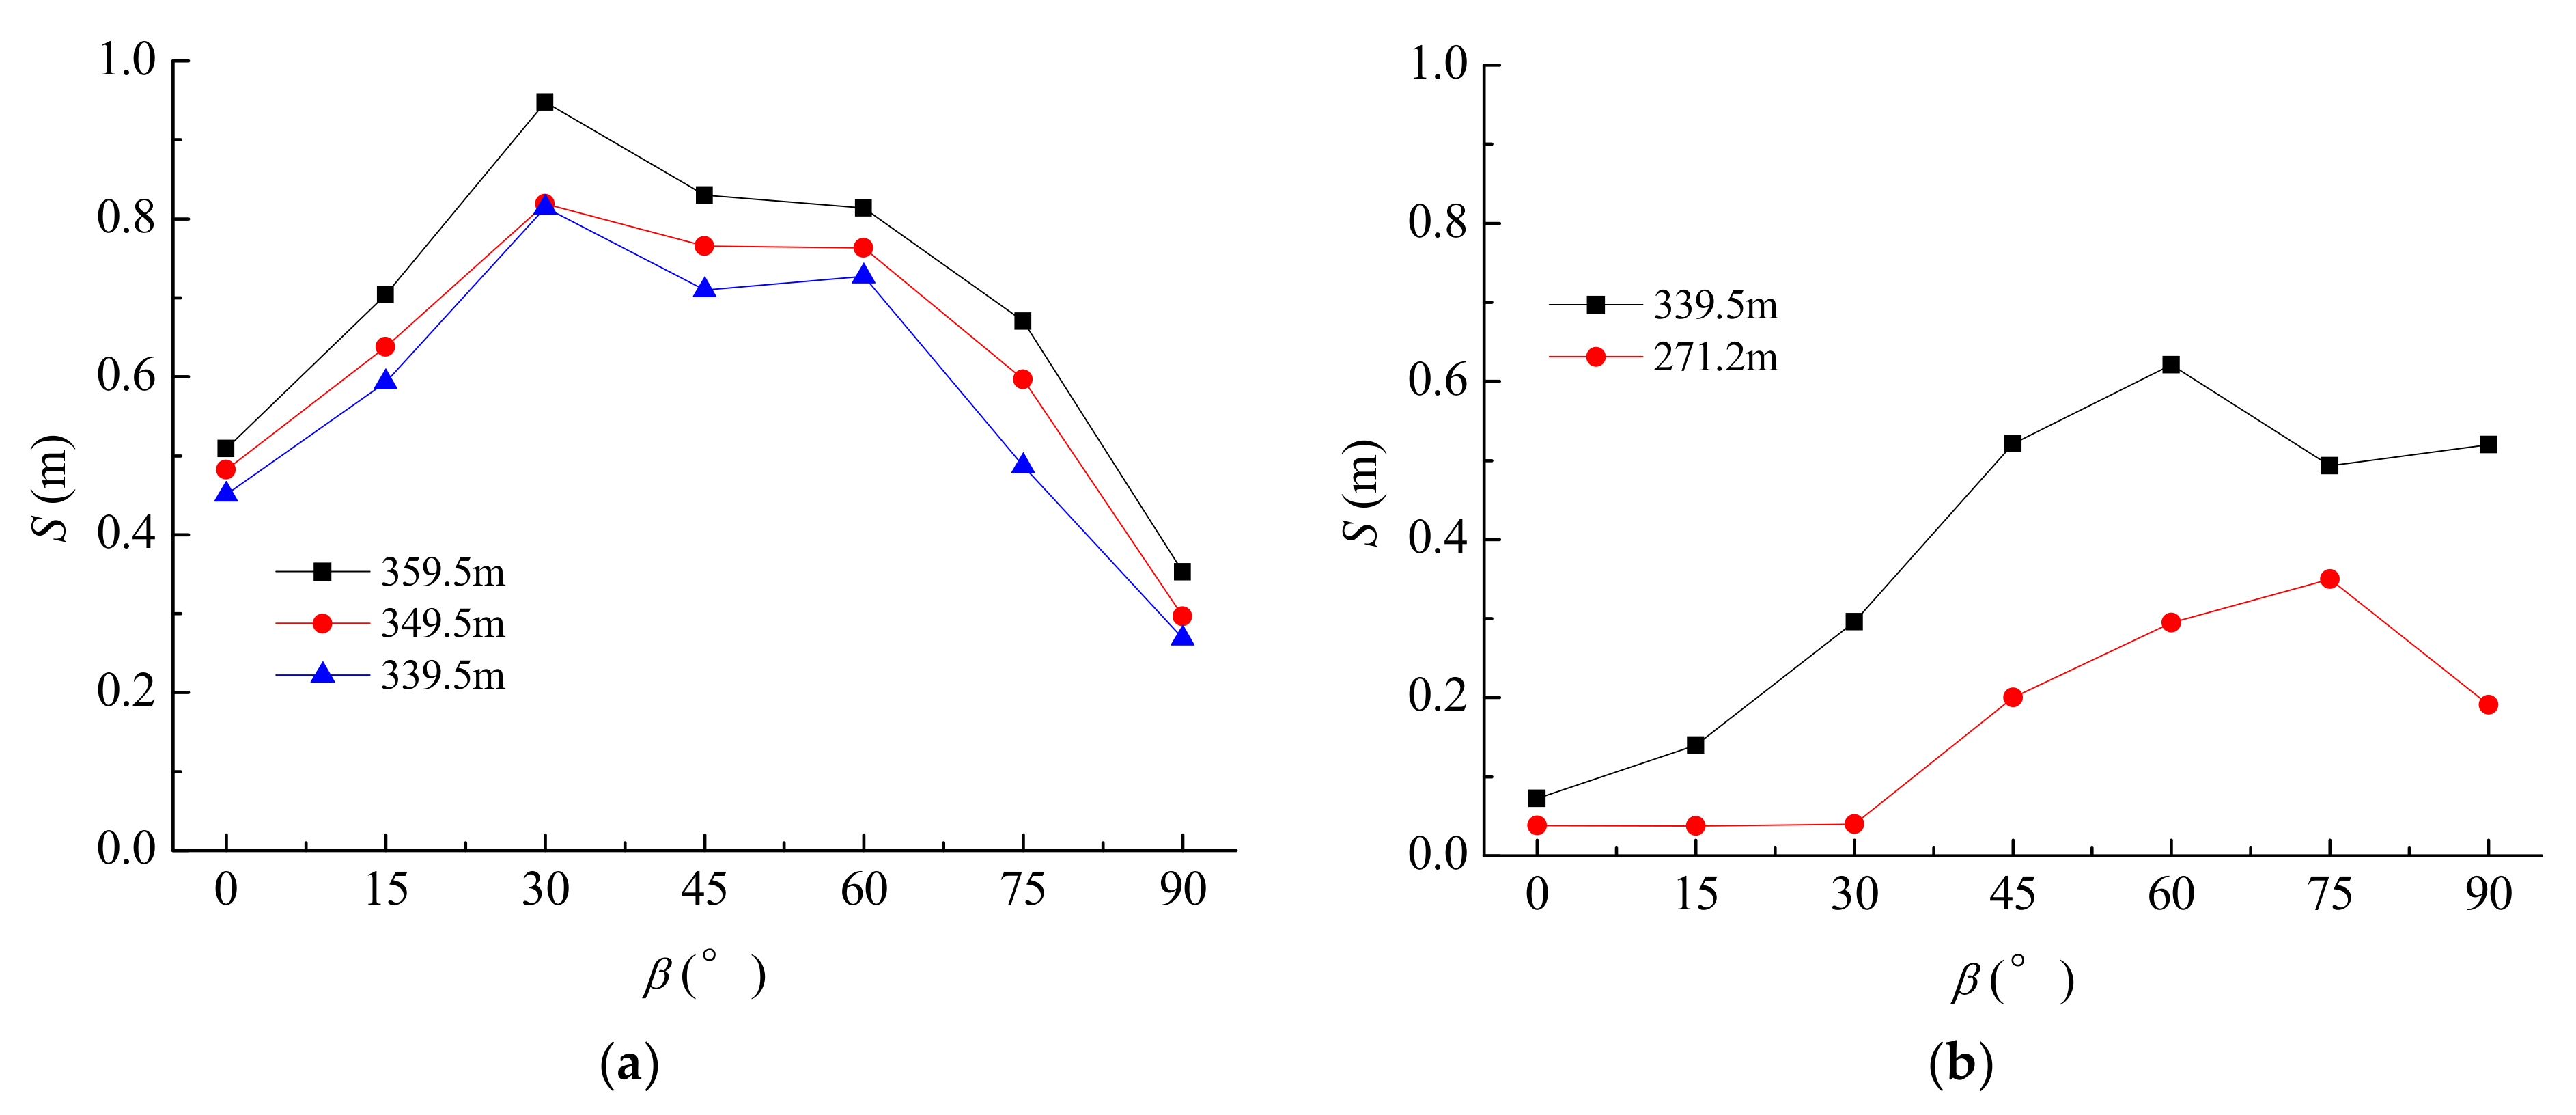
Figure 11 shows the mean displacement in the y-direction and x-direction under seven wind incidence angles when the wind speed is 56.13 m/s at 260 m. It can be found that the mean displacement under each wind incidence angle increases with the increase of height. In the y-direction, the mean displacement reaches its maximum value when the wind incidence angle is 30°. In the x-direction, the mean displacement arrives at its maximum value at the wind incidence angle of 60°~75°. Except for the wind incidence angle of 75°~90°, the mean displacement at 339.5 m in the y-direction is greater than that in the x-direction.
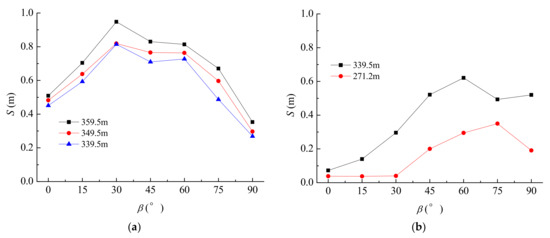
Figure 11.
Mean displacement at different wind incidence angles: (a) y direction; (b) x direction.
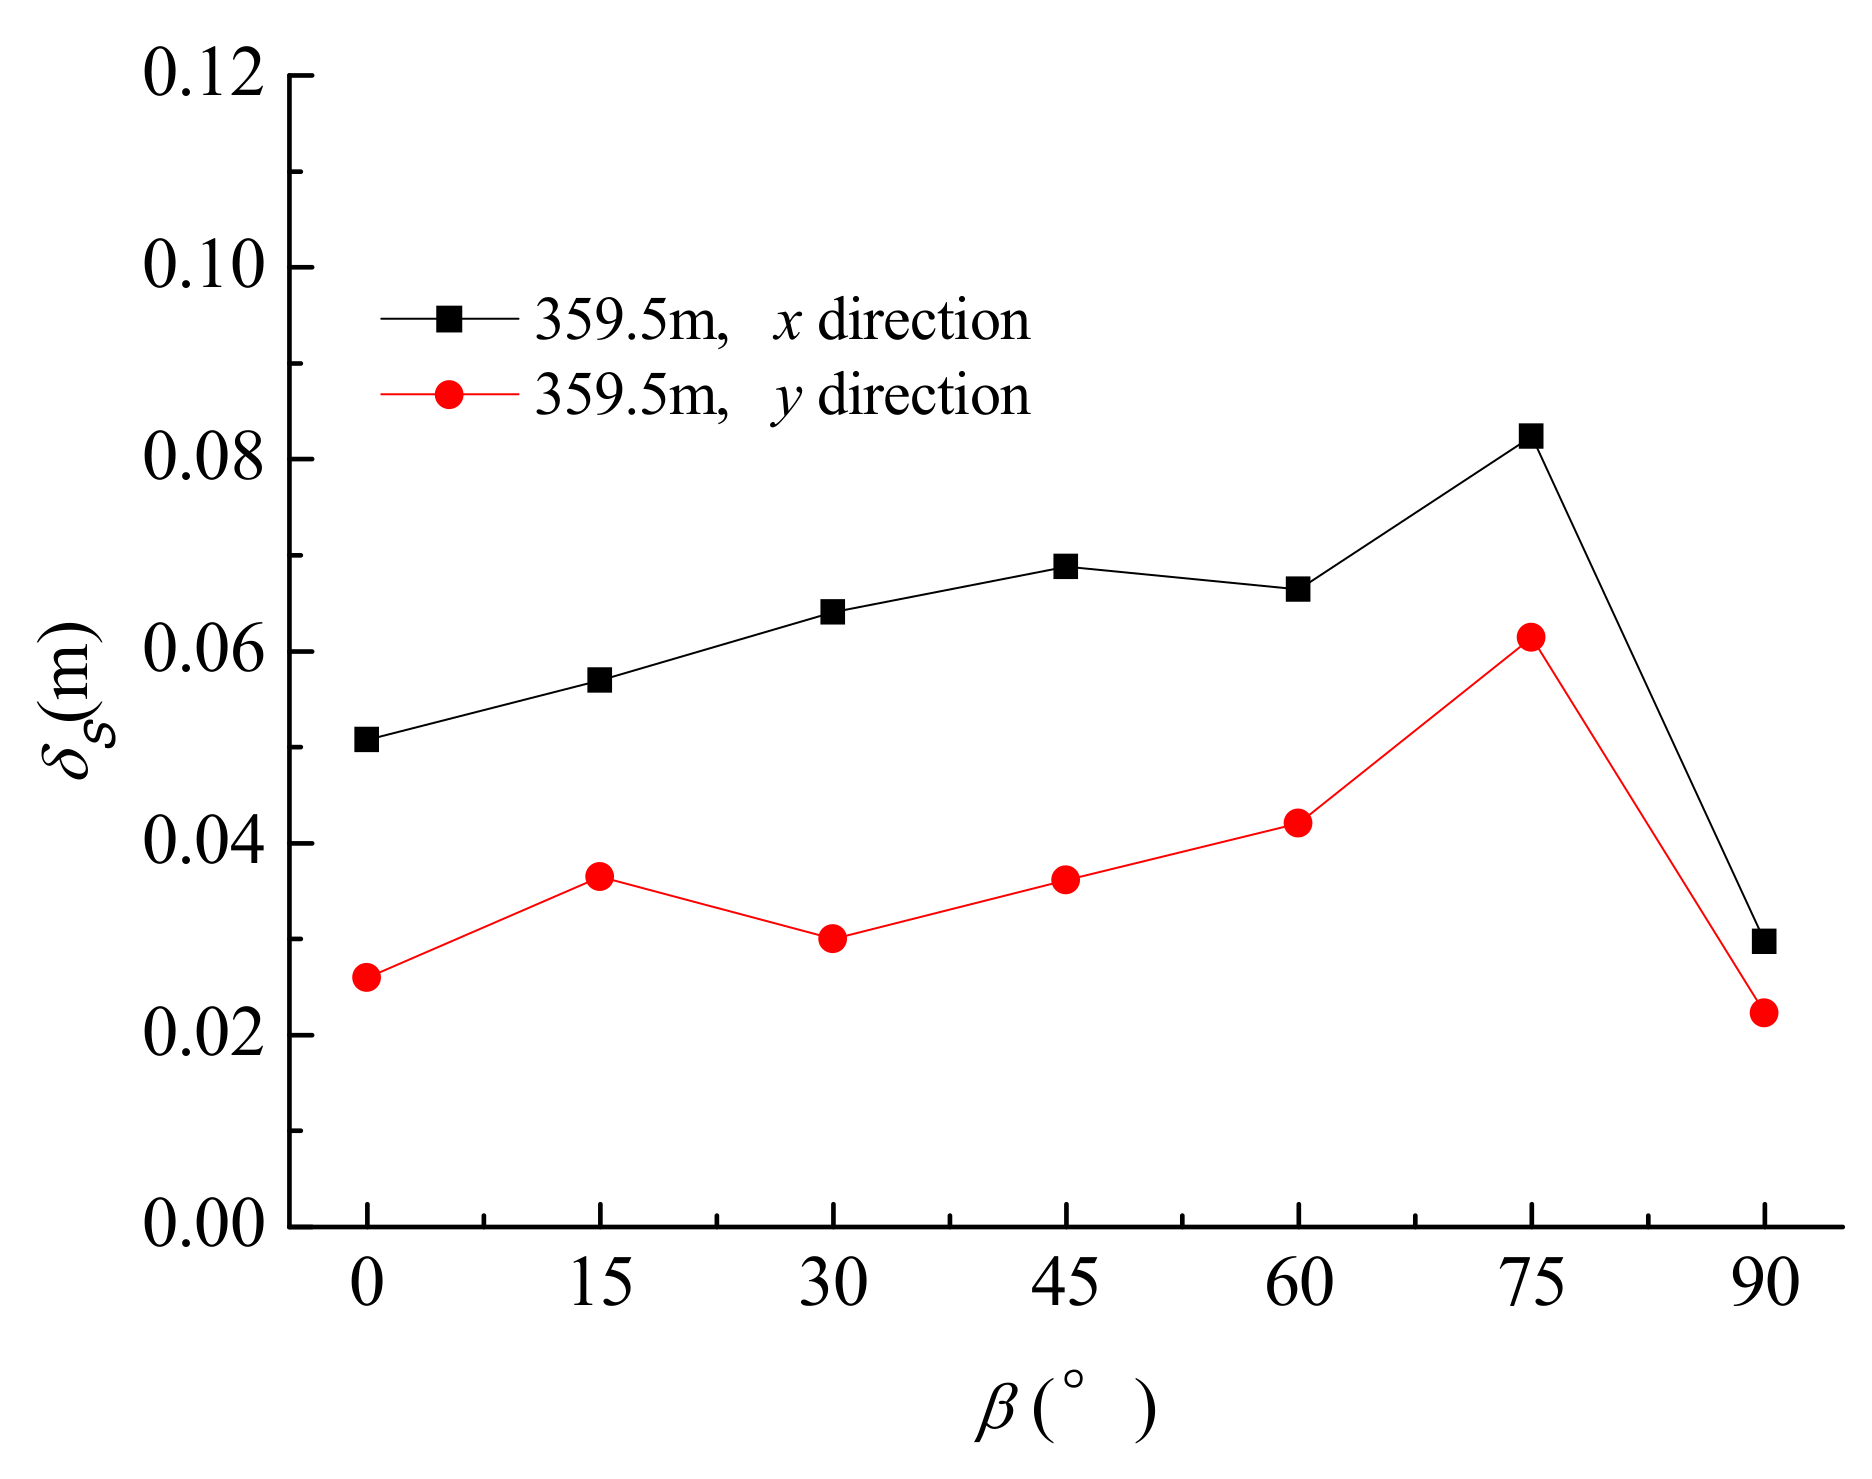
Figure 12 shows the standard deviation of the displacement under different wind incidents at 359.5 m. The maximum standard deviation of the displacement in the y-direction and x-direction appears at the wind incidence angle of 75°. The standard deviation of displacement in the x-direction is greater than that in the y-direction. When the wind incidence angle is 90°, they tend to be consistent. Therefore, the influence of wind incidence angle on the wind-induced response of the tower should be considered in the structural design. Furthermore, since the standard deviation of displacement in the crosswind direction at most angles is significantly larger than that in the along-wind direction, it should be given more attention.

Figure 12.
Standard deviation of displacement under different wind incidence angles.
5. Gust Response Factor
The wind acting on the structure includes static and dynamic loads. The gust response factor βz is defined as the ratio of the dynamic wind load (Peq + Pc) to the static wind load Pc and has the form of
Adopting the mode decomposition method, the equivalent static load Peq(z) of the structure is
where m is the mass of each component and qi and ωi are the generalized coordinate and circular frequency of the i-th mode, respectively.
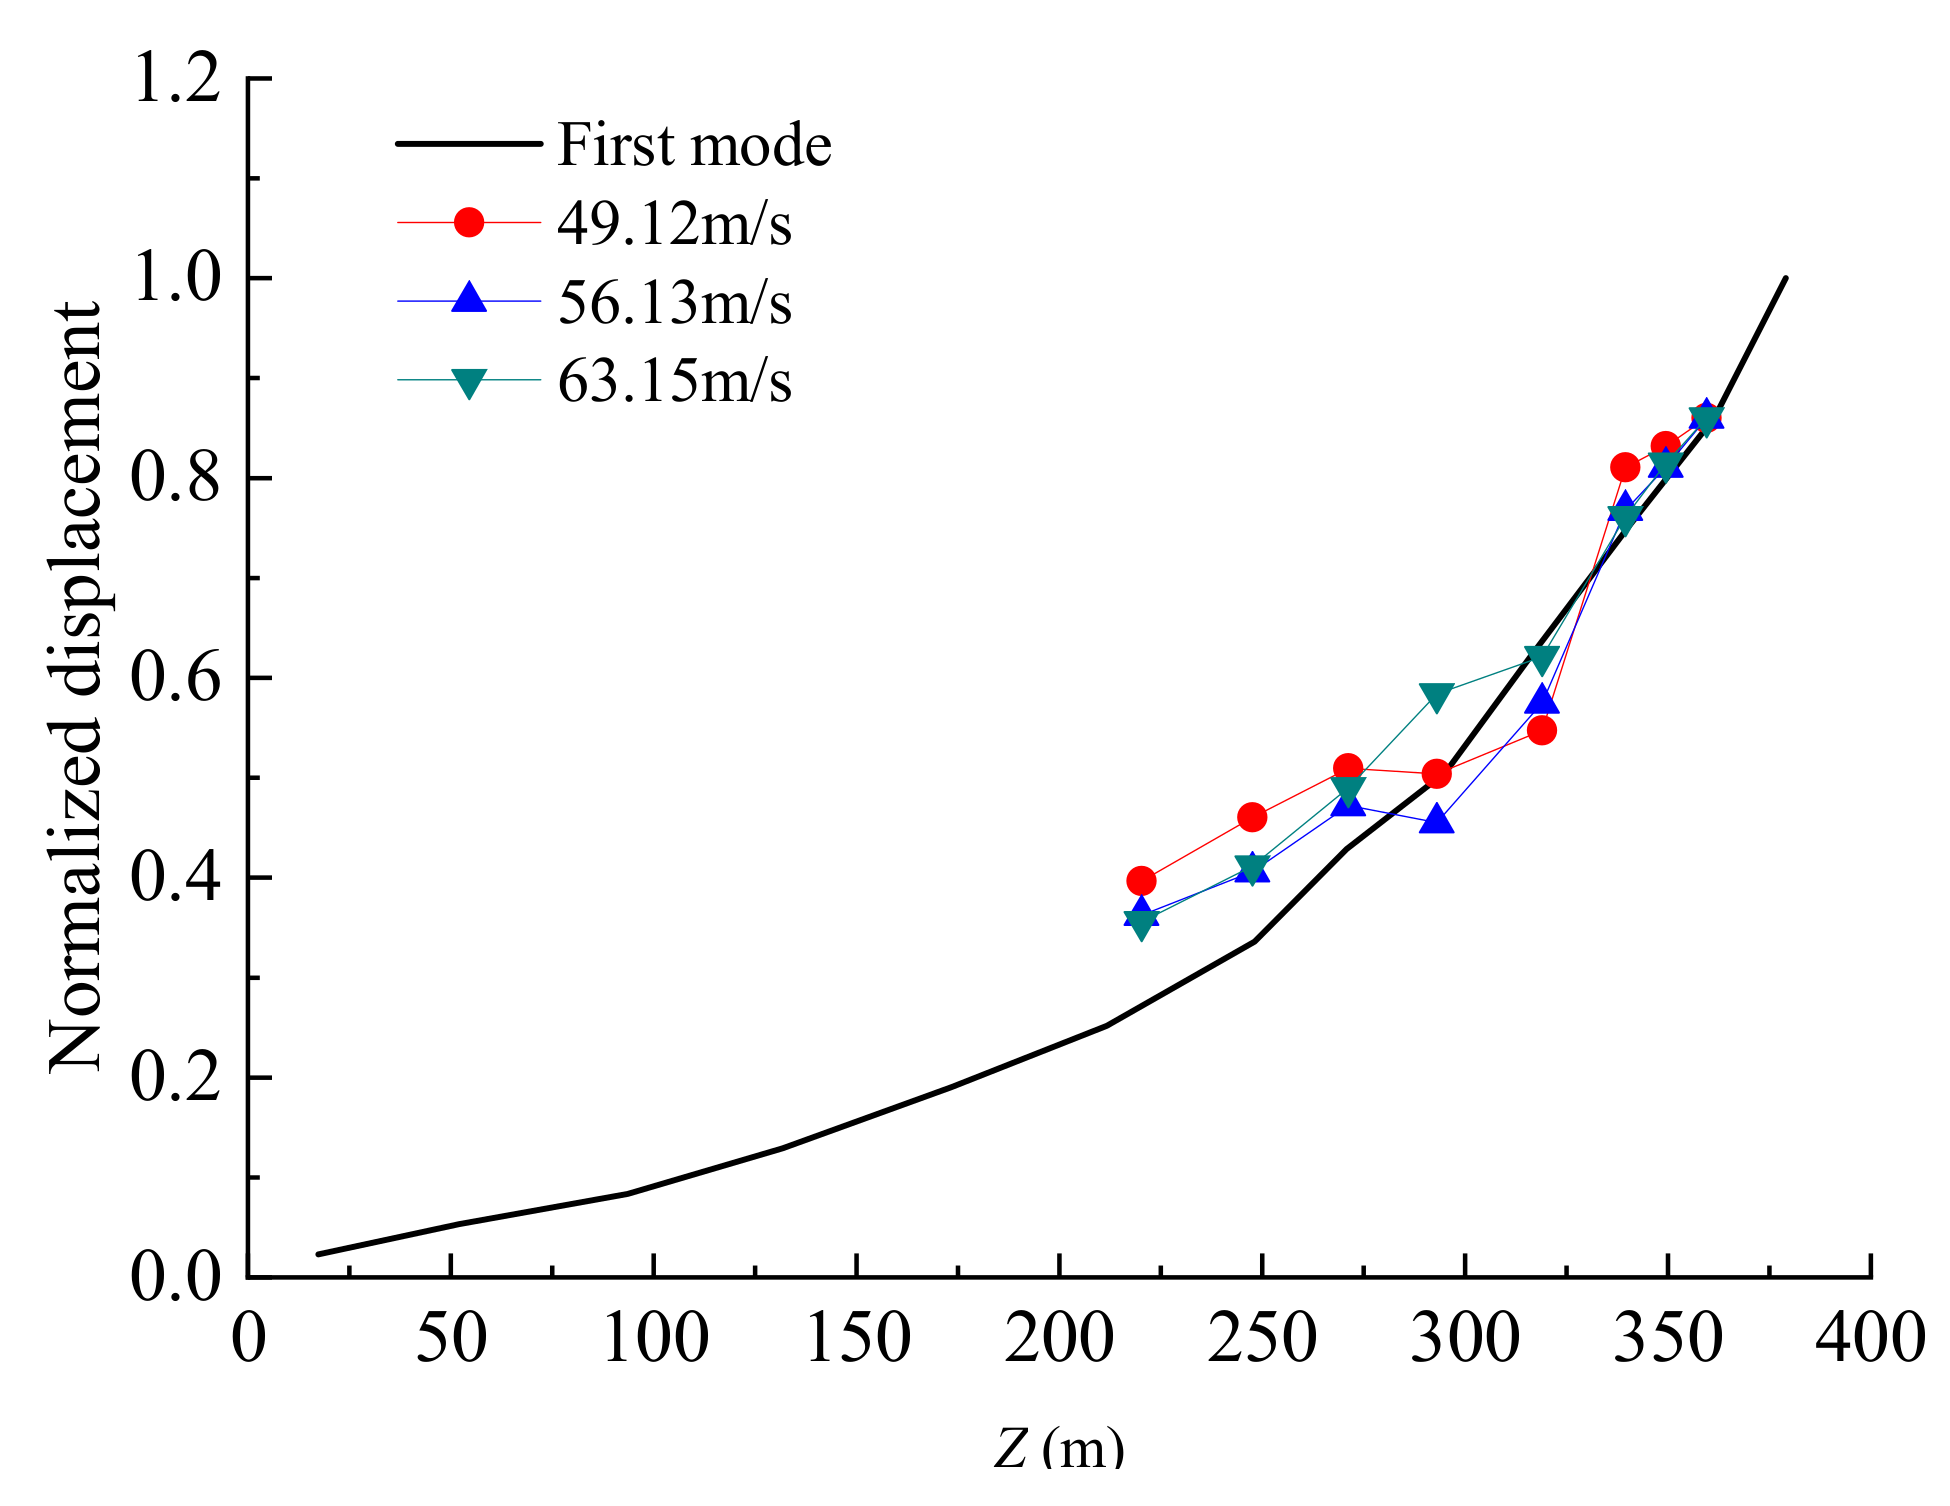
Figure 13 shows the normalized displacement in the y-direction at wind incidence angle 0° when the wind speeds are 49.12 m/s, 56.13 m/s, and 63.15 m/s at 260 m. The first-order mode shape is also plotted in the figure. It can be seen that the measured displacement is almost distributed according to the first-mode shape; therefore, the first-order mode can be used to fit the measured displacement. Then, the test results of the aeroelastic model can be substituted for φ1q1 in Equations (11) and (12) to obtain the gust response factor of the tower.
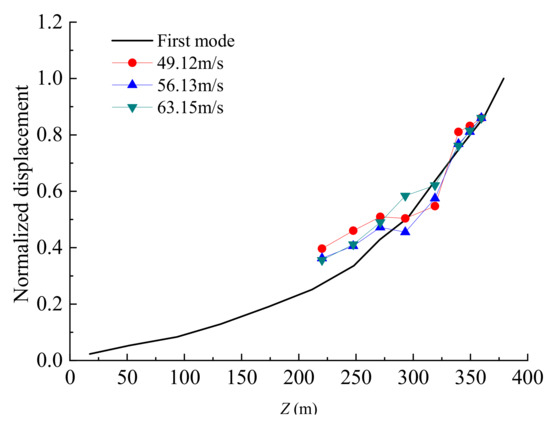
Figure 13.
Normalized displacement in y-direction at the wind incidence angle 0°.
In order to have a total view of dynamic effect, the gust response factor of the base bending moment is employed, which is the ratio of the dynamic base bending moment to the mean one. Table 4 shows the comparison of the gust response factor of the base bending moment obtained by the wind tunnel test, numerical simulation, and codes, where the damping ratio is 0.01 and the peak factor g is 2.5. The results of the numerical simulation were obtained by step-by-step transient analysis in ANSYS. It can be found that the gust response factor obtained from the wind tunnel test in the y-direction and x-direction are closer to that obtained by numerical simulation. However, the two results are both smaller than those calculated by GB 50009-2012 [27] and GB 50135-2006 [29]. This is mainly due to the fact that the gust response factor of the test and the simulation can take into consideration mass distribution along the height, especially the concrete- filled steel tube in the lower part of the tower, whereas the equation in the codes is confined to an equal mass distribution. A similar conclusion can also be found in the work of Zhao et al. [30].
Table 4.
Comparison of gust response factor of base bending moment.
Table 5 presents the comparison of gust response factors of transmission towers, which include different heights and different types of transmission towers, such as tube transmission tower, angle transmission tower, and hybrid transmission towers. It can be found that the result of the present study is quite close to that of Yang et al. [31]. In general, the gust response factor of the angle transmission tower is larger than that of the tube tower. The main reason is that the rigidity of the tube steel tower is greater than than that of the angle steel, and a stiffer tower will result in a smaller gust response factor.
Table 5.
Comparison of gust response factor of base bending moment in y direction.
6. Conclusions
The aeroelastic model wind tunnel test and finite element calculation were conducted to obtain the wind-induced response of a long-span tower. The main contributions of this investigation to the wind-resistant design of an electrical transmission tower are as follows.
The measured frequencies of the aeroelastic model are close to the designed frequency. The acceleration calculated by displacement almost coincides with that measured by the accelerometer, indicating that a vision-based displacement instrument can record well the vibration of the model tower in the wind tunnel.
The displacement of the tower is dominated by the background response, whereas the acceleration is mainly dominated by the first-order resonant response. The accelerations in the x-direction and y-direction are almost equal, indicating that the crosswind and along-wind responses are of the same magnitude. The displacement atop the tower obtained from the test after considering the Reynolds number correction almost coincides with that from the numerical simulation.
The gust response factors obtained from the test are close to those obtained by numerical simulation. However, the two results are both smaller than those calculated by GB 50009-2012 and GB 50135-2006 because the equations in the codes cannot consider the uneven mass distribution along the height.
Due to the limitation of equipment, only the displacement of the upper part of the tower and the acceleration atop tower were measured in the present study, which cannot reflect the response of the whole tower. This requires further study.
Author Contributions
Conceptualization, J.Y. and G.S.; methodology, J.Y., Z.T., Y.C. and W.L.; investigation, J.Y. and Z.T.; writing—original draft preparation, J.Y. and G.S.; writing—review and editing, Y.C. All authors have read and agreed to the published version of the manuscript.
Funding
This research is partially supported by the National Natural Science Foundation of China under Grant No. 51838012, 51878607 and 52178511. These supports are greatly appreciated. The opinions and statements do not necessarily represent those of the sponsors.
Institutional Review Board Statement
Not applicable.
Informed Consent Statement
Not applicable.
Data Availability Statement
Not applicable.
Conflicts of Interest
The authors declare no conflict of interest.
References
- Xie, Q.; Zhang, Y.; Li, J. Investigation on Tower Collapses of 500 kV Ren-Shang 5237 Transmission Line Caused by Downburst. Power Syst. Technol. 2006, 30, 59–63. [Google Scholar]
- Yin, H.J. Wind-Induced Response and Vibration Control of Long-Span Transmission System. Master’s Thesis, Wuhan University of Technology, Wuhan, China, 2003. [Google Scholar]
- Guo, Y. Study on Wind-Induced Dynamic Response and Vibration Control of Long Span Transmission Line System. Master’s Thesis, Zhejiang University, Hangzhou, China, 2006. [Google Scholar]
- Jung, S.H.; Huh, J.H. A novel on transmission line tower big data analysis model using altered K-means and ADQL. Sustainability 2019, 11, 3499. [Google Scholar] [CrossRef]
- Ballio, G.; Maberini, F.; Solari, G. A 60 Year Old, 100 m High Steel Tower: Limit States under Wind Actions. J. Wind Eng. Ind. Aerod. 1992, 43, 2089–2100. [Google Scholar] [CrossRef]
- Liu, Q.; Yang, J.C.; Zhou, L.B. Research of coupling viberation between stel-tower Frame and Conductor for HV overhead lines. Electr. Power China 1997, 30, 9–49. [Google Scholar]
- He, M.J.; Yang, B.F. Site Vibration Experiment of Jiang Yin 500kV Guyed Transmission Tower. Struct. Eng. 2003, 4, 74–79. [Google Scholar]
- Yasui, H.; Marukawa, H.; Momomura, Y.; Ohkuma, T. Analytical study on wind-induced vibration of power transmission towers. J. Wind Eng. Ind. Aerod. 1999, 83, 431–441. [Google Scholar] [CrossRef]
- Loredo-Souza, A.M.; Davenport, A.G. The Influence of The Design Methodology in The Response of Transmission Towers to Wind Loading. J. Wind Eng. Ind. Aerod. 2003, 91, 995–1005. [Google Scholar] [CrossRef]
- Yao, D.; Shen, G.H.; Pan, F.; Xing, Y.; Guo, Y. Wind-Induced Dynamic Response of Transmission Tower Using Vector-Form Intrinsic Finite Element Method. Eng. Mech. 2015, 32, 63–70. [Google Scholar]
- Zhu, N.; Sparling, B.F.; King, J.P.C. Comparison of aeroelastic wind tunnel tests and frequency domain analyses of guyed mast dynamics response. Can. J. Civil. Eng 2011, 38, 984–997. [Google Scholar]
- Yang, F.L.; Deng, H.Z.; Niu, H.W.; Zhang, H.; Zhu, B. Wind Tunnel Tests on Wind Loads Acting on an Angled Steel Triangular Transmission Tower. J. Wind Eng. Ind. Aerodyn. 2016, 156, 93–103. [Google Scholar] [CrossRef]
- Carril, C.F., Jr.; Isyumov, N.; Brasil, R.M. Experimental study of the wind forces on rectangular latticed communication towers with antennas. J. Wind Eng. Ind. Aerod. 2003, 91, 1007–1022. [Google Scholar] [CrossRef]
- Wang, S.C.; Sun, B.N.; Lou, W.J.; Ye, Y. Wind Tunnel Test and Theoretical Analysis on Aeroelastic Model of Single-Rod Transmission Tower. J. Zhejiang Univ. Eng. Sci. 2005, 39, 88–92. [Google Scholar]
- Deng, H.Z.; Zhu, S.Y.; Chen, X.M.; Wang, Z.M. Wind Tunnel Investigation on Model of Long Span Transmission Line System. J. Tongji Univ. 2003, 31, 132–137. [Google Scholar]
- Cheng, Z.J.; Fu, G.H.; Lou, W.J.; Sun, B.N. Research for the Wind Force on High-Rise Latticed Tower. J. Exp. Mech. 2000, 15, 51–55. [Google Scholar]
- Fu, G.H.; Cheng, Z.J.; Sun, B.N.; Tang, J.C. Research for the Wind-Induced Vibration of the Overhead Power Transmission Line System. Exp. Meas. Fluid Mech. 2001, 15, 16–22. [Google Scholar]
- Li, Z.L.; Xiao, Z.Z.; Han, F.; Yan, Z.T. Aeroelastic Model Design and Wind Tunnel Tests of 1000 kV Hanjiang Long Span Transmission Line System. Power Syst. Technol. 2008, 32, 5–9. [Google Scholar]
- Guo, Y.; Sun, B.N.; Ye, Y.; Shen, G.H.; Lou, W.J. Wind Tunnel Test on Aeroelastic Model of Long Span Transmission Line System. J. Zhejiang Univ. Eng. Sci. 2007, 41, 1482–1486. [Google Scholar]
- Xiong, T.H.; Liang, S.G.; Zou, L.H. Wind Loading Identification of Transmission Towers Based on Wind Tunnel Tests of Full Aero-Elastic Model. J. Build. Struct. 2010, 31, 48–54. [Google Scholar]
- Zhao, G.F.; Xie, Q.; Liang, S.G.; Li, J. Wind Tunnel Test on Wind-induced Nonlinear Vibrations of High-voltage Transmission Tower-line Coupling System. J. Tongji Univ. Nat. Sci. 2009, 37, 1157–1164. [Google Scholar]
- Song, J.; Liang, S.G.; Mei, X.H.; Zou, L. Wind-induced tension and deflection of multi-span bundled transmission conductors using aeroelastic model wind tunnel test. Eng. Struct. 2022, 256, 114011. [Google Scholar] [CrossRef]
- Li, Z.L.; Ren, K.; Xiao, Z.Z.; Wang, Z.S.; Yu, K. Aeroelastic Model Design and Wind Tunnel Tests of UHV Transmission Line System. Acta Aerodyn. Sin. 2011, 29, 102–106. [Google Scholar]
- Liang, Z.P.; Li, Z.L. An Aeroelastic Model Design of Ultra-High Voltage Power Transmission Line Systems. J. Chongqing Univ. 2009, 32, 131–136. [Google Scholar]
- Xiao, Z.Z.; Li, Z.L.; Wang, Z.S.; Yan, Z.T.; Ren, K. Wind-induced Vibration Analysis of UHV Transmission Tower Based on the HFFB Tests. Eng. Mech. 2010, 27, 218–225. [Google Scholar]
- Nyquist, H. Certain topics in telegraph transmission theory. Trans. Am. Inst. Electr. Eng. 1928, 47, 617–644. [Google Scholar] [CrossRef]
- GB50009-2012; Load Code for the Design of Building Structures. China Architecture and Building Press: Beijing, China, 2012.
- Xu, J.P. Key Technology of Design and Construction of 500 Kv Overhead Long Span Transmission Tower-Line; China Electric Power Press: Beijing, China, 2022. [Google Scholar]
- GB 50135-2006; Code for Design of High-Rising Structures. China Planning Publishing House: Beijing, China, 2006.
- Zhao, S.; Yan, Z.T.; Li, Z.L.; Dong, J.Y.; Wang, L.Z. Investigation on wind-induced vibration coefficients of Sutong long span transmission tower based on wind tunnel tests. J. Build. Struct. 2019, 40, 35–44. [Google Scholar]
- Yang, F.L.; Chen, B.; Xu, Z.Y.; Xu, Q.; Shao, S. Study on Wind-induced Vibration Coefficients of the Transmission Tower in 500 kV Long Span Line Crossing the Yangtze River. Proc. CSEE 2022, 42, 2542–2556. [Google Scholar]
- Yang, J.B.; Niu, H.W.; Hua, X.G.; Wu, J.; Chen, Z.Q. Study on Wind-induced Vibration Coefficient of Steel Tubular Transmission Truss Tower. J. Build. Struct. 2010, 31 (Suppl. S2), 182–186. [Google Scholar]
- Deng, H.Z.; Zhang, Y.F.; Chen, Q.; Wu, Y. Study on Wind Vibration Response of Transmission Tower. Spec. Struct. 2008, 2008, 9–13. [Google Scholar]
- Zheng, J.S.; Wen, L.X.; Zheng, N.M.; Tang, Z.Q.; Wu, F.Q.; Cai, Q.R.; Chen, F.B. Comparison Study of Wind Effects on Transmission Tower under Typhoon Wind Field and Terrain B Wind Field. J. Hunan Univ. Nat. Sci. 2020, 47, 99–106. [Google Scholar]
- Nie, J.B.; Pan, F.; Shen, J.G.; Zheng, J.W. Study on Wind Vibration Characteristics of ±800 kV T-long Cross Transmission Tower. Spec. Struct. 2013, 30, 48–52. [Google Scholar]


Publisher’s Note: MDPI stays neutral with regard to jurisdictional claims in published maps and institutional affiliations. |
© 2022 by the authors. Licensee MDPI, Basel, Switzerland. This article is an open access article distributed under the terms and conditions of the Creative Commons Attribution (CC BY) license (https://creativecommons.org/licenses/by/4.0/).