Article

Exploring Natural and Social Factors Affecting Road Disruption Patterns and the Duration of Recovery: A Case from Hiroshima, Japan

by
Rodelia Sansano
1 and
Makoto Chikaraishi
2,*
1
Graduate School of Advanced Science and Engineering, Hiroshima University, Hiroshima 739-8529, Japan
2
Graduate School for International Development and Cooperation, Hiroshima University, Hiroshima 739-8529, Japan
*
Author to whom correspondence should be addressed.
Sustainability 2022, 14(18), 11634; https://doi.org/10.3390/su141811634
Submission received: 11 August 2022 / Revised: 8 September 2022 / Accepted: 13 September 2022 / Published: 16 September 2022
(This article belongs to the Topic Resilient Civil Infrastructure)

Abstract

:
For the past few decades, the occurrence and severity of disasters have been increasing. This study empirically explores factors affecting road disruption patterns and the duration of road recovery based on the road network disruption and recovery record in Hiroshima, Japan, over the last 19 years, using (1) a binary logit model to identify factors affecting the disruption probability of each road link, and (2) a survival model to identify the factors affecting the recovery duration. We divided the factors into social and natural factors, where the former might be easier for policy makers to control. Results show that not only natural factors, but also social factors, particularly who manages the road, significantly affect both the probability of road disruptions and road recovery duration. This implies that the ability and available resources that each road manager has firstly affects the quality of the road, which in turn affects the probability of it being disrupted, and secondly affects the quickness of taking recovery actions. This points to potential avenues for improving coordination across cities, prefectures, and national road managers in managing roads during disasters.

1. Introduction

As climate change has progressed over the past few decades, its widespread impacts on both society and the environment have become more noticeable [1]. The increase in the occurrence and severity of disasters can cause huge upheavals in people’s daily activities. One major problem is the disruption of roads, which results in the loss of accessibility and longer travel times, especially during evacuation and relief operations. It may also cause recovery to take longer and lead to bigger problems, including economic loss, reduced level of public services such as police and fire services, and so forth. As pointed out by Nicholson and Du [2], damage to the transport system inhibits repairs to other lifeline systems, including water supply, energy supply, sewage disposal, and IT infrastructure. In this sense, road recovery is a vital part of all phases of disaster management, including mitigation, preparedness, response, and recovery [3].
Drawing on the road network disruption and recovery record in Hiroshima, Japan, over the last 19 years, this study aims to empirically explore factors affecting road disruption patterns and their recovery durations using (1) a binary logit model to identify factors affecting the disruption probability of each road link, and (2) a survival model to identify the factors affecting the duration of road recovery. In particular, we focus on the impacts of both social and natural factors on the duration of road recovery and disruption patterns. We believe that separating social factors from natural factors is critical because social factors can be controlled more easily than natural factors. This will also provide a means to properly allocate resources as well as to devise a plan to facilitate more efficient operations at the onset of disasters. For example, during the 2018 Heavy Rain disaster in Japan, which caused mass movements and landslides in various parts of the Chugoku region, including Hiroshima, roads were heavily damaged (as shown in Figure 1). This disaster negatively affected both commercial distribution and regional economy (MLIT, n.d.) [4].
It was observed that road recovery was quickly achieved for expressways and national roads, while it took a longer time for roads managed by prefectures and cities [5,6]. Since this difference might come from the differences in the authorities’ ability and the resources available for the recovery (rather than from optimal strategies of road recovery), there is a high possibility that the road network recovery process can be improved by sharing knowledge and resources across different road administrators. To encourage such a sharing scheme, it is important to show empirical evidence on the extent to which social factors play a role in disaster management and how policy makers can influence the flow of the management process. However, little quantitative evidence on the differences in road recovery duration has been given in existing studies. This study attempts to fill in this gap by providing empirical evidence focusing on the case of Hiroshima, Japan. Although the results cannot be straightforwardly generalized to other regions, the findings could be useful in other regions, as it may provide lessons for other countries to learn from.
The rest of the sections are organized as follows. In Section 2, we review existing studies focusing on road network vulnerability and the network recovery process, and clarify the main contribution of the current study. Section 3 introduces the data used in this study, together with some aggregation results and empirical framework. Section 4 presents the results, which are then discussed in more detail in Section 5. Section 6 concludes the paper with the major findings and remaining tasks.

2. Literature Review

For the past few decades, the number of natural disasters has been surging dramatically. Climate- and weather-related disasters have increased five-fold over the past 50 years, with 74% of these disasters causing economic losses [7]. This has led many researchers in different fields to focus on improving resilience towards disasters. Resilience is defined as “the ability of a system, community or society exposed to hazards to resist, absorb, accommodate, adapt to, transform and recover from the effects of a hazard in a timely and efficient manner, including through the preservation and restoration of its essential basic structures and functions through risk management” [8]. In transportation studies, Serulle et al. [9] defined resilience as “the ability for the system to maintain its demonstrated level of service or to restore itself to that level of service in specified timeframe”. This is very similar to the definition of resilience described by Balal et al. [10], that is, “the ability for a transportation network’s operation to withstand and rapidly recover from a disruptive event that causes link closures, node closures, or reduced capacity”. Following these definitions, the resilience of a road network can be thought of as consisting of two phases: (1) the initial phase, which focuses on the initial impact on the network, and (2) the recovery speed from the damaged sustained from the disaster. The next subsection will review studies related to the first phase, which mostly focus on the concept of road network vulnerability, followed by a review of studies related to the second phase, which explore the road network recovery process.

2.1. Road Network Vulnerability

Road network vulnerability has been a focus of many studies in the past. Various evaluation approaches and techniques have been used in the literature to evaluate road network vulnerability. To perform the analysis, the evaluation approach is strongly linked to the availability and type of data used, and how the network was represented in the study, such as in abstract form or based on real-world network. Pan et al. [11] categorized quantitative methods used to analyze transportation vulnerability and resilience studies into topological analysis, model optimization, simulation, and those which are based on data. In their review of approximately 140 studies, 24% used topological analysis, 48% employed model optimization, 18% performed simulations, and only 10% are data-based research.
Network topology is the abstract representation of transportation systems consisting of nodes and interconnecting links [12]. Studies that analyze topological structures of transportation networks often consider roads as links, with pieces of infrastructure or significant locations where these roads are connected being considered as nodes. This method may also incorporate the use of simulations to perform various analyses [13,14,15,16,17,18].
On the other hand, data-based research requires a considerable amount of data to perform empirical analyses. Obtaining reliable and useful data for research can be challenging and difficult. Historical records, for example, are difficult to acquire, especially when proper data management on important events is not in place. Even when data are acquired, treating and cleaning the data to obtain reliable information may also be challenging. This is one of the reasons why there are fewer empirical studies compared to other methods. Examples of data-driven studies in transportation include that conducted by Kermanshah and Derrible [19], who used U.S. Geological Survey ShakeMaps to determine the location of roads which are vulnerable to extreme earthquakes, and that conducted by Donovan and Work [20], who used GPS data from taxis containing the beginning and end of trips, the metered distance, and the total travel time to analyze changes in traffic conditions caused by a hurricane.
In another study conducted by Santos et al. [6], an empirical analysis was performed using rainfall data from the July 2018 heavy rain disaster in Hiroshima, Japan, to produce a risk map showing critical road segments and occurrence probabilities of sediment hazards. Results showed that areas within the hazard area and watershed boundary are more likely to be disrupted due to sediment hazard. This relationship also holds in the case of a high rainfall index value. However, the number of disrupted links used in the study is relatively low.
Another piece of research focusing on flood scenarios was conducted by Singh et al. [21], who also used daily rainfall data for rainfall analysis to create flood maps at different stages based on water level. Two rainfall scenarios with different intensities, durations, and return periods (10 and 100 years) from the data were taken, and flood depth distribution over roads and its impact on road vulnerability in terms of reduced mobility were analyzed. Results of this study showed that even normal rainfall would cause delay in travel and congestion. In addition, an increase in rainfall intensity caused a nonlinear increase in traffic disruption.
The relationship between road vulnerability and tropical cyclone intensity was investigated by Zhu et al. [22], using the records of road damage associated with three tropical cyclones in Hainan Province, China. The study specifically focused on two intensity hazard measures: maximum wind speed at 10 m above ground and cumulative precipitation during the tropical cyclone period. Results showed that vulnerability functions of the road are affected jointly by both cumulative precipitation and maximum wind speed. One limitation of this study is that it only contains 406 disrupted roads, including national roads, highways, provincial roads, and county roads, which is a relatively small proportion of the total number of roads.
A record of disruption between 1997 and 2010 caused by floods and landslides due to extreme rainfall or rapid snowmelt in the Czech Republic was used in [23]. The authors analyzed the impact on the economy, people, infrastructure, connectivity, and serviceability. One limitation of this study is that only roads that were totally damaged and needed full restoration, and partially damaged roads that needed repair, were considered. Roads that were interrupted due to temporal flooding or sedimentation that had almost no repairs were not included, which implies that the analysis did not capture some portions of the damage.
While these studies made good use of data from past disasters, the focus is limited to one or two disasters and to certain events created by the disaster. This limits the applicability of the results of the studies to other disaster contexts.

2.2. Road Network Recovery

For studies on vulnerability, road recovery is the second phase of resilience. Social and economic recovery from major disasters is significantly influenced by the speed of reconstruction of transportation infrastructures [24]. Road recovery plays an important role in the initial phase of the disaster, as well as in restoring communities back to their normal state [25]. In the past, a significant number of studies have been undertaken to investigate the challenges of improving road network recovery.
Following the framework of Çelik [26], studies in network restoration and recovery can be classified according to the set of decisions, objectives, and solution methods used in the study. Studies that deal with problems such as transportation infrastructure restoration or rehabilitation [24,27,28,29,30], debris clearance [31,32,33], sequencing and scheduling [34,35,36], etc., may require different sets of decisions and solution methods, such as mathematical solutions and numerical experiments as well as simulations. Studies looking into different aspects of road recovery can be categorized as cost-related measures, travel time or distance, completion time, utility or benefit, accessibility, and delay or latency [26].
Past studies mostly rely on creating scenarios to model possible outcomes and suggest solutions based on these results, which often contain many uncertainties. Lack of empirical data on road network recovery is often one of the reasons for this. Some studies attempt to close this gap by employing data-driven research using big data and other data sources. For instance, big data from individual ridership during two hurricanes that caused huge damage to transportation systems in New York City were used by Y. Zhu et al. [37] to study the post-hurricane recovery patterns of roads and the subway system in the city. Results showed that the recovery rate from the two hurricanes differed, and that the road networks have a higher resilience than the subway system. Joo et al. [38] used a combination of mobile phone GPS data for human mobility, real road network information, and road reconstruction process information during the July 2018 heavy rain disaster in Hiroshima to build a model for multi-locational road recovery. One common aspect of the above-mentioned studies is the lack of historical data on road recovery time and damage. As in the case of the vulnerability studies, these studies only focus on a particular type of disaster, and the time span of the data is short. In addition, studies which use big data on passenger travel mostly focus on travel time and origin–destination information, and lack information regarding road closures and their duration.
In summary, there are few studies which conduct empirical analyses on both road network disruptions and recovery using a long-term data record. We believe that this is the first study which explores factors affecting the probability of road disruptions and duration of road recovery using the road disruption and recovery record over a 19-year period. Such studies can provide policy makers with more reliable empirical evidence and aid them in decisions on policy interventions and resource allocation.

3. Research Framework

3.1. Study Area and Data

The study area is Hiroshima Prefecture, Japan. The total land area of Hiroshima Prefecture is 8479 square kilometers. It is ranked the 11th biggest prefecture based on size, with a total population of 2.84 million as of 2016 [39].
We have used data from the Hiroshima Road Disaster Prevention Information System. It is a record of roads that were disrupted by different types of natural disasters from 25 February 2002 to 22 February 2021, and is managed by the prefectural government. The dataset contains the date and time of occurrence of disruption, cause of disruption, road type, location of the disrupted road, and date and time that the roads were repaired. For road network data, we have used the Digital Road Map of Japan, which is the standard national digital road map database. These datasets were then merged with other information from the website of the National Land Information Division; National Spatial Planning and Regional Policy Bureau; Ministry of Land, Infrastructure, Transport, and Tourism, which includes elevation data, sediment hazard area data, population data, and land classification data. Roads in Japan are classified into National Highways, National Expressways, Prefectural Roads, and Municipal Roads. Activities such as (i) development and improvement and (ii) repair and maintenance of the roads differ across road administrators. Further details of burden sharing can be found in the Ministry of Land, Infrastructure, Transport, and Tourism Road Bureau quick road guide, including the budget distribution [40]. Based on this, the cost of maintenance and repair of national roads are all covered by the national government, while the national government supports up to 50% of the maintenance and repair of the main prefectural roads. On the other hand, local prefectural roads have no direct subsidy from the national government for maintenance and repair costs.
Due to limited access to the data source, only the roads managed by Hiroshima Prefecture have been considered in this study. Note that the prefecture also manages some national roads upon the request of the national government. The total number of road links considered is 25,102, of which 1512 (or 6.02%) were disrupted at least once during the 19-year period. Table 1 shows a summary of the two datasets, including the composition of the factors considered in the study. Note that betweenness centrality is a centrality indices which is widely used in network analysis [41]. In this study, the index measures the degree of centrality of each link, which is defined as the total number of shortest paths between all link pairs that passes through the target link in the road network.
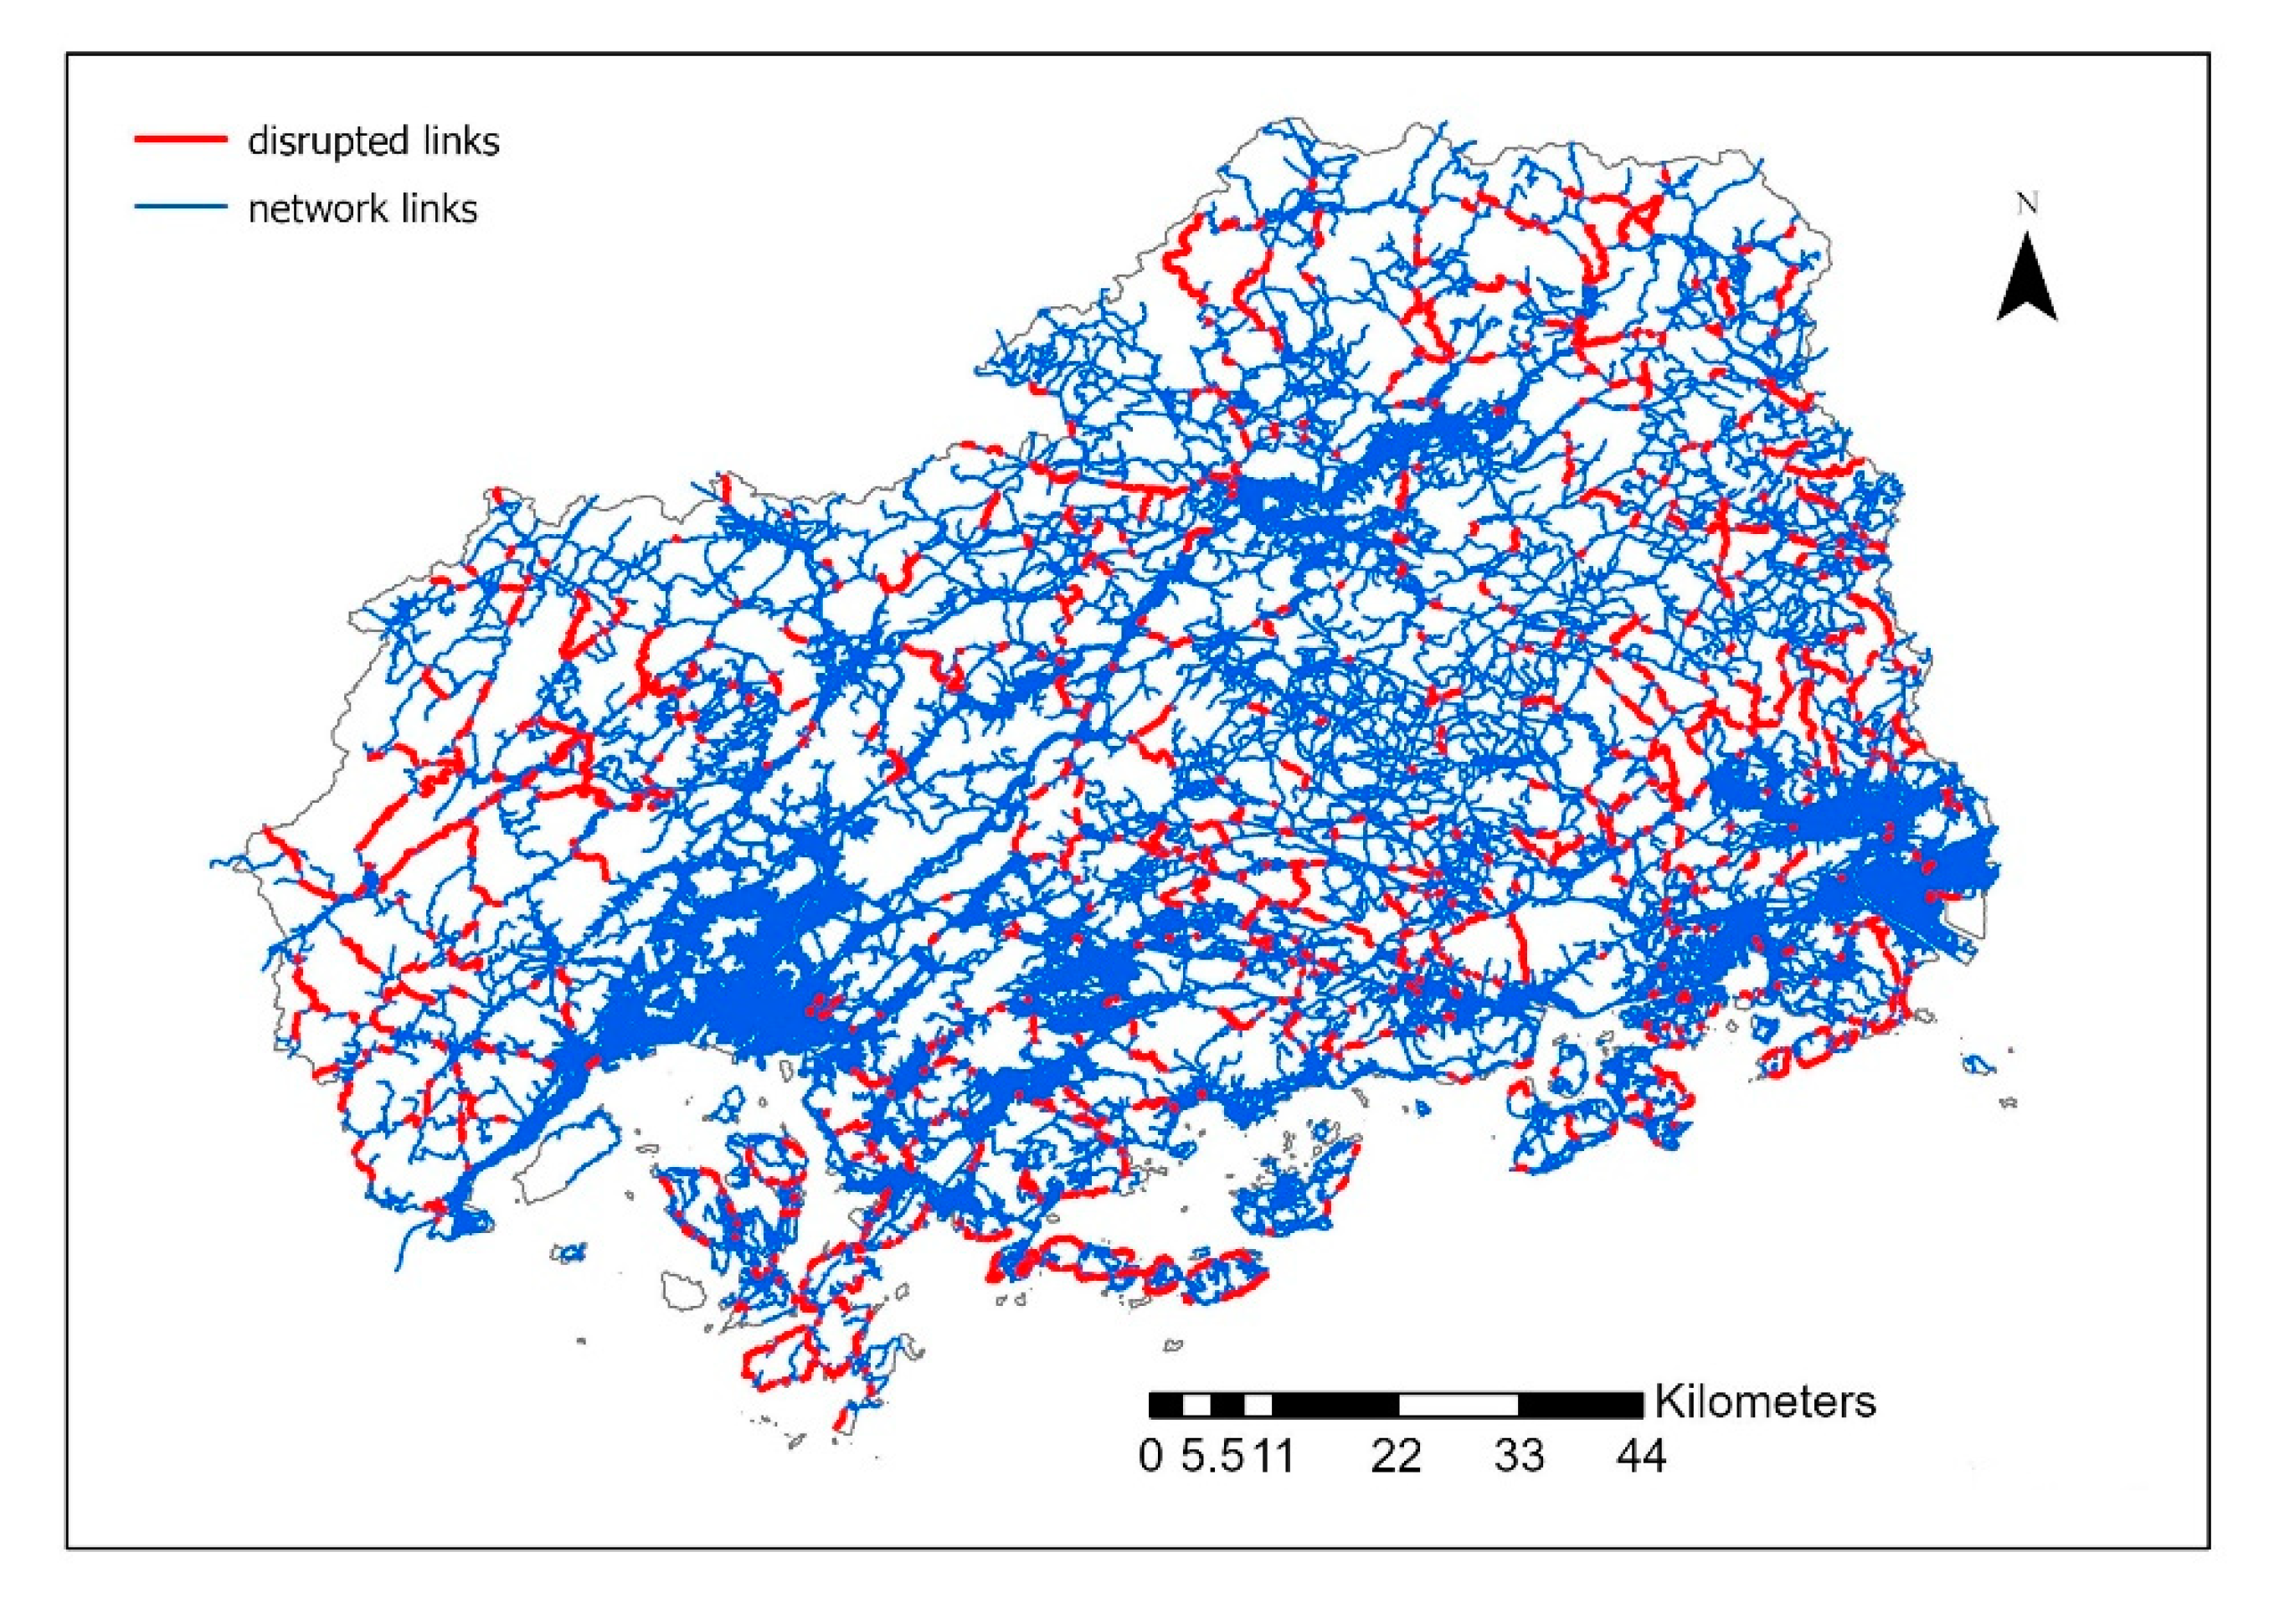
Figure 2 shows a map of the Hiroshima Road network. The blue lines represent road links that have not been disrupted over the past 19 years, while the red lines represent road links which have experienced some disruption over the past 19 years. It can be observed that the major business areas of Hiroshima Prefecture, such as Hiroshima City, Higashi-Hiroshima City, Fukuyama City, and Miyoshi City have not been disrupted over the last 19 years.
Figure 3 shows the duration of the disruption in days, both in normal and in logarithmic transformed histogram. From the figure, it is noticeable that after the disaster, 54% of the road links recovered within a week after the disruption, while roughly 20% took more than 100 days to recover, which is a relatively long period.

3.2. Probability of Road Link Disruption (Binary Probit Model)

In this study, factors that affect the probability of road link disruption were explored using a binary probit model, where the dependent variable was defined as 1 when the road was disrupted at least once over the last 19 years, and 0 otherwise. The explanatory variables include social factors, namely road type (national, main prefectural road, or others), betweenness centrality, population density, and natural factors—namely elevation, whether the road is in the sediment hazard area or not, and type of terrain (hilly or not). These natural factors would directly affect the disruption probability: elevation is considered to be a proxy variable of slope, where steeper-slope areas are expected to have higher disruption probability, and roads in the sediment hazard and hilly areas would tend to be disrupted. Apparently, social factors do not seem to affect the disruption probability, but this may be because social factors may influence (1) the quality of the road infrastructure, e.g., the quality of road embankment, and (2) road network configuration, e.g., national roads have been developed to connect major cities, while other roads are meant to fill in the missing links that accommodate intra-city travel demand. Given that, road type dummy variables and population density have been introduced as proxy variables of the quality of the road infrastructure, and the betweenness centrality index has been introduced as a variable of road network configuration.
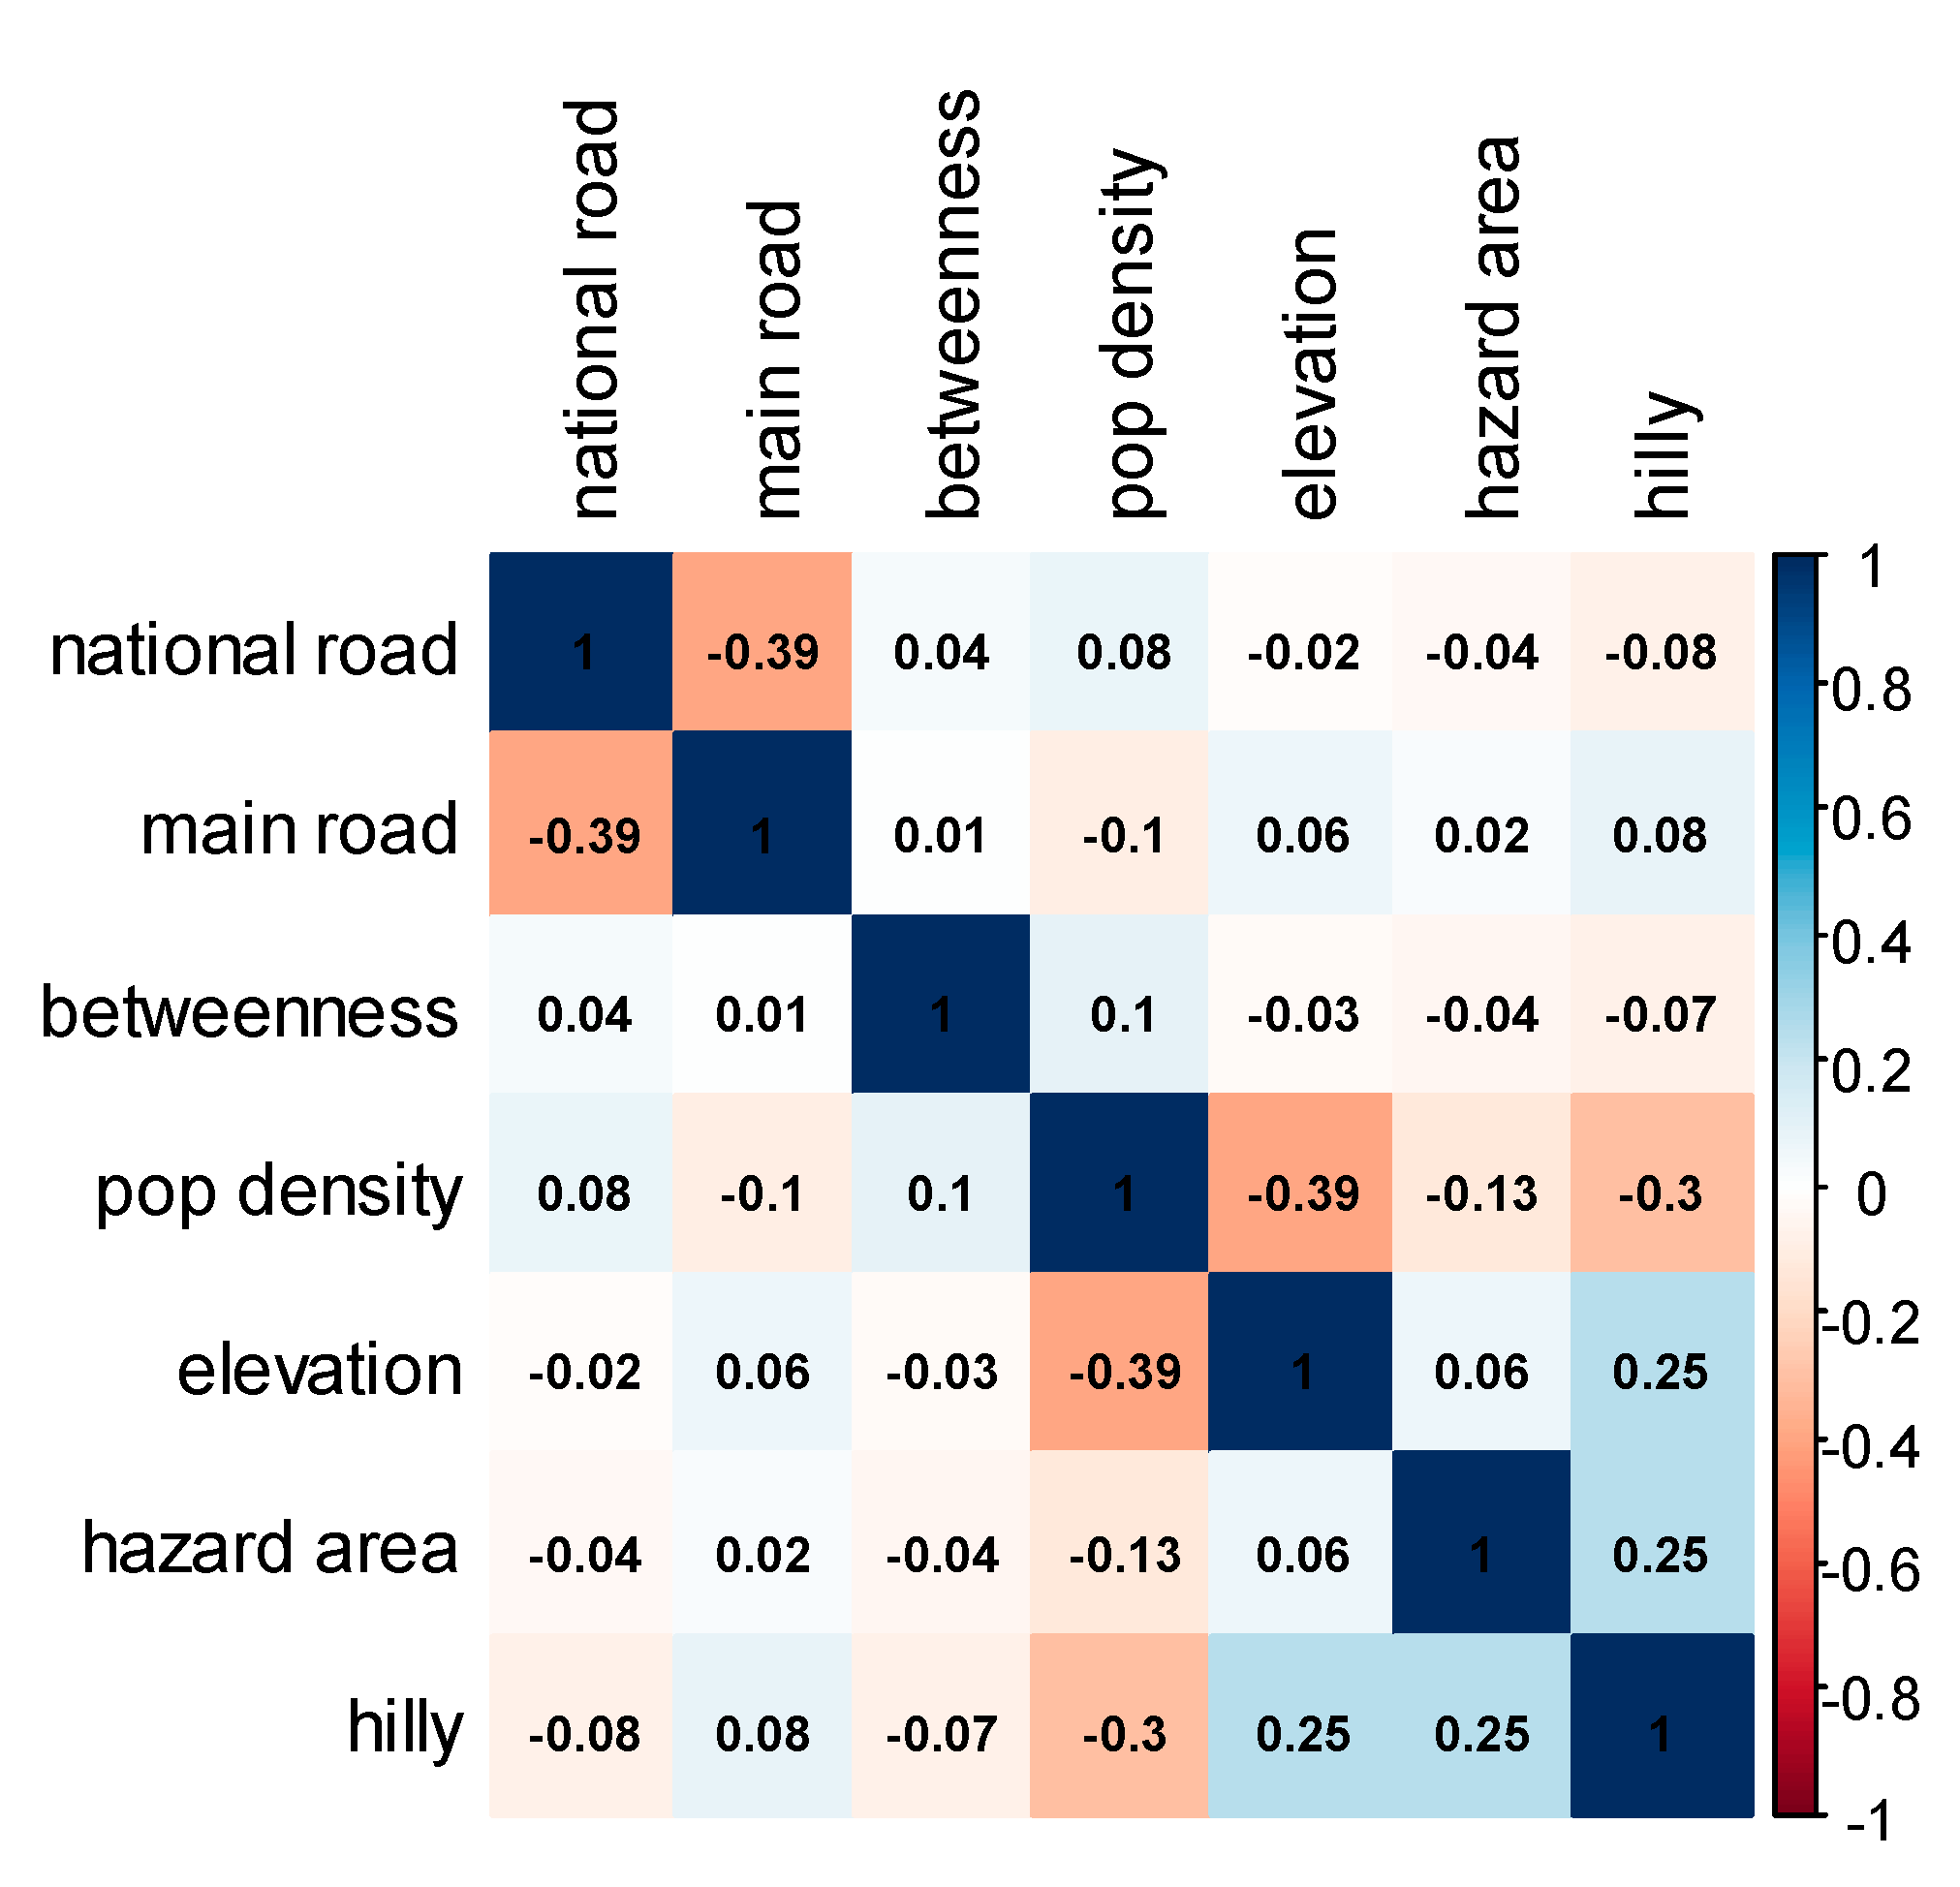
The correlation of variables was tested to ensure that all chosen variables in the study are not highly correlated to each other, as this may affect the result of the analysis. Figure 4 shows the result of the correlation test, confirming that no variables are highly correlated with each other. Table 2 shows the variable specification used in the study, with the corresponding mean and standard error.

3.3. Road Recovery Duration (Survival Model)

Survival analysis [42] was conducted to investigate the factors affecting road recovery duration. Specifically, this study utilized the four common distributions of Accelerated Failure Time (AFT) models: exponential, Weibull, Log-Logistic, and Log-Normal, where the best-fit model was chosen based on Akaike’s Information Criterion. AFT models are parametric survival models that do not assume constant hazards, which is closer to real world data [43]. In addition, roads that did not fully recover or remained disrupted until the end of the study period can be utilized as right-censored data.
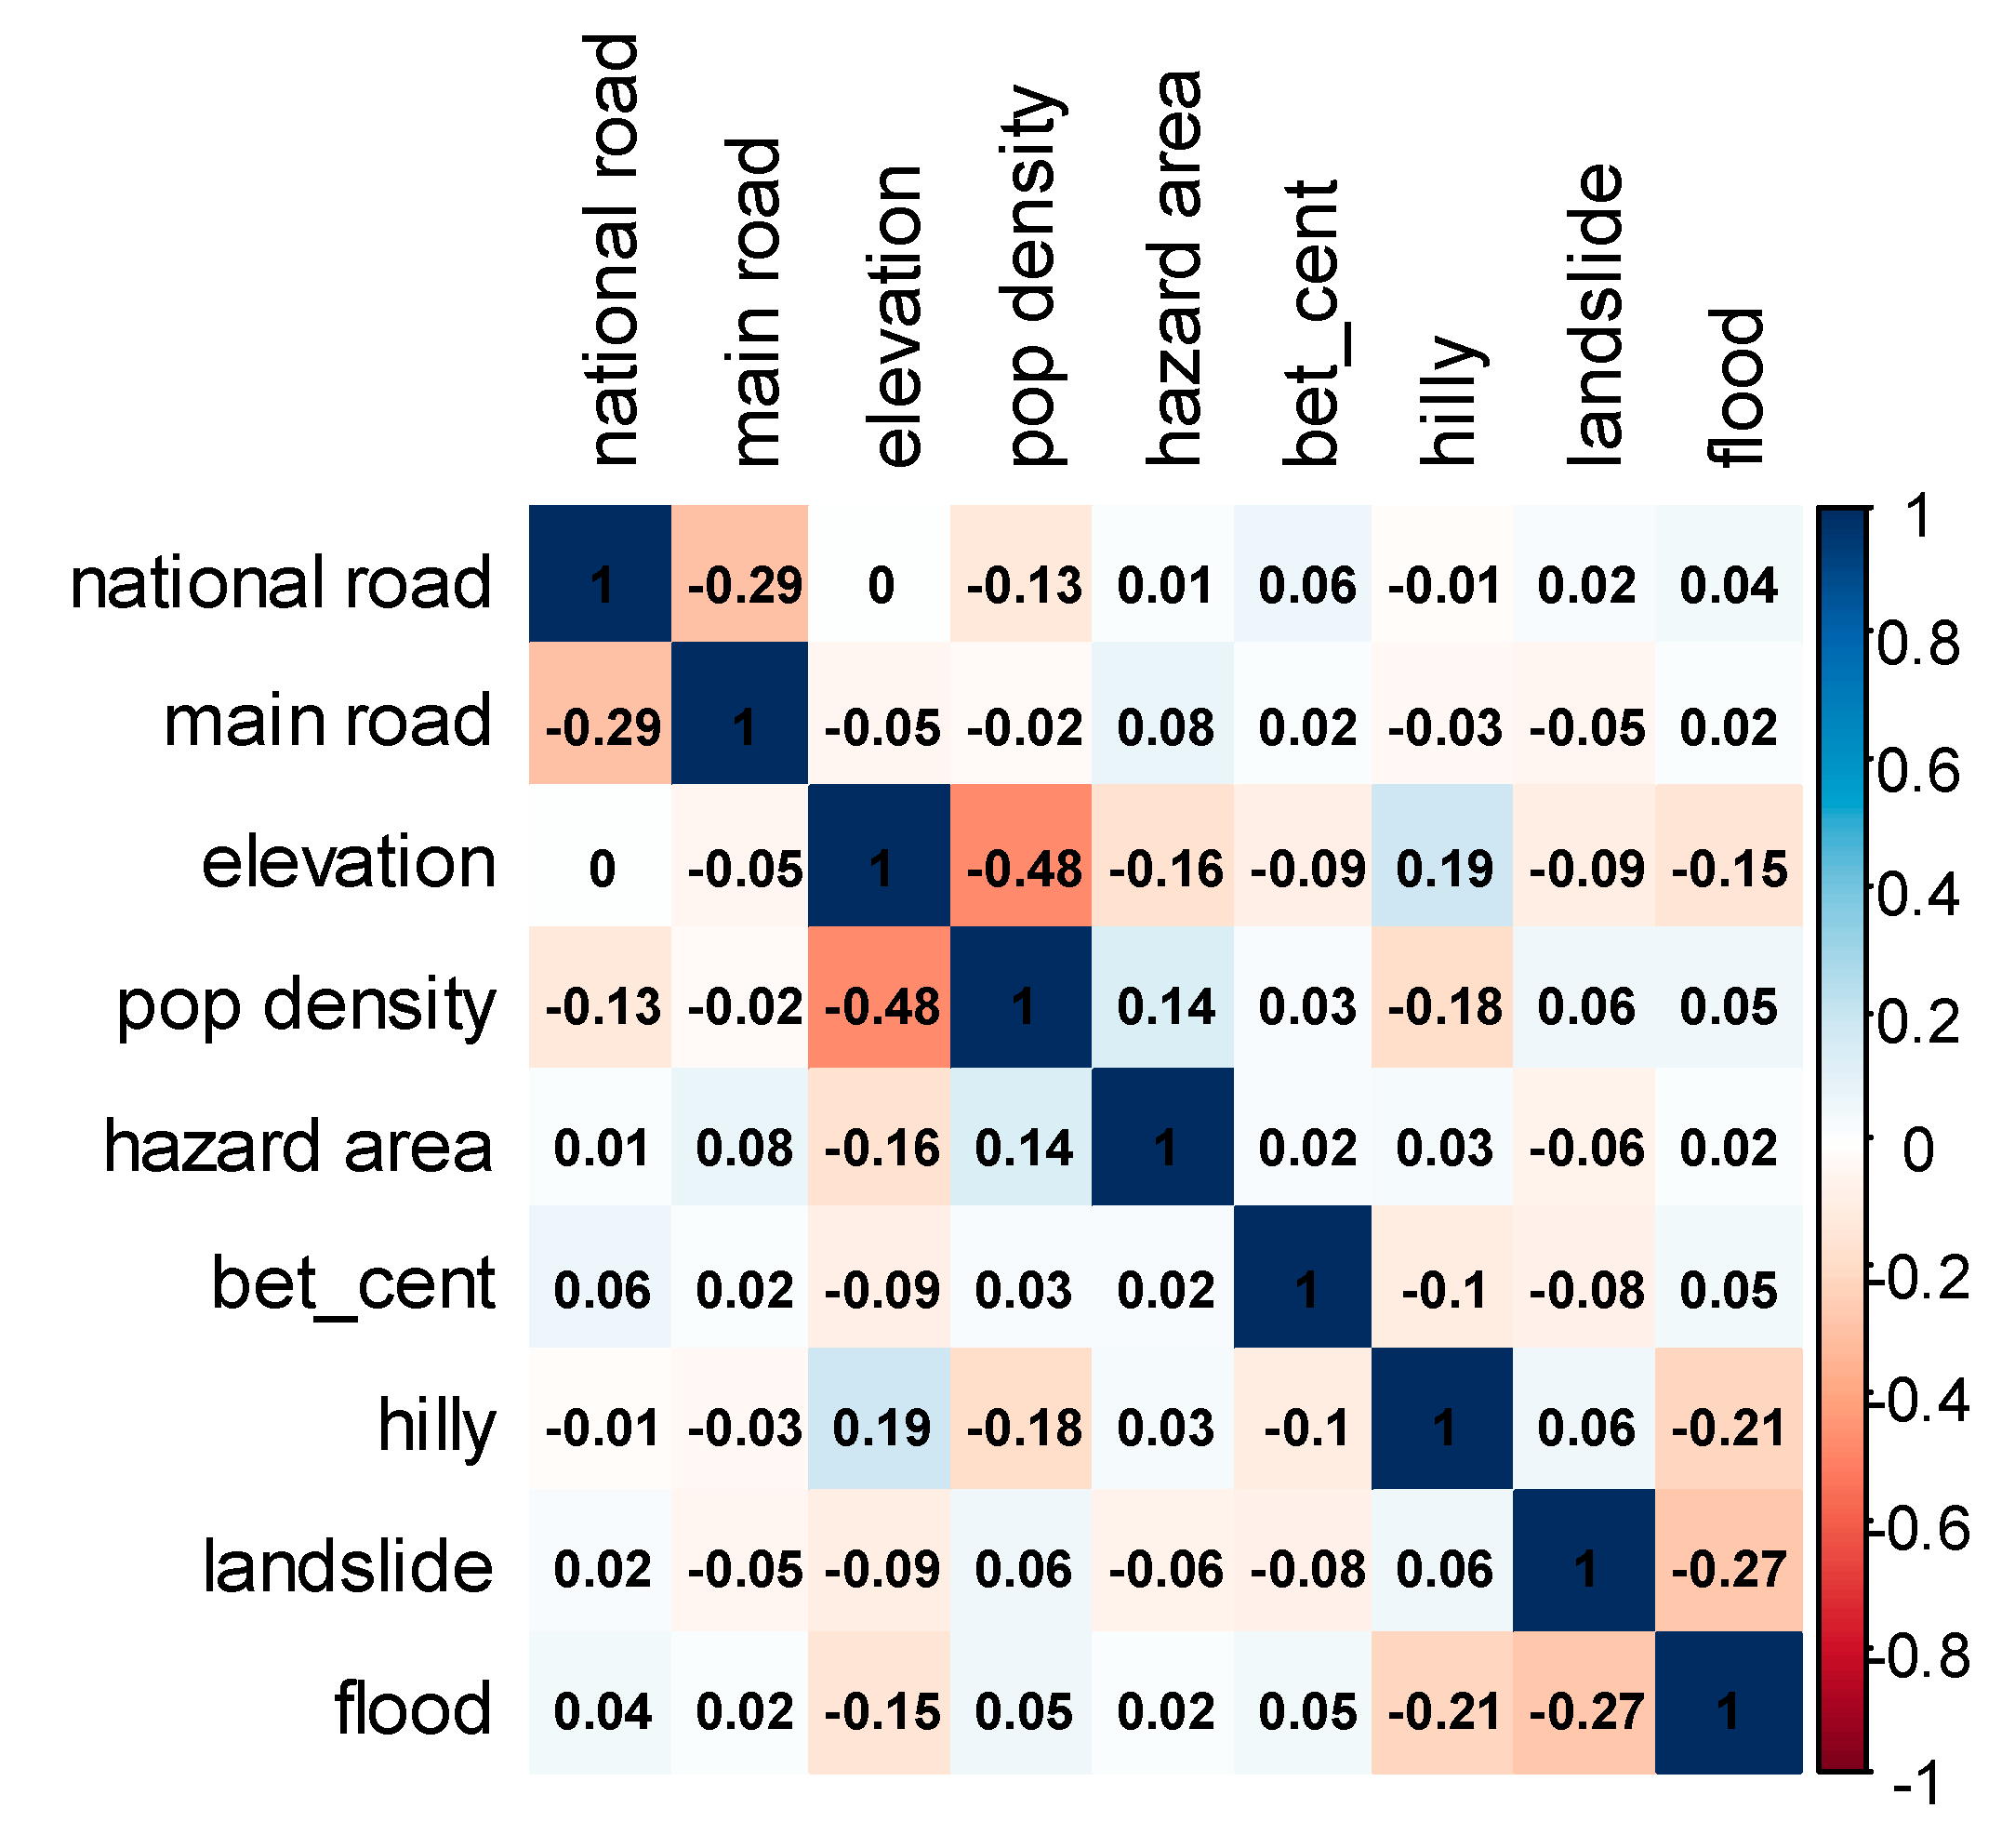
Figure 5 shows the correlation results of the explanatory variables for the road recovery duration model. As shown, no variables are highly correlated, which means that this will not affect the result of the analysis.
Table 3 shows the explanatory variables used for the road recovery duration model. Natural factors include (1) natural disasters that cause road disruption (flood related, landslide related, and others), (2) geologic condition (terrain type), (3) elevation, and (4) sediment hazard location (whether the road is located in the sediment hazard area or not). On the other hand, social factors are defined in the study as factors where human intervention has a large influence, such as the type of road (national, main, or local), the centrality index (betweenness centrality), and the population density. Similar to the model for road link disruption, we assume that introducing natural factors would directly affect the recovery duration: a road disrupted by flood would quickly recover since in most cases, the road damage would be smaller, while it would not recover quickly for landslide since sediment would cover the road, and thus certain recovery actions would be needed; elevated and hilly areas are hard-to-reach areas in general, and thus, the recovery actions tend to get delayed, although this would depend on where equipment for recovery actions is located. For social factors, road type dummy variables have been introduced as proxy variables of ability to take quick recovery actions: in general, the national government has a higher capacity for recovery compared to prefectural and city governments. The centrality index and population density have been introduced since it is expected that the roads with higher demand tend to be prioritized by road administrators.
Using all the covariates, the four AFT models were analyzed as a full model and were compared to the intercept-only model (no covariates). Taking into consideration the AIC values of the models, the Log-Normal distribution was chosen as the basis of the final model. The model was further optimized by removing the covariates without statistical significance based on the z value. Since the optimized model yielded a lower AIC value, it was adopted for interpretation in the results.

4. Results

4.1. Probability of Road Link Disruption (Binary Probit Model)

Table 4 shows the estimation results of the Probit model for road disruption. The results show that all variables significantly affect the likelihood of the road to be disrupted, except for the betweenness centrality index.
To confirm the stability of the model estimation results, we further estimated two models: one omitting the sediment hazard area dummy and geologic location dummy (Adjusted Model 1), and the other omitting the centrality index (Adjusted Model 2). The results show that the location of the road (whether it is located in a sediment hazard area or not, and whether it is a hilly terrain or not) affects the result of the model when considering betweenness centrality. When these two variables are removed, the betweenness centrality index is also a significant factor for road disruptions, indicating that betweenness centrality is negatively correlated with hazard area dummy and geologic location dummy. This can be explained by the fact that areas with high betweenness centrality are those areas located in the Central Business Districts (CBD). In the selection of location of CBDs, it is only natural to choose areas that are not located in hazard areas, to ensure lesser probability of damage from a disaster. Additionally, flat lands are preferable for building CBDs, since they provide easier access and a better location for businesses. Across all models, the type of road, population density, and elevation revealed a consistent result.

4.2. Road Recovery Duration (Survival Model)

Table 5 shows the performance of the four AFT models tested in the study. As shown in the table, the model with log normal distribution produced the best goodness of fit.
Table 6 shows the estimation results of the full and adjusted models. The full model containing all the variables showed that only three variables are significant: betweenness centrality; whether or not the road is a main road or not; and whether the cause of road disruption is a flood or not. The adjusted model containing only these three significant variables showed a lower AIC compared to the full model.
Based on the results, we can confirm that two social factors (road type—whether or not the road is main road or not, and betweenness centrality), and one natural factor (whether the cause of road disruption is flood or not) affects the duration of the road recovery. Furthermore, these results show that the main roads recover faster than other types of roads; roads with a higher betweenness centrality index recover faster; and roads disrupted by floods recover faster compared to roads disrupted by other types of disaster. The existence of these social factors indicates that policy makers can have a certain influence on the speed of recovery of roads. By taking into consideration the social factors found in this study, better policies focused on these factors can be developed. For example, by knowing which road type recovers faster than others, policies towards further improvement of other road types that connect important pieces of infrastructure such as medical institutions, evacuation centers, and the like will increase connectivity during disasters. Furthermore, even though roads recover faster after floods (because roads can be used immediately after the water subsides), flooding still affects road connectivity because it is more common than other disasters. For this reason, developing policies to alleviate flooding is also important.

5. Discussion

5.1. Probability of Road Link Disruption (Binary Probit Model)

The empirical results confirm that national roads and main roads are less likely to be disrupted compared with local roads. Since these roads provide the main connections between major establishments and are often a gateway to other cities, this is a very positive result, as relief operations can be sustained during disasters. This can help policy makers to focus on how to design the delivery system for relief goods in areas where connectivity may be lower, such as areas where most local roads serve as access roads.
Furthermore, the results show that the geologic location of the road network has an impact on the probability of road disruptions. Specifically, roads located on sediment hazard areas, higher elevation, and hilly terrain are most likely to be disrupted. Since Hiroshima mostly consists of mountains and islands [44], it is not surprising that roughly 74% of the road links are located on hilly terrain. This is a challenge for road maintenance offices since uneven terrain and higher elevation require more effort to maintain. Since the results show that a higher probability of road disruptions is associated with hilly terrain and higher elevation, policy makers in Hiroshima should develop more measures to lessen this probability. Additionally, hilly terrain and higher elevation locations experience more problems because natural disasters such as heavy rain can result in additional types of road disruption such as mudslides and landslides. Since Japan receives twice as much precipitation compared to the rest of the world [40], these additional problems associated with hilly terrain and high elevation should also be given attention by policy makers.

5.2. Road Recovery Duration (Survival Model)

One major finding of this study is that main roads recover faster that other types of roads. In addition, the results show that roads with a higher centrality index recover faster. Since business districts are usually connected by major roads with a high centrality index, this implies that business districts will restore connectivity faster. This is a positive thing, as it will minimize losses and provide access to people. Policies to further improve roads located in these areas, such as repair and maintenance, will be beneficial as they will further enhance connectivity in the business districts, thereby supporting business continuity even during disasters.
Interestingly, the results show that most factors do not affect the duration of road recovery. In terms of natural factors, only flooding, which is a source of road disruption, shows a significant result. Roads disrupted by flooding recover faster than other disasters because most of the time, roads can be restored easily to full operation as soon as the water level goes down. This can be further improved by policies to improve drainage systems and flood control infrastructure. Furthermore, the results show that other disasters may cause greater damage and longer road recovery, so to improve road recovery, policy makers should strengthen policies targeted at other disasters, such as landslides.
In addition, these results show that policy makers are key players in improving the duration of road recovery since social factors have a greater effect on the duration of road recovery than natural factors. This implies that human intervention in terms of policies developed by policy makers can greatly shorten the duration of road recovery. Lastly, the results show that the type of road affects the duration of road recovery. Therefore, policy makers must allocate resources effectively to ensure that all road types will be managed properly so as to maintain connectivity.
Factors affecting road recovery play a vital role in the resilience of transportation networks. To address road disruptions, roadworks are often needed, whether for a short time or a long time. These repair works often cause an increase in traffic flow and travel time delays. In the studies conducted by Safitri and Chikaraishi [5] and Wei et al. [45], economic losses were calculated from road disruptions. The duration of road recovery directly affects the magnitude of these economic losses, so policies targeting a faster recovery from disruptions on the road network would also lessen economic losses. Furthermore, the results of the present study suggest that the repair and maintenance of road networks can lead to faster recovery. Knowing which factors may help speed up the road recovery can help policy makers to maximize the allocation of their scarce resources.
A better understanding of the social and natural factors affecting road network disruption and its recovery process will also aid policymakers in improving their disaster management plans. As road recovery requires a considerable amount of resources [34], proper planning is needed to efficiently restore roads. For example, by knowing which natural factors can affect the duration of road recovery and road disruption patterns, policy makers will be able to properly prepare countermeasures to lessen the impact of such natural factors. While natural factors cannot be controlled, measures to alleviate their impact can be taken. For instance, flooding is a natural factor, but measures such as improving drainage system and flood control infrastructures can help lessen its impact.

6. Conclusions

The aim of this study was to investigate which factors affect the probability of road disruptions and the duration of road recovery. Factors considered in the study were categorized as either social factors or natural factors. In this study, natural factors are defined as factors that are naturally occurring and are therefore beyond the control of policy makers, while social factors are defined as factors which can be influenced by human interventions.
The Probit model estimation results show that national roads and main roads, as well as roads located in places with a higher population density, are less likely to be disrupted. On the other hand, roads located in sediment hazard areas, hilly areas, and areas with higher elevation are more likely to be disrupted. Here, both social factors and natural factors affect the probability of road disruptions, except for the betweenness centrality.
Based on the results of the analysis of the factors affecting the duration of road recovery, two social factors (road type—whether or not the road is main road or not, and betweenness centrality) and one natural factor (where the cause of road disruption is flood or not) affect the duration of road recovery. Furthermore, these results show that main roads recover faster than other types of roads, roads with higher betweenness centrality index recover faster, and roads that were disrupted by flooding recover faster compared to roads disrupted by other types of disaster.
In conclusion, while both social and natural factors affect the probability of road disruptions and duration of road recovery, natural factors are more dominant with respect to road disruptions, while social factors are the major contributing factor in the duration of road recovery. By identifying these factors, policy makers will have more options on how to further improve the social factors highlighted in this study, as these can be influenced by human interventions. On the other hand, while natural factors are beyond the control of policy makers, identifying which of these factors are significant could help policy makers to produce better mitigation and improvement plans, and thereby lessen the impact of these factors. In addition, this study could be helpful for guiding the decision-making process for road investments. By providing an insight to better locations, new road infrastructure can be made more resilient to disasters. Further improvements to this study may be to see how other social and natural factors not considered in this study affect the probability of road disruption and duration of road recovery. Due to data availability, this study only covered roads managed by the road administrators of Hiroshima prefecture. Road disruption records from other road administrators, including expressway companies and city government, are needed to conduct a analysis with the complete road network. Another important remaining task is that, although this study only considered the direct effects of natural and social factors, they could have a more complex relationship. For example, the road quality could vary depending on the geological conditions and geographic locations.

Author Contributions

Study conception and design, R.S. and M.C.; methodology, analysis, and interpretation of results, R.S.; writing—review and editing, R.S. and M.C.; supervision and data acquisition, M.C. All authors have read and agreed to the published version of the manuscript.

Funding

This research received no external funding.

Institutional Review Board Statement

Not applicable.

Informed Consent Statement

Not applicable.

Data Availability Statement

Data sharing not applicable.

Conflicts of Interest

The authors declare no potential conflicts of interest with respect to the research, authorship, and/or publication of this article.

References

  1. Kaito, C.; Ito, A.; Kimura, S.; Kimura, Y.; Saito, Y.; Nakada, T. AR5 Synthesis Report: Climate Change 2014—IPCC. 2020, Volume 218. Available online: https://www.ipcc.ch/report/ar5/syr/ (accessed on 27 July 2022).
  2. Nicholson, A.; Du, Z.P. Degradable transportation systems: An integrated equilibrium model. Transp. Res. Part B Methodol. 1997, 31, 209–223. [Google Scholar] [CrossRef]
  3. Poser, K.; Dransch, D. Volunteered geographic information for disaster management with application to rapid flood damage estimation. Geomatica 2010, 64, 89–98. Available online: https://www.researchgate.net/publication/265619198_Volunteered_Geographic_Information_for_Disaster_Management_with_Application_to_Rapid_Flood_Damage_Estimation/figures?lo=1 (accessed on 27 July 2022).
  4. MLIT; Chugoku Regional Development Bureau. Keep in Mind: How We Responded to the Heavy Rain Disaster in July 2018. 2018. Available online: https://www.cgr.mlit.go.jp/photo/h3007gouu_kiroku/kioku_english.htm (accessed on 2 September 2022).
  5. Safitri, N.D.; Chikaraishi, M. Impact of transport network disruption on travel demand: A case study of the July 2018 heavy rain disaster in Japan. Asian Transp. Stud. 2022, 8, 100057. [Google Scholar] [CrossRef]
  6. Santos, J.R.; Safitri, N.D.; Safira, M.; Varghese, V.; Chikaraishi, M. Road network vulnerability and city-level characteristics: A nationwide comparative analysis of Japanese cities. Environ. Plan. B Urban Anal. City Sci. 2021, 48, 1091–1107. [Google Scholar] [CrossRef]
  7. United Nations News. Climate and Weather Related Disasters Surge Five-Fold over 50 Years, but Early Warnings Save Lives—Wmo Report | | Un News.). 1 September 2021. Available online: https://news.un.org/en/story/2021/09/1098662 (accessed on 27 June 2022).
  8. Resilience|UNDRR. 2009. Available online: https://www.undrr.org/terminology/resilience (accessed on 23 February 2022).
  9. Serulle, N.; Heaslip, K.; Brady, B.; Louisell, W.C.; Collura, J. Resiliency of transportation network of santo domingo, dominican republic: Case study. Transp. Res. Rec. 2011, 2234, 22–30. [Google Scholar] [CrossRef]
  10. Balal, E.; Valdez, G.; Miramontes, J.; Cheu, R.L. Comparative evaluation of measures for urban highway network resilience due to traffic incidents. Int. J. Transp. Sci. Technol. 2019, 8, 304–317. [Google Scholar] [CrossRef]
  11. Pan, S.; Yan, H.; He, J.; He, Z. Vulnerability and resilience of transportation systems: A recent literature review. Phys. A Stat. Mech. Its Appl. 2021, 581, 126235. [Google Scholar] [CrossRef]
  12. Zhang, X.; Miller-Hooks, E.; Denny, K. Assessing the role of network topology in transportation network resilience. J. Transp. Geogr. 2015, 46, 35–45. [Google Scholar] [CrossRef]
  13. Chen, H.; Zhang, L.; Ran, L. Vulnerability modeling and assessment in urban transit systems considering disaster chains: A weighted complex network approach. Int. J. Disaster Risk Reduct. 2021, 54, 102033. [Google Scholar] [CrossRef]
  14. Furno, A.; El Faouzi, N.E.; Sharma, R.; Cammarota, V.; Zimeo, E. A graph-based framework for real-time vulnerability assessment of road networks. In Proceedings of the 2018 IEEE International Conference on Smart Computing, Taormina, Italy, 18–20 June 2018; pp. 234–241. [Google Scholar] [CrossRef]
  15. Gao, L.; Liu, X.; Liu, Y.; Wang, P.; Deng, M.; Zhu, Q.; Li, H. Measuring road network topology vulnerability by Ricci curvature. Phys. A Stat. Mech. Its Appl. 2019, 527, 121071. [Google Scholar] [CrossRef] [Green Version]
  16. Hu, Z.; Wu, G.; Wu, H.; Zhang, L. Cross-sectoral preparedness and mitigation for networked typhoon disasters with cascading effects. Urban Clim. 2022, 42, 101140. [Google Scholar] [CrossRef]
  17. Tang, Y.; Huang, S. Assessing seismic vulnerability of urban road networks by a Bayesian network approach. Transp. Res. Part D Transp. Environ. 2019, 77, 390–402. [Google Scholar] [CrossRef]
  18. Zhang, H.; Yao, Y. An Integrative Vulnerability Evaluation Model to Urban Road Complex Network. Wirel. Pers. Commun. 2019, 107, 193–204. [Google Scholar] [CrossRef]
  19. Kermanshah, A.; Derrible, S. A geographical and multi-criteria vulnerability assessment of transportation networks against extreme earthquakes. Reliab. Eng. Syst. Saf. 2016, 153, 39–49. [Google Scholar] [CrossRef]
  20. Donovan, B.; Work, D.B. Empirically quantifying city-scale transportation system resilience to extreme events. Transp. Res. Part C Emerg. Technol. 2017, 79, 333–346. [Google Scholar] [CrossRef]
  21. Singh, P.; Sinha, V.S.P.; Vijhani, A.; Pahuja, N. Vulnerability assessment of urban road network from urban flood. Int. J. Disaster Risk Reduct. 2018, 28, 237–250. [Google Scholar] [CrossRef]
  22. Zhu, J.; Liu, K.; Wang, M.; Xu, W.; Liu, M.; Zheng, J. An empirical approach for developing functions for the vulnerability of roads to tropical cyclones. Transp. Res. Part D Transp. Environ. 2022, 102, 103136. [Google Scholar] [CrossRef]
  23. Bíl, M.; Vodák, R.; Kubeček, J.; Bílová, M.; Sedoník, J. Evaluating road network damage caused by natural disasters in the Czech Republic between 1997 and 2010. Transp. Res. Part A Policy Pract. 2015, 80, 90–103. [Google Scholar] [CrossRef]
  24. Rouhanizadeh, B.; Kermanshachi, S. Post-disaster reconstruction of transportation infrastructures: Lessons learned. Sustain. Cities Soc. 2020, 63, 102505. [Google Scholar] [CrossRef]
  25. Lacuarin, J.R.; Palmiano, H.S.O. The Role of Transportation Engineering in Disaster Management. 2020. Available online: http://ncts.upd.edu.ph/tssp/wp-content/uploads/2017/02/2010-02_lacuarin_final.pdf (accessed on 27 July 2022).
  26. Çelik, M. Network restoration and recovery in humanitarian operations: Framework, literature review, and research directions. Surv. Oper. Res. Manag. Sci. 2016, 21, 47–61. [Google Scholar] [CrossRef]
  27. Pourmohammadi, H. Urban Transportation Network Recovery Following a Catastrophic Event|Semantic Scholar. 2008. Available online: https://www.semanticscholar.org/paper/Urban-Transportation-Network-Recovery-Following-a-Pourmohammadi/f6b82365944a1c9554db60257504114c289c716b (accessed on 22 March 2022).
  28. Iloglu, S.; Albert, L.A. A maximal multiple coverage and network restoration problem for disaster recovery. Oper. Res. Perspect. 2020, 7, 100132. [Google Scholar] [CrossRef]
  29. Wang, C.Y.; Hu, S.R. A Study on Emergency Evacuation and Rescue Network Reconstruction for Natural Disasters with Multiclass Travel Behavior Constraints. J. East. Asia Soc. Transp. Stud. 2005, 6, 4269–4284. Available online: https://www.scopus.com/record/display.uri?eid=2-s2.0-84970897727&origin=inward&txGid=8de1d187343b7e8471296ff3c7ded6b2&featureToggles=FEATURE_NEW_DOC_DETAILS_EXPORT:1 (accessed on 22 March 2022).
  30. Zhao, T.; Zhang, Y. Transportation infrastructure restoration optimization considering mobility and accessibility in resilience measures. Transp. Res. Part C Emerg. Technol. 2020, 117, 102700. [Google Scholar] [CrossRef]
  31. Ajam, M.; Akbari, V.; Salman, F.S. Minimizing latency in post-disaster road clearance operations. Eur. J. Oper. Res. 2019, 277, 1098–1112. [Google Scholar] [CrossRef]
  32. Berktaş, N.; Kara, B.Y.; Karaşan, O.E. Solution methodologies for debris removal in disaster response. EURO J. Comput. Optim. 2016, 4, 403–445. [Google Scholar] [CrossRef]
  33. Sayarshad, H.R.; Du, X.; Gao, H.O. Dynamic post-disaster debris clearance problem with re-positioning of clearance equipment items under partially observable information. Transp. Res. Part B Methodol. 2020, 138, 352–372. [Google Scholar] [CrossRef]
  34. Gokalp, C.; Patil, P.N.; Boyles, S.D. Post-disaster recovery sequencing strategy for road networks. Transp. Res. Part B Methodol. 2021, 153, 228–245. [Google Scholar] [CrossRef]
  35. Rey, D.; Bar-Gera, H. Long-term scheduling for road network disaster recovery. Int. J. Disaster Risk Reduct. 2020, 42, 101353. [Google Scholar] [CrossRef]
  36. Tadano, K.; Maeno, Y.; Carnevali, L. Road repair sequencing for disaster victim evacuation. Adv. Intell. Syst. Comput. 2017, 528, 401–412. [Google Scholar] [CrossRef]
  37. Zhu, Y.; Ozbay, K.; Xie, K.; Yang, H. Using Big Data to Study Resilience of Taxi and Subway Trips for Hurricanes Sandy and Irene. Transp. Res. Rec. 2016, 2599, 70–80. [Google Scholar] [CrossRef]
  38. Joo S hyun Ogawa, Y.; Sekimoto, Y. Road-reconstruction after multi-locational flooding in multi-agent deep RL with the consideration of human mobility—Case study: Western Japan flooding in 2018. Int. J. Disaster Risk Reduct. 2022, 70, 102780. [Google Scholar] [CrossRef]
  39. About Hiroshima|Visit Hiroshima. 2019. Available online: https://visithiroshima.net/about/ (accessed on 23 February 2022).
  40. MLIT. Roads in Japan 2021. Road Bureau—Ministry of Land, Infrastructure, Transport and Tourism. 2021. Available online: https://www.mlit.go.jp/road/road_e/index_e.html (accessed on 2 September 2022).
  41. Freeman, L.C. A Set of Measures of Centrality Based on Betweenness. Sociometry 1997, 40, 35–41. [Google Scholar] [CrossRef]
  42. Kleinbaum, D.G.; Klein, M. Survival Analysis: A Self-Learning Text; Springer: New York, NY, USA, 2005; p. 590. [Google Scholar]
  43. Faruk, A. The comparison of proportional hazards and accelerated failure time models in analyzing the first birth interval survival data. J. Phys. Conf. Ser. 2018, 974, 012008. [Google Scholar] [CrossRef]
  44. Place and See. Hiroshima-Ken. 2022. Available online: https://placeandsee.com/wiki/hiroshima-ken (accessed on 2 March 2022).
  45. Wei, F.; Koc, E.; Li, N.; Soibelman, L.; Wei, D. A data-driven framework to evaluate the indirect economic impacts of transportation infrastructure disruptions. Int. J. Disaster Risk Reduct. 2022, 75, 102946. [Google Scholar] [CrossRef]
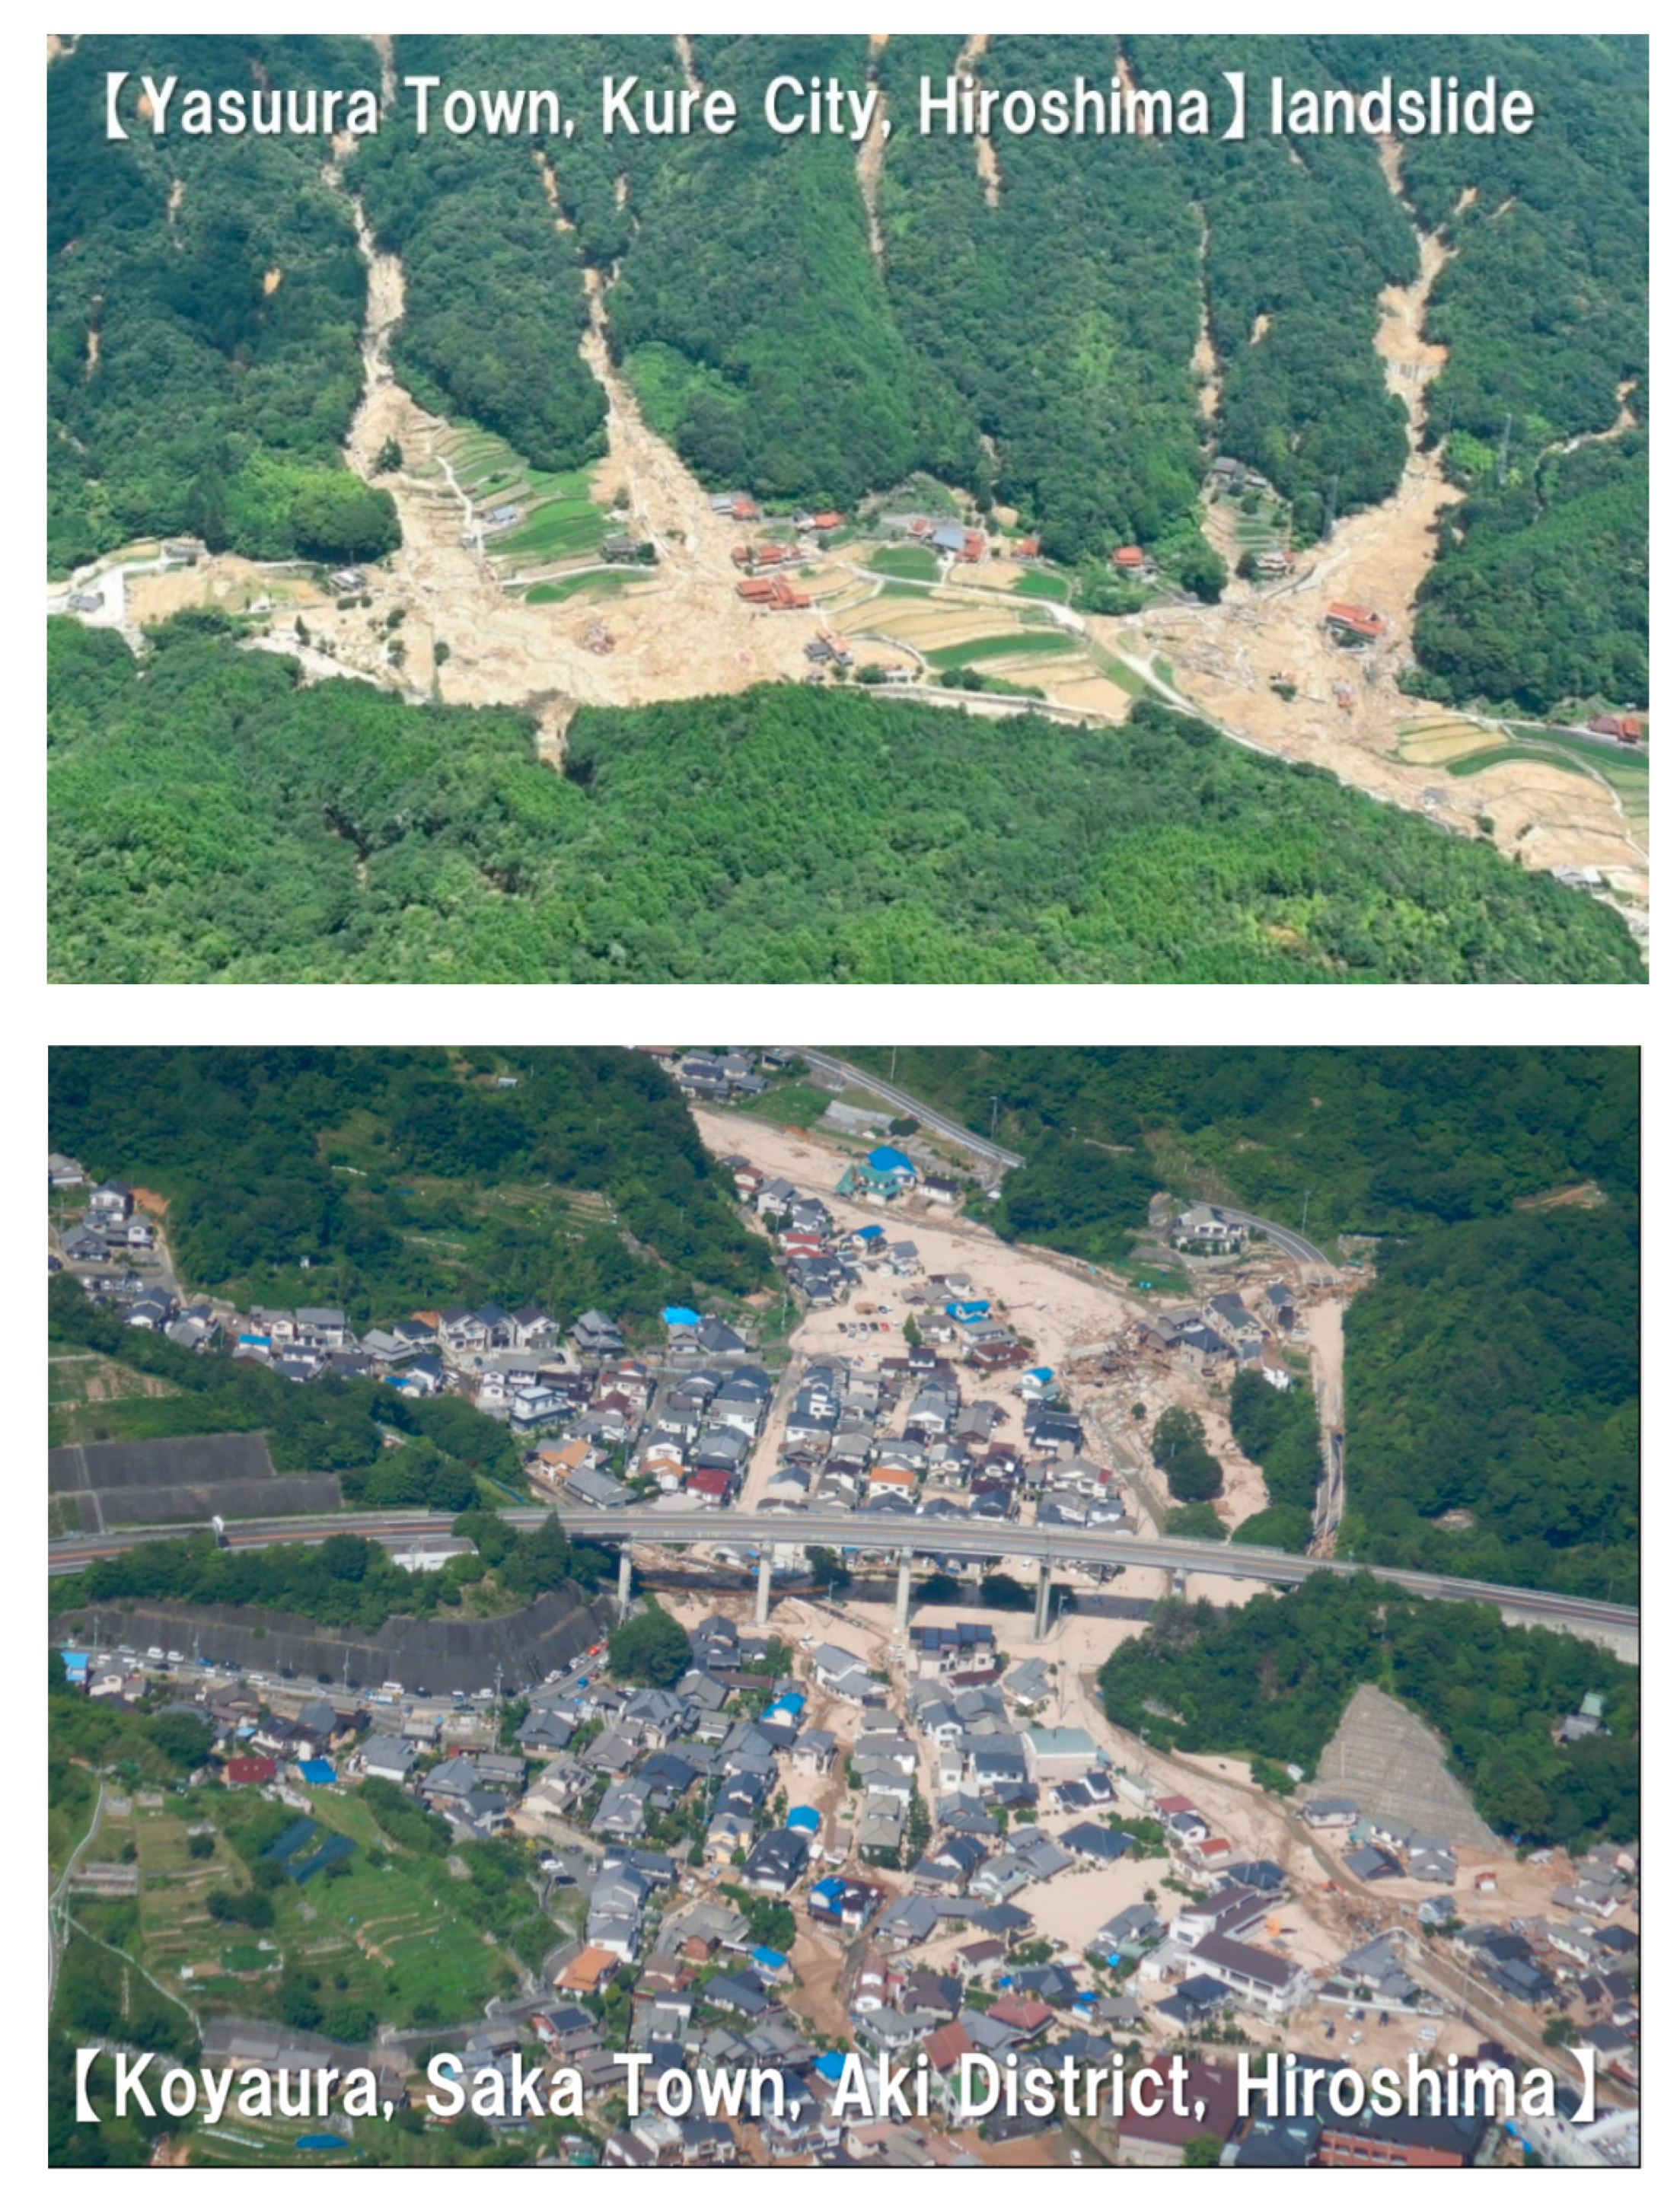
Figure 1. Road Damage in Hiroshima caused by the July 2018 Heavy Rain Disaster [4].
Sustainability 14 11634 g001
Figure 2. Map of the Hiroshima Road Network.
Sustainability 14 11634 g002
Figure 3. Histogram of duration of disruptions.
Sustainability 14 11634 g003
Figure 4. Correlation Matrix for Road Disruption Model.
Sustainability 14 11634 g004
Figure 5. Correlation Matrix for Road Recovery Duration.
Sustainability 14 11634 g005
Table 1. Summary of Study Datasets.
Probability of Disruption DatasetRoad Recovery Dataset
VariablesFrequency%Frequency%
Road Class
 National629525.0828518.85
 Main (Prefectural)786231.3240826.98
 Local (Prefectural)10,94543.6081954.17
Sediment Hazard Area
  In hazard area667226.5880853.44
  Not in hazard area18,43073.4370446.56
Terrain type
  Hilly area18,62174.18142794.38
  Others648125.82855.62
Cause of Disruption
  Landslide related--68345.17
  Flood related--1238.13
  Others--70646.70
MeanStandard DeviationMeanStandard Deviation
Betweenness Centrality4.695.394.224.52
Population Density (people per km2)975.691854.22326.04380.34
Elevation (m)188.23177.46269.84199.36
  Sample Size25,1021512
Table 2. Variable Specification for Road Disruption Model.
CovariateDefinitionSpecificationMeanStandard Error
Social factors
r_natroad classification dummy11 if road class is national road,
0 otherwise
0.250.003
r_mainroad classification dummy21 if road class is main local road,
0 otherwise
0.310.003
bet_centcentrality indexbetweenness centrality measure of each link4.690.034
pop_denpopulation densitypopulation density where the link is located975.6811.703
Natural factors
elevelevationaverage elevation of the area where the link is located, measured in meters188.201.120
h_areahazard area dummy1 if the link is located within the sediment hazard area,
0 otherwise
0.270.003
hillygeologic location dummy1 if the link is located in a hilly area,0 otherwise0.740.003
Table 3. Summary of Explanatory Variables for Road Recovery Duration.
CovariateDefinitionSpecificationMeanStandard Error
Social factors
r_natroad classification dummy11 if road class is national road,
0 otherwise
0.190.010
r_mainroad classification dummy21 if road class is main road,
0 otherwise
0.270.011
bet_centcentrality indexbetweenness centrality measure of each link4.220.116
pop_denpopulation densitypopulation density where the link is located326.049.735
Natural factors
elevelevationaverage elevation of the area where the link is located, measured in meters269.845.127
h_areahazard area dummy1 if the link is located within the sediment hazard area,
0 otherwise
0.530.013
landslidecause of disruption dummy11 if the cause of link disruption is landslide related,
0 otherwise
0.450.013
floodcause of disruption dummy21 if the cause of link disruption is flood related,
0 otherwise
0.080.007
hillygeologic location dummy1 if the link is located in a hilly area,0 otherwise0.940.006
Table 4. Model Estimation Results of Road Disruption.
Explanatory VariableFull ModelAdjusted Model 1Adjusted Model 2
Estimatez ValueEstimatez ValueEstimatez Value
intercept−2.057 × 100−39.28 **−1.417 × 100−46.68 **−2.071 × 100−40.83 **
r_nat−2.208 × 10⁻¹−6.29 **−2.361 × 10⁻¹−6.99 **−2.223 × 10⁻¹−6.34 **
r_main−2.496 × 10⁻¹−7.99 **−2.376 × 10⁻¹−7.86 **−2.504 × 10⁻¹−8.02 **
bet_cent−2.822 × 10⁻³−0.99−5.395 × 10⁻³−1.97 *--
pop_den−1.487 × 10⁻⁴−8.39 **−2.020 × 10⁻⁴−11.12 **−1.489 × 10⁻⁴−8.41 **
elev5.121 × 10−46.62 **6.047 × 10−48.01 **5.125 × 10−46.62 **
h_area5.472 × 10−120.04 **--5.476 × 10−120.06 **
hilly4.839 × 10−110.21 **--4.857 × 10−110.25 **
AIC10,30410,93010,303
Initial log-likelihood−5738.20−5738.20−5738.20
Final log-likelihood−5144.04−5458.82−5144.55
Sample Size25,10225,10225,102
Significance codes: 0 shown by ‘**’; 0.01 shown by ‘*’; 0.1 shown by ‘ ’.
Table 5. Performance of AFT Models.
Survival ModelInitial Log-LikelihoodFinal Log-LikelihoodAIC
Log Normal−6222.3−6144.712,311.32
Log Logistic−6275.2−6190.712,403.31
Exponential−7663.7−7326.714,673.32
Weibull−6270.6−617312,368.05
Table 6. Model Estimation Results of Road Recovery.
Explanatory
Variable:
Full ModelAdjusted Model
Estimatez ValueEstimatez Value
constant2.13 × 1006.042.2523.33
r_nat−2.32 × 10⁻¹−1.33--
r_main−4.56 × 10⁻¹−3.00−0.39−2.72
bet_cent−2.88 × 10⁻²−2.02−0.03−2.16
pop_den−5.97 × 10⁻⁵−0.31--
elev−6.02 × 10⁻⁵−0.16--
h_area2.64 × 10−20.20--
landslide−7.57 × 10⁻²−0.56--
flood−2.79 × 100−11.14−2.80−12.01
hilly2.37 × 10−10.82--
Log (scale)9.06 × 10−149.610.9149.67
µ2.132.25
AIC12,311.3212,302.3
Initial log-likelihood−6222.3−6222.3
Final log-likelihood−6144.7−6146.2
Sample Size15121512
Publisher’s Note: MDPI stays neutral with regard to jurisdictional claims in published maps and institutional affiliations.