3.1. Co-Occurrence Network Construction
Based on the keywords extracted from the policy text, the important guidance content in the text is further determined to form a simplified text. The simplified text is imported into ROSTCM6 text mining software to extract high-frequency words and co-occurrence matrix. The basic principle of the co-occurrence matrix is to describe the common occurrence of two-word pairs in the same part. Through the study of the co-occurrence network diagram, the hidden text association knowledge is revealed, and the processing results in ROSTCM6 software are imported into Gephi software; after operating, a more optimized co-occurrence network diagram is obtained, as shown in
Figure 3. The node in the figure represents the centrality. The larger the node, the greater the centrality, which means that the content of the node occupies a more important position in the text. The line between words indicates that the two words are in the same record. The thicker the line, the higher the weight of the two words appearing at the same time, and the distribution of words in the network diagram indicates the closeness of the relationship between words. The co-occurrence network carries out text analysis on the main technical contents of the intelligent policy and connects the related words, reflecting the internal relationship of the keywords in the main measures.
Figure 3 clearly shows the construction of a coal mine intelligent platform and system and the requirements of intelligent technology and equipment. The Column chart in
Figure 4 reflects the network modules divided in Gephi. The proportion of each module is 33.65%, 22.12%, 18.27%, 13.46%, 5.77%, 3.85%, and 2.88%, respectively. In
Figure 3, different colors are used to distinguish the contents of different modules. The module colors and contents in
Figure 3 correspond to those in
Figure 4. The modules with different colors in
Figure 4 represent different relationship groups. Modules with different colors represent different relationship groups. Module 1 is the core concept of the intelligent coal mine. Module 2 is intelligent roadway support and transportation. Module 3 is the intelligent technology and application direction. Module 4 is the intelligent platform and management system. Module 5 is the intelligent collaborative work of three machines in working face. Module 6 is green mining. Module 7 is intelligent coal mining and heading face. The size of the module calculation results reflects the importance of the module in the whole semantic network.
The generated co-occurrence network diagram not only shows the content of different high-frequency policies and the strength of their links but also reflects the importance of a policy point in the whole coal mine intelligent policy text.
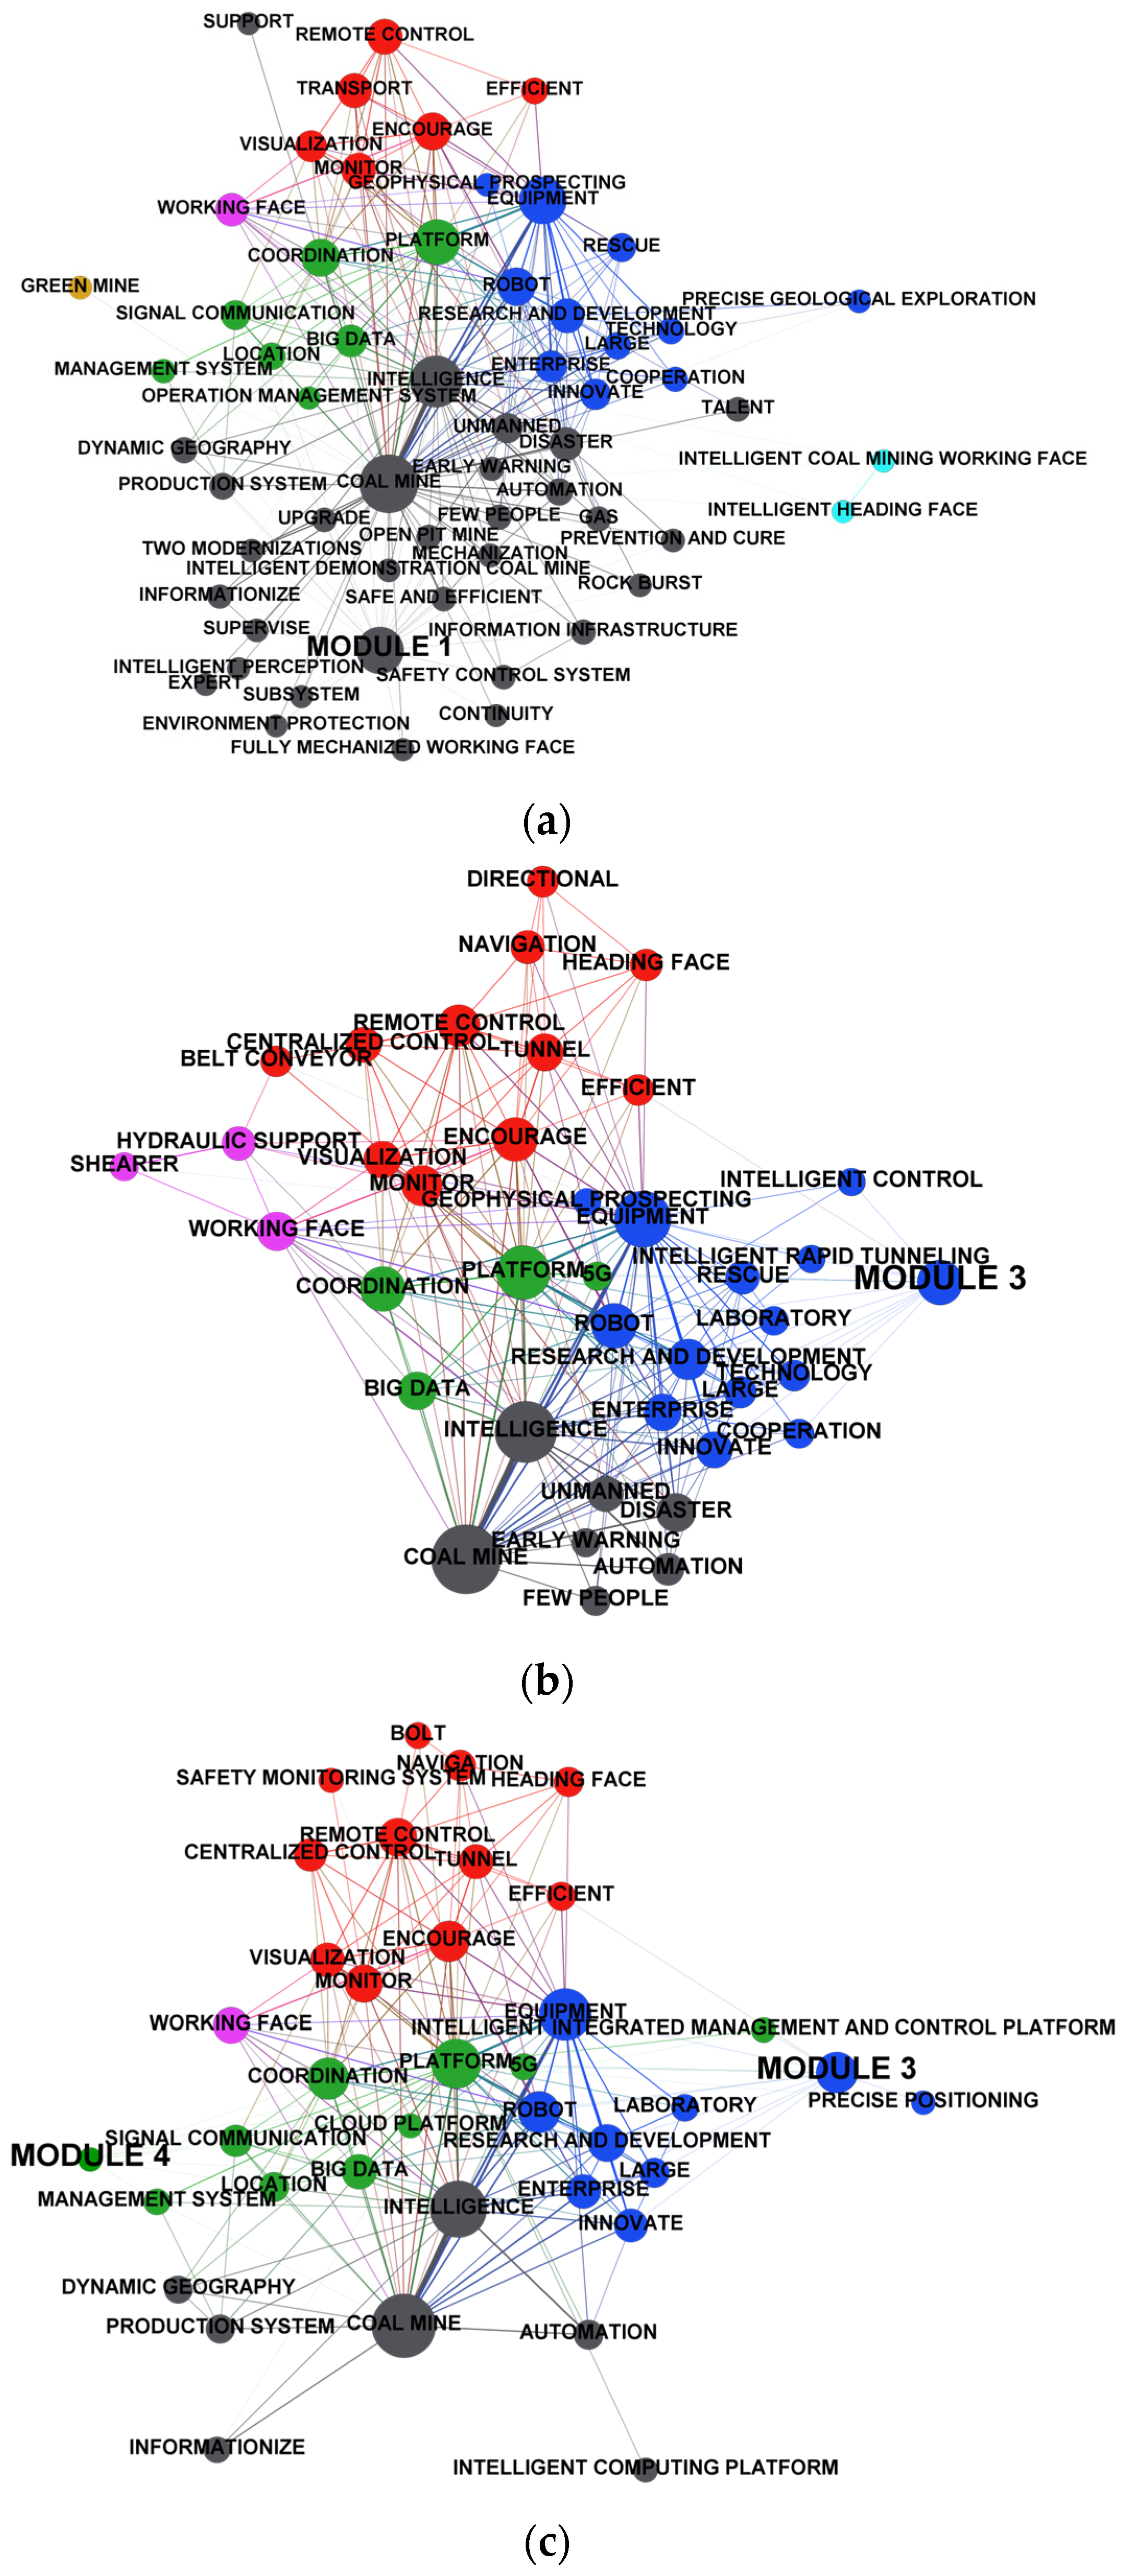
Figure 5 shows the co-occurrence set diagram centered on coal mine and intelligence, technology, and equipment.
Figure 5a is a co-occurrence network diagram when the center is coal mine and intelligence, and
Table 2 shows the main words and their degree in
Figure 5a, which can reflect the importance of few people and no one in the intelligent coal mine for safe and efficient production, and is related to the platform, equipment, green development, talent policy, and other important content. It shows that the intelligent coal mine policy has certain guidance for the talent training of universities and enterprises, as well as the direction of technical research. The intelligent policy mainly reflects the safety of coal mining, the reliability of technical facilities, the environmental sustainability of energy, the information sensitivity of technical architecture, the service system of the system platform, and the combination of system intelligence and humanistic wisdom. It can be seen that the co-occurrence network diagram of coal mine intelligence is highly consistent with the newly proposed 6S concept of coal mine intelligence, where 6S refers to safety, security, sustainability, sensitivity, service, and smartness.
Intelligent equipment and technology and intelligent platform architecture occupy a very important position in the policy text.
Figure 5b is a co-occurrence network diagram when the center is equipment, and
Table 3 shows the main words and their degree in
Figure 5b. It can be seen that the equipment is closely related to words such as tunneling, large-scale, automation, few people and no one, robot, shearer, hydraulic support, coordination, intelligent control, and so on. It reflects that the policy promotes the application of intelligent tunneling equipment, memory cutting of shearer, adaptive support of hydraulic support, intelligent transportation of scraper conveyor, and Intelligent Collaborative Control of other equipment, to achieve the construction goals of intelligent heading face, intelligent fully mechanized mining face and other aspects, and promote the development of coal mining towards large-scale, mechanized, and unmanned. By guiding the construction of intelligent platform architecture, the construction goal of an information infrastructure system can be achieved.
Figure 5c is the co-occurrence network diagram when the center is the platform, and
Table 4 is the main words and their degree in
Figure 5c. It can be seen that the platform is combined with keywords such as remote control, cloud platform, informatization, big data, communication, production system, navigation, image, safety monitoring system, intelligent computing platform, fault diagnosis, and so on. It shows that intelligent coal mines pay attention to the construction of integrated management and control platform, which needs to have the functions of production scheduling, safety supervision, personnel communication, positioning and navigation, intelligent operation, fault diagnosis, and so on.
3.2. Centrality Analysis
By importing the semantic network processed in ROSTCM6 into the network analysis software Gephi, the degree centrality, closeness centrality, and betweenness centrality in the intelligent policy semantic analysis network are derived through Gephi. They are listed from high to low according to the centrality and the output results are shown in
Table 5.
The degree is the most commonly used indicator in centrality calculation, which indicates the number of edges connected with nodes. The higher the degree is, the more important the node is in the network. Closeness centrality reflects the closeness between a node and other nodes; that is, the reciprocal of the sum of the shortest path distance from a point to other nodes. The closer to other nodes, the greater the closeness centrality of the node. Betweenness centrality refers to the number of shortest paths through a node, and it refers to the transit between this node and other nodes. In
Table 5, it can be observed that the three central indicators are generally corresponding. The greater degree represents the ability of the word to reflect the theme in the text, such as coal mine, intelligence, equipment, platform, data, and so on. However, the degree is not enough to fully describe the key content of the text; it needs to combine closeness centrality and betweenness centrality. The smaller betweenness centrality does not mean that the content is unimportant, but that the word is important in specific conditions and locations underground. For example, section, tunneling, support, scraper conveyor, and belt conveyor respectively represent the intelligent requirements for underground roadway tunneling, coal mining, support, and transportation. The closeness centrality analyzes the intelligent requirements of these different aspects according to the length of the path.


 ,
, 


