Article

Tripartite Evolutionary Game Analysis of Stakeholder Decision-Making Behavior in Energy-Efficient Retrofitting of Office Buildings

School of Economics and Management, Beijing Jiaotong University, Beijing 100044, China
*
Author to whom correspondence should be addressed.
Sustainability 2022, 14(18), 11697; https://doi.org/10.3390/su141811697
Submission received: 9 August 2022 / Revised: 7 September 2022 / Accepted: 13 September 2022 / Published: 18 September 2022
(This article belongs to the Topic Building Energy Efficiency)

Abstract

:
Environmental degradation is significantly influenced by the construction industry. Energy-efficient retrofitting of existing office buildings has become an effective means of reducing building energy consumption. Implementation of retrofits requires the support and cooperation of stakeholders. However, existing studies on the dynamics of decision-making behavior among stakeholders are still relatively limited. This study constructed a tripartite evolutionary game model including the government, property owners, and end users, to better understand the behavioral evolution and evolutionary stabilization strategies of stakeholders. The results show that: stakeholders’ decision-making behavior has obvious mutual influence; benefits and costs are the dominant factors in stakeholders’ decision making; the effects of government supervision policies depend on the profitability of the project; and government behavior appears to be influenced by public willingness. In addition, targeted countermeasures were proposed for the development of the energy-efficiency retrofit market. This study provides a generic model that fits various contexts and can be used to inform a reference for scientific decision making by stakeholders.

1. Introduction

The construction industry is one of the most significant sectors in terms of global energy consumption and environmental pollution, and buildings account for nearly 40% of the world’s total energy consumption [1]. The operational phase of the building industry’s life cycle significantly impacts energy consumption and greenhouse gas emissions. The China Building Energy Consumption Research Report (2021) shows that 46.1% of energy consumption, and 42.6% of carbon emissions during the entire construction process, resulted from the operation phase in 2019. As a result of the relatively backward technology level at the time of construction, most buildings in operation in China are currently less energy efficient than newly constructed buildings. The existing buildings account for a large proportion of total energy consumption [2,3], and buildings with high energy consumption and poor functionality can be retrofitted for energy efficiency, to reduce their environmental impact and promote sustainable development [4,5,6].
The use of green buildings is highly advantageous from an ecological and economic standpoint. They are widely accepted in many countries to meet the overall nationwide energy-efficiency objectives [7]. However, new buildings make up only a tiny fraction of the total building stock each year [8], especially in urban cores, and constructing green buildings does not offset the negative environmental impact of existing ones [9]. As a result, retrofitting existing buildings with energy-efficient features is of critical importance [10]. Currently, office buildings consume significantly more energy than other types of buildings in terms of heating, cooling, ventilation, and lighting. Therefore, there is a high potential for energy savings in existing office buildings, and retrofitting them with energy-efficient features can reduce the negative environmental impacts associated with their operation [11]. There are also economic and social benefits, such as reduced operating costs and improved user comfort [12,13].
The success of energy-efficiency retrofit projects requires extensive cooperation and support from various stakeholders [14,15]. In the context of green retrofitting decisions, owners and users play a crucial role among the internal stakeholders [16]. According to Ma et al., the initial intention phase is an essential component of the decision-making process regarding retrofitting [4]. Typically, only the owners and users are involved in this stage [17]. It is imperative to note that stakeholders have different interests and value perceptions [18]. The existence of a conflict of interests between them is one of the main reasons that hinder energy-efficiency retrofitting of buildings. Incentives from the government, as the external stakeholder, can be effective because increased costs, such as price premiums, adversely affect the willingness of all parties to participate [19,20]. However, relatively few studies have examined the effects of incentives on the retrofit of office buildings [21]. Furthermore, users’ coordination is more challenging in existing office buildings than in new construction or existing residential buildings. The reason for this is that complex leases may result in financial disputes [22]. Users’ acceptance can be improved by feasible incentive policies [23], but most policies are currently geared in favor of owners rather than users [16].
Due to the complexity of the market environment, each entity makes dynamic strategic decisions according to its resources and market conditions. To maximize the overall benefits of the energy-efficiency retrofit market, it is essential to study the behavioral strategies of each participant. The evolutionary game can provide a valuable insight into this dynamic process, and this paper presents a tripartite evolutionary game model in which government, office building owners, and end users are included. To explore the evolutionary process and evolutionary stabilization strategies of the participants, simulations are conducted using numerical examples. This study provides insights into the game strategy choices of stakeholders and can be used to promote high-quality development of the office building energy retrofit market.

2. Literature Review

2.1. Stakeholders in Energy-Efficient Retrofitting

According to previous literature, the main stakeholders in energy-efficiency retrofit projects include owners, users, facility managers, designers, contractors, subcontractors, suppliers, government, financial institutions, energy service companies, environmental organizations, professional associations, the media, and the general public [16,17,24,25]. Energy-efficiency retrofit projects involve more stakeholders than new construction projects, and their relationships are more complex [25,26]. Owners are the entities that own and benefit from the building, initiate retrofitting efforts, and develop retrofitting plans. Users are directly affected by the built environment. Their behavior largely determines energy efficiency, and indirectly affects the achievement of other stakeholders’ objectives [27,28]. Thus, owners and users are the primary stakeholders in the decision-making process [16,25]. In addition, government and policy factors play an influential role in the implementation of energy-efficiency retrofit programs in China [17]. Government guidance can drive stakeholders to invest more effort in energy-efficient retrofitting [29].
Owners of office buildings are critical in decision making, implementation, communication, and collaboration [17]. Energy-efficient retrofitting can bring economic benefits to businesses, including increased rents and occupancy, and lower energy costs [30]. It can also lead to broader non-economic benefits, such as improved indoor air quality, reduced emissions, enhanced social reputation, and improved market position [31]. These benefits may be highly motivating factors for owners [12]. Meanwhile, barriers and challenges faced by owners include long payback periods, a lack of retrofitting knowledge, limited access to advanced retrofitting technologies, and uncertainty about the extent of energy savings [16,20,32,33].
In energy-efficiency retrofit projects, users are frequently undervalued as opposed to owners. Because retrofitting existing buildings requires the cooperation and participation of users, it is more challenging than newly construction [14]. In general, users’ intentions are most directly affected by the price premium [9]. As incomes increase, people become more concerned with the improvements in life quality and productivity [34]. Office buildings are a special type of multi-occupied building in which the owners have a lease relationship with the users [22]. Energy-efficiency retrofit projects, however, do not impose contractual obligations on users [18]. The owner of an office building with many occupants is the dominant negotiator, while users have the option of “voting with their feet”. When a consensus cannot be reached, the users will relocate to another building, which increases the owner’s coordination and turnover costs [16].
Retrofitting buildings with green technologies has an externality [35]. This attribute benefits non-building owners while reducing the willingness of building owners to adopt these technologies. The use of policy instruments can be a valuable tool for eliminating externalities [36]. The government can provide financial support for building retrofits; for example, subsidies can be used to reduce the payback period of energy-efficiency retrofits [35,37]. Mandatory regulations may also be effective [20]. Further, informative policies can contribute to the promotion of appropriate technologies and increase the willingness of parties to participate in energy-efficient retrofits [38].

2.2. Research Methods for Energy-Efficient Retrofitting

A variety of research methods have been used to study stakeholders in energy-efficient retrofitting, including literature reviews [5,12,38,39], expert interviews [9,40], case studies [21,41,42], social network analysis (SNA) [17,25,43], and game theory [16,44]. However, these studies only statically analyze stakeholders, without considering the dynamic interaction effects between the stakeholders. Different from classical game theory, evolutionary games emphasize the “limited rationality” of actors. The players adjust their choices continuously, and seek the appropriate combination of strategies through a process of learning and imitation [45].
Buildings with externalities, such as green buildings, prefabricated buildings, and other structures, are extensively examined using evolutionary games [46]. Fan and Hui analyzed the effectiveness of green building incentives, and the evolution of government and real estate developers’ strategies using an evolutionary game model [7]. Chen et al. investigated the impact of policies on the promotion of green building technologies, using government and construction industry stakeholders as game players [47]. Du et al. researched the impact of carbon tax policy on the strategy choice of low-carbon building stakeholders, in the context of static and dynamic carbon taxes [48]. Huang et al. used an evolutionary game model to assess the costs and benefits for governments and real estate firms, to determine the factors that hinder the promotion of prefabricated residential buildings [46]. Furthermore, some scholars added game players to their research. Lu et al. developed a bilateral evolutionary game model that involved government, developers, and consumers to study the decision-making mechanisms of stakeholders in the green building market [49]. Liu et al. constructed a tripartite evolutionary game model including government, suppliers, and developers, to explore stakeholders’ incentives and decision behaviors in the green building supply market [50].
Overall, the existing studies have some shortcomings. First, previous studies on stakeholders’ behavior in retrofitting have mainly employed static analysis from a macro perspective. In such studies, stakeholders’ activities were not considered from a microeconomic perspective, and the evolution of strategies could not be reflected. Second, few studies examined the energy-efficiency retrofitting of existing buildings, whereas most evolutionary game studies focus on new green buildings. Furthermore, the complexity of occupants and contractual agreements in office buildings makes them unique in comparison to other building types. However, turnover costs associated with lease cancellations and user relocation are rarely considered in existing studies. Finally, the enthusiasm and cognitive ability of the public have a significant impact on energy-efficiency retrofitting [23,51], but the constraint of public willingness has rarely been considered in previous research on decision mechanisms.

3. Evolutionary Game Model Analysis

As the policy maker and monitor of energy-efficiency retrofits, the government has a social responsibility to protect the environment and achieve sustainable development. Office building owners seek to reduce their energy costs through energy-efficiency retrofits and are driven to do so by incentives and market pressures. Users are directly benefited by energy-efficiency retrofit projects. Energy-efficiency retrofit markets are driven primarily by users’ environmental protection concepts as well as their desire for high-quality living and working conditions. Energy-efficient retrofitting involves all three of these parties as essential players and stakeholders. Additionally, stakeholders aim to maximize their profits in all situations, and can adjust their strategies accordingly. Their strategies can significantly influence the state of the energy-efficiency retrofit market and its performance. Evolutionary game theory can be used to analyze the interaction between the three parties. Therefore, this study selects the government, office building owners, and end users as players in the evolutionary game model.

3.1. Model Assumption

In this study, model parameters are derived from quantified costs and benefits. The tripartite evolutionary game model is developed based on the expected benefits of different stakeholders to analyze the evolutionary paths under diverse interest demands.
The following assumptions serve as the basis for the construction of the game model (the meanings of the parameters are shown in Table 1):
(1) Major players are simplified for the government, office building owners, and users. All three players are a large group of bounded rationality. They will make judgments based on limited knowledge and information, and adjust their strategies in response to behavioral feedback offered by other subjects, eventually leading to a specific stable strategy;
(2) There are two strategies for each player. The probability of the government’s adoption of positive supervision is x, and the probability of negative supervision is 1 − x, 0 < x < 1; the probability of office building owners implementing retrofits is y, and the probability of not implementing is 1 − y, 0 < y < 1; the probability of users accepting energy-efficient retrofitting is z, and the probability of not accepting is 1 − z, 0 < z < 1;
(3) The government adopts incentives and penalties for participants as positive supervision, while negative supervision is the reverse. In the case of positive supervision, the government uses financial subsidies and other means to ease the cost pressure on owners, and the subsidy is recorded as SR. If owners fail to make retrofits, the government will charge them a penalty P. The government will also provide subsidies SU to users to improve their acceptance of energy-efficiency retrofitting. The cost of positive supervision is GP, and the cost of negative supervision is α G P , 0 < α   < 1. The benefits of energy-efficiency retrofitting on the environment and society are W;
(4) Office building owners are typically expected to earn E1 and spend C1 upon maintenance. Energy-efficient retrofits will generate additional income Δ E 1 and incremental costs Δ C 1 for property owners. In general, users have traditional incomes of E2 and basic costs of C2. If the retrofit is accepted, they can obtain the additional benefit Δ E 2 and pay the incremental cost Δ C 2 . If the owner does not retrofit and the user expects to receive services related to energy saving, the users will decide to relocate. In this case, the lease cancellation increases the owner’s turnover costs, T. There are no incremental benefits to be gained by all three parties. In general, occupancy and unit rents increase following energy-efficiency retrofits [16]. As a result, after retrofitting, even if users move because of the price premium, the owner can recover the turnover costs from the new tenants;
(5) This study incorporates the constraint of public willingness into the game model. When users are environmentally conscious and desire to use energy-efficient buildings, the government will incur losses D if it adopts negative supervision, which is contrary to public preference.

3.2. Model Building

A payoff matrix involving the government, property owners, and users is presented in Table 2 after considering the assumptions above.
The expected payoff of “positive supervision” is E 11 , and that of “negative supervision” is E 12 . The average expected payoff of the government is E 1 ¯ . The equations are shown below:
E 11 = y z ( W G P S R S U ) + y ( 1 z ) ( W G P S R ) + ( 1 y ) z ( P G P ) + ( 1 y ) ( 1 z ) ( P G P )
E 12 = y z ( W α G P D ) + y ( 1 z ) ( W α G P ) + ( 1 y ) z ( α G P D ) + ( 1 y ) ( 1 z ) ( α G P )
E 1 ¯ = x E 11 + ( 1 x ) E 12
The replication dynamics equation of the government is shown as follows:
F ( x ) = d x d t = x ( E 11 E 1 ¯ ) = x ( x 1 ) [ y ( S R + P ) z D + y z S U P + ( 1 α ) G p ]
The expected payoff of “implementing” is E 21 , and that of “non-implementing” is E 22 . The average expected payoff of the owners is E 2 ¯ . The equations are shown below:
E 21 = x z ( E 1 + Δ E 1 + S R C 1 Δ C 1 ) + x ( 1 z ) ( S R C 1 Δ C 1 ) + ( 1 x ) z ( E 1 + Δ E 1 C 1 Δ C 1 ) + ( 1 x ) ( 1 z ) ( C 1 Δ C 1 )
E 22 = x z ( E 1 C 1 T P ) + x ( 1 z ) ( E 1 C 1 P ) + ( 1 x ) z ( E 1 C 1 T ) + ( 1 x ) ( 1 z ) ( E 1 C 1 )
E 2 ¯ = y E 21 + ( 1 y ) E 22
The replication dynamics equation of the owners is shown as follows:
F ( y ) = d y d t = y ( E 21 E 2 ¯ ) = y ( 1 y ) [ x ( P + S R ) + z ( T + E 1 + Δ E 1 ) Δ C 1 E 1 ]
The expected payoff of “acceptance” is E 31 , and that of “rejection” is E 32 . The average expected payoff of the users is E 3 ¯ . The equations are shown below:
E 31 = x y ( E 2 + Δ E 2 + S U C 2 Δ C 2 ) + x ( 1 y ) ( E 2 C 2 ) + ( 1 x ) y ( E 2 + Δ E 2 C 2 Δ C 2 ) + ( 1 x ) ( 1 y ) ( E 2 C 2 )
E 32 = x y ( E 2 C 2 ) + x ( 1 y ) ( E 2 C 2 ) + ( 1 x ) y ( E 2 C 2 ) + ( 1 x ) ( 1 y ) ( E 2 C 2 )
E 3 ¯ = z E 31 + ( 1 z ) E 32
The replication dynamics equation of the users is shown as follows:
F ( z ) = d z d t = z ( E 31 E 3 ¯ ) = z ( 1 z ) ( x S u + Δ E 2 Δ C 2 ) y

3.3. Analysis of Model’s Evolutionary Stability Strategy

Evolutionary stability strategy (ESS) indicates that the group will eventually settle on a relatively dominant strategy over time. This is the strategy adopted by the majority of individuals in the population, whereas the strategy adopted by a few mutant individuals will have a small chance of winning in a competitive situation [52]. The above replication dynamic equations can be used to determine possible equilibrium points. As mixed strategy equilibria cannot be evolutionary stable in asymmetric games [53], this study discussed only the asymptotic stability of pure strategy equilibrium points here: (0,0,0), (1,0,0), (0,1,0), (0,0,1), (1,1,0), (1,0,1), (0,1,1), (1,1,1).
According to Formulas (4), (8) and (12), the Jacobian matrix of the model can be obtained. The calculation process is expressed as follows:
J = [ F ( x ) x F ( x ) y F ( x ) z F ( y ) x F ( y ) y F ( y ) z F ( z ) x F ( z ) y F ( z ) z ] = [ J 1 J 2 J 3 J 4 J 5 J 6 J 7 J 8 J 9 ]
Among them
{ J 1 = ( 1 2 x ) [ y ( S R + P ) + z D 1 y z S u + P + ( α 1 ) G p ] J 2 = x ( x 1 ) ( S R + P + z S u ) J 3 = x ( 1 x ) ( D y S u ) J 4 = y ( 1 y ) ( P + S R ) J 5 = ( 1 2 y ) [ x ( P + S R ) + z ( D 2 + E 1 + Δ E 1 ) Δ C 1 E 1 ] J 6 = y ( 1 y ) ( T + E 1 + Δ E 1 ) J 7 = z ( 1 z ) S u y J 8 = z ( 1 z ) ( x S u + Δ E 2 Δ C 2 ) J 9 = ( 1 2 z ) ( x S u + Δ E 2 Δ C 2 ) y  
According to the Lyapunov indirect method, if all the eigenvalues of the Jacobi matrix are negative, the equilibrium point is asymptotically stable; if at least one of the eigenvalues is positive, the equilibrium point is unstable; and if all the eigenvalues are negative except for those with zero value, the equilibrium point is in a critical state, and stability cannot be determined by the sign of the eigenvalues. This study brought the equilibrium points into the Jacobi matrix, obtained their eigenvalues, and analyzed the stability of each equilibrium point. As shown in Table 3, the equilibrium points (0,0,0), (1,0,0), (0,1,0), (0,0,1), (1,1,0), (1,0,1) are not evolutionary stable points. The stability conditions for (0,1,1), (1,1,1) were further discussed.
  • Scenario 1:
When Δ E 1 < Δ C 1 and Δ E 2 < Δ C 2 , property owners and users benefit from energy-efficiency retrofits less than their incremental costs. Since the market for energy-efficiency retrofits is in its infancy, and green retrofit technology has not yet matured, the government should provide incentives to promote the development of energy-efficiency retrofits. The government, owners, and users will take positive action only if D S R S u + ( α 1 ) G p > 0 ,   S u + Δ E 2 Δ C 2 > 0 and P + S R + T + Δ E 1 Δ C 1 > 0 . The optimal equilibrium point would be (1,1,1).
  • Scenario 2:
When Δ E 1 > Δ C 1 and Δ E 2 < Δ C 2 , the incremental benefits of positive action by owners are greater than the incremental costs because of advances in green retrofit technology. Users still pay a higher premium for energy-efficient buildings than the additional benefits, and positive action is only taken when government subsidy is provided. When D S R S u + ( α 1 ) G p > 0 and S u + Δ E 2 Δ C 2 > 0 , the government subsidy compensates the cost burden of the premium to users, and the benefits of government positive supervision are greater than negative supervision. The optimal equilibrium point would be (1,1,1).
  • Scenario 3:
When Δ E 1 < Δ C 1 and Δ E 2 > Δ C 2 , under the conditions that D S R S u + ( α 1 ) G p > 0 and Δ C 1 P S R T Δ E 1 < 0 , the incremental benefits of positive actions by all three players are higher than the incremental costs. The optimal equilibrium point would be (1,1,1). Under the conditions that D S R S u + ( α 1 ) G p < 0 and T + Δ E 1 Δ C 1 > 0 , the benefits of government positive supervision are smaller than negative, while the turnover cost constrains the owners so that the firms tend to take positive actions. The optimal equilibrium point would be (0,1,1).
  • Scenario 4:
When Δ E 1 > Δ C 1 and Δ E 2 > Δ C 2 , both owners and users will realize more benefits than incremental costs. The benefits of government’s positive supervision are higher under the condition of D S R S u + ( α 1 ) G p > 0 , and the optimal equilibrium point would be (1,1,1). Under the condition of D S R S u + ( α 1 ) G p < 0 , the benefits of negative government supervision are higher, and the optimal equilibrium point would be (0,1,1).

4. Numerical Simulation

This study visualized the dynamic behavior of the government, office building owners, and users to further investigate the evolution of their strategies in different scenarios. A numerical simulation was conducted using MATLAB R2021a to investigate the effects of initial strategies and parameters. The analysis of game theories requires relative values rather than absolute values [16], so using numerical examples can help overcome the lack of data in the analysis. Therefore, a numerical example was used in this study.
An office building completed in 2006 in Beijing (China), with a total floor area of approximately 194,000 square meters, was selected for this study. Green retrofitting was undertaken by the property owner to build a world-class office building. In recognition of the energy-saving retrofit, this project has been awarded the China three-star Green Building Label as well as LEED-EB Platinum certification. It was estimated that 4,850,000 kWh of energy and 616 tons of standard coal were saved annually. According to the calculation method of Liu et al. [10], these savings were converted into economic and environmental benefits. In this study, the parameters’ values were set based on policies and regulations, literature studies, second-hand cases, and actual market conditions [49,54,55,56]. Table 4 shows the specific parameter values:

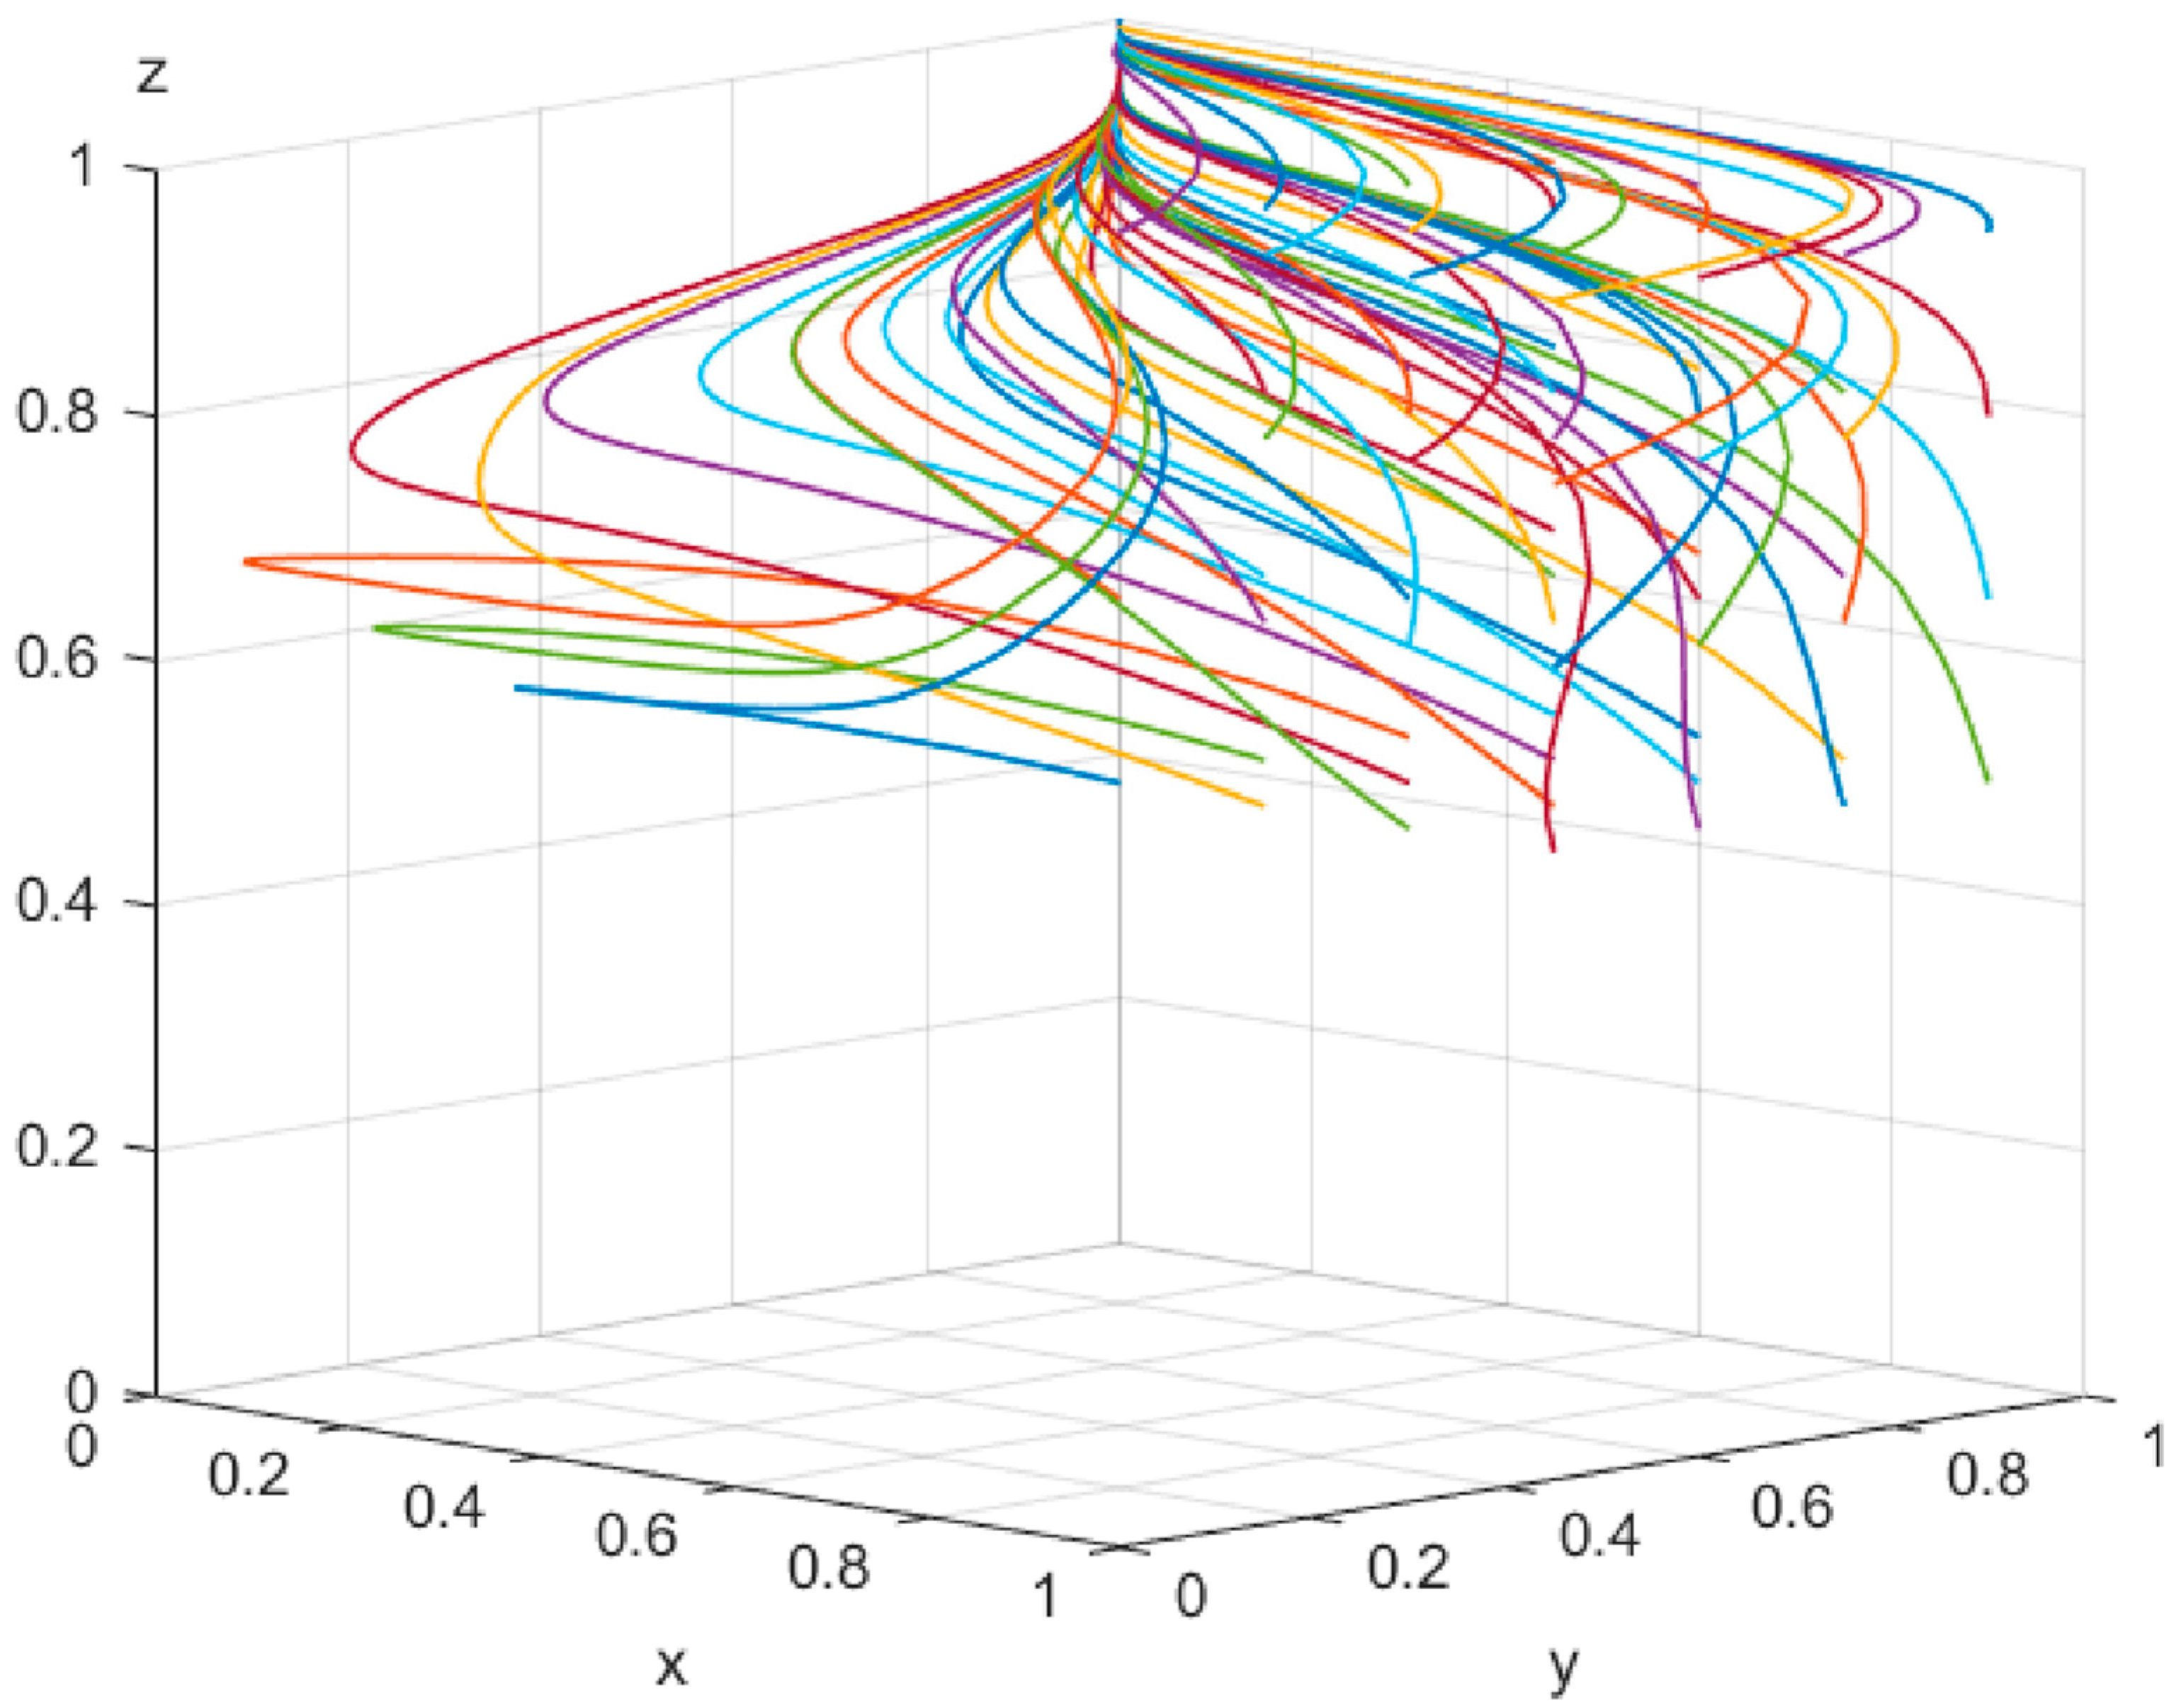
4.1. Model Verification

The initial values of the parameters in Table 4 are in accordance with the requirements of Δ E 1 > Δ C 1 ,   Δ E 2 > Δ C 2 , and D S R S u + ( α 1 ) G p < 0 . The set of values was simulated 50 times based on different initial strategy combinations. According to Figure 1, the simulation result (0,1,1) is the stable equilibrium point, which is consistent with the conclusion reached in Scenario 4. Consequently, the numerical simulation confirms and validates the stability analysis of each player’s strategy. It has the potential to provide realistic guidance.

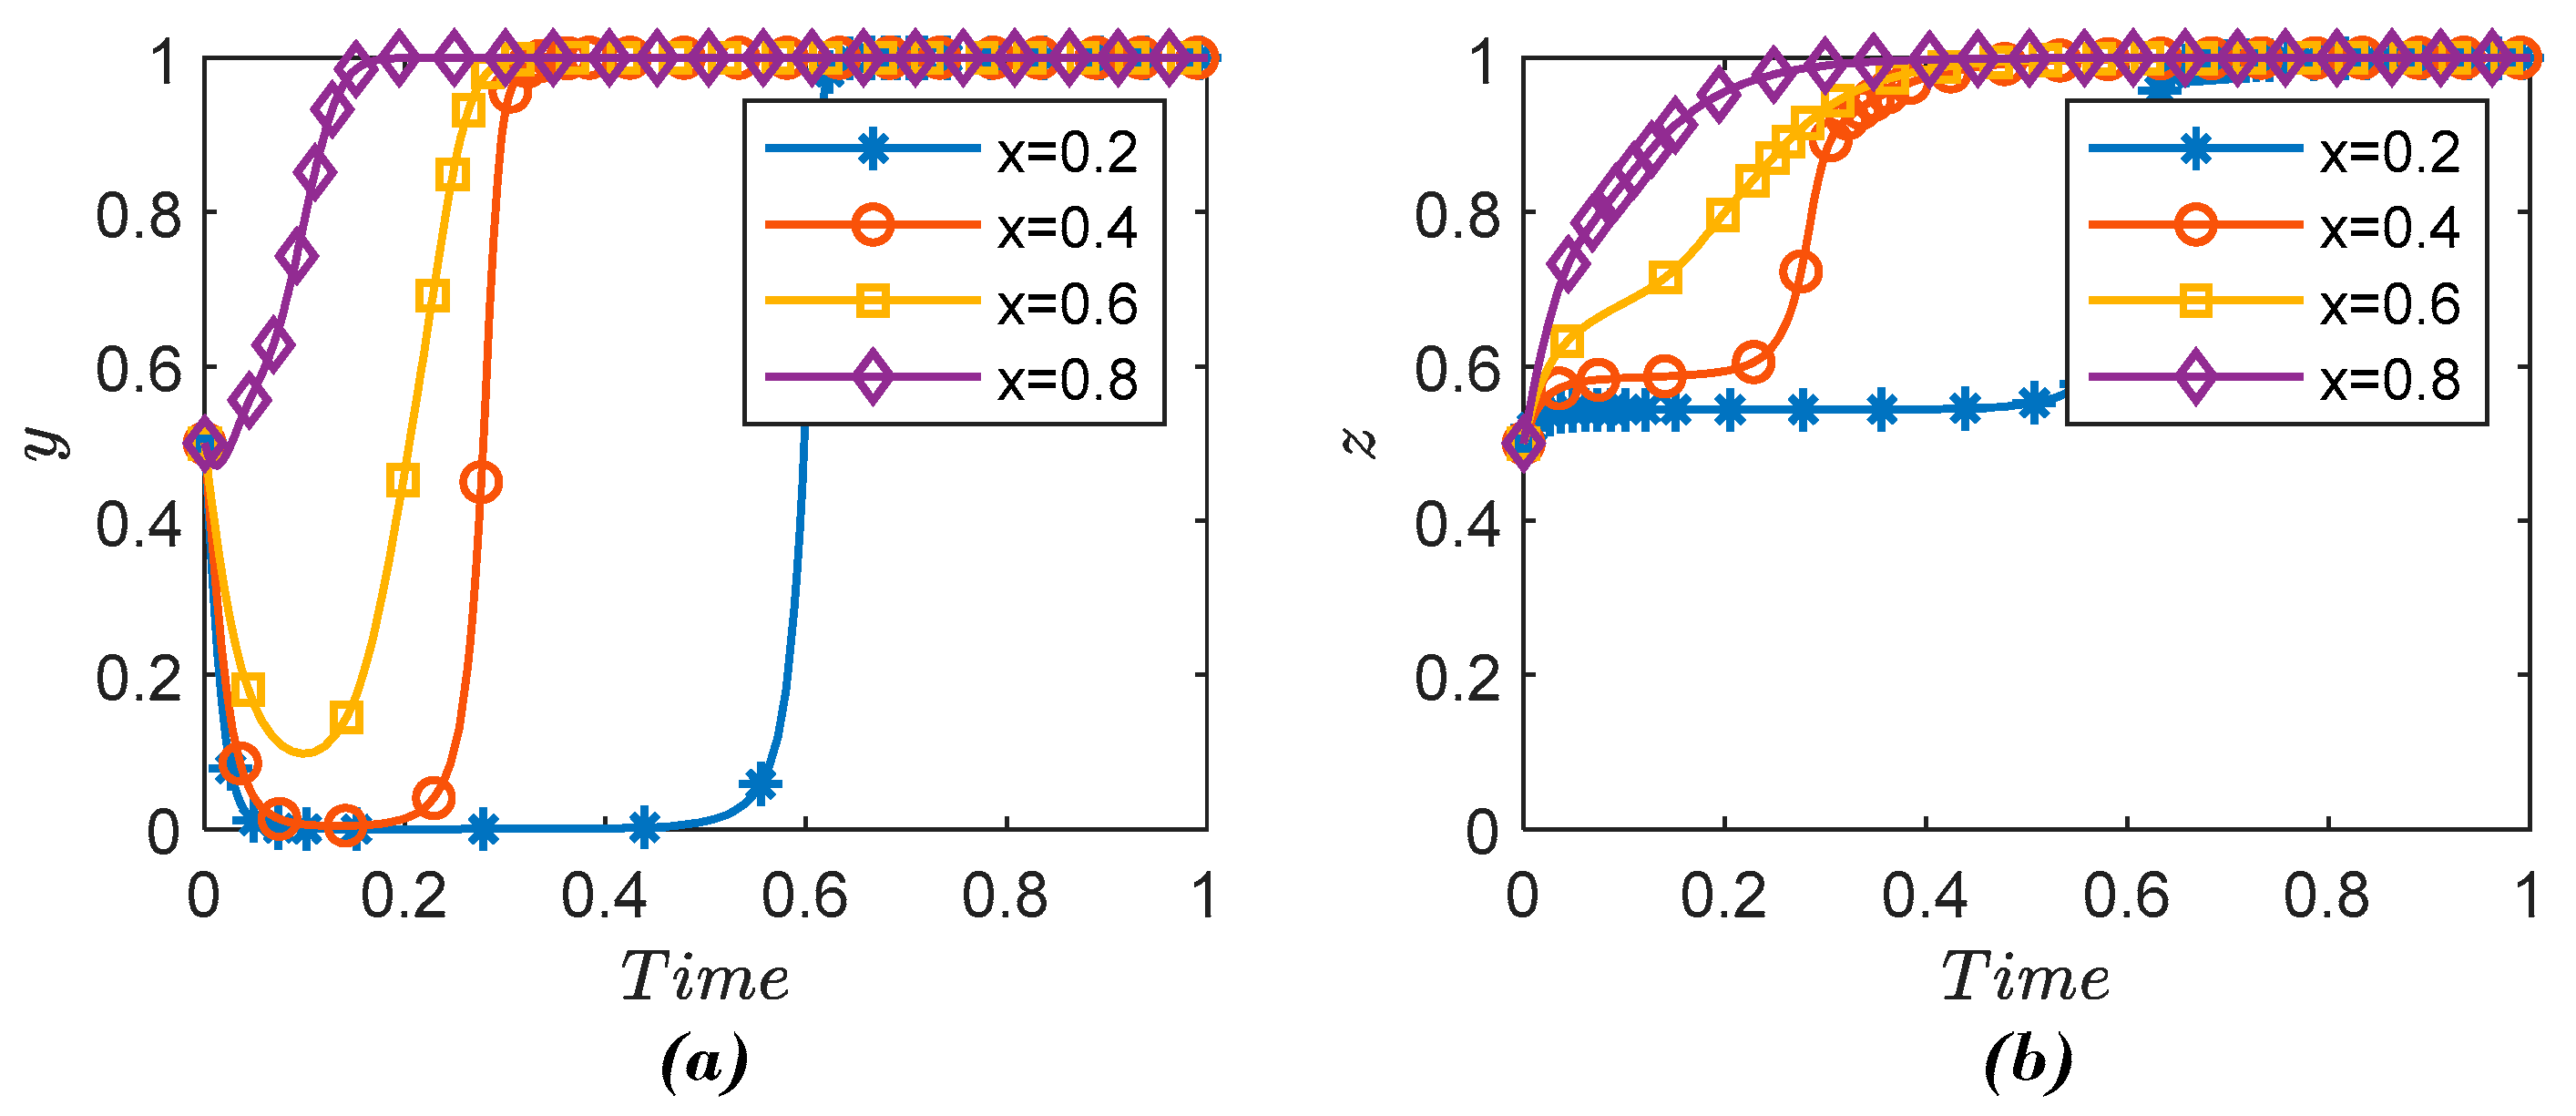
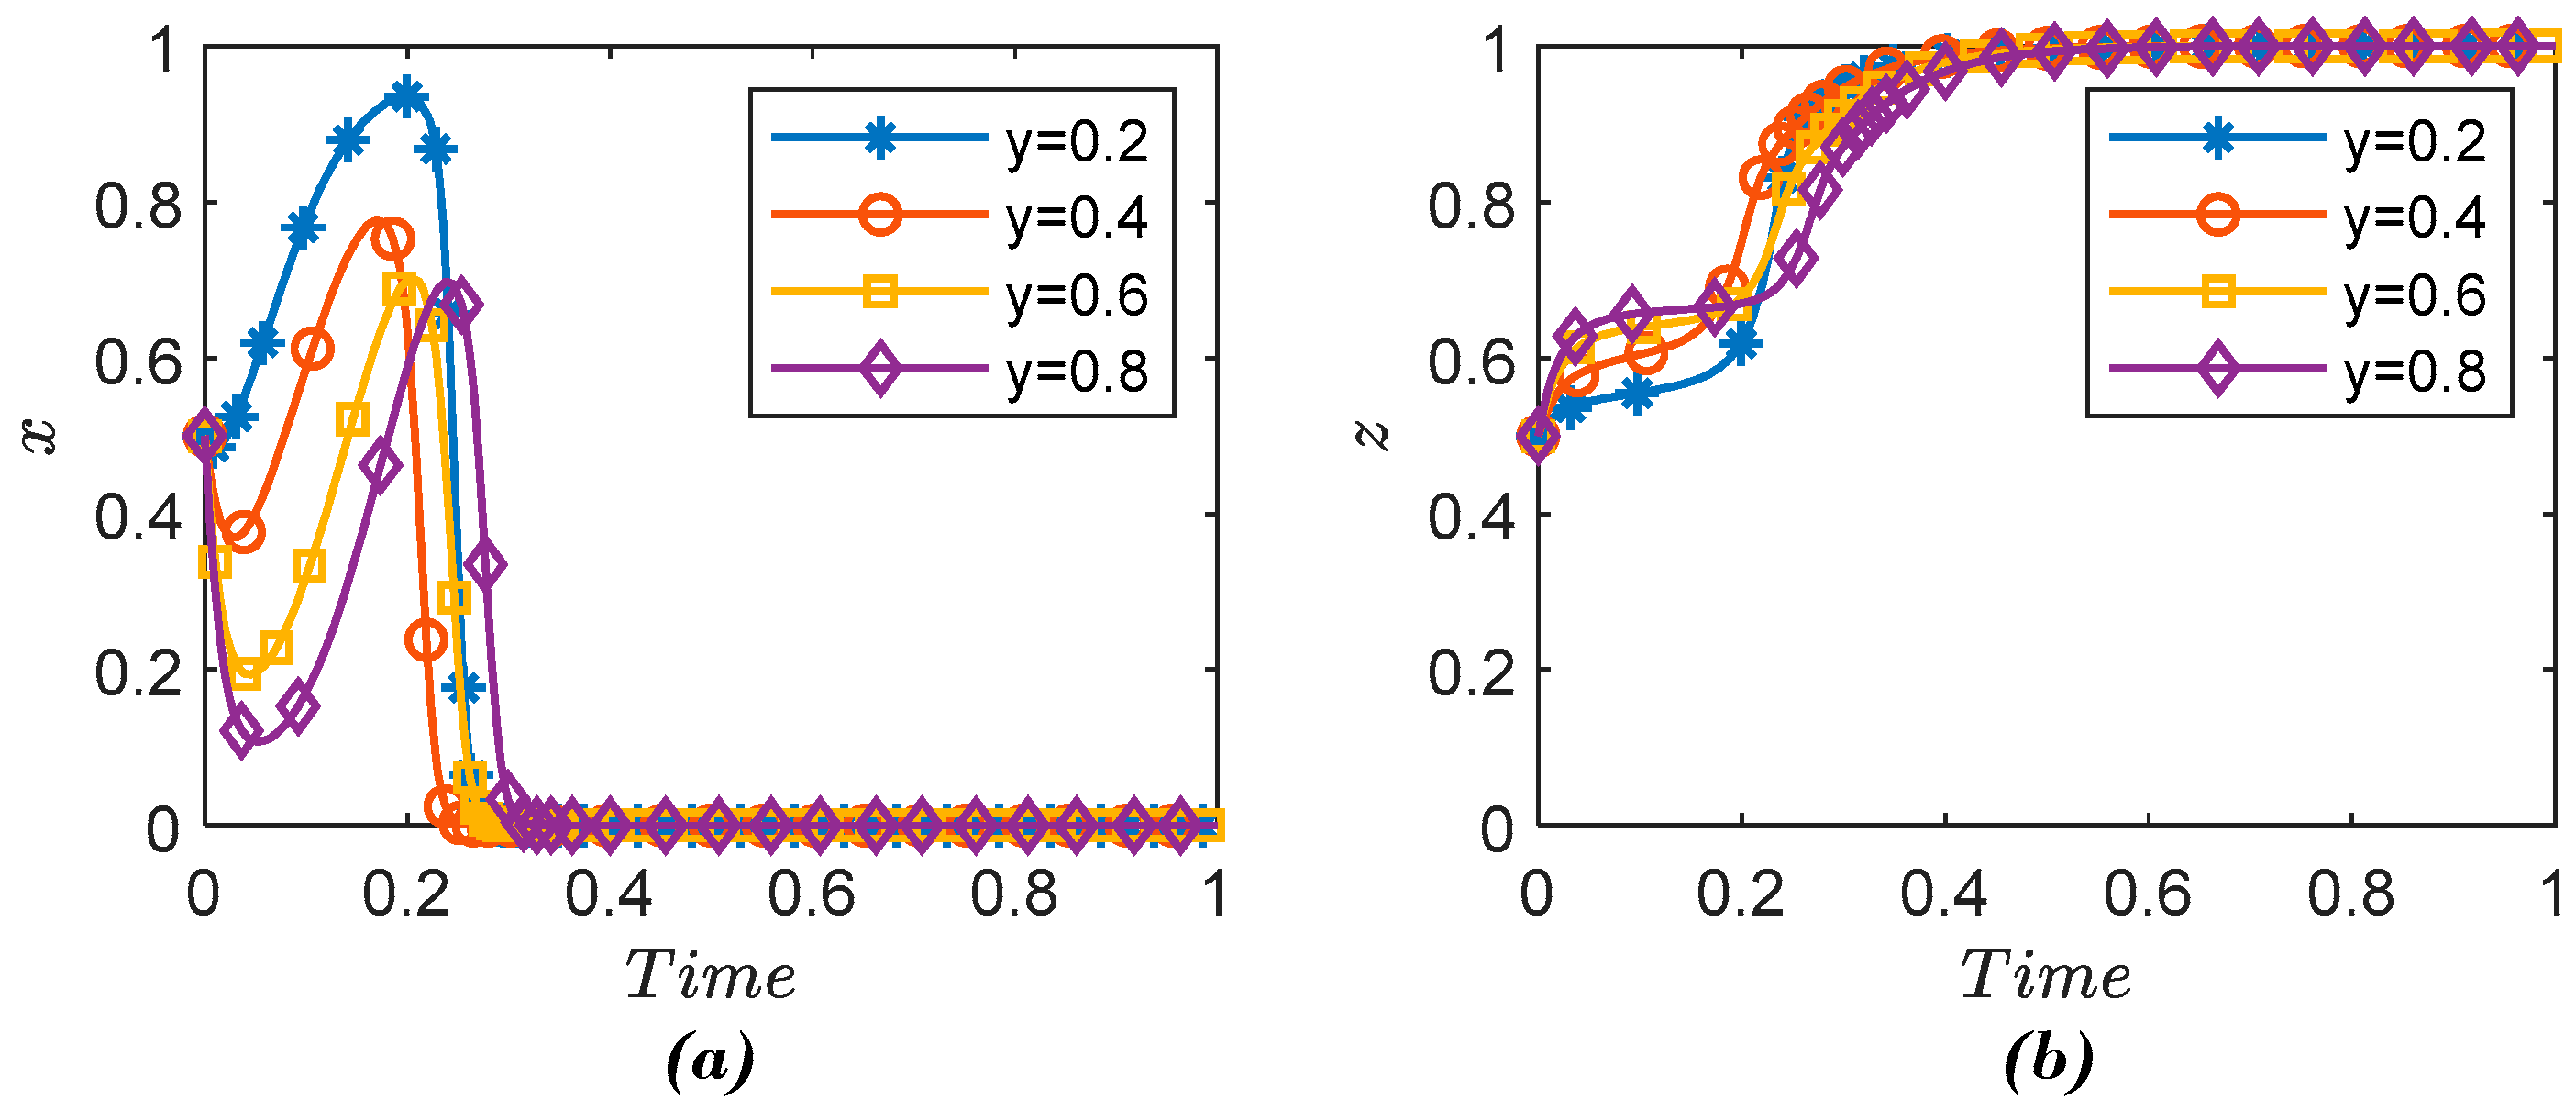
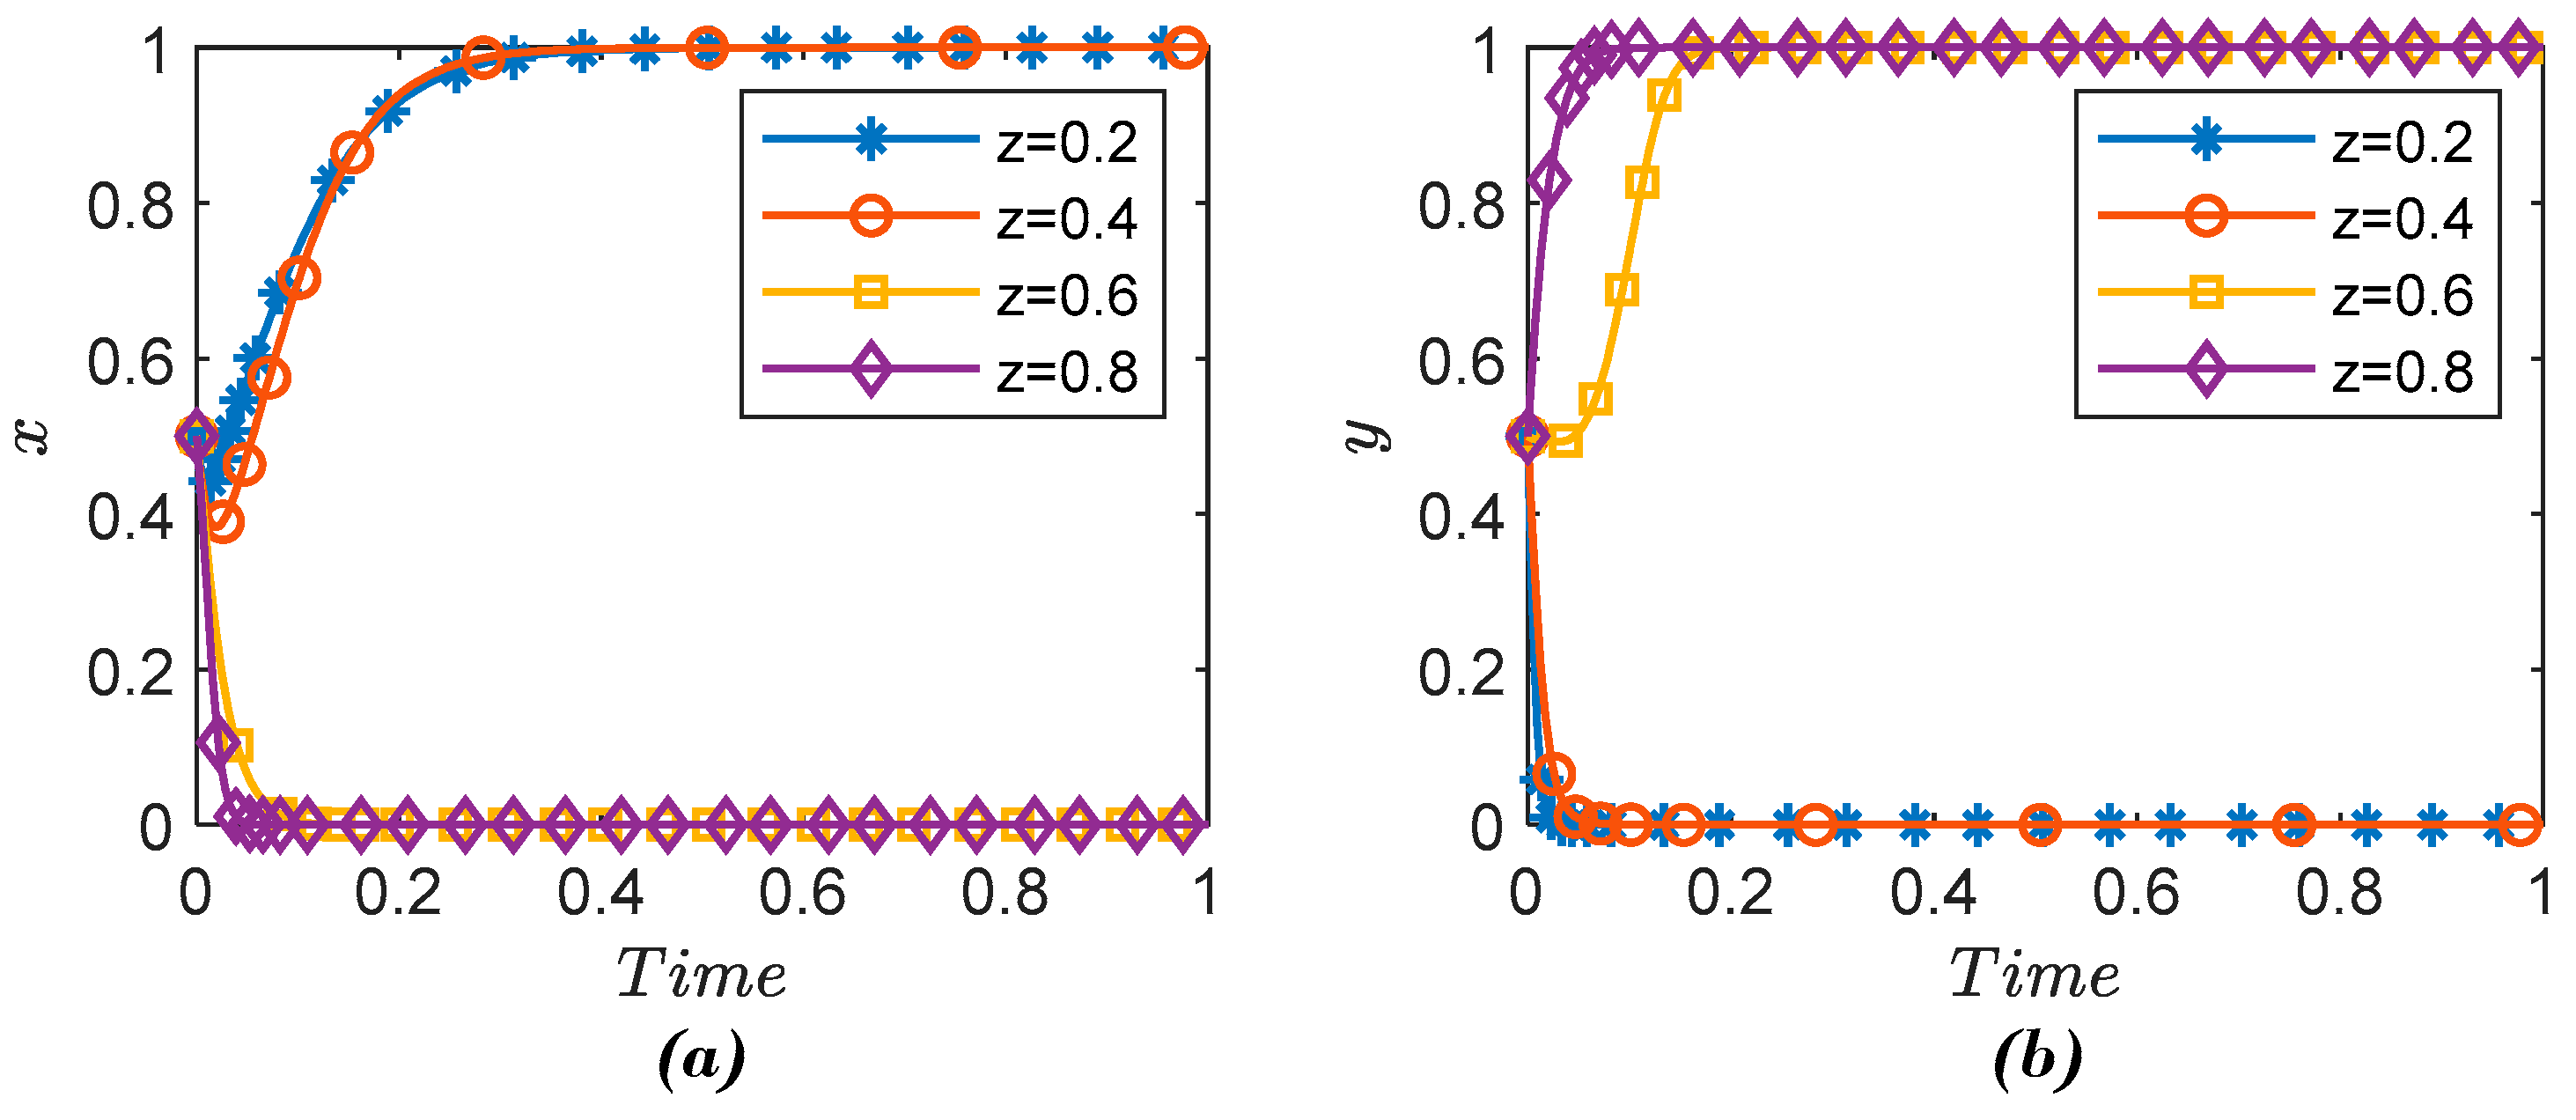
4.2. Simulation Analysis

4.2.1. The Impact of Initial Strategy on System Evolution

Keeping y = 0.5 and z = 0.5 unchanged, the initial strategy x for the government to adopt positive supervision increases sequentially from 0.2 to 0.8. Figure 2 shows that the higher the probability of the government’s initial strategy, the faster the evolution of positive actions from owners and users. Figure 2a illustrates that when the probability of positive supervision is relatively low, owners are less likely to make energy-efficient retrofits initially. As x increases, y converges more rapidly. It may be that green technology is still immature at the beginning of the green retrofit market, and the cost premium is relatively high, making owners reluctant to retrofit. Incentives from the government can motivate owners to keep abreast of market trends and increase their energy efficiency. As shown in Figure 2b, low intentions of positive government action have little impact on user behavior. Increasing x accelerates the acceptance of energy-efficient buildings by users.
Keeping x = 0.5 and z = 0.5 unchanged, the initial strategy y for owners choosing to implement energy-efficiency retrofits increases sequentially from 0.2 to 0.8. According to Figure 3, the rate of convergence of government and users’ behavior is generally positively correlated with y. Figure 3a illustrates that government tends to converge to “negative supervision” as the probability of the owner making the retrofit increases. This indicates that property owners may be able to play a more dominant role in the market’s development as the supply side. When the market has reached maturity, the government may decide to withdraw.
Keeping x = 0.5 and y = 0.5 unchanged, the initial strategy z for users choosing to accept energy-efficiency retrofits increases sequentially from 0.2 to 0.8. According to Figure 4a, when the probability of positive action by users is high the government does not need to provide incentives, resulting in a convergence towards “negative supervision”. Figure 4b shows that y increases as z increases, and gradually decreases as z decreases. In addition, y changes at a faster rate than x. It may be that users, who represent the demand side, have a powerful influence on the behavior of suppliers.

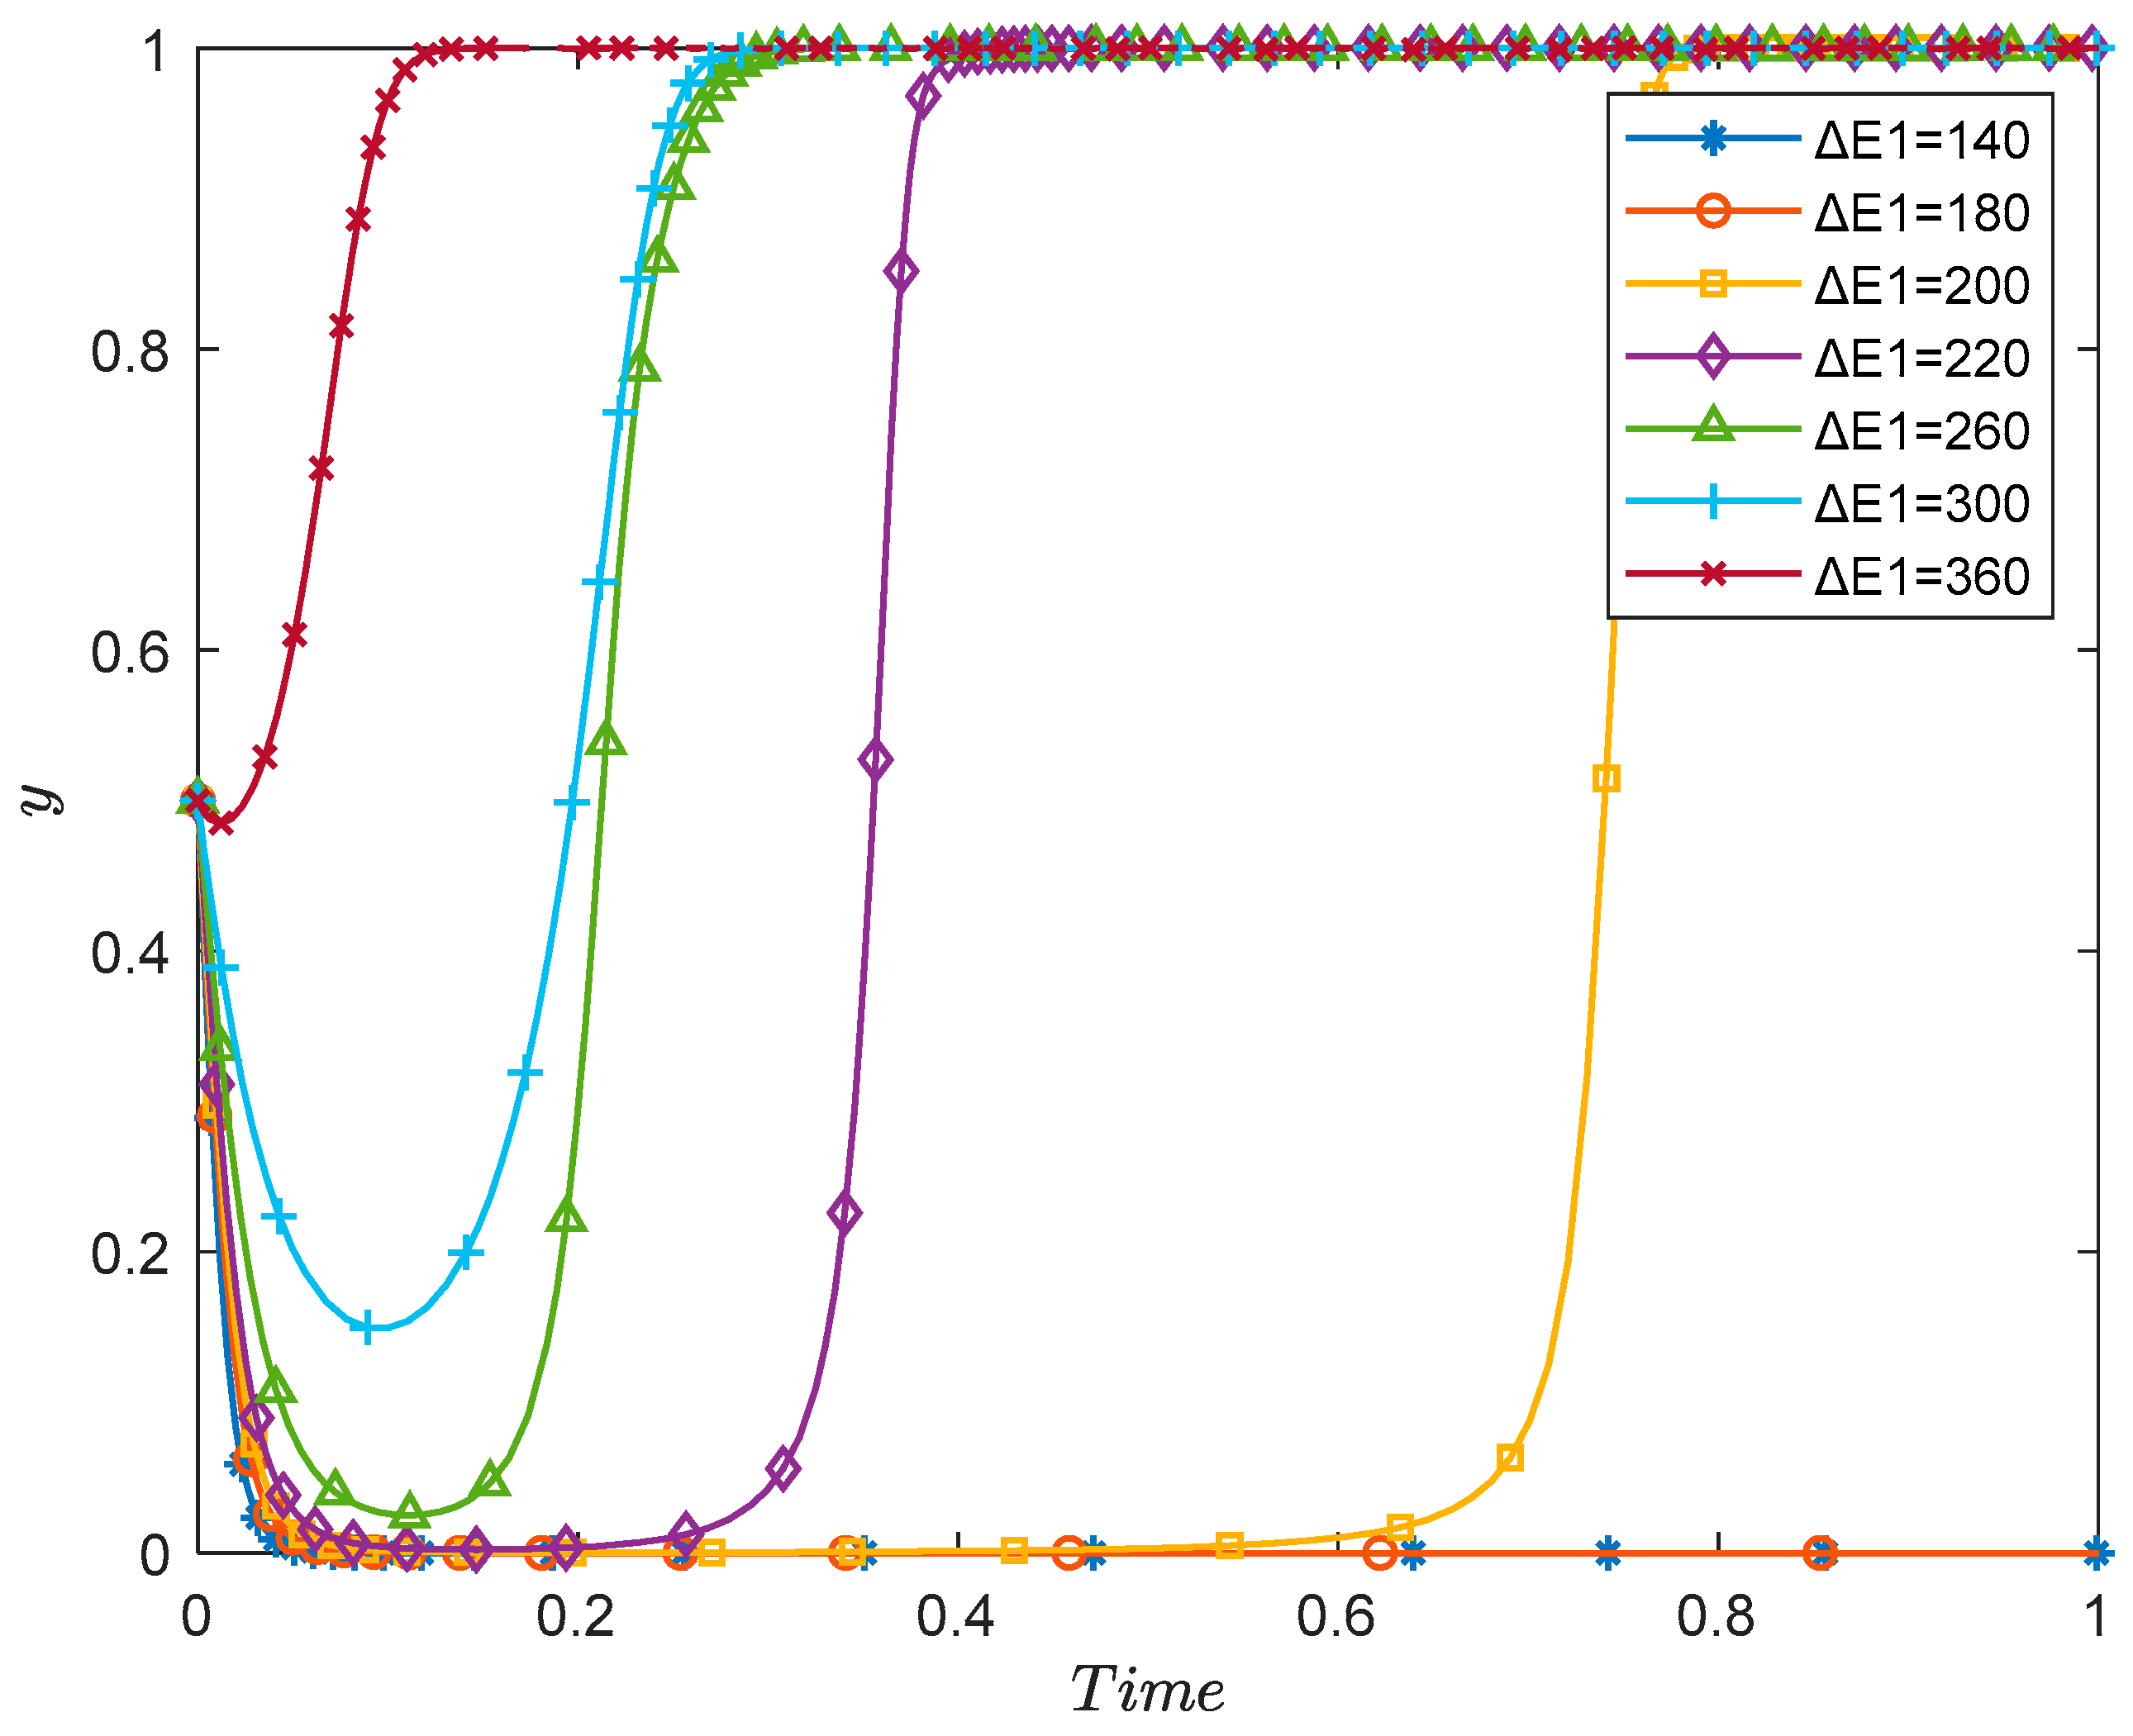
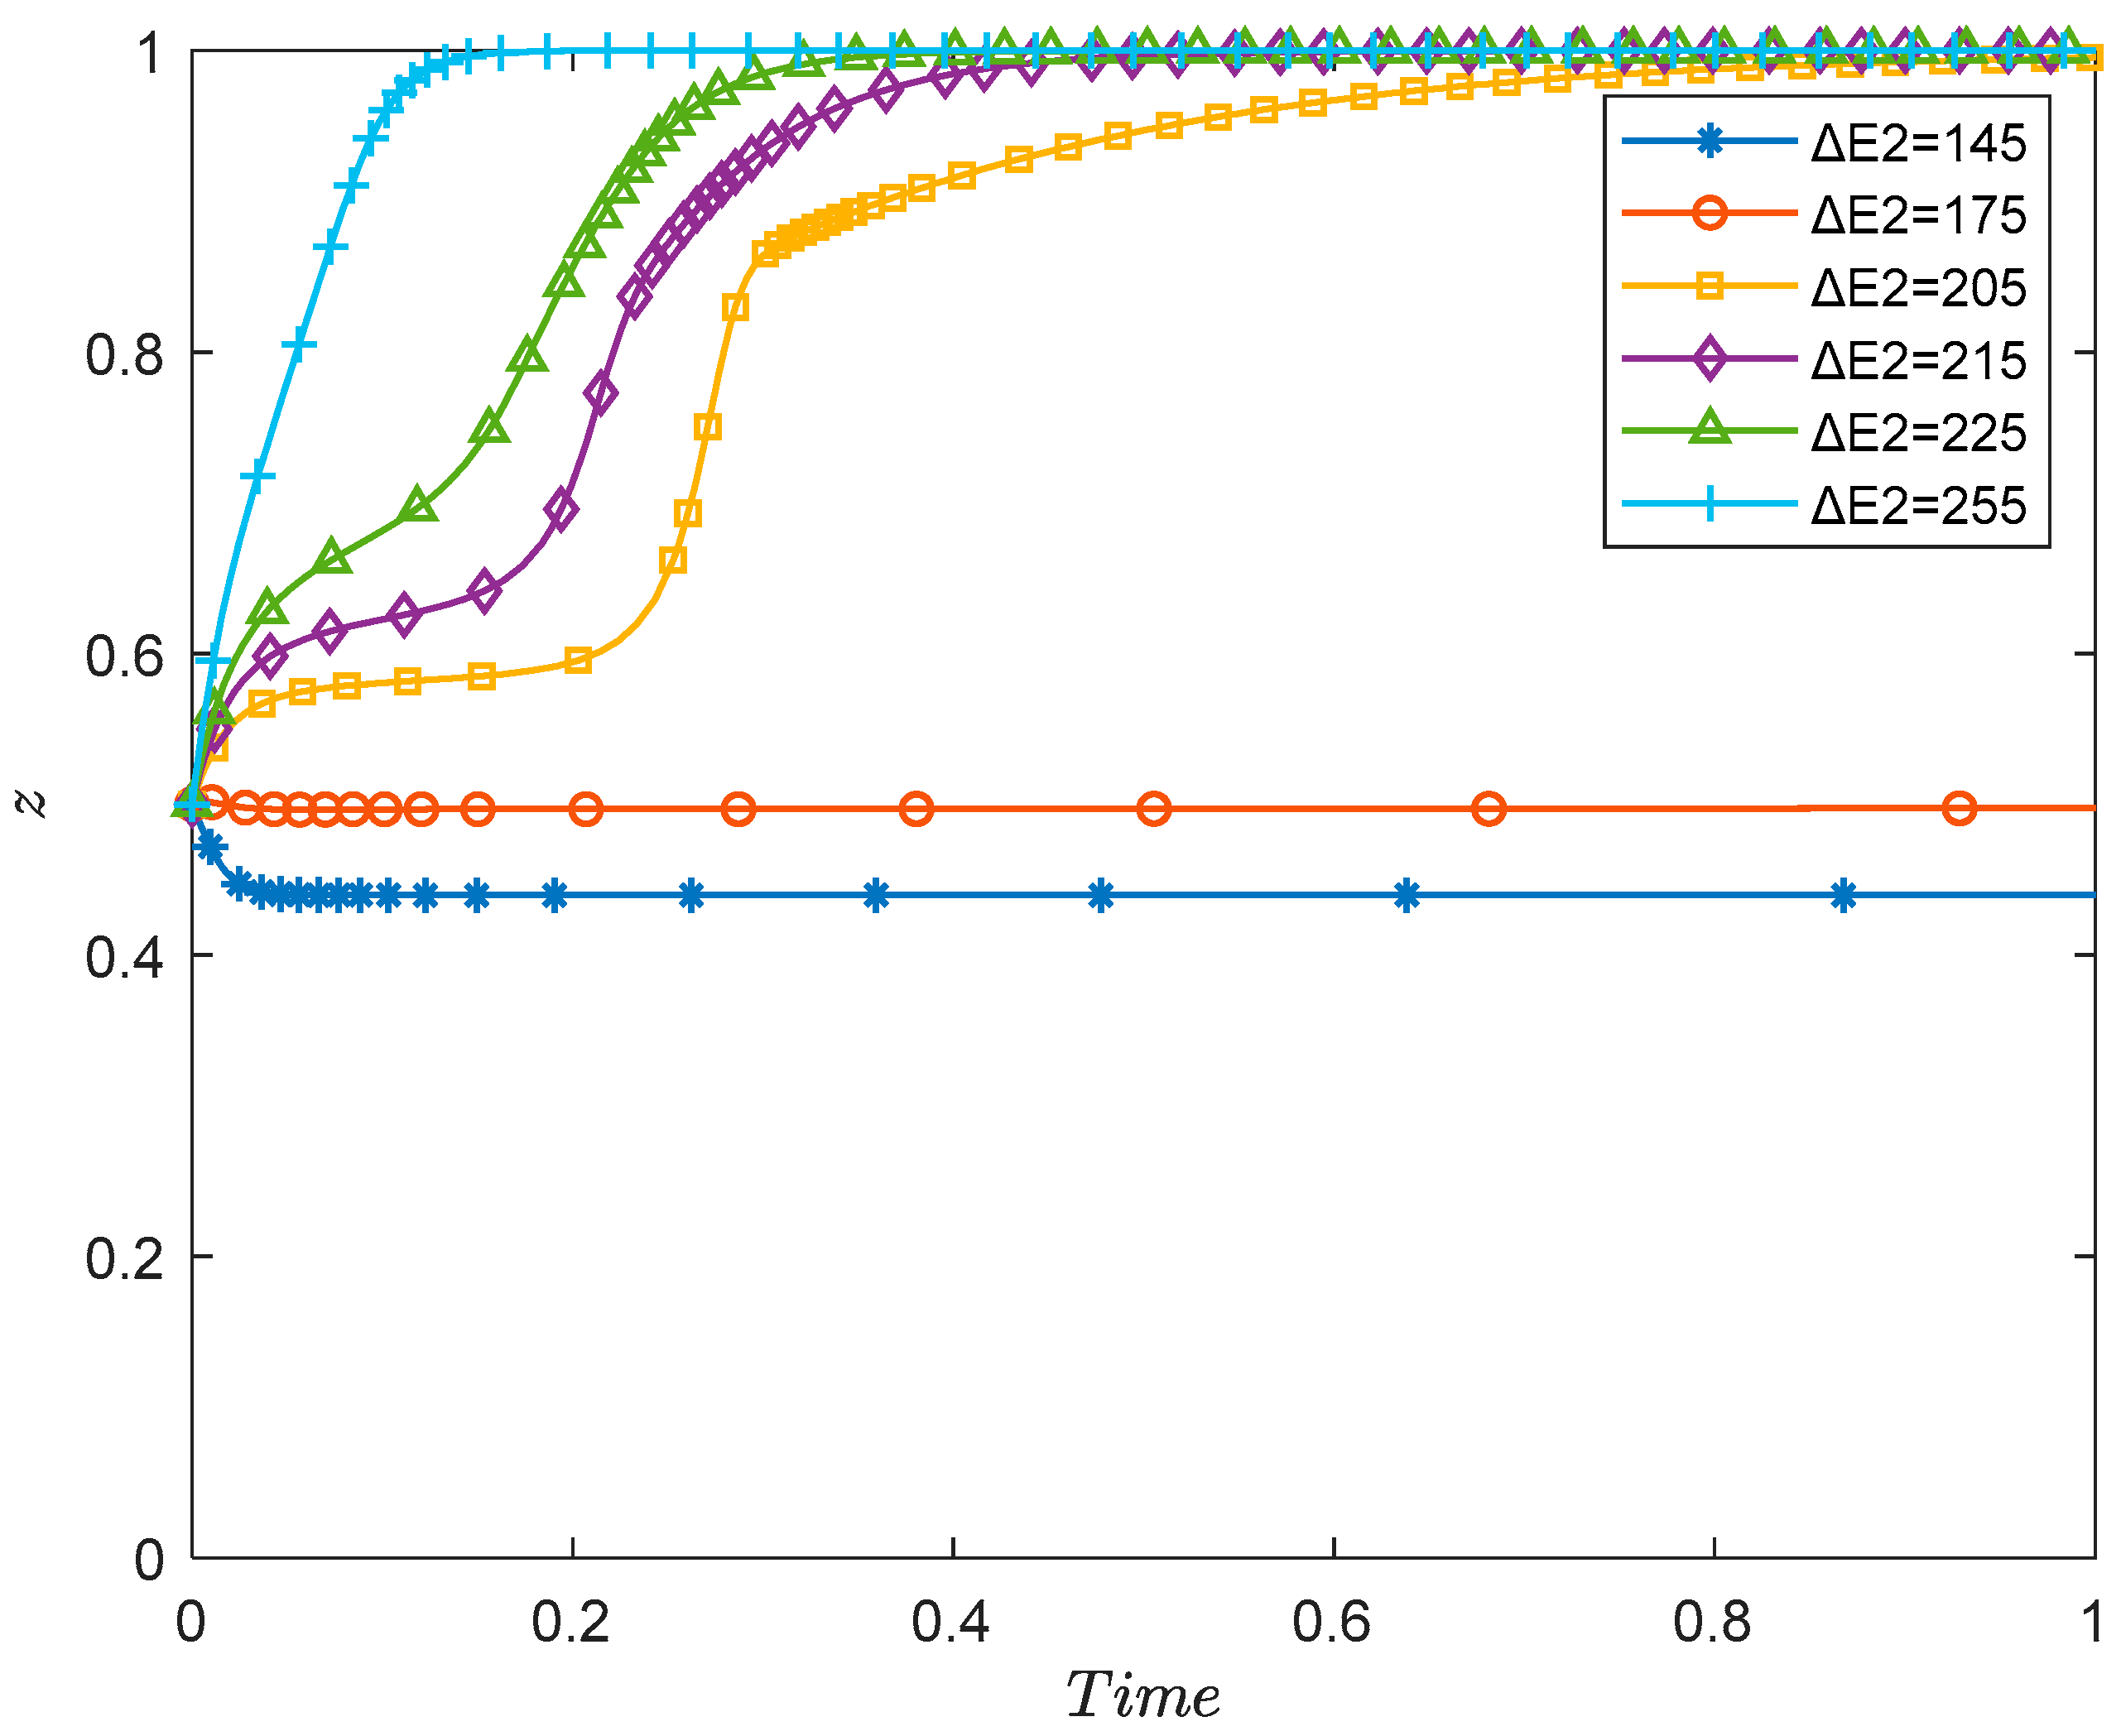
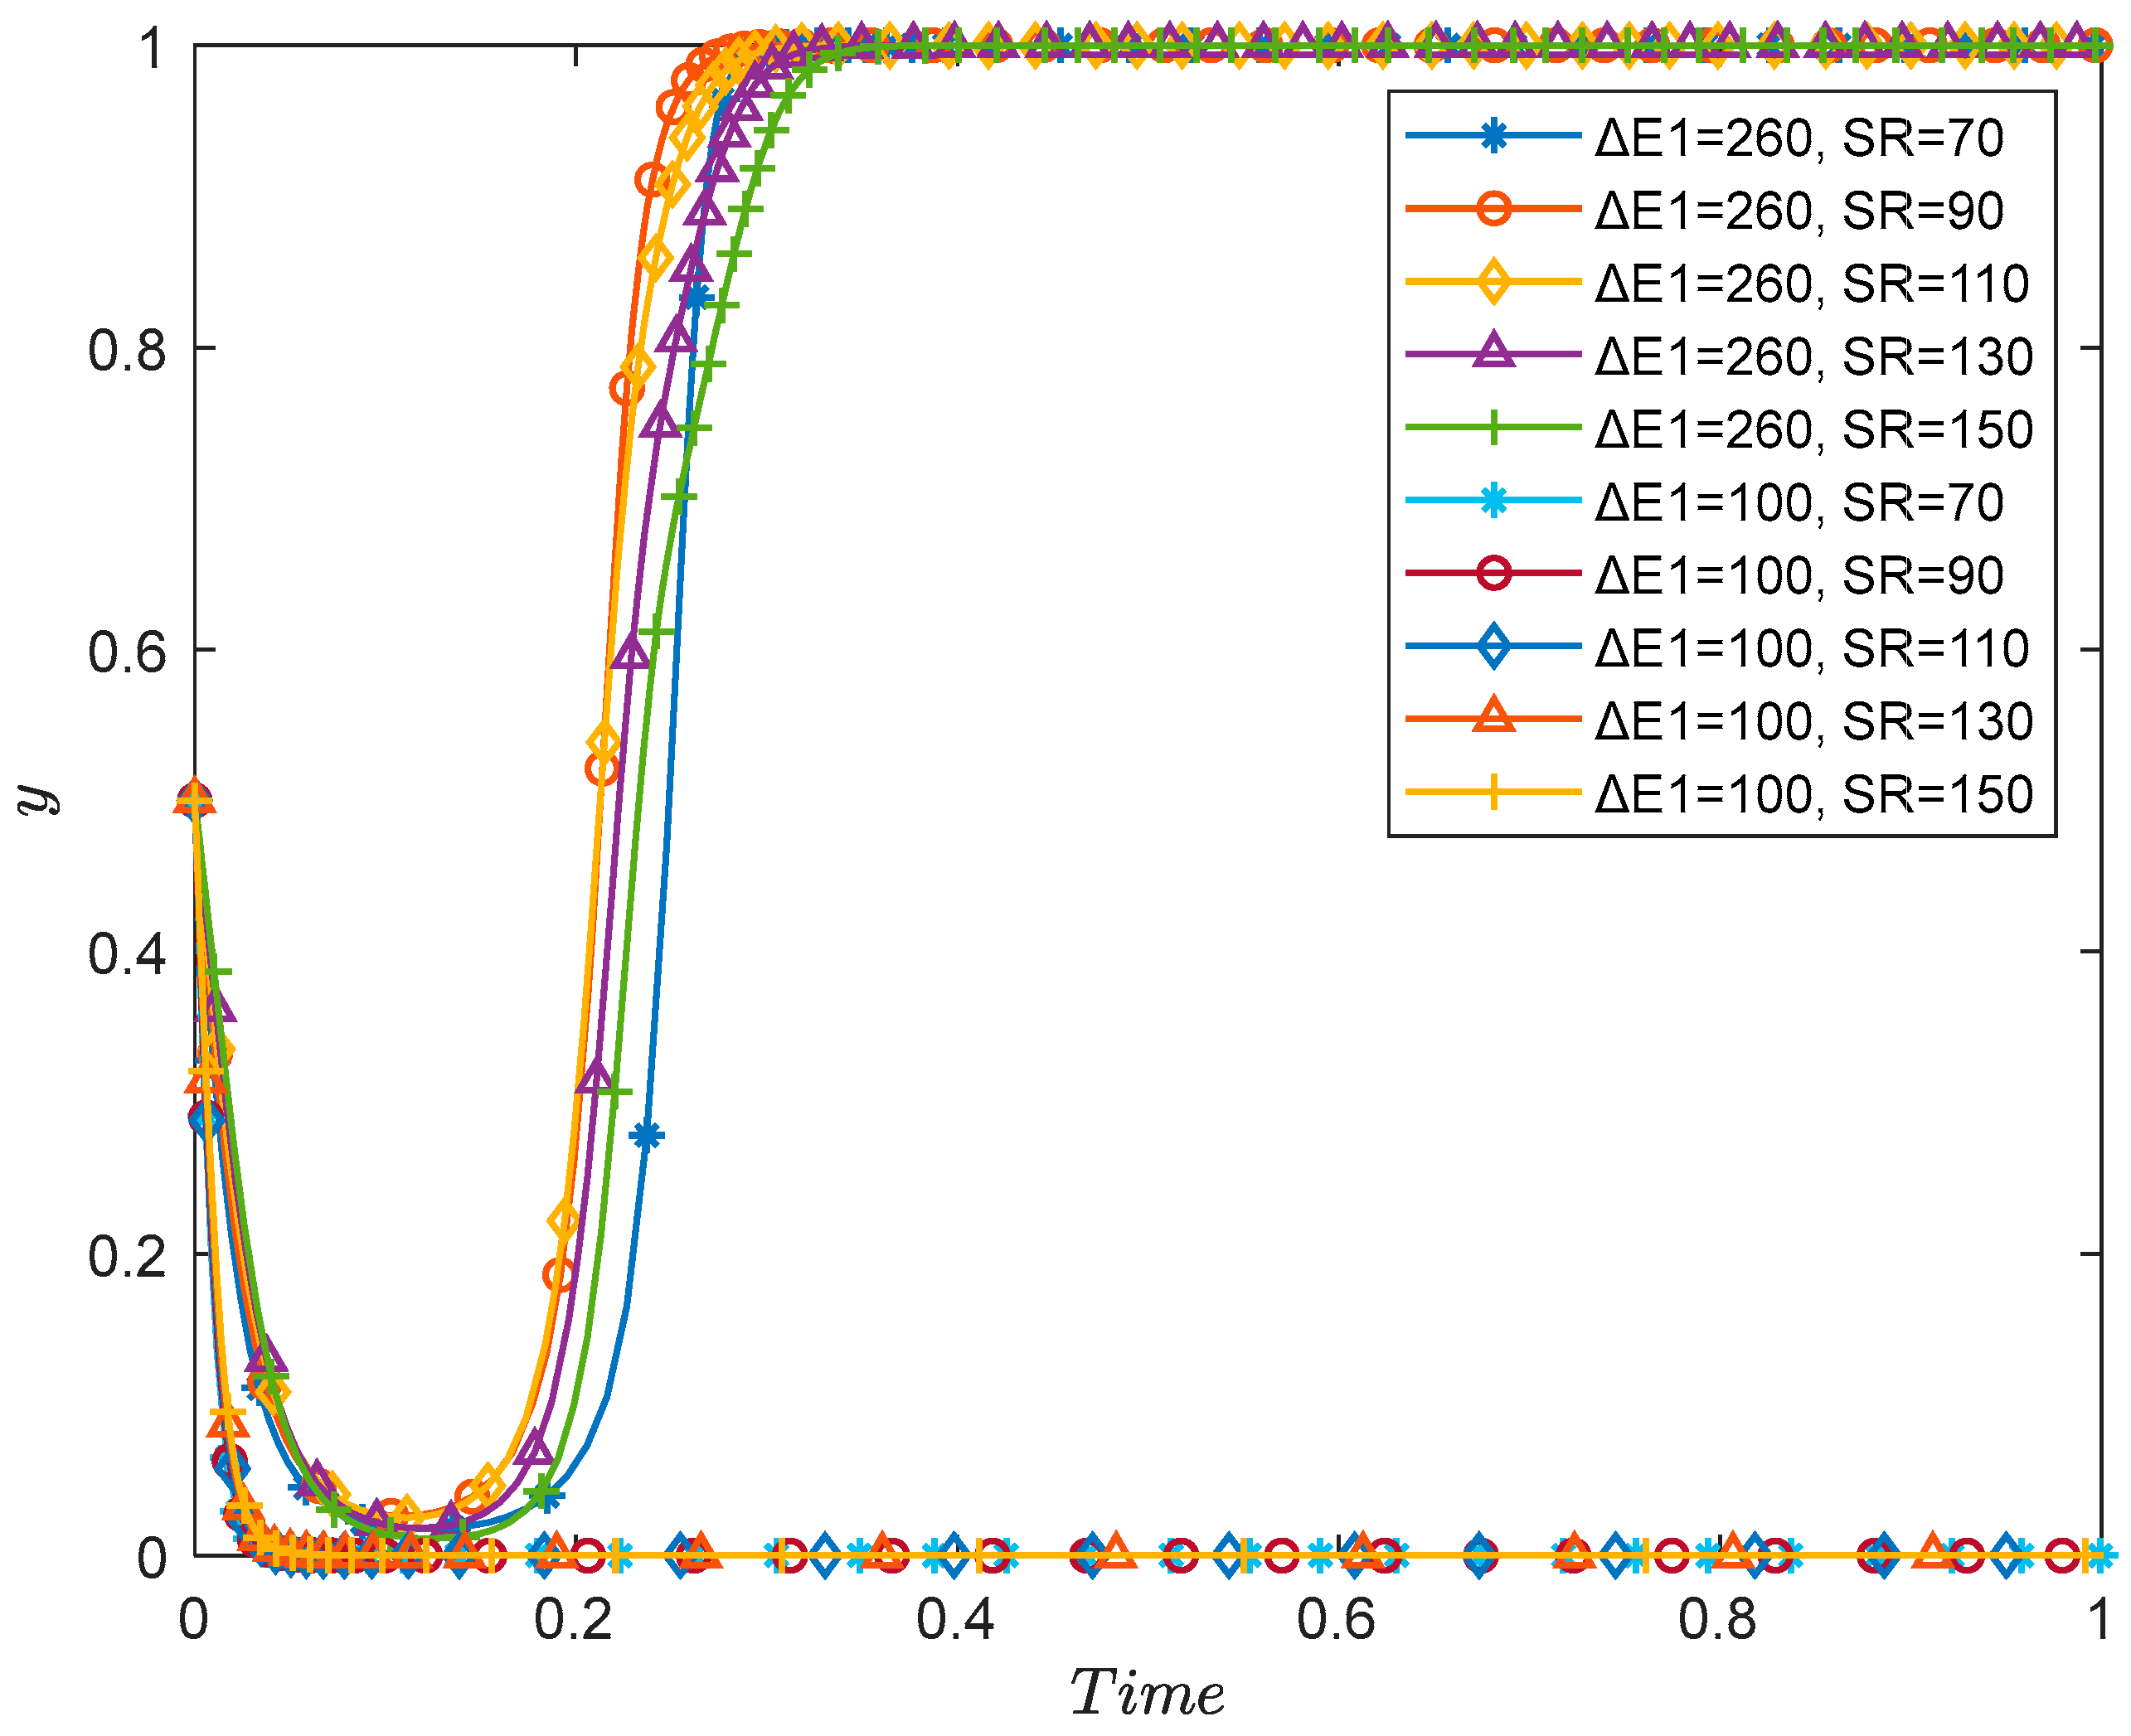
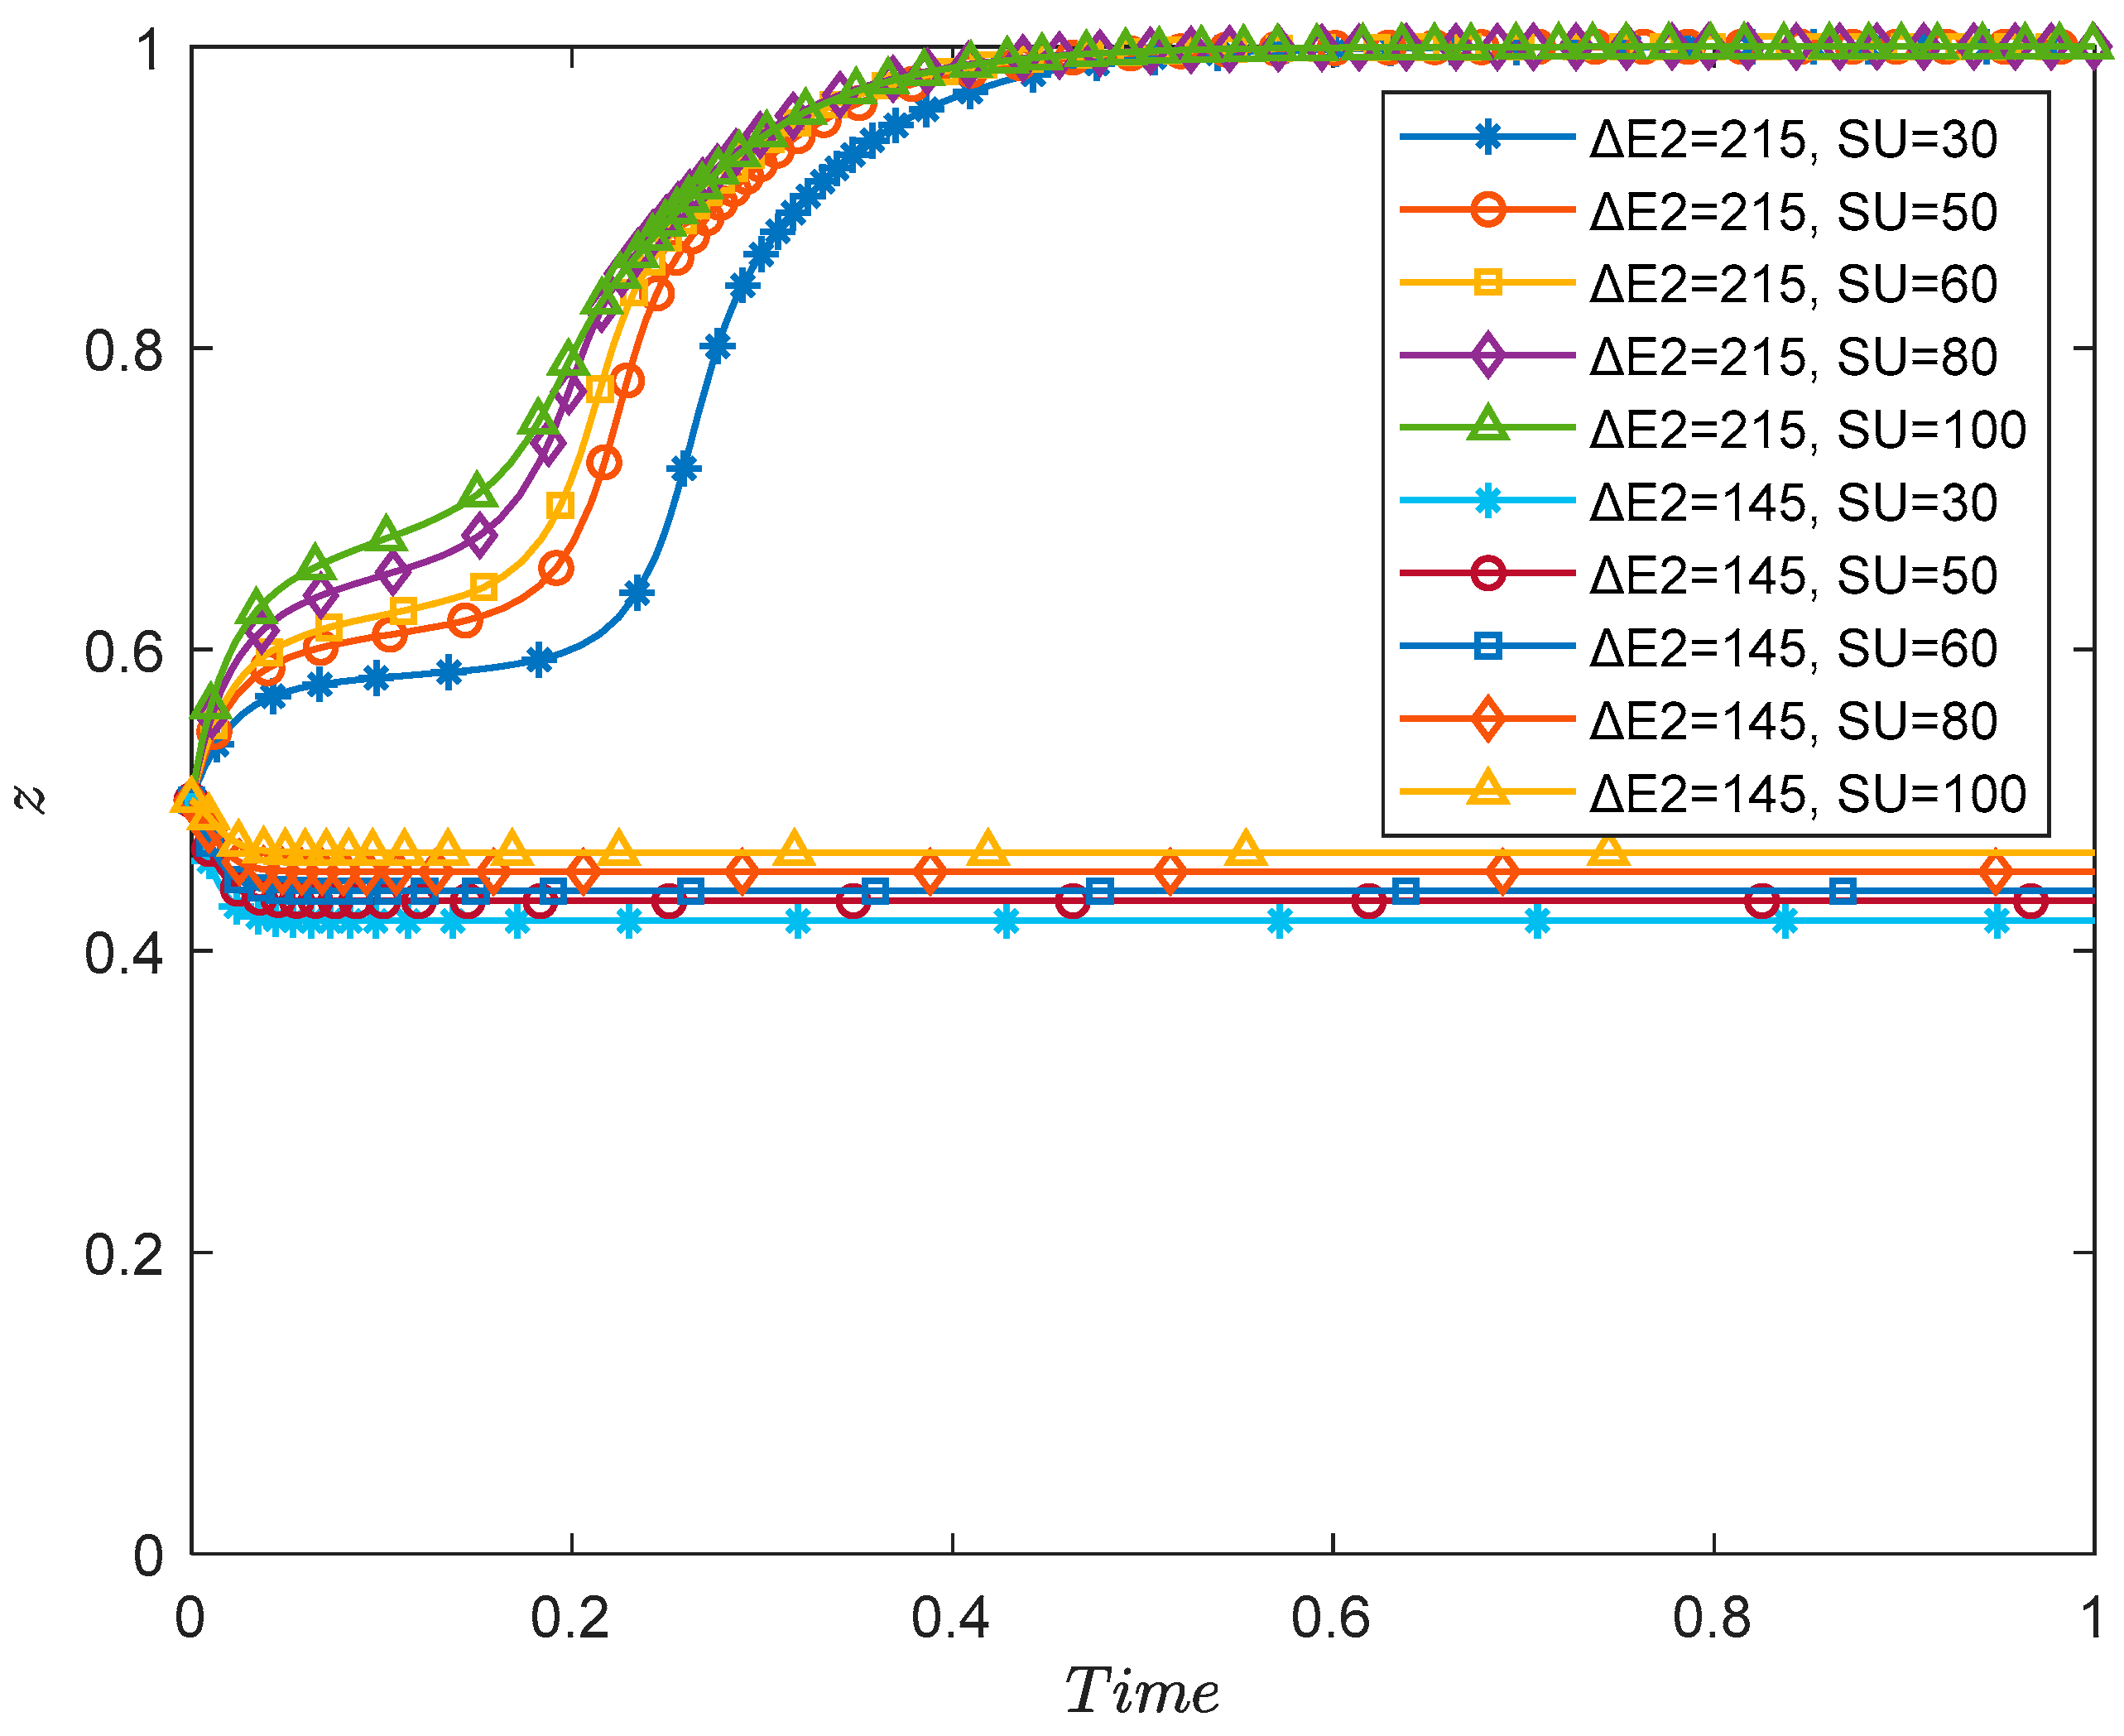
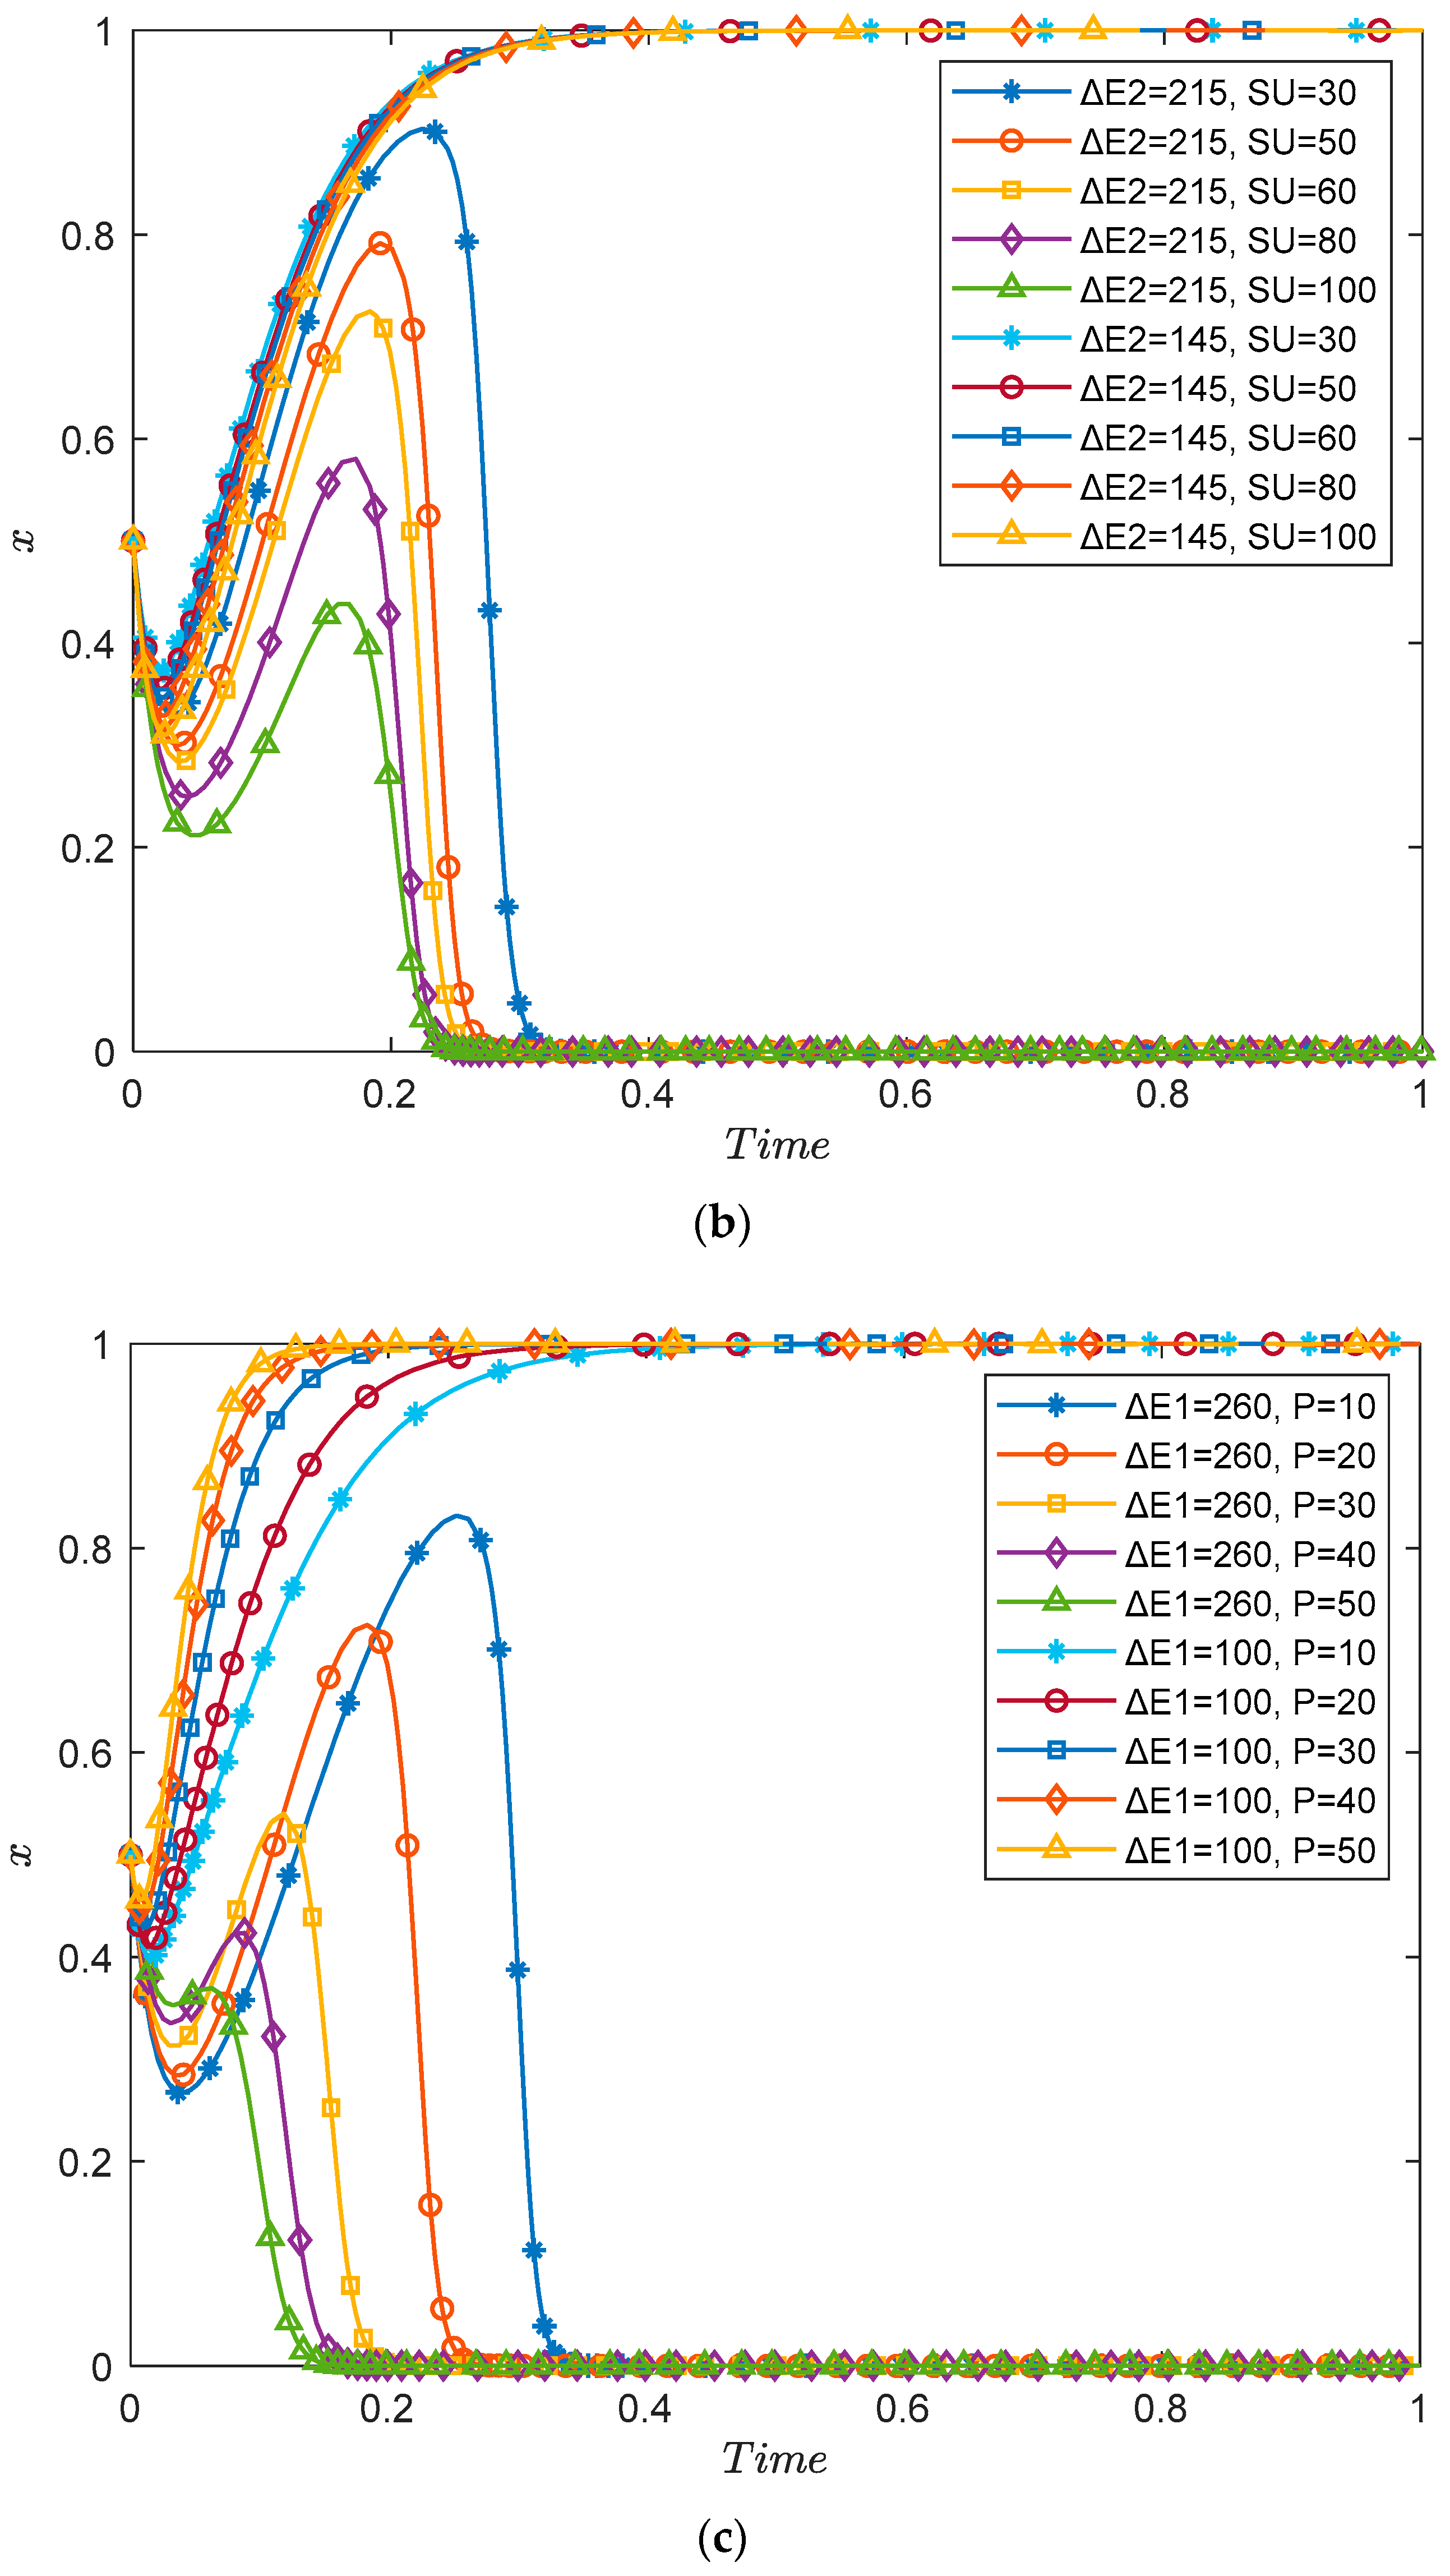
4.2.2. The Impact of Benefit and Cost Related Parameters on System Evolution

Figure 5 reflects the impact of additional income on the property owners. Keeping other parameters unchanged, Δ E 1 ranges between 140 and 360. As shown in Figure 5, the additional income is a significant contributor to the development of the retrofit market. Unless the additional income exceeds the incremental cost, the owner will shift towards “non-implementation”. The convergence rate of the behavior strategy will accelerate over time as the profit margin increases. In the profitable state, the value of y fluctuates initially. Owners are conservative at first due to the immaturity of the market and the delay in receiving feedback, but eventually converge to “implementing” as the market matures.
Figure 6 reflects the impact of additional benefits on the users. Keeping other parameters unchanged, Δ E 2 . ranges between 145 and 255. The incremental benefits are generally positively correlated with the rate at which users’ behavior evolves toward “acceptance”. Users tend to be conservative when the cost premium of energy-efficient buildings is much greater than the added benefits. As the additional benefits increase, users are more likely to accept retrofits. It is worth noting that although the incremental benefits may not fully compensate for the cost premium, the product will eventually be accepted by users. This phenomenon indicates that as social development progresses, users will pay increasing attention to living comfort and environmental protection. They may be willing to pay a little extra to improve their standard of living. Green retrofit market development is facilitated by this positive attitude.
Figure 7 reflects the impact of supervision costs on the government. Keeping other parameters unchanged, GP ranges between 5 and 50. The government’s action converges increasingly slowly as the cost of policy increases, eventually leading to “negative supervision”. This shows that the mature development of the market can bring policy cost savings to the government. Supervision costs do not appear to be the decisive factor influencing government behavior. Instead, the government may pay greater attention to the environmental and social benefits of energy-efficient retrofitting.
Figure 8 reflects the impact of turnover costs on property owners. Keeping other parameters unchanged, T ranges between 15 and 135. Figure 8 shows that owners’ behavior converges at a more rapid rate as turnover costs increase. As a result, property owners are sensitive to the loss caused by the relocation of their tenants. Owners as market suppliers must fully understand the desires of users. It is consistent with the results shown in Figure 4b.

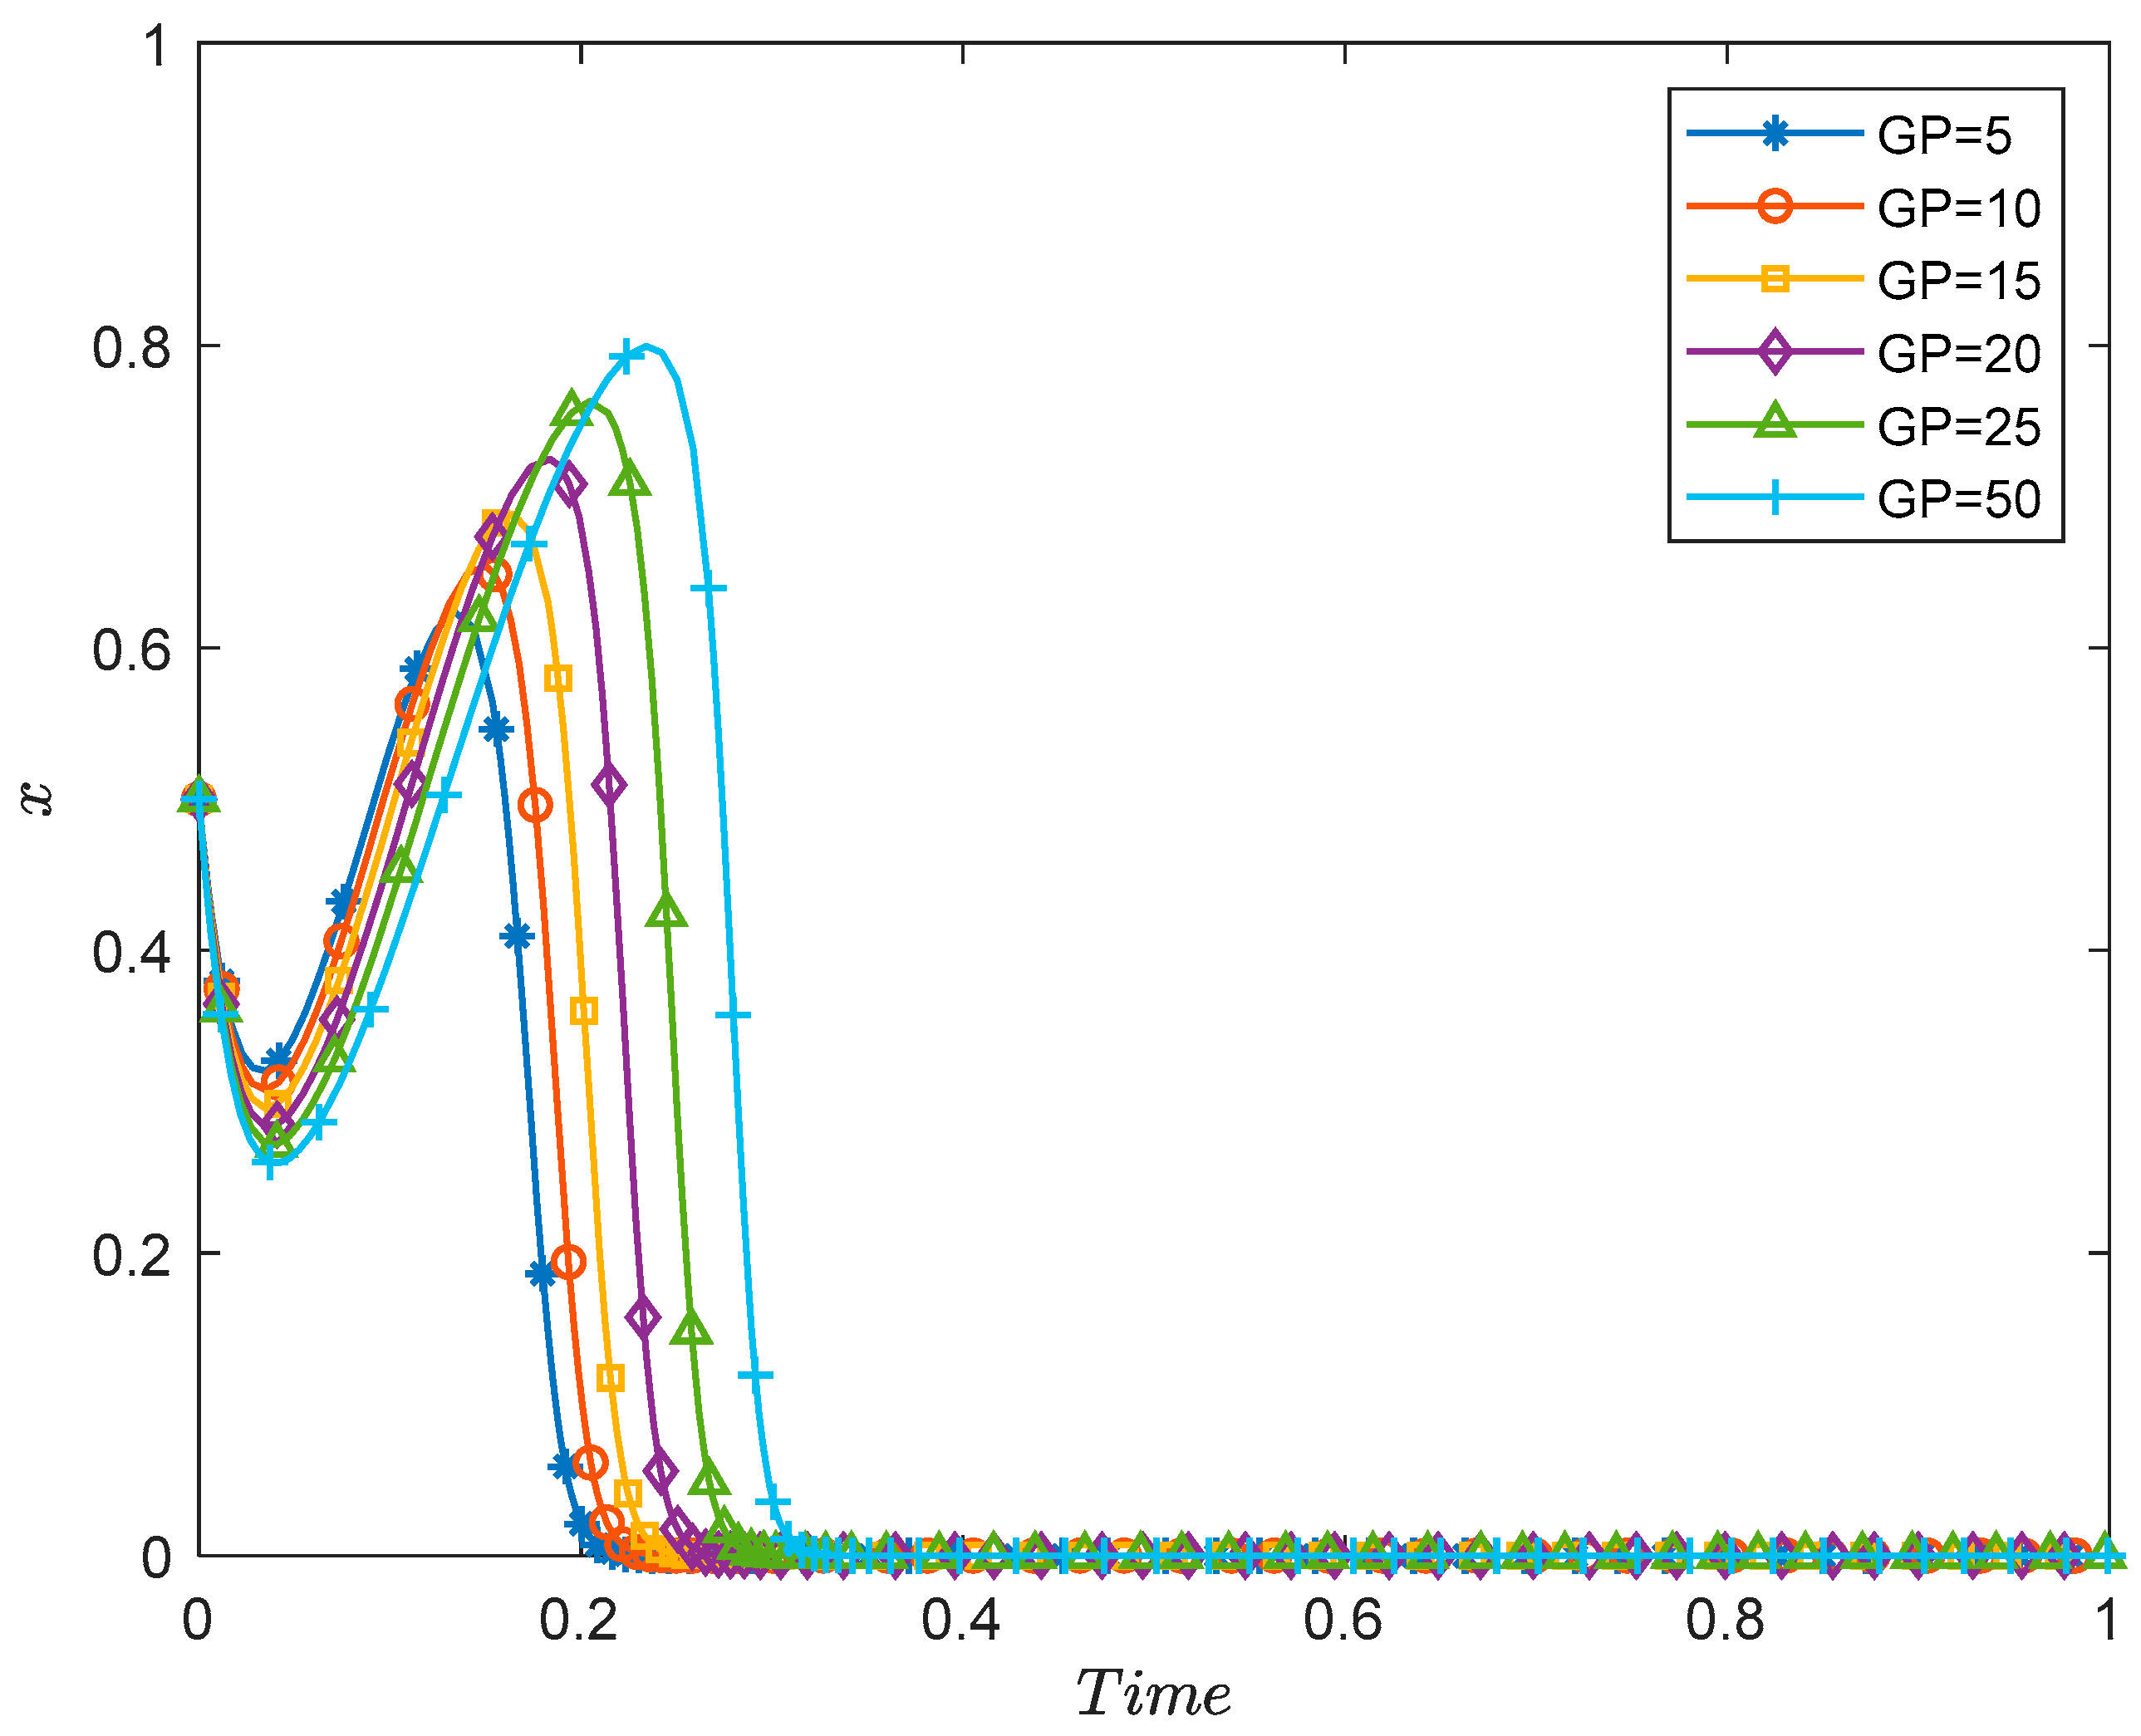
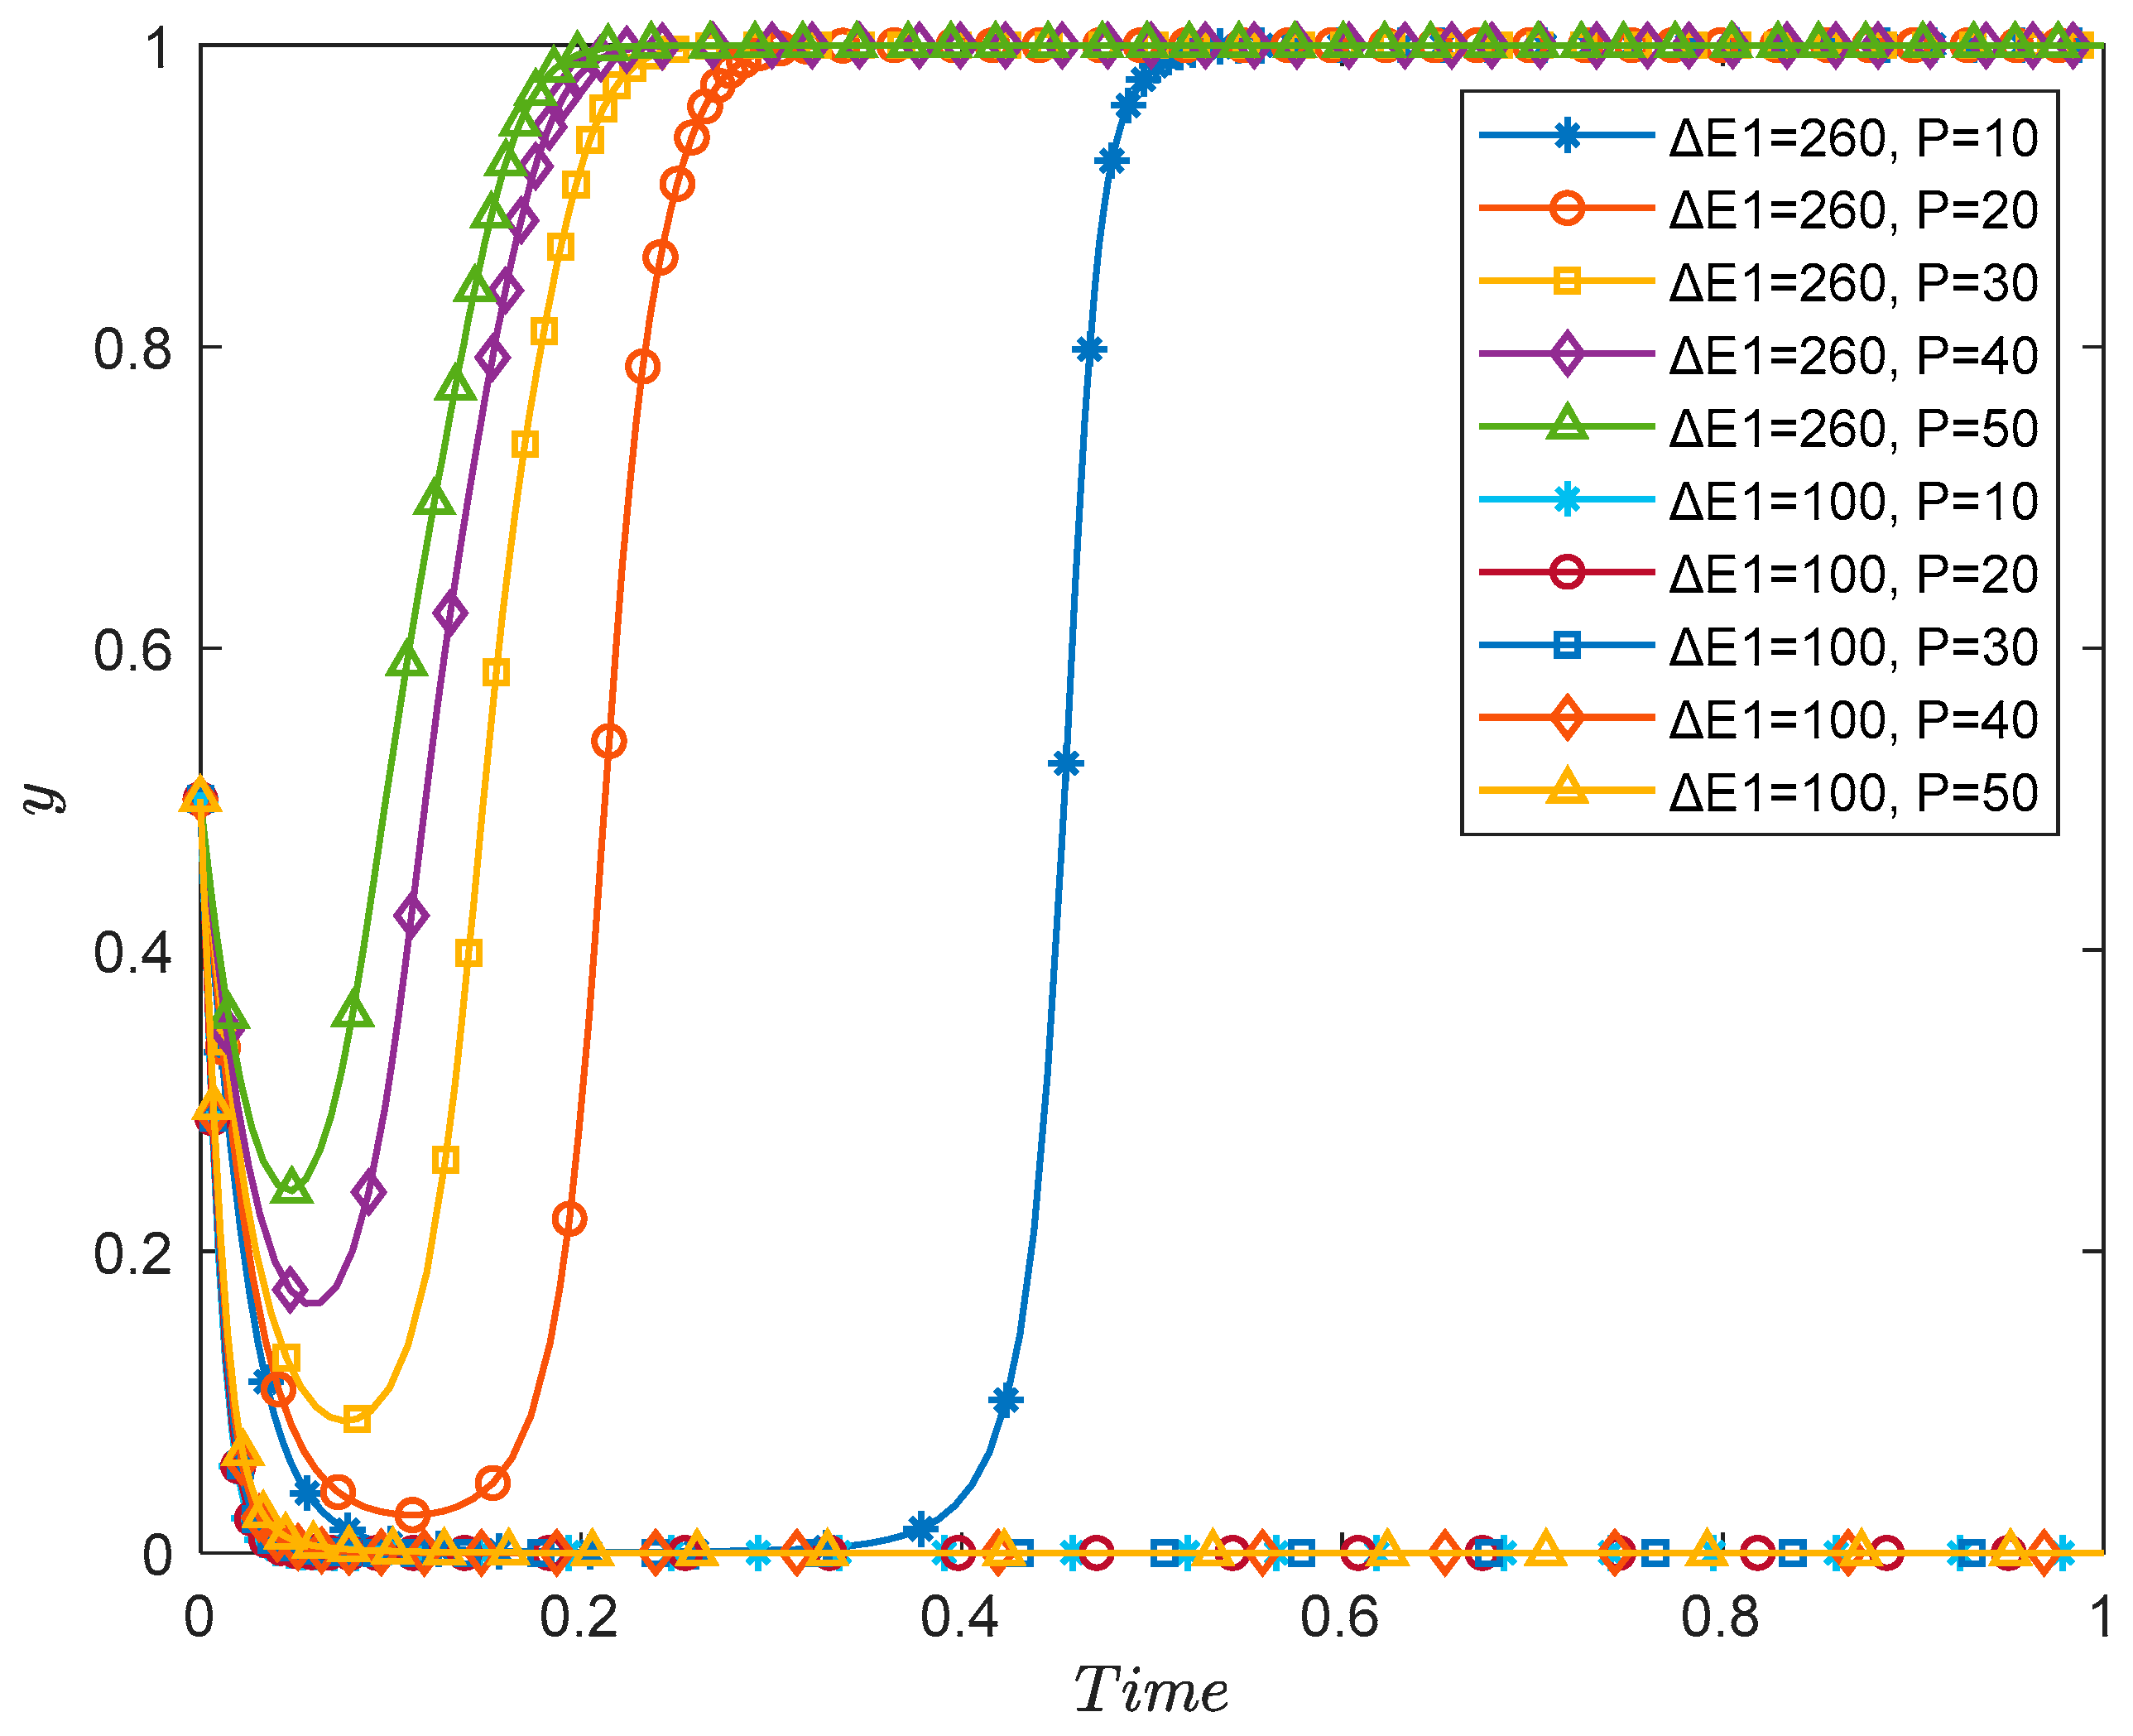
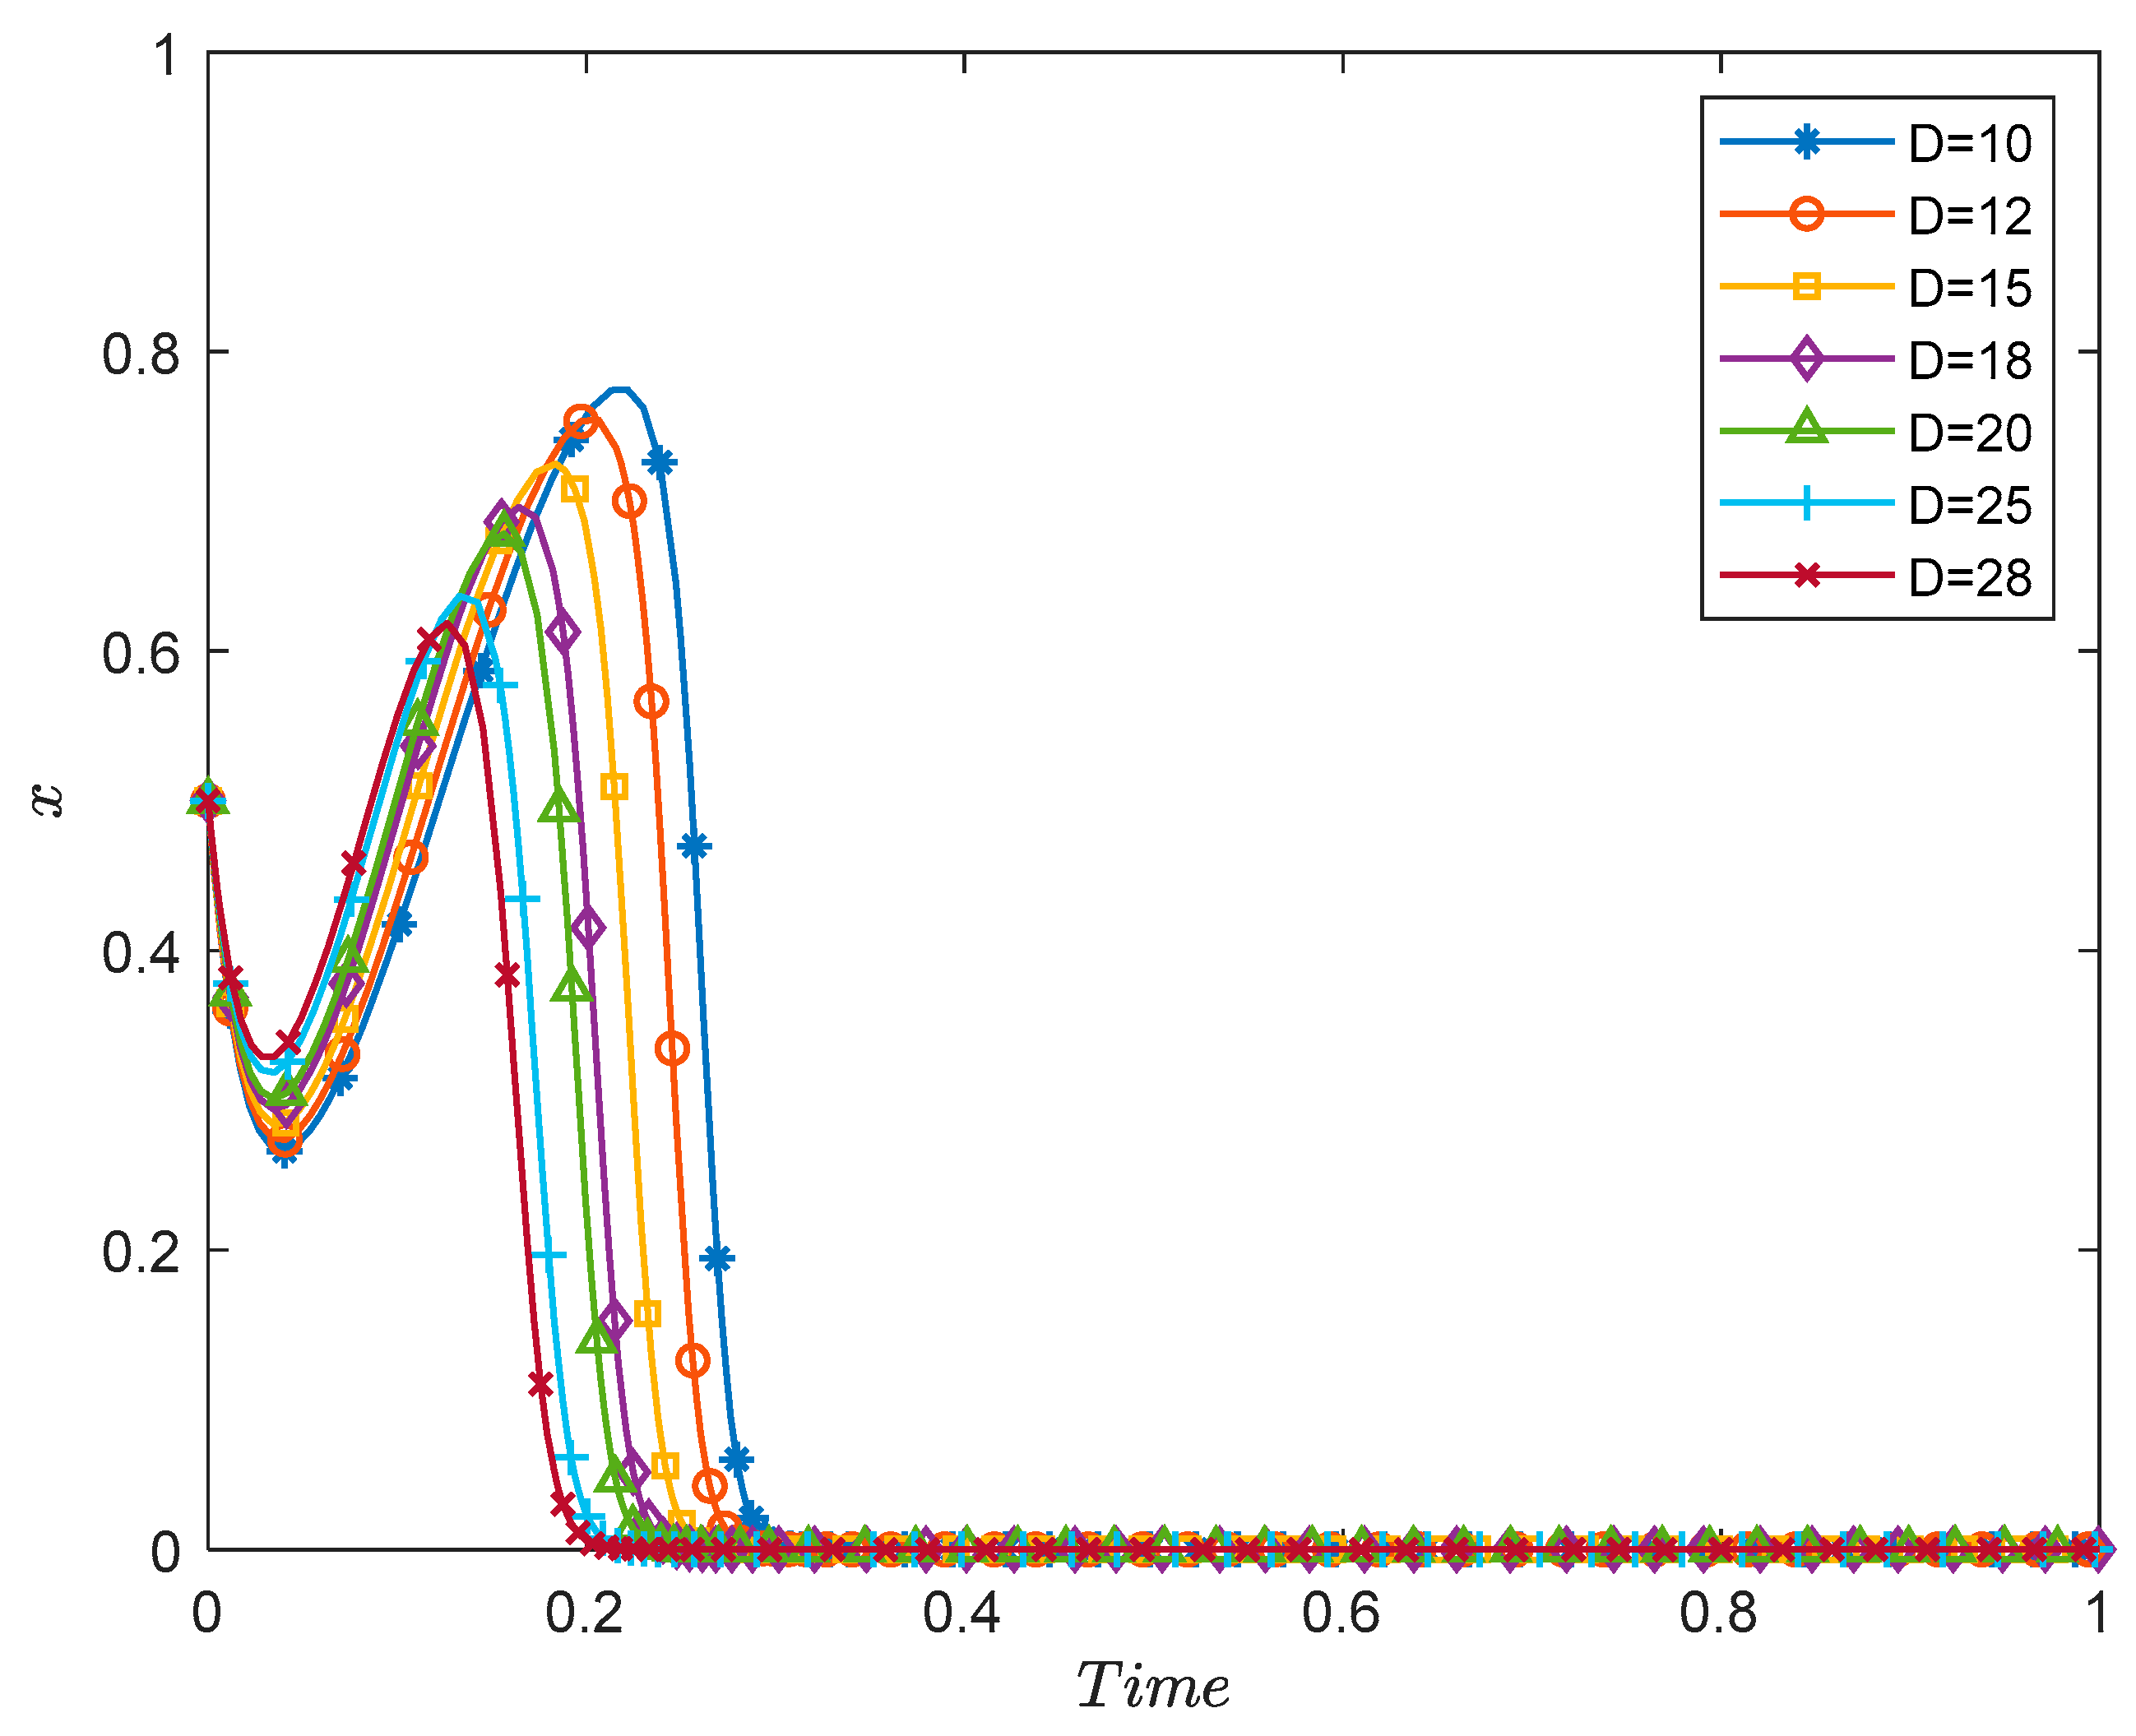
4.2.3. The Impact of Reward- and Punishment-Related Parameters on System Evolution

Figure 9 illustrates the impact of government subsidies when the profitability of energy-efficiency retrofit projects varies. Energy-efficient retrofitting can bring extra profits to owners when Δ E 1 = 260 , whereas when Δ E 1 = 100 , owners suffer losses. Figure 9 shows that subsidies have no decisive effect on the behavior of owners. If owners suffer losses, they will still select the option of “non-implementing” regardless of the extent of the subsidy. Owners may initially be negative even if they make a profit due to the immaturity of the market. As the market develops, owners tend to choose “implementing” as they can benefit from both government grants and energy-efficiency retrofits.
Figure 10 illustrates the impact of government subsidies on users with varying levels of profit and loss: when Δ E 2 = 145 , Δ E 2 < Δ C 2 ; and when Δ E 2 = 215 , Δ E 2 > Δ C 2 . When the additional benefits are less than the cost premium, users will remain on the fence even if the government provides subsidies as an incentive. Accordingly, users may place more value on environmental and quality-of-life improvements from energy-efficiency retrofits than on financial gains. If the additional benefits outweigh the cost premium, increasing subsidies will motivate users to accept energy-efficient buildings.
Figure 11 illustrates the impact of government penalties when the profitability of energy-efficiency retrofit projects varies. When profitability is possible, owners are willing to take positive actions. In this case, owners’ enthusiasm for retrofits rises significantly as the penalty amount increases, indicating that penalties can have some positive effects. In a deficit situation, punitive measures do not achieve the desired impact. Owners eventually decide not to retrofit, despite the increase in fines.
Figure 12 illustrates the impact of subsidies and penalties on government under the above profit-and-loss scenarios. Due to the learning mechanism in evolutionary games, the behavior of participants will adjust through the interaction of other factors. The government’s response to the market’s early development is to incentivize it with positive supervision, like subsidies and penalties. If the industry matures, owners and users can earn enough extra profits so that the government’s negative strategy does not significantly affect their decisions. As the external stakeholder in the market, the government behaves in a complementary manner to the internal stakeholders.

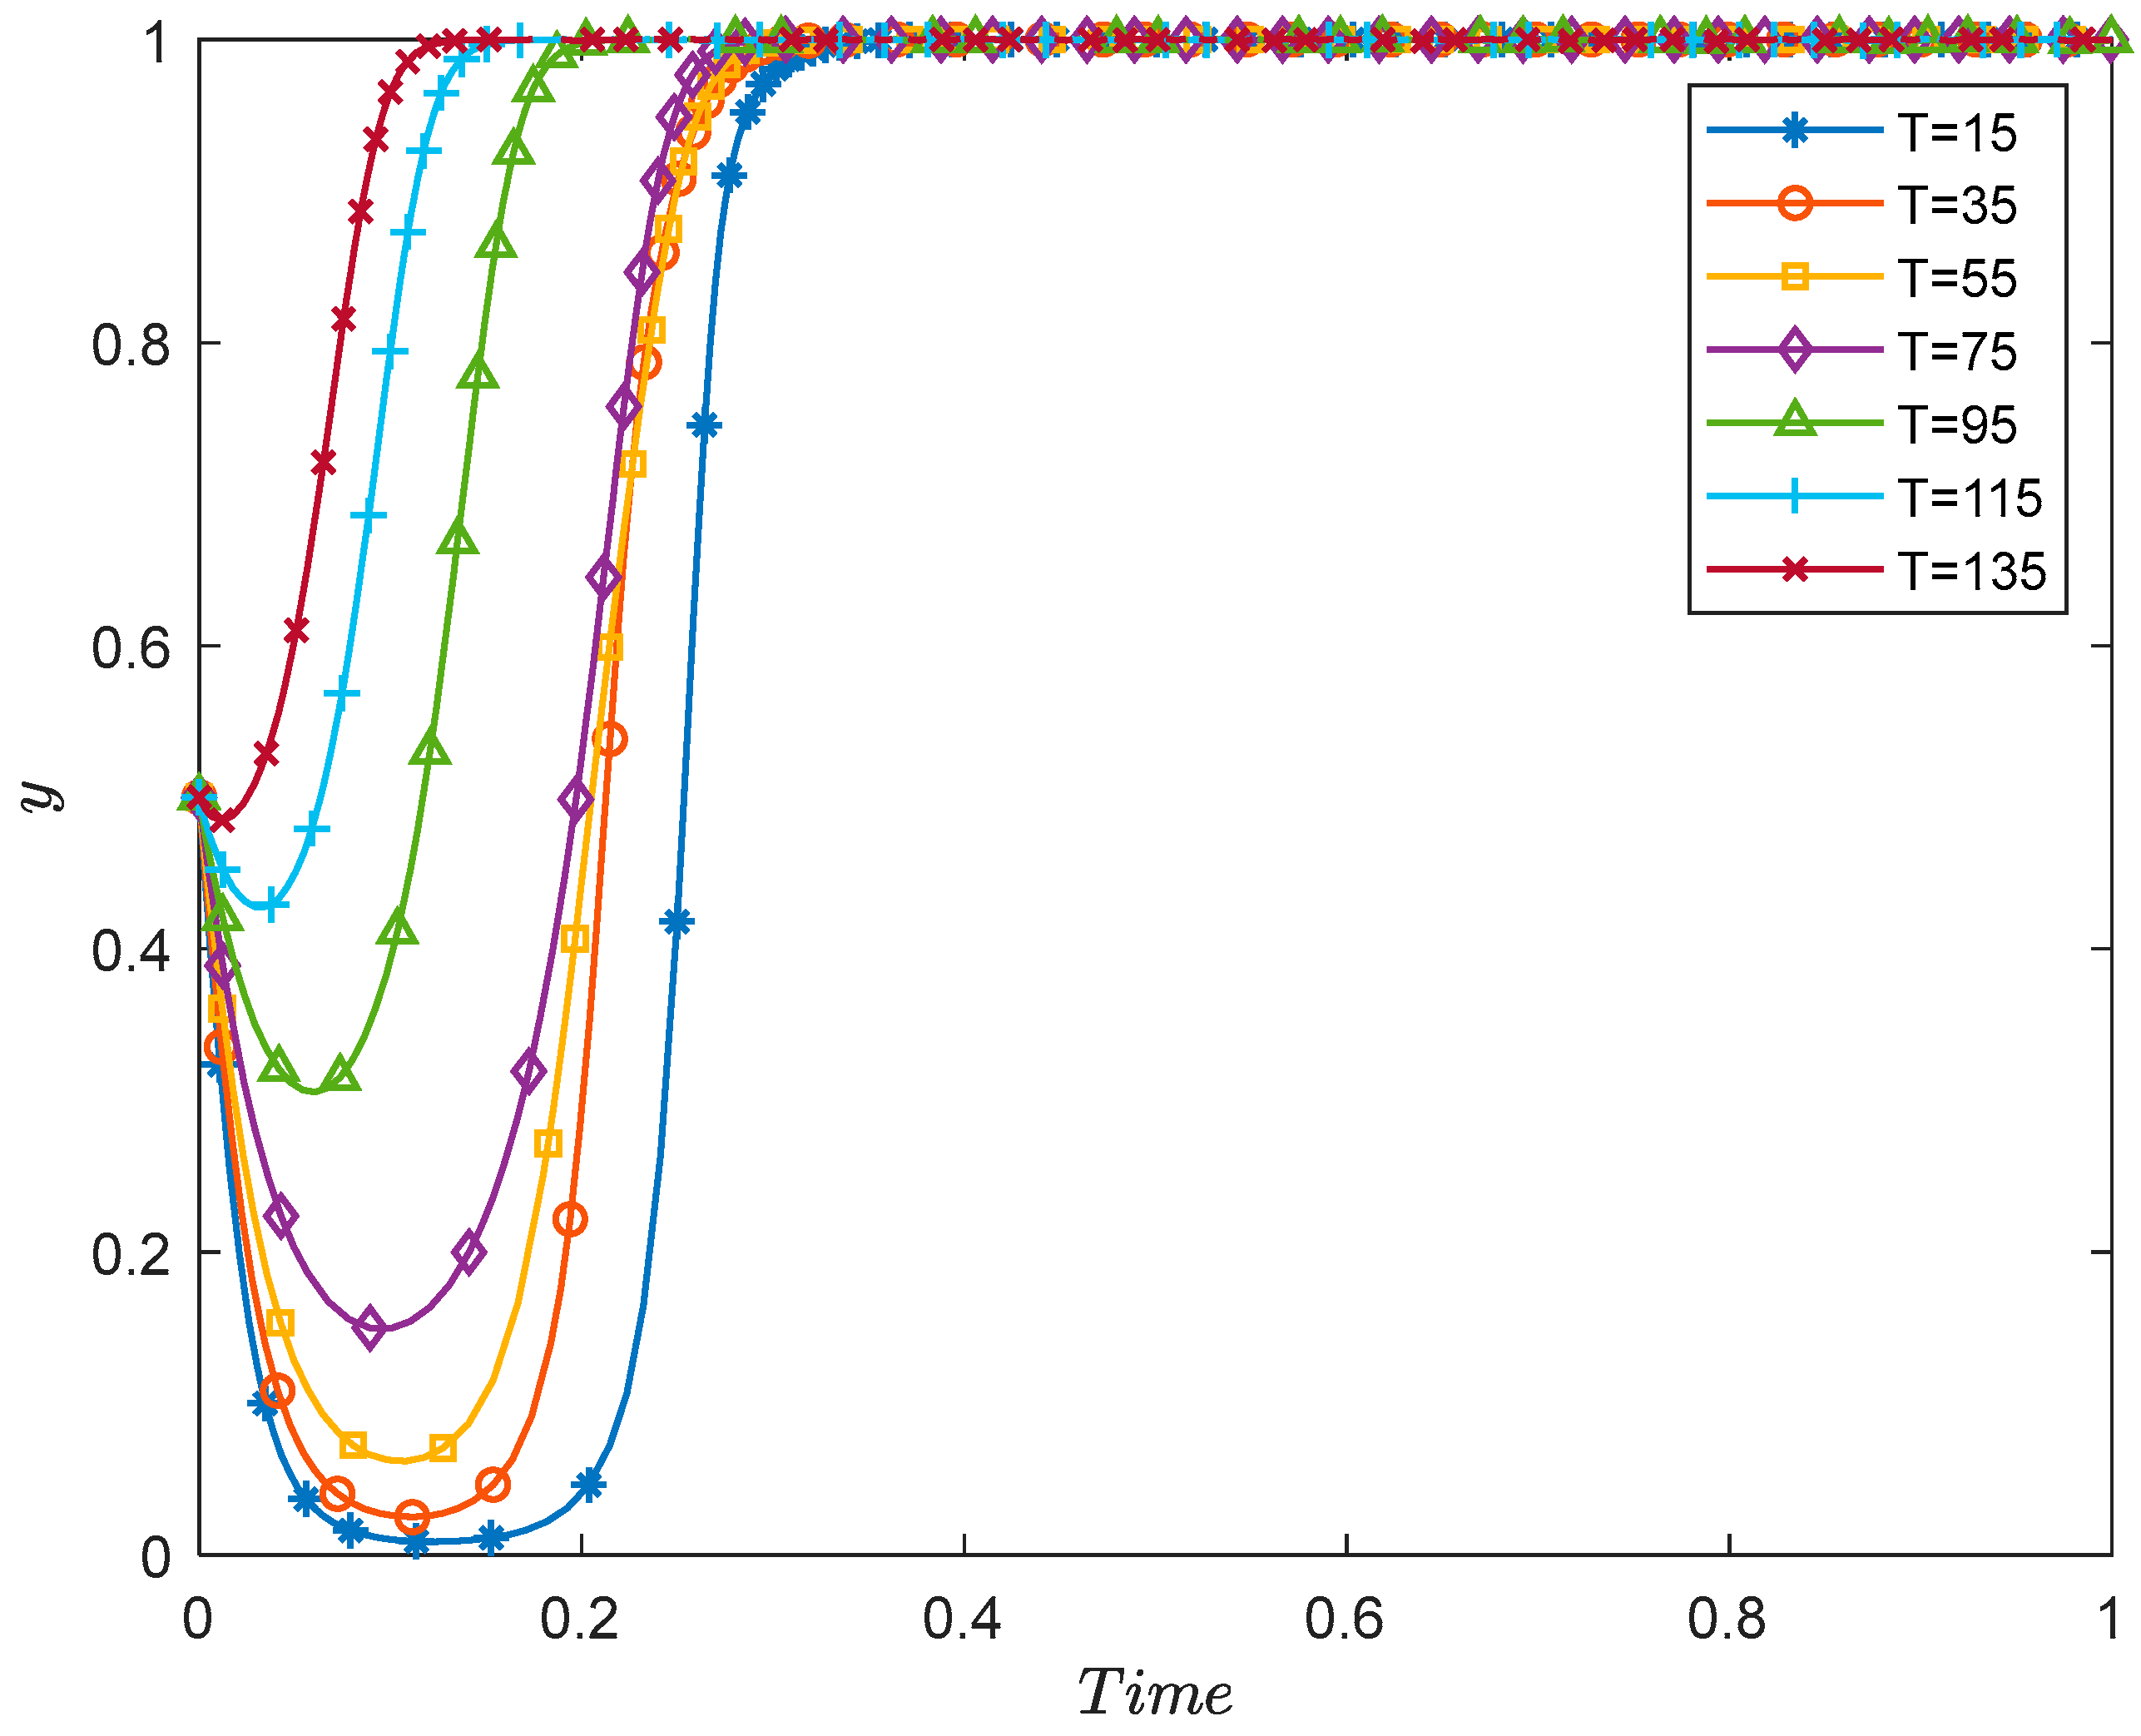
4.2.4. The Impact of Public Willingness on System Evolution

Figure 13 reflects the impact of the constraint of public willingness on the government. The public will reflect the level of environmental awareness among consumers. When government does not provide incentives that are expected by market participants, such as subsidies to users, there may be some losses due to working against public willingness. Initially, the government will be responsive to the public’s wishes and act in a more “positive supervision” manner. The benefits of negative supervision gradually outweigh positive supervision as the energy-efficiency retrofit market increases. It may be in the government’s interests to withdraw and allow the mature market to lead. This is consistent with the findings of Scenario 4.

5. Discussion

Promoting energy-efficiency retrofits is a cooperative effort between the government, owners, and users. This study provides a reference perspective for research in energy-efficient retrofitting of existing office buildings, using evolutionary game theory. In terms of the initial strategy, changes in the motivation of any one player to participate can have an influential impact on the other two players. This is consistent with the research findings of Lu et al. [49] and Liu et al. [50]. Mutual understanding and information sharing between the three players can significantly contribute to the development of the energy-efficiency retrofits market. This study considers the behavioral characteristics of users in the special type of multi-occupied building, in addition to previous studies. The leasing relationship between users and owners complicates the situation further. User relocation costs have a significant impact on the choice of owner strategy, making effective communication and coordination with users necessary. Based on the above research results, countermeasures and suggestions are proposed to increase the active participation of government, office building owners, and users in energy-efficient retrofitting.
(1)
Improve the market mechanism
In line with Fu et al.’s study, government regulations and incentives can influence the initiative of various stakeholders [51]. Policy measures will motivate property owners to make energy-efficient retrofits to qualify for subsidies or avoid penalties. However, as shown in Figure 9 and Figure 11, government supervision does not play a decisive role. Over the long term, subsidies and penalties can only have a limited impact on the energy-efficiency retrofit market. If owners are unable to profit from the market, they will eventually withdraw from it regardless of the extent of government supervision. Similar findings were also reported by Lu et al. [49]. Accordingly, incentives in the event of “market failure” do not necessarily create attractive investment opportunities. As the market matures, policymakers can expect to save on expenditure. The government should take steps to improve the market mechanism and promote the development of the industry.
A mature and scaled-up retrofit market requires not only promoting technological advancements and advocating sustainable building materials, but also more feedback from retrofits of existing buildings. A lack of real project data is one of the most significant factors resulting in stakeholders’ low confidence in the potential of retrofit projects [12]. Therefore, setting up a building green retrofit assessment and certification system can improve the quality control of green retrofit projects [57]. In addition, establishing a building energy consumption database can provide a reference for stakeholders [58]. Meanwhile, the lack of appropriate organizations and professionals has posed a major barrier to promoting green retrofitting construction [32,59]. Professional organizations can promote green building retrofits by coordinating split incentives among stakeholders, or providing training in various skills [59]. Industry associations and nonprofit organizations can become more involved in the retrofitting of Chinese buildings by providing training and certification to develop qualified professionals, and by promoting the growth of the energy-efficiency retrofit market.
(2)
Reduce incremental costs and improve profitability
In Figure 5 and Figure 6, it is shown that profit-and-loss scenarios greatly influence the decision of owners and users. Owners are much more concerned with the economic benefits and profitability of energy-efficiency retrofitting, as demonstrated by their high sensitivity to the impact on profit and loss. Users place a greater emphasis on the quality of their living and working conditions, as well as the benefits to the environment. It is therefore imperative that owners actively seek ways to reduce the cost premiums.
The government and property owners should encourage the development and standardization of energy-saving technologies, and enhance their collaboration with academic research institutions to reduce retrofitting costs. Subsidies from the government can attract private investors. Suppliers offering retrofitting services should be encouraged to participate in the market, by promoting the energy performance contracting mode to stimulate the ability to innovate [60]. Furthermore, the government should adopt a variety of measures to strengthen economic incentives, such as income tax exemptions, carbon taxes, lowered loan thresholds, and simplified application procedures [61]. As a complement, more mandatory measures must also be employed [62].
The availability of information about policies, experts, and retrofitting programs is also argued to be of importance by many scholars [5,63]. Time and effort spent obtaining information about retrofitting technologies and finding reliable professionals constitute transaction costs [63]. Therefore, the mass media must be utilized to disseminate information regarding green retrofits, energy efficiency, and related policies. Furthermore, pilot projects should be implemented to create a broader demonstration effect, using successful cases to improve the availability and accessibility of information. Considering the fragmentation of relevant information, a one-stop-shop information website can be developed to reduce the transaction costs associated with accessing information [39].
(3)
Promote the dissemination of environmental knowledge
On the demand side in the energy-efficiency retrofit market, users’ willingness has a significant bearing on the direction of market growth. Most users have already met their basic living needs and are now in the process of pursuing higher-level needs. This is consistent with the findings of Xu et al. [34], Lu et al. [49], and Feng et al. [64].
To increase user acceptance of the green product premium, the government should enhance green knowledge promotion and education. The promotion of retrofit awareness through community events, school curricula, and mass media has proven very useful in overcoming information asymmetry. It also can increase stakeholders’ enthusiasm to participate in building retrofits [65]. Additionally, there is a positive relationship between building energy performance and users’ energy consumption habits [66]. Thus, it is critical to disseminate information about energy-saving ways and habits to pursue energy efficiency in building retrofits.

6. Conclusions

The study of stakeholders’ decision-making behavior regarding energy-efficiency retrofitting of existing office buildings is essential in promoting the development of energy-efficiency retrofit markets, as well as enhancing urban sustainability. In this paper, a tripartite evolutionary game model, incorporating the government, office building owners, and end users was constructed, and its stable equilibrium points were examined. Secondly, the basic parameters were set based on the demonstration case of energy-efficiency retrofitting in conjunction with pertinent policy and literature. The initial strategy and the influence of different parameters on stakeholder behavior were analyzed using simulation. Finally, based on the simulation results, suggestions were made to encourage the active involvement of various stakeholders in energy-efficiency retrofitting.
This paper found that: (1) System stabilization strategy convergence is closely related to the initial strategy selection of each stakeholder, with the greatest influence coming from changes in users’ initial states; (2) Property owners’ concerns about their profit-and-loss situation dominates their decisions. Owners’ positive action is influenced by the turnover costs of users’ relocation. Whereas users are less sensitive to costs and benefits, and policy cost changes are not determinative of government behavior; (3) Government incentives can have a positive role. However, the role played by government subsidies and penalty measures depends on the profit-and-loss scenarios, and not on the degree of supervision. Government supervision acts as a complement to internal stakeholders in efficient markets; (4) Government is influenced by the willingness of the public. However, it is ultimately the scale of market development that determines the government’s position.
Regarding theoretical contributions, this paper provided a scientific research paradigm for related fields through an innovative evolutionary game model that integrated the strategies and behaviors of the major stakeholders in energy-efficiency retrofit markets. The special contractual relationship between the building owner and the user is considered, extending the study of office buildings as a building type. Regarding practical contributions, by using scenario simulation to analyze the strategic sensitivity of each participant in the energy-efficiency retrofit market, this paper provides a useful reference to guide each stakeholder’s practical activities.
This paper has certain limitations in the research process: numerical examples are used for simulation, and certain assumptions are made when setting the parameters, while the actual situation is far more complicated than the simulation model; reward measures have a limited impact, and dynamic regulatory measures can also be considered; and the scope of the paper is limited to three major stakeholders, simplifying the stakeholder relationships, although more stakeholders may be discussed in the future.

Author Contributions

Methodology, software, original draft preparation, Y.X.; writing—review and editing, supervision, Y.L. All authors have read and agreed to the published version of the manuscript.

Funding

This work was supported by the National Natural Science Foundation of China under grant no. 71871014.

Institutional Review Board Statement

Not applicable.

Informed Consent Statement

Not applicable.

Data Availability Statement

All the data adopted in this article are from public resources and have been cited with references accordingly.

Conflicts of Interest

The authors declare no conflict of interest. The funders had no role in the design of the study; in the collection, analyses, or interpretation of data; in the writing of the manuscript, or in the decision to publish the results.

References

  1. United Nations Environment Programme. Global Status Report for Buildings and Construction: Towards a Zero-Emissions, Efficient and Resilient Buildings and Construction Sector. Available online: https://globalabc.org/sites/default/files/2021-10/GABC_Buildings-GSR-2021_BOOK.pdf (accessed on 18 July 2022).
  2. Sudmant, A.; Millward-Hopkins, J.; Colenbrander, S.; Gouldson, A. Low carbon cities: Is ambitious action affordable? Clim. Change 2016, 138, 681–688. [Google Scholar] [CrossRef]
  3. Golubchikov, O.; Deda, P. Governance, technology, and equity: An integrated policy framework for energy efficient housing. Energy Policy 2012, 41, 733–741. [Google Scholar] [CrossRef]
  4. Ma, Z.J.; Cooper, P.; Daly, D.; Ledo, L. Existing building retrofits: Methodology and state-of-the-art. Energy Build. 2012, 55, 889–902. [Google Scholar] [CrossRef]
  5. Jagarajan, R.; Asmoni, M.; Mohammed, A.H.; Jaafar, M.N.; Mei, J.L.Y.; Baba, M. Green retrofitting—A review of current status, implementations and challenges. Renew. Sustain. Energy Rev. 2017, 67, 1360–1368. [Google Scholar] [CrossRef]
  6. Love, P.; Arthur Bullen, P. Toward the sustainable adaptation of existing facilities. Facilities 2009, 27, 357–367. [Google Scholar] [CrossRef]
  7. Fan, K.; Hui, E.C.M. Evolutionary game theory analysis for understanding the decision -making mechanisms of governments and developers on green building incentives. Build. Environ. 2020, 179, 106972. [Google Scholar] [CrossRef]
  8. Zhou, Z.H.; Zhang, S.Z.; Wang, C.D.; Zuo, J.; He, Q.; Rameezdeen, R. Achieving energy efficient buildings via retrofitting of existing buildings: A case study. J. Clean. Prod. 2016, 112, 3605–3615. [Google Scholar] [CrossRef]
  9. Ensign, P.C.; Roy, S.; Brzustowski, T. Decisions by Key Office Building Stakeholders to Build or Retrofit Green in Toronto’s Urban Core. Sustainability 2021, 13, 6969. [Google Scholar] [CrossRef]
  10. Liu, Y.M.; Liu, T.T.; Ye, S.D.; Liu, Y.S. Cost-benefit analysis for Energy Efficiency Retrofit of existing buildings: A case study in China. J. Clean. Prod. 2018, 177, 493–506. [Google Scholar] [CrossRef]
  11. Wan, S.Y.; Ding, G.C.; Runeson, G.; Liu, Y.S. Sustainable Buildings’ Energy-Efficient Retrofitting: A Study of Large Office Buildings in Beijing. Sustainability 2022, 14, 1021. [Google Scholar] [CrossRef]
  12. Krieske, M.; Hu, H.F.; Egnor, T.; IEEE. The Scalability of the Building Retrofit Market: A Review Study. In Proceedings of the EEE Conference on Technologies for Sustainability (SusTech), Portland, OR, USA, 24–26 July 2014. [Google Scholar]
  13. Bian, F.; Chong, H.Y.; Zhang, W.; Ding, C. Government subsidy strategy for public-private-partnership retrofit buildings in China. Energy Build. 2021, 252, 111455. [Google Scholar] [CrossRef]
  14. Miller, E.; Buys, L. Retrofitting commercial office buildings for sustainability: Tenants’ perspectives. J. Prop. Invest. Financ. 2008, 26, 552–561. [Google Scholar] [CrossRef]
  15. Menassa, C.C.; Baer, B. A framework to assess the role of stakeholders in sustainable building retrofit decisions. Sustain. Cities Soc. 2014, 10, 207–221. [Google Scholar] [CrossRef]
  16. Liang, X.; Peng, Y.; Shen, G.Q. A game theory based analysis of decision making for green retrofit under different occupancy types. J. Clean. Prod. 2016, 137, 1300–1312. [Google Scholar] [CrossRef]
  17. Liang, X.; Shen, G.Q.; Guo, L. Improving Management of Green Retrofits from a Stakeholder Perspective: A Case Study in China. Int. J. Environ. Res. Public Health 2015, 12, 13823–13842. [Google Scholar] [CrossRef]
  18. Stephan, K.; Menassa, C.C. Modeling the Effect of Building Stakeholder Interactions on Value Perception of Sustainable Retrofits. J. Comput. Civ. Eng. 2015, 29, B4014006. [Google Scholar] [CrossRef]
  19. Shi, Q.; Yan, Y.; Zuo, J.; Yu, T. Objective conflicts in green buildings projects: A critical analysis. Build. Environ. 2016, 96, 107–117. [Google Scholar] [CrossRef]
  20. Huang, B.; Mauerhofer, V.; Geng, Y. Analysis of existing building energy saving policies in Japan and China. J. Clean. Prod. 2016, 112, 1510–1518. [Google Scholar] [CrossRef]
  21. Yu, Z.J.; Geng, Y.; He, Q.; Oates, L.; Sudmant, A.; Gouldson, A.; Bleischwitz, R. Supportive governance for city-scale low carbon building retrofits: A case study from Shanghai. Clim. Policy 2021, 21, 884–896. [Google Scholar] [CrossRef]
  22. Wang, S.-Y.; Lee, K.-T.; Kim, J.-H. Green Retrofitting Simulation for Sustainable Commercial Buildings in China Using a Proposed Multi-Agent Evolutionary Game. Sustainability 2022, 14, 7671. [Google Scholar] [CrossRef]
  23. Darko, A.; Zhang, C.Z.; Chan, A.P.C. Drivers for green building: A review of empirical studies. Habitat Int. 2017, 60, 34–49. [Google Scholar] [CrossRef]
  24. Kaklauskas, A.; Zavadskas, E.K.; Raslanas, S.; Gulbinas, A. Multiple criteria decision support Web-based system for building refurbishment. In Proceedings of the 6th International Conference on Energy for Buildings, Vilnius, Lithuania, 7–8 October 2004; pp. 284–291. [Google Scholar]
  25. Liang, X.; Yu, T.; Guo, L. Understanding Stakeholders’ Influence on Project Success with a New SNA Method: A Case Study of the Green Retrofit in China. Sustainability 2017, 9, 1927. [Google Scholar] [CrossRef]
  26. Davies, P.; Osmani, M. Low carbon housing refurbishment challenges and incentives: Architects’ perspectives. Build. Environ. 2011, 46, 1691–1698. [Google Scholar] [CrossRef]
  27. Azar, E.; Menassa, C.C. A comprehensive framework to quantify energy savings potential from improved operations of commercial building stocks. Energy Policy 2014, 67, 459–472. [Google Scholar] [CrossRef]
  28. Azar, E.; Menassa, C.C. A comprehensive analysis of the impact of occupancy parameters in energy simulation of office buildings. Energy Build. 2012, 55, 841–853. [Google Scholar] [CrossRef]
  29. Chen, L.; Chan, A.P.C.; Owusu, E.K.; Darko, A.; Gao, X. Critical success factors for green building promotion: A systematic review and meta-analysis. Build. Environ. 2022, 207, 108452. [Google Scholar] [CrossRef]
  30. Mangialardo, A.; Micelli, E.; Saccani, F. Does Sustainability Affect Real Estate Market Values? Empirical Evidence from the Office Buildings Market in Milan (Italy). Sustainability 2019, 11, 12. [Google Scholar] [CrossRef]
  31. Ahn, Y.H.; Pearce, A.R.; Wang, Y.; Wang, G. Drivers and barriers of sustainable design and construction: The perception of green building experience. Int. J. Sustain. Build. Technol. Urban Dev. 2013, 4, 35–45. [Google Scholar] [CrossRef]
  32. Alam, M.; Zou, P.X.W.; Stewart, R.A.; Bertone, E.; Sahin, O.; Buntine, C.; Marshall, C. Government championed strategies to overcome the barriers to public building energy efficiency retrofit projects. Sustain. Cities Soc. 2019, 44, 56–69. [Google Scholar] [CrossRef]
  33. Shaikh, P.H.; Shaikh, F.; Sahito, A.A.; Uqaili, M.A.; Umrani, Z. An Overview of the Challenges for Cost-Effective and Energy-Efficient Retrofits of the Existing Building Stock. In Cost-Effective Energy Efficient Building Retrofitting: Materials, Technologies, Optimization and Case Studies; PachecoTorgal, F., Granqvist, C.G., Jelle, B.P., Vanoli, G.P., Bianco, N., Kurnitski, J., Eds.; Woodhead Publishing Series in Civil and Structural Engineering; Woodhead Publishing: Sawston Cambridge, UK, 2017; pp. 257–278. [Google Scholar]
  34. Xu, P.P.; Chan, E.H.W.; Qian, Q.K. Success factors of energy performance contracting (EPC) for sustainable building energy efficiency retrofit (BEER) of hotel buildings in China. Energy Policy 2011, 39, 7389–7398. [Google Scholar] [CrossRef]
  35. Lv, S.L.; Wu, Y.; Sun, J.Y. Pattern analysis and suggestion of energy efficiency retrofit for existing residential buildings in China’s northern heating region. Energy Policy 2009, 37, 2102–2105. [Google Scholar] [CrossRef]
  36. Shen, L.; He, B.; Jiao, L.; Song, X.; Zhang, X. Research on the development of main policy instruments for improving building energy-efficiency. J. Clean. Prod. 2016, 112, 1789–1803. [Google Scholar] [CrossRef]
  37. Hou, J.; Liu, Y.S.; Wu, Y.; Zhou, N.; Feng, W. Comparative study of commercial building energy-efficiency retrofit policies in four pilot cities in China. Energy Policy 2016, 88, 204–215. [Google Scholar] [CrossRef]
  38. Liu, G.; Tan, Y.T.; Li, X.H. China’s policies of building green retrofit: A state-of-the-art overview. Build. Environ. 2020, 169, 106554. [Google Scholar] [CrossRef]
  39. Liu, G.; Li, X.H.; Tan, Y.T.; Zhang, G.M. Building green retrofit in China: Policies, barriers and recommendations. Energy Policy 2020, 139, 111356. [Google Scholar] [CrossRef]
  40. Bergman, N.; Foxon, T.J. Reframing policy for the energy efficiency challenge: Insights from housing retrofits in the United Kingdom. Energy Res. Soc. Sci. 2020, 63, 101386. [Google Scholar] [CrossRef]
  41. Li, Y.T.; Jun, R.; Zhou, J.; Lu, J.P.; Qing, Y.; Lv, Z.J. The Existing Building Sustainable Retrofit in China-A Review and Case Study. In Proceedings of the 10th International Symposium on Heating, Ventilation and Air Conditioning (ISHVAC), Jinan, China, 19–22 October 2017; pp. 3638–3645. [Google Scholar]
  42. Zhao, X.; Tan, Y.T.; Shen, L.Y.; Zhang, G.M.; Wang, J.H. Case-based reasoning approach for supporting building green retrofit decisions. Build. Environ. 2019, 160, 106210. [Google Scholar] [CrossRef]
  43. Bevan, W.; Lu, S.L.; Sexton, M. Skills required to deliver energy efficient school retrofit buildings. Eng. Constr. Archit. Manage. 2020, 27, 3051–3073. [Google Scholar] [CrossRef]
  44. Li, Y.; Liang, M. The economic development incentive mechanism for the existing energy-saving building structure in the perspective of game analysis. Int. J. Low-Carbon Technol. 2018, 13, 250–254. [Google Scholar] [CrossRef]
  45. Du, L.; Feng, Y.B.; Lu, W.; Kong, L.K.; Yang, Z. Evolutionary game analysis of stakeholders’ decision-making behaviours in construction and demolition waste management. Environ. Impact Assess. Rev. 2020, 84, 106408. [Google Scholar] [CrossRef]
  46. Huang, Q.Y.; Wang, J.W.; Ye, M.W.; Zhao, S.M.; Si, X. A Study on the Incentive Policy of China’s Prefabricated Residential Buildings Based on Evolutionary Game Theory. Sustainability 2022, 14, 1926. [Google Scholar] [CrossRef]
  47. Chen, L.Y.; Gao, X.; Hua, C.X.; Gong, S.T.; Yue, A.B. Evolutionary process of promoting green building technologies adoption in China: A perspective of government. J. Clean. Prod. 2021, 279, 123607. [Google Scholar] [CrossRef]
  48. Du, Q.; Yan, Y.Q.; Huang, Y.D.; Hao, C.C.; Wu, J. Evolutionary Games of Low-Carbon Behaviors of Construction Stakeholders under Carbon Taxes. Int. J. Environ. Res. Public Health 2021, 18, 508. [Google Scholar] [CrossRef] [PubMed]
  49. Lu, W.; Du, L.; Tam, V.W.Y.; Yang, Z.; Lin, C.; Peng, C. Evolutionary game strategy of stakeholders under the sustainable and innovative business model: A case study of green building. J. Clean. Prod. 2022, 333, 130136. [Google Scholar] [CrossRef]
  50. Liu, Y.; Zuo, J.; Pan, M.; Ge, Q.; Chang, R.D.; Feng, X.; Fu, Y.T.; Dong, N. The incentive mechanism and decision-making behavior in the green building supply market: A tripartite evolutionary game analysis. Build. Environ. 2022, 214, 108903. [Google Scholar] [CrossRef]
  51. Fu, Y.; Dong, N.; Ge, Q.; Xiong, F.; Gong, C. Driving-paths of green buildings industry (GBI) from stakeholders’ green behavior based on the network analysis. J. Clean. Prod. 2020, 273, 122883. [Google Scholar] [CrossRef]
  52. Maynard Smith, J. The theory of games and the evolution of animal conflicts. J. Theor. Biol. 1974, 47, 209–221. [Google Scholar] [CrossRef]
  53. Selten, R. A note on evolutionarily stable strategies in asymmetric animal conflicts. J. Theor. Biol. 1980, 84, 93–101. [Google Scholar] [CrossRef]
  54. Li, C.W.Q.Z.H. Green Retrofitting for Existing Office Buildings-Case Studies; China Architecture & Building Press: Beijing, China, 2015. [Google Scholar]
  55. Liu, Y.; Guo, X.; Hu, F. Cost-benefit analysis on green building energy efficiency technology application: A case in China. Energy Build. 2014, 82, 37–46. [Google Scholar] [CrossRef]
  56. Guochang., F.; Yu., H.; Lixin., T. Evolutionary game analysis of government and enterprises carbon-reduction under the driven of carbon trading. Chin. J. Manag. Sci. 2021, 38, 1–12. [Google Scholar] [CrossRef]
  57. Kin, L.; Yan, D.; Tong, Y.J.; Neng, Z.; Zhe, T. Research on the evaluation system for heat metering and existing residential building retrofits in northern regions of China for the 12th five-year period. Energy 2014, 77, 898–908. [Google Scholar] [CrossRef]
  58. Liang, X.; Yu, T.; Hong, J.K.; Shen, G.Q. Making incentive policies more effective: An agent-based model for energy-efficiency retrofit in China. Energy Policy 2019, 126, 177–189. [Google Scholar] [CrossRef]
  59. Tan, Y.T.; Liu, G.; Zhang, Y.; Shuai, C.Y.; Shen, G.Q. Green retrofit of aged residential buildings in Hong Kong: A preliminary study. Build. Environ. 2018, 143, 89–98. [Google Scholar] [CrossRef]
  60. Chen, Y.H.; Nie, P.Y.; Yang, Y.C. Energy management contract with subsidy. J. Renew. Sustain. Energy 2017, 9, 055903. [Google Scholar] [CrossRef]
  61. Baek, C.; Park, S. Policy measures to overcome barriers to energy renovation of existing buildings. Renew. Sustain. Energy Rev. 2012, 16, 3939–3947. [Google Scholar] [CrossRef]
  62. Liu, X.J.; Liu, X.D.; Luo, X.; Fu, H.L.; Wang, M.M.; Li, L.Y. Impact of Different Policy Instruments on Diffusing Energy Consumption Monitoring Technology in Public Buildings: Evidence from Xi’ an, China. J. Clean. Prod. 2020, 251, 119693. [Google Scholar] [CrossRef]
  63. Ebrahimigharehbaghi, S.; Qian, Q.K.; Meijer, F.M.; Visscher, H.J. Unravelling Dutch homeowners’ behaviour towards energy efficiency renovations: What drives and hinders their decision-making? Energy Policy 2019, 129, 546–561. [Google Scholar] [CrossRef]
  64. Feng, Q.; Chen, H.; Shi, X.; Wei, J. Stakeholder games in the evolution and development of green buildings in China: Government-led perspective. J. Clean. Prod. 2020, 275, 122895. [Google Scholar] [CrossRef]
  65. Iwaro, J.; Mwasha], A. A review of building energy regulation and policy for energy conservation in developing countries. Energy Policy 2010, 38, 7744–7755. [Google Scholar] [CrossRef]
  66. Zou, P.; Xu, X.; Sanjayan, J.; Wang, J. A mixed methods design for building occupants’ energy behavior research. Energy Build. 2018, 166, 239–249. [Google Scholar] [CrossRef]
Figure 1. Diagram on numerical simulation of evolutionary game model.
Sustainability 14 11697 g001
Figure 2. (a) The impact of changes in x on the evolution of y. (b) The impact of changes in x on the evolution of z.
Sustainability 14 11697 g002
Figure 3. (a) The impact of changes in y on the evolution of x. (b) The impact of changes in y on the evolution of z.
Sustainability 14 11697 g003
Figure 4. (a) The impact of changes in z on the evolution of x. (b) The impact of changes in z on the evolution of y.
Sustainability 14 11697 g004
Figure 5. The influence of changes in Δ E 1 on the evolution path.
Sustainability 14 11697 g005
Figure 6. The influence of changes in Δ E 2 on the evolution path.
Sustainability 14 11697 g006
Figure 7. The influence of changes in G P on the evolution path.
Sustainability 14 11697 g007
Figure 8. The influence of changes in T on the evolution path.
Sustainability 14 11697 g008
Figure 9. The influence of changes in SR on the evolution of y.
Sustainability 14 11697 g009
Figure 10. The influence of changes in SU on the evolution of z.
Sustainability 14 11697 g010
Figure 11. The influence of changes in P on the evolution of y.
Sustainability 14 11697 g011
Figure 12. (a) The influence of changes in SR on the evolution of x. (b) The influence of changes in SU on the evolution of x. (c) The influence of changes in P on the evolution of x.
Sustainability 14 11697 g012aSustainability 14 11697 g012b
Figure 13. The influence of changes in D on the evolution of x.
Sustainability 14 11697 g013
Table 1. Meaning of parameters.
Major PlayersParameterMeaning
GovernmentGPThe cost of government’s positive supervision
α G P The cost of government’s negative supervision
SRGovernment subsidies for owners to implement energy-efficiency retrofitting
SUGovernment subsidies for users to accept energy-efficiency retrofitting
WEnvironmental and social benefits from energy-efficiency retrofitting
PFines given by the government when owners refuse to implement energy-efficiency retrofitting
DLosses incurred by the government against the public willingness
Property ownersC1Basic costs for owners
E1Traditional income for owners
Δ C 1 Incremental costs to the owners for energy-efficiency retrofitting
Δ E 1 Additional income to the owners for energy-efficiency retrofitting
TOwner’s turnover costs associated with the relocation of users
UsersC2Basic costs for users
E2Traditional income for users
Δ C 2 Incremental cost for users to accept energy-efficiency retrofitting
Δ E 2 Additional benefit for users to accept energy-efficiency retrofitting
Table 2. The tripartite evolutionary game payoff matrix.
Major Players’ StrategiesUsers (z)Users (1 − z)
Government (x)Owners (y) W G P S R S U ,
E 1 + Δ E 1 + S R C 1 Δ C 1 ,
E 2 + Δ E 2 + S U C 2 Δ C 2
W G P S R ,
S R C 1 Δ C 1 ,
E 2 C 2
Owners (1 − y) P G P ,
E 1 C 1 T P ,
E 2 C 2
P G P ,
E 1 C 1 P ,
E 2 C 2
Government (1 − x)Owners (y) W α G P D ,
E 1 + Δ E 1 C 1 Δ C 1 ,
E 2 + Δ E 2 C 2 Δ C 2
W α G P ,
C 1 Δ C 1 ,
E 2 C 2
Owners (1 − y) α G P D ,
E 1 C 1 T ,
E 2 C 2
α G P ,
E 1 C 1 ,
E 2 C 2
Table 3. The Jacobian eigenvalues at equilibrium points.
Equilibrium PointsEigenvaluesSymbols of
Eigenvalues
(0,0,0) 0 ; Δ C 1 E 1 ;   P + ( α 1 ) G p (0,−,*)
(1,0,0) 0 ;   ( 1 α ) G p P ;   P E 1 + S R Δ C 1 (0,*,*)
(0,1,0) Δ C 1 + E 1 ;   Δ E 2 Δ C 2 ;   ( α 1 ) G p S R (+,*,−)
(0,0,1) 0 ;   T Δ C 1 + Δ E 1 ;   D + P + ( α 1 ) G p (0,*,*)
(1,1,0) ( 1 α ) G p + S R ;   S u + Δ E 2 Δ C 2 ;   E 1 P S R + Δ C 1 (+,*,*)
(1,0,1) 0 ;   ( 1 α ) G p P D ;   T + P + S R Δ C 1 + Δ E 1 (0,*,*)
(0,1,1) Δ C 2 Δ E 2 ;   Δ C 1 T Δ E 1 ;   D S R S u + ( α 1 ) G p (*,*,*)
(1,1,1) Δ C 2 S u Δ E 2 ;   Δ C 1 P S R T Δ E 1 ;   ( 1 α ) G p D + S R + S u (*,*,*)
Note: * indicates that the symbol is uncertain.
Table 4. Initial values of main parameters.
Major PlayersParameterInitial ValueMajor PlayersParameterInitial Value
GovernmentGP20Property owners Δ C 1 180
α 0.6 Δ E 1 260
SR110T35
SU60Users Δ C 2 200
P20 Δ E 2 215
D15
Publisher’s Note: MDPI stays neutral with regard to jurisdictional claims in published maps and institutional affiliations.

