
Analyzing Spatio-Temporal Change in Ecosystem Quality and Its Driving Mechanism in Henan Province, China, from 2010 to 2020

Abstract
:1. Introduction
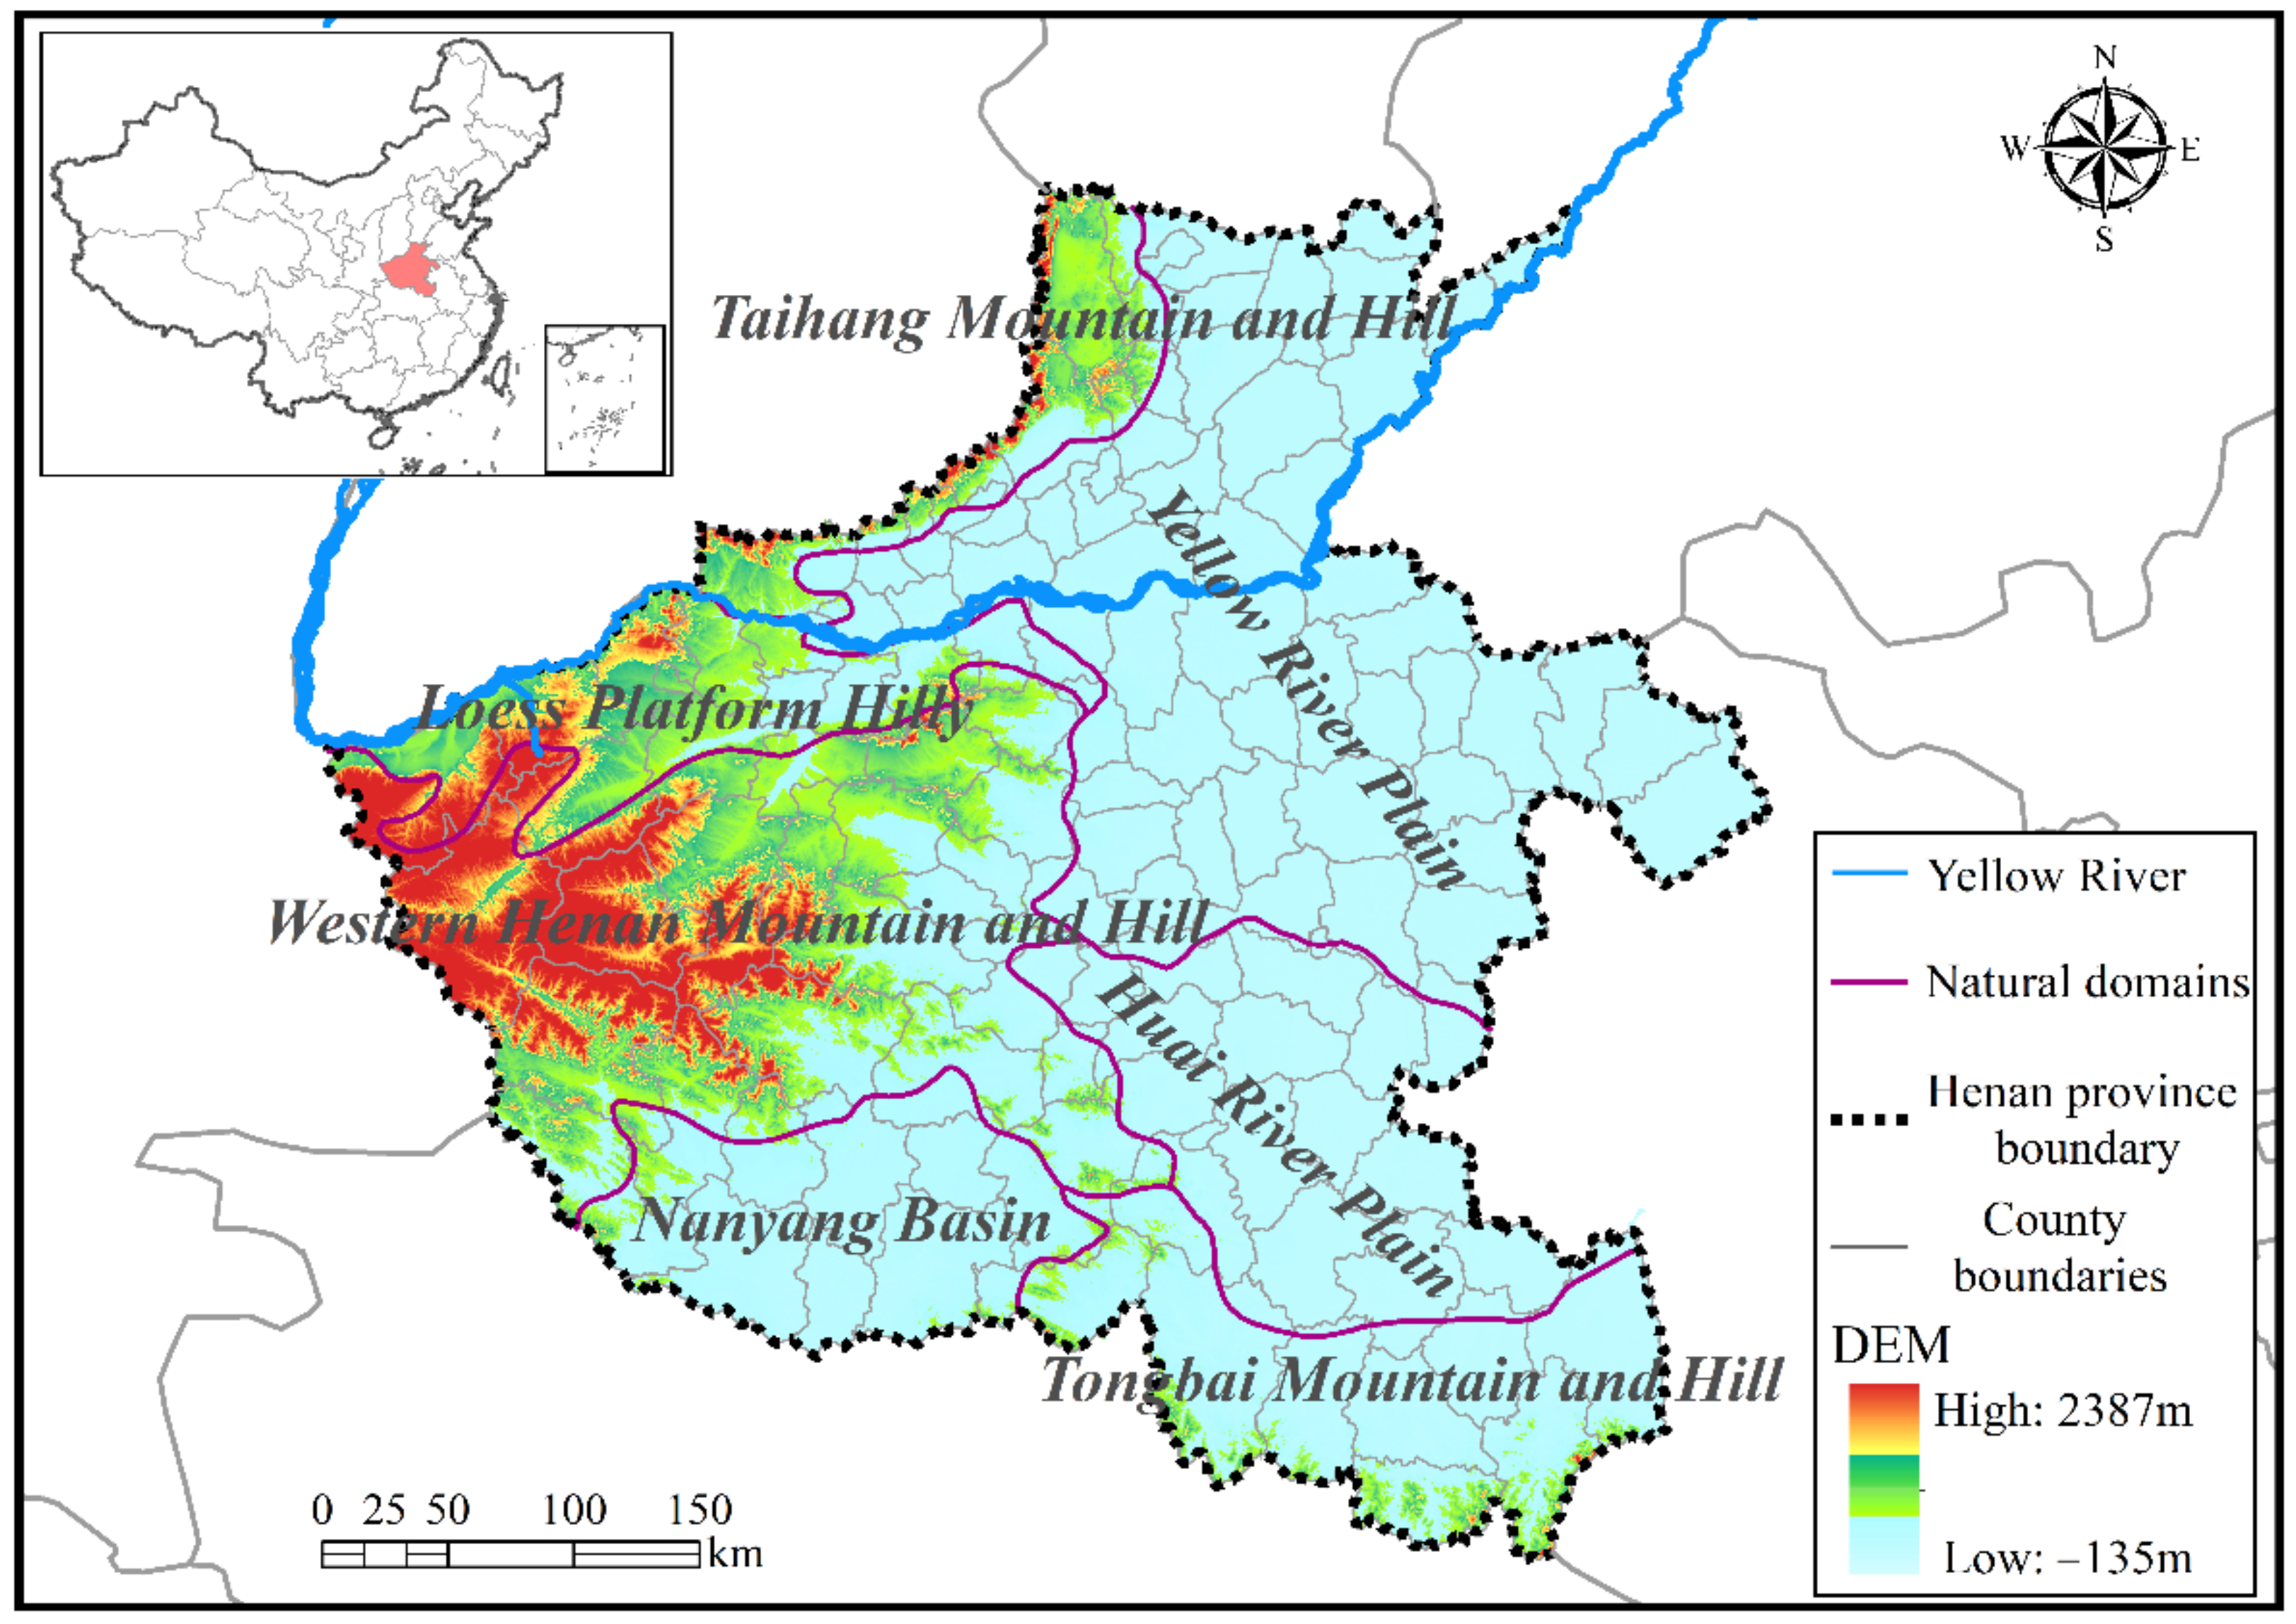
2. Study Area
3. Data and Methods
3.1. Data Sources and Processing
3.2. Index System
3.3. Methods
3.3.1. Calculation of the Ecosystem Quality Index (EQI)
3.3.2. Analysis of the Gravity Center of Ecosystem Quality
3.3.3. Geo-Detectors Model
- (1)
- Factor detector: This detects the spatial differences in changes in ecosystem quality and the influence of different factors (X) on the ecosystem quality index (Y). The expression is:
- (2)
- Interaction detector: Its main purpose is to analyze the interactions of different driving factors with the dependent variable, to identify whether the two factors affect ecosystem quality independently or together, and to determine whether the change in ecosystem quality is enhanced or weakened when the two factors act together. When evaluating the influence of factors, it is necessary to calculate the q value of the effects of the two interacting factors on ecosystem quality, i.e., q(X1) and q(X2), to calculate the q value of the combined effect of the two interacting factors on ecosystem quality, i.e., q(X1∩X2), and, finally, to compare q(X1), q(X2), and q(X1∩X2). See Table 4 for the specific interaction relationships.
4. Results
4.1. Spatial and Temporal Characteristics of Ecosystem Quality in Henan Province from 2010 to 2020
4.2. Trajectory of the Gravity Center of Ecosystem Quality in Henan Province from 2010 to 2020
4.3. Analysis of the Driving Factors of Ecosystem Quality Change in Henan Province from 2010 to 2020
4.3.1. Driving Factor Detection and Analysis
4.3.2. Interaction Detection and Analysis
5. Discussion and Policy Implications
5.1. Driving Factors of Ecosystem Quality
5.2. Policy Implications
- (1)
- Optimize the industrial development pattern. The GDP and population density of socio-economic elements are the main factors affecting the ecosystem quality in Henan Province. Henan Province should optimize the layout of agriculture, industry and services according to the physical conditions of different natural domains. In particular, the transformation of high-energy consumption industries to green and energy-conserving industries should be actively promoted. Thus, ecological and environmental protection industries should be widely supported, and the use range of clean energy such as solar energy should be expanded;
- (2)
- Optimize the pattern of land space development and protection. Cites in the central and northern plain areas experience lower ecosystem quality due to population agglomeration, the continuous expansion of construction land and high levels of urbanization. Henan Province must consider the adverse impact of expanding construction land into arable and forest land areas and improve land use efficiency. A red line for farmland protection should be delineated to develop high-quality arable land; moreover, the dynamic monitoring of arable land should be strengthened in order to limit the further expansion of urban construction land in plain areas. New methods for the expansion of urban green areas and the construction of urban artificial ecosystems must be explored. Moreover, to improve the level of natural environment protection and management, construction projects in hills and mountainous areas should be developed in a way that prevents the destruction of natural resources caused by the exploitation of mineral resources and the development of tourism;
- (3)
- Improve the quality of forest ecosystem. Henan Province should focus on the ecosystem development of Taihang Mountain and Hill Area, the Western Henan Mountain and Hill Area, the Nanyang Basin Area, and the Tongbai Mountain and Hill Area. More attention should be paid to the ecological restoration of mines in these areas. Firstly, the layout of reserve forest bases must be planned to nurture young and middle-aged forests, cultivate a stable forest ecosystem, and enhance the capacity of forest carbon sequestration. Secondly, degraded forests must be restored scientifically, and the quality and function of shelter forests should be improved. Thirdly, the protection of natural forests and the construction of sand control forests should be carried out in the Yellow River Plain Area and the Huai River Plain Area. In additions, it is necessary to consolidate and strengthen the implementation of forestry policies and safeguard measures in the plain area according to local conditions, in order to prevent forestry projects from reversing any improvements in ecological environment quality due to lack of supervision.
6. Conclusions
- (1)
- From 2010 to 2020, the ecosystem quality index of Henan Province improved significantly, and the ecosystem quality of the southern mountainous and hilly areas was better than that of the central and northern plains. During the study period, the areas with high ecosystem quality in Henan Province were mainly located in the west and south, and the ecosystem quality indices of the Huai River Plain and the Yellow River Plain were relatively low. The main reason is that the hilly area of western Henan Province, the Nanyang Basin, and the hilly area of the Tongbai Mountains in had better natural conditions, while the central plain area is the area of the agglomeration of Henan Province’s population and economy. The quality of the ecosystem in the plains is not as good as that in the mountainous and hilly areas. The EQI in the central and northern plains has gradually improved from 2010 to 2020, and the gravity center of the ecosystem quality in Henan Province has continued to move to the North–West;
- (2)
- From 2010 to 2020, the influence of the GDP per square kilometer on the ecosystem quality of Henan Province was significantly higher than that of other factors, and the interactions among the influencing factors were mainly nonlinear enhancement. Overall, the changes in ecosystem quality in Henan Province were the result of the comprehensive influence of natural environmental factors, socioeconomic factors, and policy regulations. Among them, population density and the GDP per kilometer, which were among the socioeconomic factors, had the strongest explanatory power regarding the ecosystem quality in Henan Province. The single-factor detection results showed that the impact of GDP per kilometer was the largest, and the double-factor interaction showed that socioeconomic factors and other factors played the most prominent role, thus showing that the socioeconomic development in 2010–2020 imposed great pressure on the ecosystem quality of Henan Province. The industrial and economic structure needs to be further optimized. Secondly, Henan Province needs to pay attention to the orderly development of land area, especially in the mountainous and hilly areas and the southern basins in order to balance the relationship between land-use intensity and the ecological economy;
- (3)
- From 2010 to 2020, the forestry projects in Henan Province had a positive effect on improvements in ecosystem quality, although it was not strong. Forestry engineering has played an obvious role in promoting improvements in environmental quality in Henan Province. Especially in the mountainous and hilly areas in the north and south of Henan Province, the influence of the interaction between forestry engineering and other factors was higher than that in other regions, indicating that the continuous promotion of forestry engineering in Henan Province has produced good results. In the central plains area, because of the large differences in natural conditions, such as the terrain, precipitation, and temperature, compared with those in the mountains and hills, the effects of forestry projects were relatively weak.
Author Contributions
Funding
Institutional Review Board Statement
Informed Consent Statement
Data Availability Statement
Conflicts of Interest
References
- Rind, D. Complexity and climate. Science 1999, 284, 105–107. [Google Scholar] [CrossRef] [PubMed]
- Jiang, W.; Gao, W.D.; Giao, X.M.; Ma, M.C.; Zhou, M.M.; Du, K.; Ma, X. Spatio-temporal heterogeneity of air pollution and its key influencing factors in the Yellow River Economic Belt of China from 2014 to 2019. J. Environ. Manage. 2021, 296, 113172. [Google Scholar] [CrossRef] [PubMed]
- Alexandrescu, F.; Ștefănescu, L.; Pop, A. Penumbras of the planetary mine: Experiencing (post-) mining transformations in the Western Carpathians of Romania. Eurasian Geogr. Econ. 2022, 1–28. [Google Scholar] [CrossRef]
- Rîșteiu, N.T.; Remus, C.; O’Brien, T. Contesting Post-Communist Economic Development: Gold Extraction, Local Community, and Rural Decline in Romania. Eurasian Geogr. Econ. 2022, 63, 491–513. [Google Scholar] [CrossRef]
- Haq, N.U. Impact of FDI and Its Absorption Capacity on the National Innovation Ecosystems: Evidence from the Largest FDI Recipient Countries of the World. Foreign Trade Rev. 2022, 00157325221077007. [Google Scholar] [CrossRef]
- Creţan, R.; Guran-Nica, L.; Platon, D.; Turnock, D. Foreign Direct Investment in Eastern Europe. Foreign Direct Investment and Social Risk in Romania: Progress in Less-Favoured Areas; Routledge Press: London, UK, 2005; pp. 305–348. [Google Scholar] [CrossRef]
- Cretan, R.; Malovics, G.; Berki, B.M. On the perpetuation and contestation of racial stigma: Urban Roma in a disadvantaged neighbourhood of szeged. Geogr. Pannonica. 2020, 24, 294–310. [Google Scholar] [CrossRef]
- Mereine-Berki, B.; Malovics, G.; Cretan, R. “You become one with the place”: Social mixing, social capital, and the lived experience of urban desegregation in the Roma community. Cities 2021, 117, 103302. [Google Scholar] [CrossRef]
- Ajibade, I. Planned retreat in global south megacities: Disentangling policy, practice, and environmental justice. Clim. Change 2019, 157, 299–317. [Google Scholar] [CrossRef]
- Mörtberg, U.M.; Balfors, B.; Knol, W.C. Landscape ecological assessment: A tool for integrating biodiversity issues in strategic environmental assessment and planning. J. Environ. Manag. 2007, 82, 457–470. [Google Scholar] [CrossRef]
- Marull, J.; Pino, J.; Mallarach, J.M.; Cordobilla, M.J. A land suitability index for strategic environmental assessment in metropolitan areas. Landsc. Urban Plan. 2006, 81, 200–212. [Google Scholar] [CrossRef]
- Li, Z.Y.; Wei, W.; Zhou, L.; Guo, Z.C.; Xie, B.B.; Zhou, J.J. Temporal and spatial evolution of ecological sensitivity in arid inland river basins of northwest China based on spatial distance index: A case study of Shiyang River Basin. Acta Ecol. Sin. 2019, 39, 7463–7475. (In Chinese) [Google Scholar] [CrossRef]
- Ippolito, A.; Sala, S.; Faber, J.H.; Vighi, M. Ecological vulnerability analysis: A river basin case study. Sci. Total Environ. 2010, 408, 3880–3890. [Google Scholar] [CrossRef]
- Wu, H.Y.; Chen, K.L.; Chen, Z.H.; Chen, Q.H.; Qiu, Y.P.; Wu, J.C.; Zhang, J.F. Evaluation for the ecological quality status of coastal waters in East China Sea using fuzzy integrated assessment method. Mar. Pollut. Bull. 2012, 64, 546–555. [Google Scholar] [CrossRef]
- Zhang, Y.H.; Guo, J.R.; Zhuang, Y.; Tian, X.J. Eco-environmental quality evaluation of Wuleidaowan national wetland based on Analytic Hierarchy Process(AHP) approach. IOP Conf. Ser. Earth Environ. Sci. 2021, 769, 022013. [Google Scholar] [CrossRef]
- Zhang, Y.; Chen, X.D. A study on the choices of construction land suitability evaluation of ecological index. Procedia Comput. Sci. 2016, 91, 180–183. [Google Scholar] [CrossRef]
- Zhong, X.J.; Sun, B.P.; Zhao, Y.; Li, J.R.; Zhou, X.S.; Wang, Y.Q.; Qiu, Y.D.; Feng, L. Ecological vulnerability evaluation based on principal component analysis in Yunnan province. Ecol. Environ. Sci. 2011, 20, 109–113. (In Chinese) [Google Scholar] [CrossRef]
- Li, A.N.; Wang, A.S.; Liang, S.L.; Zhou, W.C. Eco-environmental vulnerability evaluation in mountainous region using remote sensing and GIS-A case study in the upper reaches of Minjiang River, China. Ecol. Model. 2006, 192, 175–187. [Google Scholar] [CrossRef]
- Ni, J. Carbon storage in terrestrial ecosystems of China: Estimates at different spatial resolutions and their responses to climate change. Clim. Chang. 2001, 49, 339–358. [Google Scholar] [CrossRef]
- Yang, X.Y.; Meng, F.; Fu, P.J.; Zhang, Y.X.; Liu, Y.H. Spatiotemporal change and driving factors of the eco-environment quality in the Yangtze river basin from 2001 to 2019. Ecol. Indic. 2021, 131, 108214. [Google Scholar] [CrossRef]
- Xu, D.; Yang, F.; Yu, L.; Zhou, Y.Y.; Li, H.X.; Ma, J.J.; Huang, J.C.; Wei, J.; Xu, Y.; Zhang, C.; et al. Quantization of the coupling mechanism between eco-environmental quality and urbanization from multi-source remote sensing data. J. Clean. Prod. 2021, 321, 128948. [Google Scholar] [CrossRef]
- Li, Y.R.; Cao, Z.; Long, H.L.; Liu, Y.S.; Li, W.J. Dynamic analysis of ecological environment combined with land cover and NDVI changes and implications for sustainable urban-rural development: The case of Mu Us Sandy Land, China. J. Clean. Prod. 2017, 142, 697–715. [Google Scholar] [CrossRef]
- Matsushita, B.; Yang, W.; Chen, J.; Onda, Y.; Qiu, G.Y. Sensitivity of the enhanced vegetation index (EVI) and normalized difference vegetation index (NDVI) to topographic effects: A case study in high-density cypress forest. Sensors 2007, 7, 2636–2651. [Google Scholar] [CrossRef] [PubMed]
- Plutzar, C.; Kroisleitner, C.; Haberl, H.; Fetzel, T.; Bulgheroni, C.; Beringer, T.; Hostert, P.; Kastner, T.; Kuemmerle, T.; Lauk, C.; et al. Changes in the spatial patterns of human appropriation of net primary production (HANPP) in Europe 1990–2006. Reg. Environ. Chang. 2016, 16, 1225–1238. [Google Scholar] [CrossRef]
- Wang, S.Y.; Zhang, X.X.; Zhu, T.; Yang, W.; Zhao, J.Y. Assessment of ecological environment quality in the Changbai mountain nature reserve based on remote sensing technology. Prog. Geogr. 2016, 35, 1269–1278. (In Chinese) [Google Scholar] [CrossRef]
- Yang, Z.K.; Tian, J.; Li, W.Y.; Su, W.R.; Guo, R.Y.; Liu, W.J. Spatio-temporal pattern and evolution trend of ecological environment quality in the Yellow River Basin. Acta Ecol. Sin. 2021, 41, 7627–7636. (In Chinese) [Google Scholar] [CrossRef]
- Akbari, A.; Pittman, J.; Feick, R. Mapping the relative habitat quality values for the burrowing owls (Athene cunicularia) of the Canadian prairies using an innovative parameterization approach in the InVEST HQ module. Environ. Manage. 2021, 68, 310–328. [Google Scholar] [CrossRef]
- Lee, D.J.; Jeon, S.W. Estimating changes in habitat quality through land-use predictions: Case study of roe deer (Capreolus pygargus tianschanicus) in Jeju Island. Sustainability 2020, 12, 10123. [Google Scholar] [CrossRef]
- Yohannes, H.; Soromessa, T.; Argaw, M.; Dewan, A. Spatio-temporal changes in habitat quality and linkage with landscape characteristics in the Beressa watershed, Blue Nile basin of Ethiopian highlands. J. Environ. Manag. 2020, 281, 111885. [Google Scholar] [CrossRef]
- Li, S.; Dong, B.; Gao, X.; Xu, H.F.; Ren, C.Q.; Liu, Y.R.; Peng, L. Study on spatio-temporal evolution of habitat quality based on land-use change in chongming dongtan, China. Environ. Earth Sci. 2022, 81, 220. [Google Scholar] [CrossRef]
- Geng, W.L.; Li, Y.Y.; Zhang, P.Y.; Yang, D.; Jing, W.L.; Rong, T.Q. Analyzing spatio-temporal changes and trade-offs/synergies among ecosystem services in the Yellow River Basin, China. Ecol. Indic. 2022, 138, 108825. [Google Scholar] [CrossRef]
- Chen, H.; Fleskens, L.; Schild, J.; Moolenaar, S.; Wang, F.; Ritsema, C. Impacts of large-scale landscape restoration on spatio-temporal dynamics of ecosystem services in the Chinese Loess Plateau. Landsc. Ecol. 2022, 37, 329–346. [Google Scholar] [CrossRef]
- Liu, H.Y.; Xiao, W.F.; Li, Q.; Tian, Y.; Zhu, J.H. Spatio-Temporal Change of Multiple Ecosystem Services and Their Driving Factors: A Case Study in Beijing, China. Forests 2022, 13, 260. [Google Scholar] [CrossRef]
- Liu, W.; Zhan, J.Y.; Zhao, F.; Wang, C.; Zhang, F.; Teng, Y.M.; Chu, X.; Kumi, M.A. Spatio-temporal variations of ecosystem services and their drivers in the pearl river delta, China. J. Clean Prod. 2022, 337, 130466. [Google Scholar] [CrossRef]
- Hao, R.F.; Yu, D.Y.; Liu, Y.P.; Liu, Y.; Qiao, J.M.; Wang, X.; Du, J.S. Impacts of changes in climate and landscape pattern on ecosystem services. Sci. Total Environ. 2017, 579, 718–728. [Google Scholar] [CrossRef]
- Bai, Y.; Ochuodho, T.O.; Yang, J. Impact of land use and climate change on water related ecosystem services in Kentucky, USA. Ecol. Indicat. 2019, 102, 51–64. [Google Scholar] [CrossRef]
- Lorilla, R.S.; Poirazidis, K.; Detsis, V.; Kalogirou, S.; Chalkias, C. Socio-ecological determinants of multiple ecosystem services on the Mediterranean landscapes of the Ionian Islands (Greece). Ecol. Model. 2020, 422, 108994. [Google Scholar] [CrossRef]
- Wang, S.J.; Liu, Z.T.; Chen, Y.X.; Fang, C.L. Factors influencing ecosystem services in the Pearl River Delta, China: Spatiotemporal differentiation and varying importance. Resour. Conserv. Recycl. 2021, 168, 105477. [Google Scholar] [CrossRef]
- Lyu, R.F.; Clarke, K.C.; Zhang, J.M.; Feng, J.L.; Jia, X.H.; Li, J.J. Spatial correlations among ecosystem services and their socio-ecological driving factors: A case study in the city belt along the Yellow River in Ningxia, China. Appl. Geogr. 2019, 108, 64–73. [Google Scholar] [CrossRef]
- Liu, Y.Y.; Zhao, C.Y.; Liu, X.M.; Chang, Y.P.; Wang, H.; Yang, J.H.; Yang, X.G.; Wei, Y. The multi-dimensional perspective of ecological security evaluation and drive mechanism for Baishuijiang National Nature Reserve, China. Ecol. Indic. 2021, 132, 108295. [Google Scholar] [CrossRef]
- Kong, D.Y.; Chen, H.G.; Wu, K.S. The evolution of “production-living-ecological” space, eco-environmental effects and its influencing factors in China. J. Nat. Resour. 2021, 36, 1116–1135. (In Chinese) [Google Scholar] [CrossRef]
- Sannigrahi, S.; Zhang, Q.; Pilla, F.; Joshi, P.K.; Basu, B.; Keesstra, S.; Roy, P.S.; Wang, Y.; Sutton, P.C.; Chakraborti, S.; et al. Responses of ecosystemservices to natural and anthropogenic forcings: A spatial regression based assessment in the world’s largest mangrove ecosystem. Sci. Total Environ. 2020, 715, 137004. [Google Scholar] [CrossRef] [PubMed]
- Pribadi, D.O.; Pauleit, S. Peri-urban agriculture in Jabodetabek Metropolitan Area and its relationship with the urban socioeconomic system. Land Use Pol. 2016, 55, 265–274. [Google Scholar] [CrossRef]
- Braun, D.; de Jong, R.; Schaepman, M.E.; Furrer, R.; Hein, L.; Kienast, F.; Damm, A. Ecosystem service change caused by climatological and non-climatological drivers: A Swiss case study. Ecol. Appl. 2019, 29, e1901. [Google Scholar] [CrossRef] [PubMed]
- Zhang, X.Y.; Wei, W.; Zhou, L.; Guo, Z.C.; Li, Z.Y.; Zhang, J.; Xie, B.B. Analysis on spatio-temporal evolution of ecological vulnerability in arid areas of Northwest China. Acta Ecol. Sin. 2021, 41, 4707–4719. (In Chinese) [Google Scholar] [CrossRef]
- Li, G.Y.; Jiang, C.H.; Zhang, Y.H.; Jiang, G.H. Whether land greening in different geomorphic units are beneficial to water yield in the Yellow River Basin? Ecol. Indic. 2021, 120, 106926. [Google Scholar] [CrossRef]
- Fang, L.L.; Wang, L.C.; Chen, W.X.; Sun, J.; Cao, Q.; Wang, S.Q.; Wang, L.Z. Identifying the impacts of natural and human factors on ecosystem service in the Yangtze and Yellow River Basins. J. Clean. Prod. 2021, 314, 127995. [Google Scholar] [CrossRef]
- Mahmoud, S.H.; Gan, T.Y. Impact of anthropogenic climate change and human activities on environment and ecosystem services in arid regions. Sci. Total Environ. 2018, 633, 1329–1344. [Google Scholar] [CrossRef]
- China’s Ministry of Ecology and Environment. Technical Specification for Investigation and Assessment of National Ecological Status-Ecosystem Quality Assessment; HJ1172—2021; China Environmental Science Press: Beijing, China, 2021. [Google Scholar]
- Wang, J.F.; Xu, C.D. Geo-detector: Principle and prospective. Acta Geogr. Sin. 2017, 72, 116–134. (In Chinese) [Google Scholar] [CrossRef]
- Pan, J.H.; Wei, S.M.; Li, Z. Spatiotemporal pattern of trade-offs and synergistic relationships among multiple ecosystem services in an arid inland river basin in NW China. Ecol. Indic. 2020, 114, 106345. [Google Scholar] [CrossRef]


| Primary Index | Secondary Index | Specific Index | Content |
|---|---|---|---|
| Physical elements | Terrain | Relief amplitude (X1) | Extracted from the filled DEM by the block statistics tool of ArcGIS 10.3 |
| Land use | Land-use diversity (X2) | Using the Shannon–Wiener index to measure the richness, complexity, and order of land use in all counties in Henan Province | |
| Climate | Average annual rainfall (X3) | Average annual rainfall of all county units in Henan Province | |
| Average annual temperature (X4) | Average annual temperature of all county units in Henan Province | ||
| Socioeconomic elements | Population and economy | Population density (X5) | The total resident population of the county divided by the area of the county |
| GDP per square kilometer (X6) | County GDP divided by county area | ||
| Policy adjustments | Ecological engineering | Forestry engineering (X7) | Statistics of forestry engineering policies in all counties in Henan Province, including conversion of farmland into forests, natural forest protection, and shelter forest projects |
| Basic Index | Tolerance | Variance Inflation Factor |
|---|---|---|
| X1 | 0.266 | 3.76 |
| X2 | 0.236 | 2.229 |
| X3 | 0.205 | 4.86 |
| X4 | 0.160 | 6.237 |
| X5 | 0.206 | 4.851 |
| X6 | 0.314 | 3.180 |
| X7 | 0.459 | 2.179 |
| Level | Very Low | Low | Moderate | High | Very High |
|---|---|---|---|---|---|
| Index | EQI ≥ 0.75 | 0.75 > EQI ≥ 0.55 | 0.55 > EQI ≥ 0.35 | 0.35 > EQI ≥ 0.2 | EQI < 0.2 |
| Criterion | Interaction |
|---|---|
| q(X1∩X2) < min(q(X1), q(X2)) | Nonlinear decrease |
| min(q(X1), q(X2)) < q(X1∩X2) < max(q(X1), q(X2)) | Single-factor nonlinear decrease |
| q(X1∩X2) > max(q(X1), q(X2)) | Double-factor enhancement |
| q(X1∩X2) = q(X1) + q(X2) | Independent |
| q(X1∩X2)> q(X1) + q(X2) | Nonlinear enhancement |
| Year | Interaction Detection | TMHA | LPHA | YRPA | WHMHA | NYBA | HRPA | TMHA |
|---|---|---|---|---|---|---|---|---|
| 2010 | X6∩X1 | 0.825 | 0.864 | 0.518 | 0.861 | 0.891 | 0.638 | 0.602 |
| X6∩X2 | 0.897 | 0.652 | 0.554 | 0.689 | 0.810 | 0.575 | 0.980 | |
| X6∩X3 | 0.737 | 0.675 | 0.579 | 0.741 | 0.861 | 0.566 | 0.551 | |
| X6∩X4 | 0.895 | 0.830 | 0.621 | 0.716 | 0.841 | 0.753 | 1.000 | |
| X6∩X7 | 0.766 | 0.625 | 0.390 | 0.583 | 0.79 | 0.498 | 0.602 | |
| 2015 | X6∩X1 | 0.918 | 0.971 | 0.636 | 0.921 | 0.681 | 0.780 | 0.610 |
| X6∩X2 | 0.912 | 0.951 | 0.686 | 0.838 | 0.980 | 0.653 | 0.953 | |
| X6∩X3 | 0.950 | 0.783 | 0.719 | 0.713 | 0.684 | 0.722 | 0.611 | |
| X6∩X4 | 0.967 | 0.934 | 0.668 | 0.964 | 0.681 | 0.647 | 0.960 | |
| X6∩X7 | 0.886 | 0.948 | 0.595 | 0.687 | 0.661 | 0.569 | 0.587 | |
| 2020 | X6∩X1 | 0.903 | 0.950 | 0.603 | 0.798 | 0.755 | 0.833 | 0.634 |
| X6∩X2 | 0.931 | 0.868 | 0.668 | 0.643 | 0.918 | 0.725 | 0.641 | |
| X6∩X3 | 0.879 | 0.639 | 0.639 | 0.879 | 0.656 | 0.598 | 0.927 | |
| X6∩X4 | 0.976 | 0.639 | 0.589 | 0.932 | 0.711 | 0.651 | 0.527 | |
| X6∩X7 | 0.844 | 0.526 | 0.526 | 0.644 | 0.755 | 0.644 | 0.532 |
Publisher’s Note: MDPI stays neutral with regard to jurisdictional claims in published maps and institutional affiliations. |
© 2022 by the authors. Licensee MDPI, Basel, Switzerland. This article is an open access article distributed under the terms and conditions of the Creative Commons Attribution (CC BY) license (https://creativecommons.org/licenses/by/4.0/).
Share and Cite
Ren, X.; Zhang, M.; Qian, J.; Li, S.; Wang, J.; Du, J. Analyzing Spatio-Temporal Change in Ecosystem Quality and Its Driving Mechanism in Henan Province, China, from 2010 to 2020. Sustainability 2022, 14, 11742. https://doi.org/10.3390/su141811742
Ren X, Zhang M, Qian J, Li S, Wang J, Du J. Analyzing Spatio-Temporal Change in Ecosystem Quality and Its Driving Mechanism in Henan Province, China, from 2010 to 2020. Sustainability. 2022; 14(18):11742. https://doi.org/10.3390/su141811742
Chicago/Turabian StyleRen, Xiaoyun, Mingkong Zhang, Juncheng Qian, Shuangquan Li, Jingxu Wang, and Jun Du. 2022. "Analyzing Spatio-Temporal Change in Ecosystem Quality and Its Driving Mechanism in Henan Province, China, from 2010 to 2020" Sustainability 14, no. 18: 11742. https://doi.org/10.3390/su141811742