
Do Education and Employment Play a Role in Youth’s Poverty Alleviation? Evidence from Morocco


Abstract
:1. Introduction
2. Literature Review
2.1. Theoretical Background
2.1.1. Poverty: Clarifying the Concept
2.1.2. Determinants of Youth Poverty
2.2. Empirical Background: Youth in the Moroccan Context
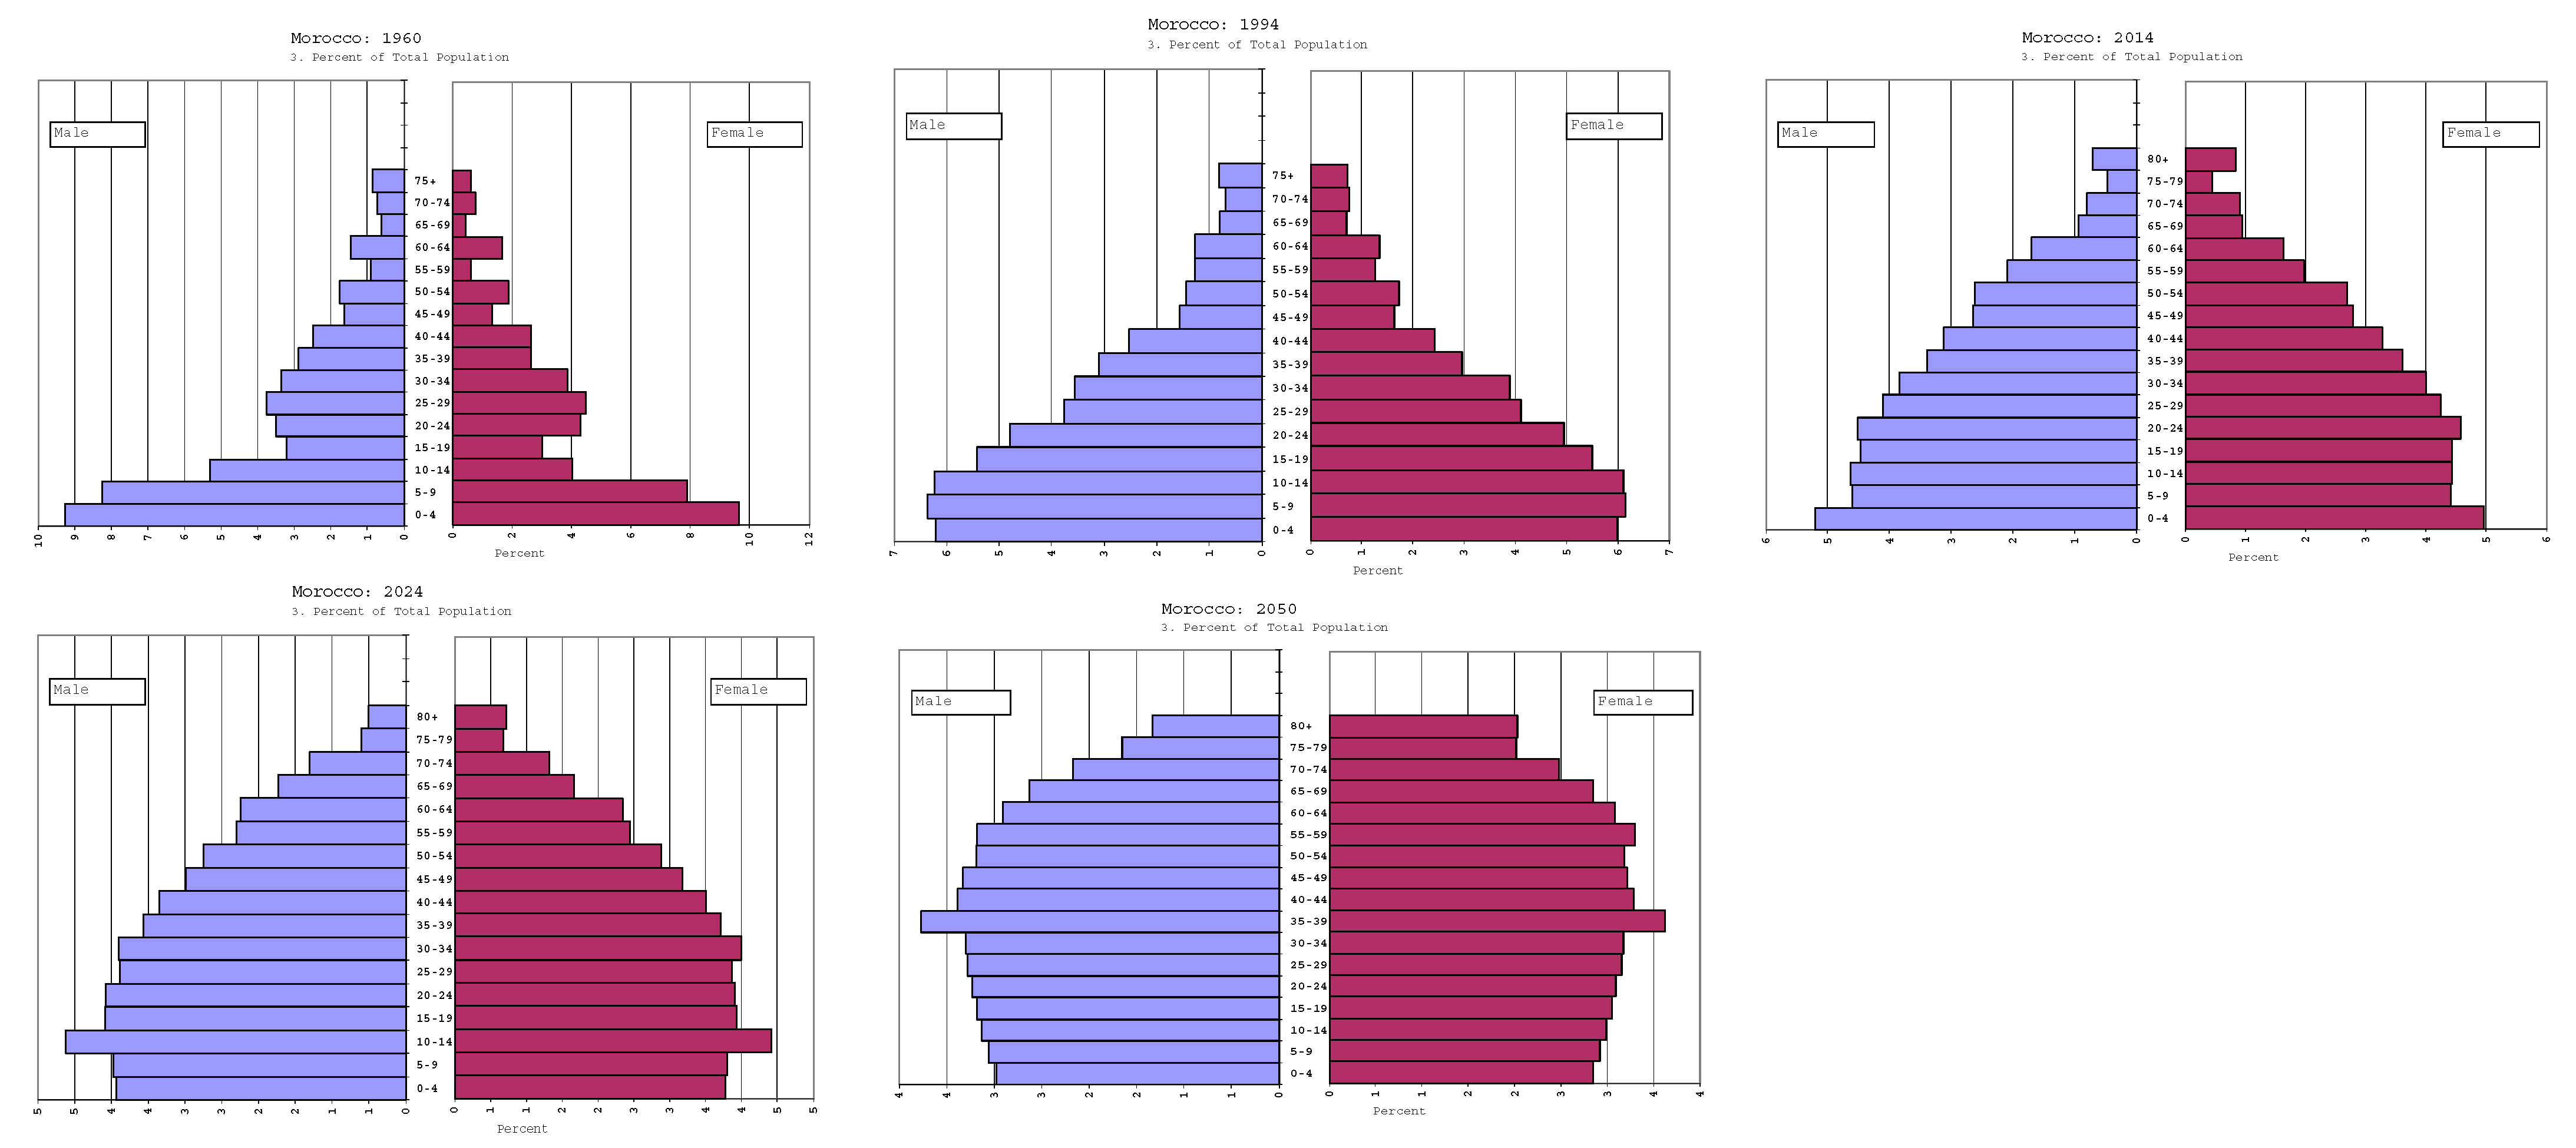
2.2.1. Moroccan Population Remains Very Young
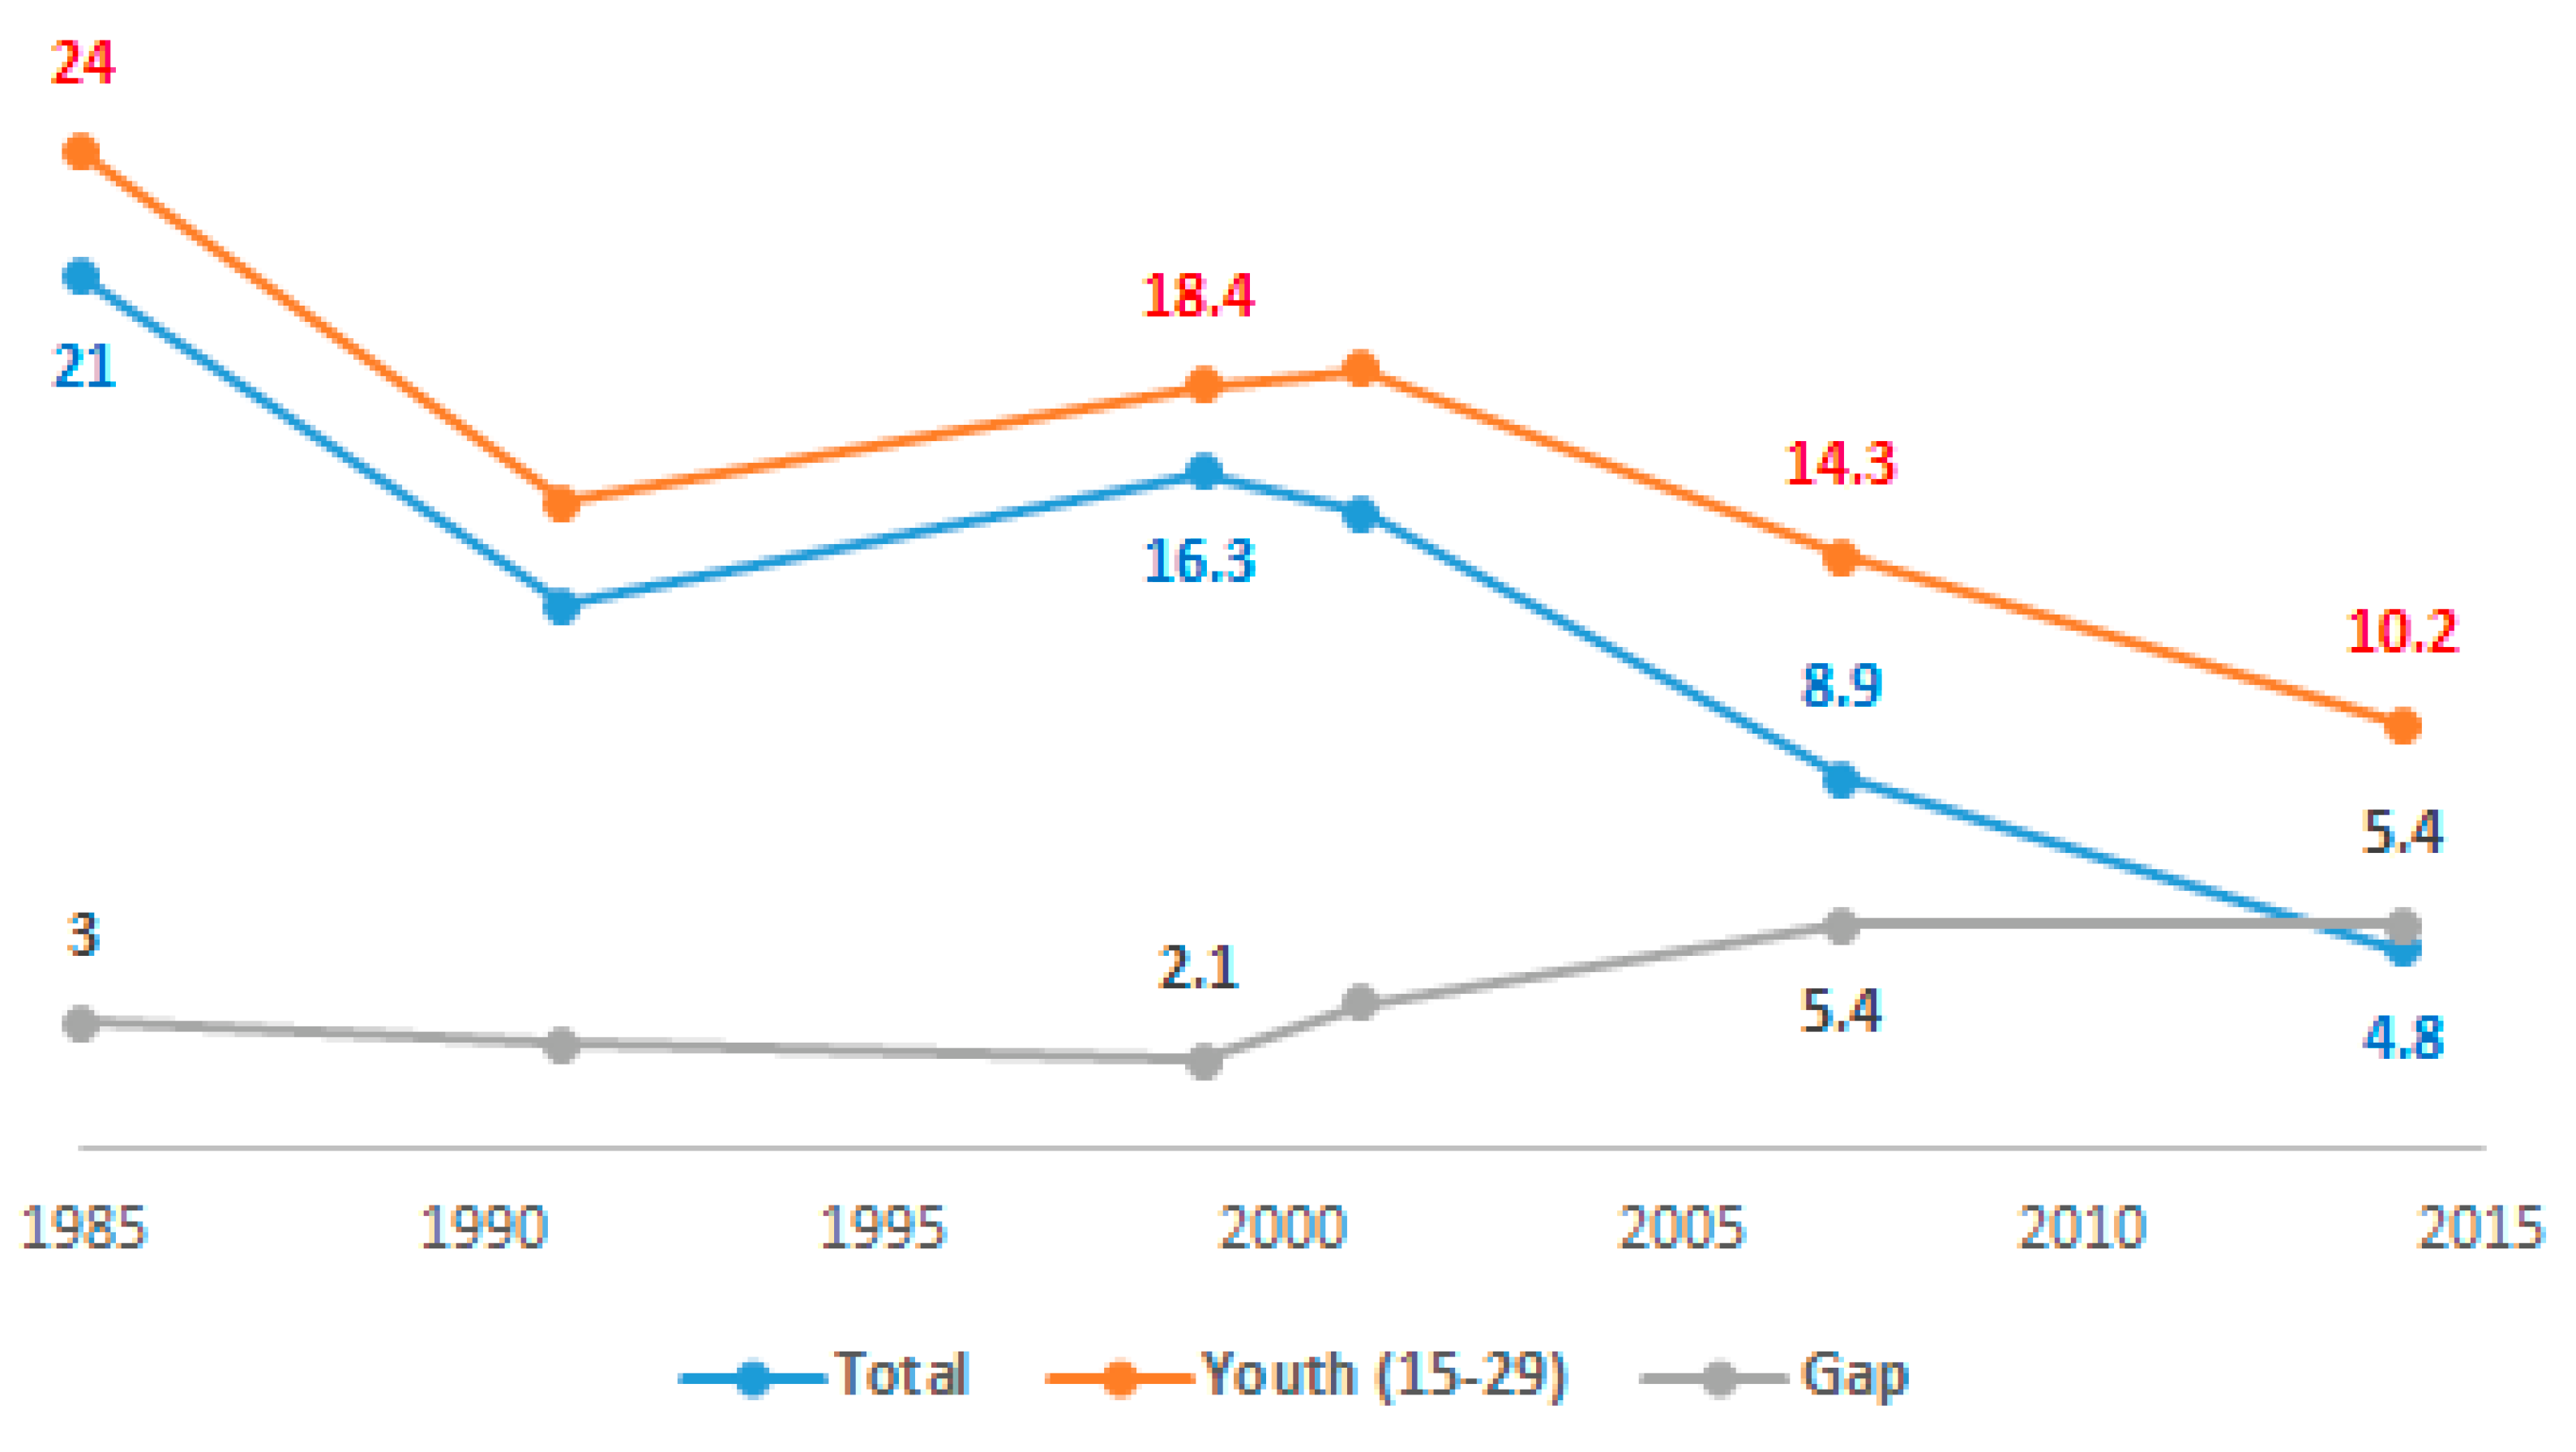
2.2.2. A Noticeable Decline in Youth Poverty versus an Increasing Gap with the National Level
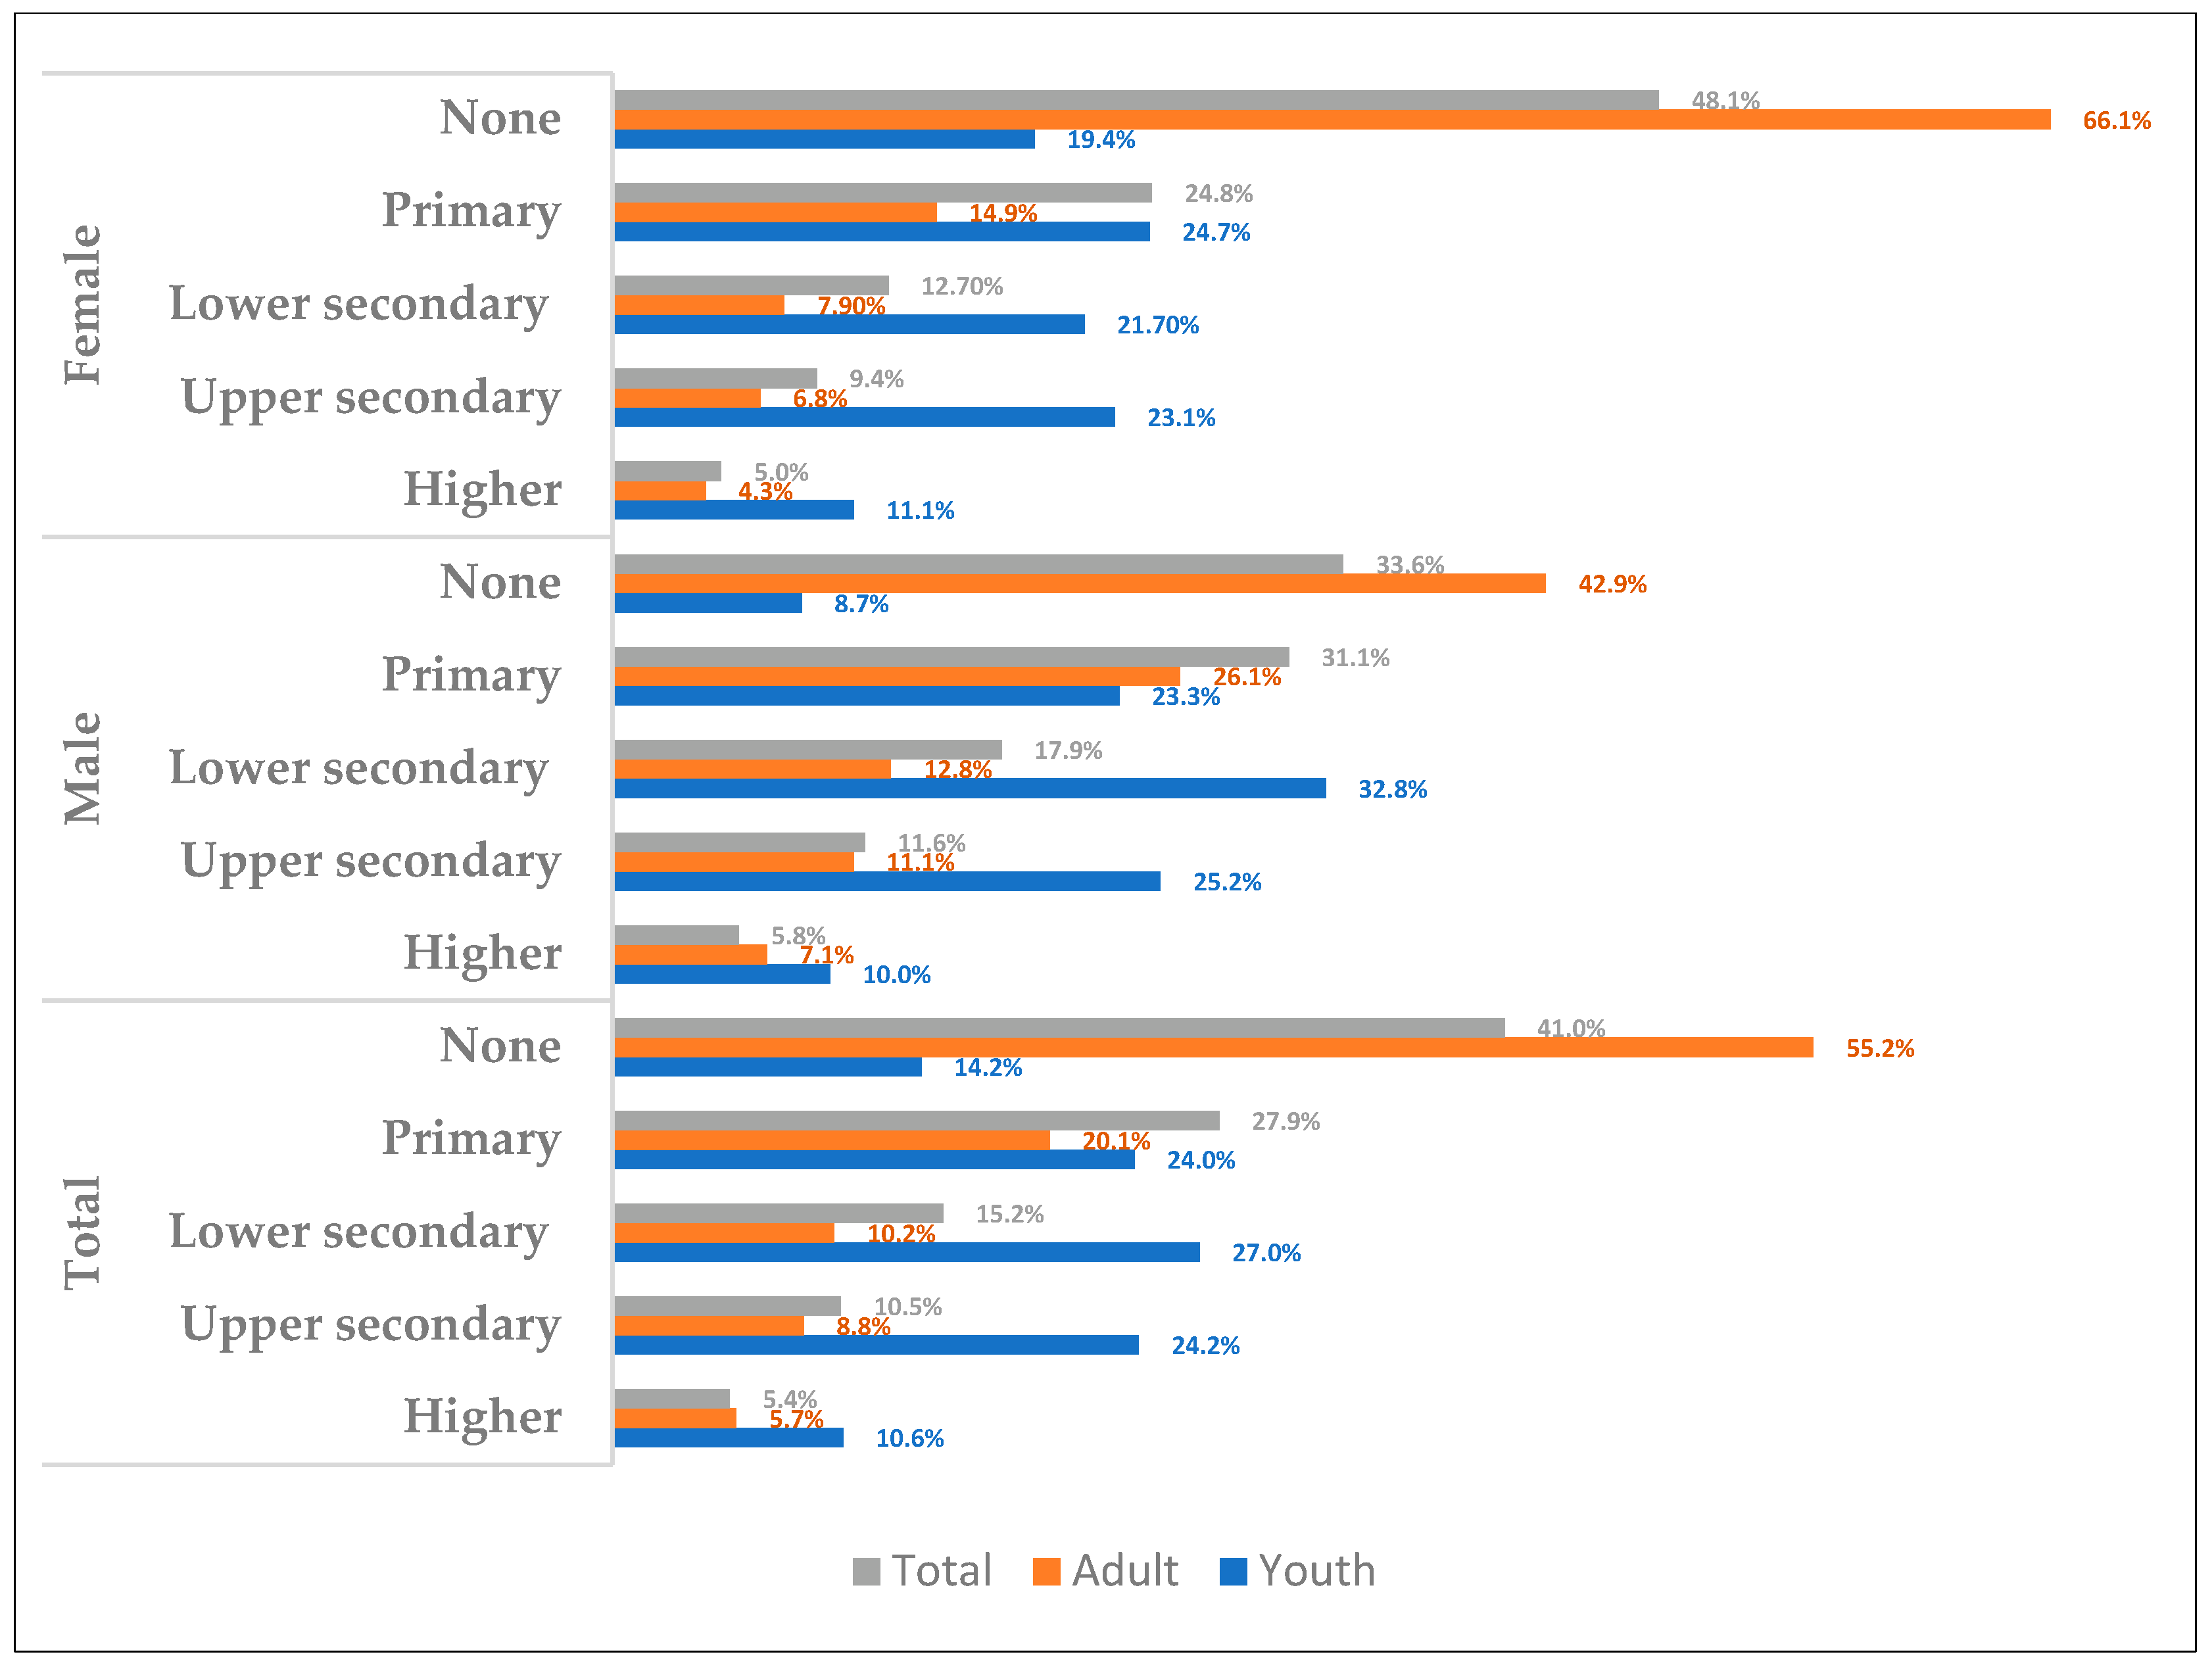
2.2.3. Education Performance
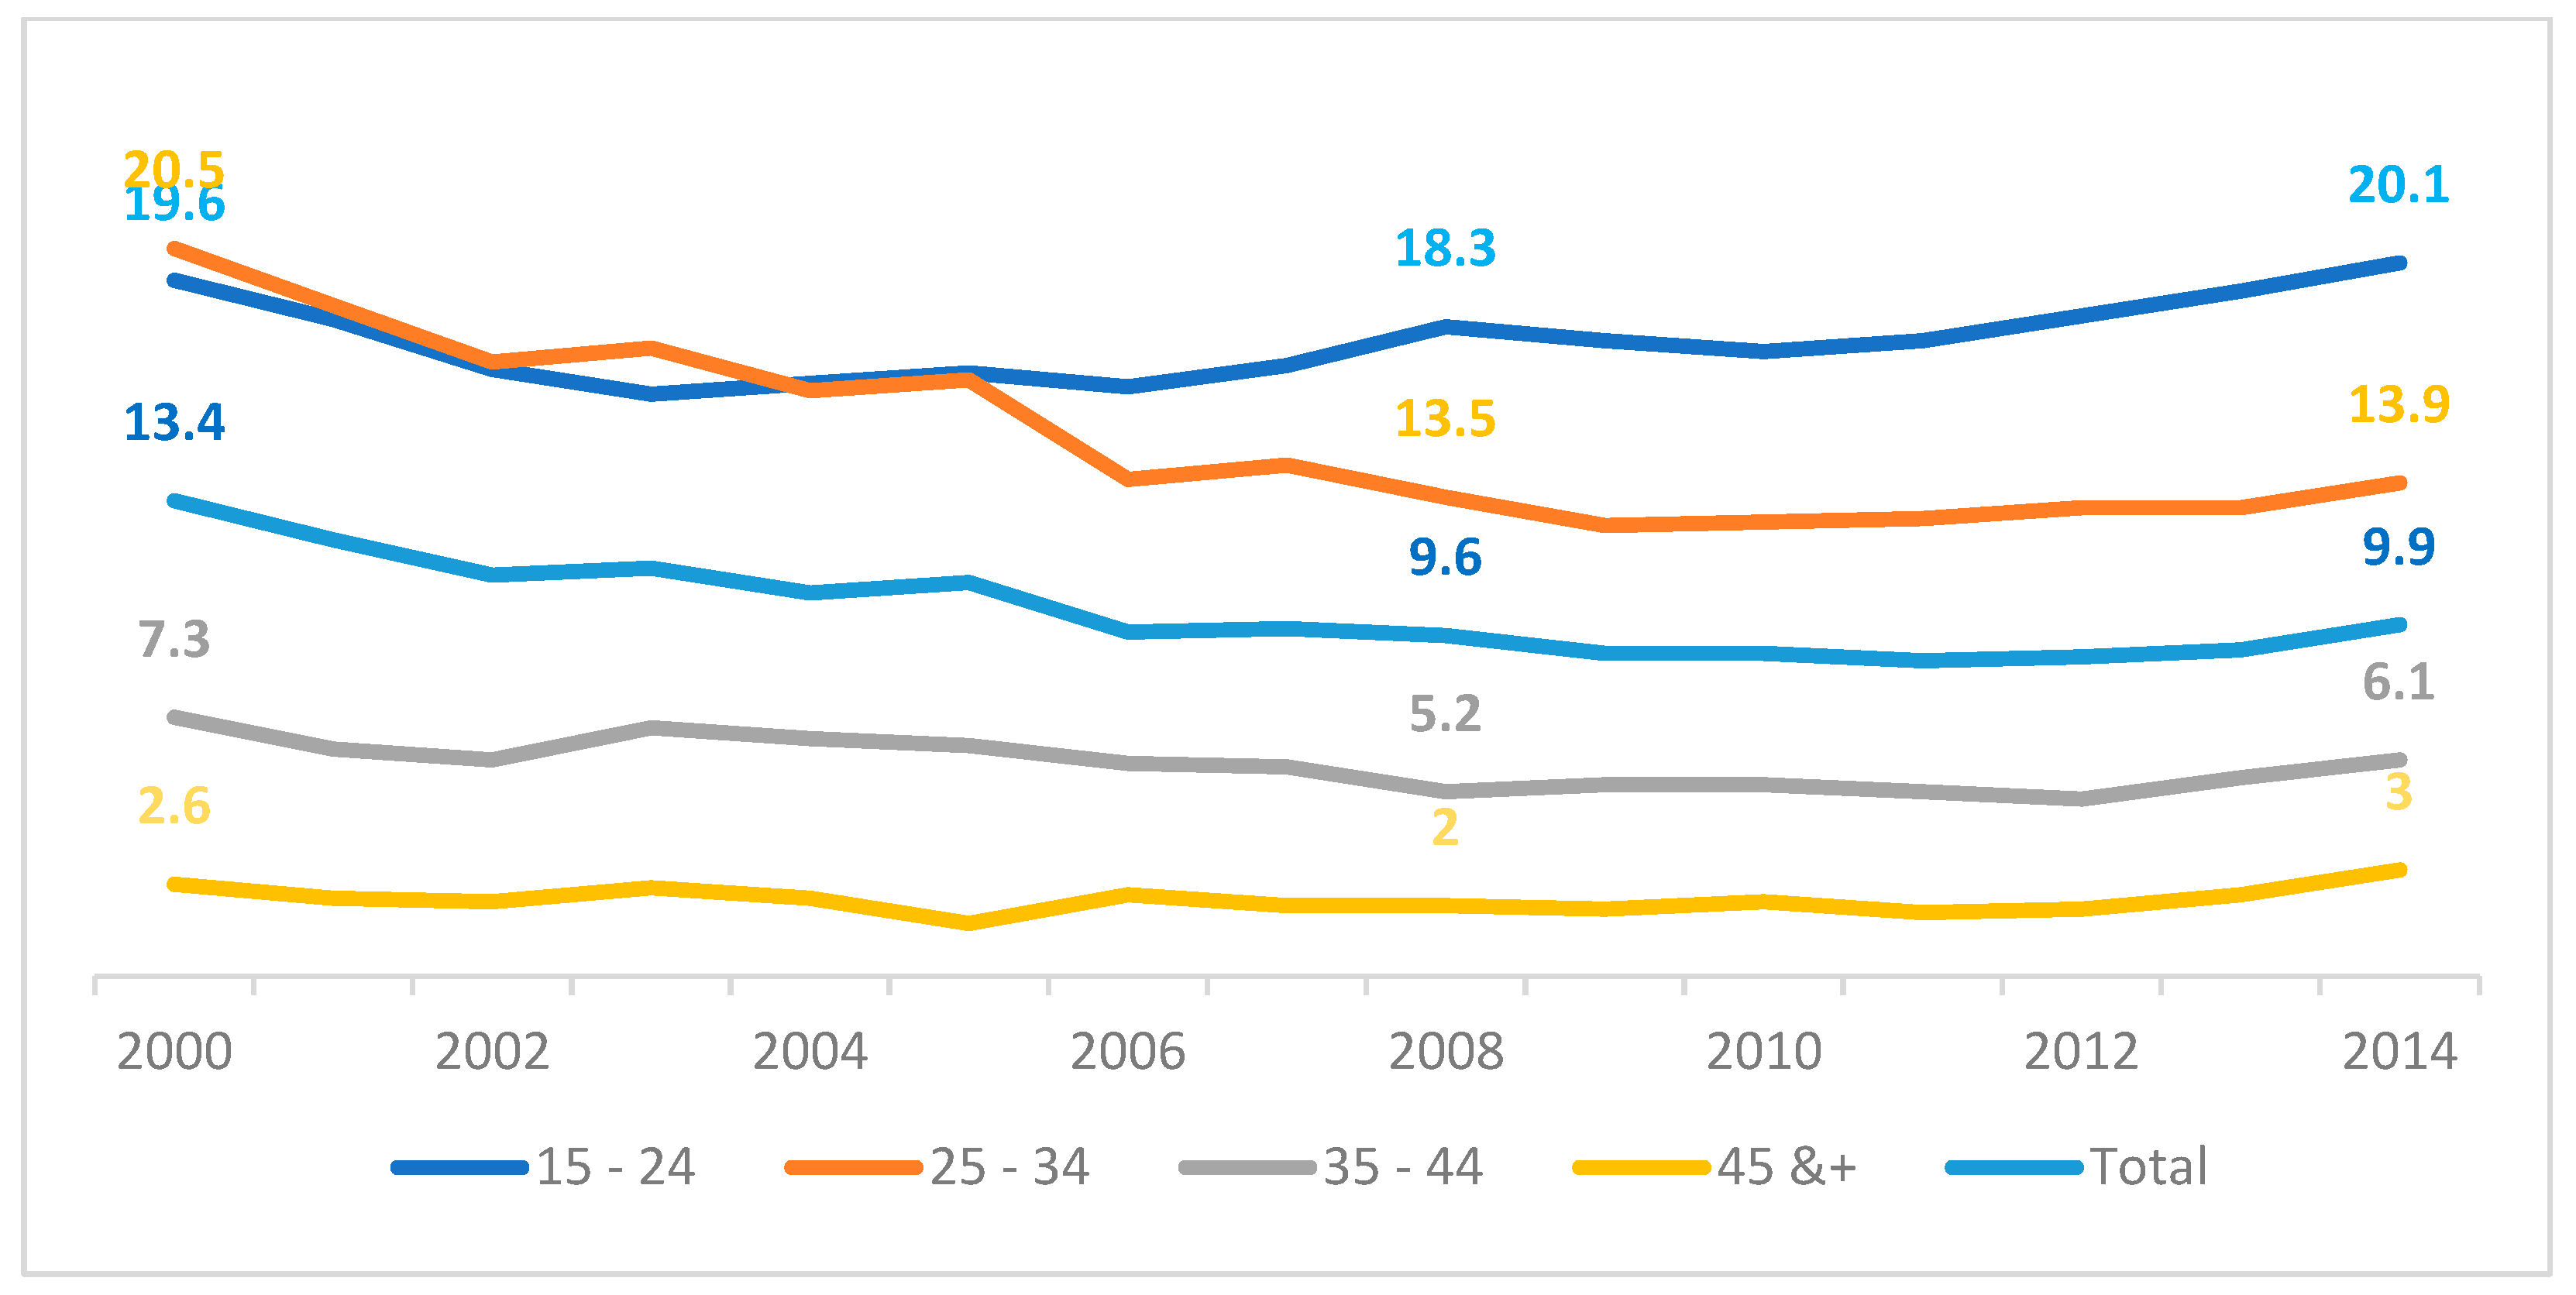
2.2.4. Young People More Exposed to Unemployment, Especially Highly Qualified Ones
3. Data and Methods
3.1. Data
3.2. Method
3.3. Dependent Variables
3.4. Independent Variables
3.5. Statistical Method
4. Results
4.1. Descriptive Statistics
4.2. Determinants of Monetary Relative Poverty
4.3. Determinants of Poverty Measured by WI
5. Discussion
6. Conclusions and Recommendations
Author Contributions
Funding
Institutional Review Board Statement
Informed Consent Statement
Data Availability Statement
Conflicts of Interest
Appendix A

| Area of Residence | Gender | Total | |||
|---|---|---|---|---|---|
| Male | Female | ||||
| Urban | Marital status | Single | 97.1 | 74.1 | 85.5 |
| Married | 2.8 | 24.9 | 14.0 | ||
| Divorced | 0.1 | 0.9 | 0.5 | ||
| Widowed | 0.0 | 0.1 | 0.1 | ||
| Total | 100.0 | 100.0 | 100.0 | ||
| Rural | Marital status | Single | 94.7 | 63.1 | 79.1 |
| Married | 5.2 | 35.7 | 20.3 | ||
| Divorced | 0.0 | 1.0 | 0.5 | ||
| Widowed | 0.0 | 0.2 | 0.1 | ||
| Total | 100.0 | 100.0 | 100.0 | ||
| Total | Marital status | Single | 96.1 | 69.7 | 82.9 |
| Married | 3.8 | 29.2 | 16.6 | ||
| Divorced | 0.1 | 0.9 | 0.5 | ||
| Widowed | 0.0 | 0.1 | 0.1 | ||
| Total | 100.0 | 100.0 | 100.0 | ||
References
- Braziene, R.; Merkys, G. Determinants of Youth and Young Adults Work Satisfaction in Lithuania. Soc. Sci. 2012, 78, 47–53. [Google Scholar] [CrossRef]
- Moore, K. Thinking about Youth Poverty through the Lenses of Chronic Poverty, Life-Course Poverty and Intergenerational Poverty; SSRN Scholarly Paper; Chronic Poverty Research Centre: Rochester, NY, USA, 2005. [Google Scholar] [CrossRef]
- Galland, O. Adolescence, post-adolescence, jeunesse: Retour sur quelques interprétations. Rev. Française Sociol. 2001, 42, 611. [Google Scholar] [CrossRef]
- Serajuddin, U.; Verme, P. Who Is Deprived? Who Feels Deprived? Labor Deprivation, Youth and Gender in Morocco; Policy Research Working Paper Series 6090; The World Bank: Washington, DC, USA, 2012; Available online: https://ideas.repec.org/p/wbk/wbrwps/6090.html (accessed on 20 July 2022).
- World Bank. Kingdom of Morocco: Promoting Youth Opportunities and Participation; World Bank: Washington, DC, USA, 2012; Available online: https://openknowledge.worldbank.org/handle/10986/11909 (accessed on 20 July 2022).
- Hull, K. Understanding the relationship between economic growth, employment and poverty reduction. In Promoting Pro-Poor Growth: Employment; OECD: Paris, France, 2009; Available online: https://citeseerx.ist.psu.edu/viewdoc/download?doi=10.1.1.452.6&rep=rep1&type=pdf (accessed on 17 September 2022).
- Coenjaerts, C.; Ernst, C.; Fortuny, M.; Rei, D. Youth Employment—Promoting Pro-Poor Growth. 2009. Available online: https://www.oecd.org/greengrowth/green-development (accessed on 20 July 2022).
- Filmer, D.; Fox, L. Youth Employment in Sub-Saharan Africa; World Bank: Washington, DC, USA, 2014; Available online: https://openknowledge.worldbank.org/handle/10986/16608 (accessed on 4 September 2022).
- Mihai, M.; Ţiţan, E.; Manea, D. Education and Poverty. Procedia Econ. Finance 2015, 32, 855–860. [Google Scholar] [CrossRef]
- Pavis, S.; Platt, S.; Hubbard, G. Social Exclusion and Young People in Rural Scotland. JRF. 2000. Available online: https://www.jrf.org.uk/report/social-exclusion-and-young-people-rural-scotland (accessed on 4 September 2022).
- Di Stasio, V.; van de Werfhorst, H. Why Does Education Matter to Employers in Different Institutional Contexts? A Vignette Study in England and the Netherlands. Soc. Forces 2016, 95, 77–106. [Google Scholar] [CrossRef]
- Di Stasio, V.; Bol, T.; van de Werfhorst, H. What makes education positional? Institutions, overeducation and the competition for jobs. Res. Soc. Strat. Mobil. 2016, 43, 53–63. [Google Scholar] [CrossRef]
- Sakamoto, A.; Powers, D.A. Education and the Dual Labor Market for Japanese Men. Am. Sociol. Rev. 1995, 60, 222. [Google Scholar] [CrossRef]
- Sparreboom, T.; Staneva, A. Is Education the Solution to Decent Work for Youth in Developing Economies? 2014. Available online: http://www.ilo.org/employment/areas/youth-employment/work-for-youth/publications/thematic-reports/WCMS_326260/lang--en/index.htm (accessed on 17 September 2022).
- Gordon, D. The Concept and Measurement of Poverty. In Poverty and Social Exclusion in Britain: The Millennium Survey; Pantazis, C., Gordon, D., Levitas, R., Eds.; Policy Press: Bristol, UK, 2006; pp. 29–63. [Google Scholar]
- Ravallion, M.; Chen, S. Welfare-Consistent Global Poverty Measures. 23739; NBER Working Papers; National Bureau of Economic Research, Inc.: Cambridge, MA, USA, 2017; Available online: https://ideas.repec.org/p/nbr/nberwo/23739.html (accessed on 4 September 2022).
- Gonner, C.; Cahyat, A.; Haug, M.; Limberg, G. Towards Wellbeing: Monitoring Poverty in Kutai Barat, Indonesia; Center for International Forestry Research (CIFOR): Bogor, Indonesia, 2007. [Google Scholar] [CrossRef]
- Roach, J.L.; Roach, J.K. Poverty; Selected Readings; Penguin Modern Sociology Readings; Penguin Books: Harmondsworth, UK, 1972. [Google Scholar]
- Ravallion, M. Issues in Measuring and Modelling Poverty. Econ. J. 1996, 106, 1328. [Google Scholar] [CrossRef]
- Hagenaars, A.; de Vos, K. The Definition and Measurement of Poverty. J. Hum. Resour. 1988, 23, 211–221. [Google Scholar] [CrossRef]
- Sen, A. Social Exclusion: Concept, Application, and Scrutiny. Asian Development Bank. 2000. Available online: https://www.adb.org/publications/social-exclusion-concept-application-and-scrutiny (accessed on 4 September 2022).
- Ravallion, M. Poor, or Just Feeling Poor? On Using Subjective Data in Measuring Poverty; World Bank: Washington, DC, USA, 2012. [Google Scholar] [CrossRef]
- Förster, M.F.; D’Ercole, M.M. The OECD Approach to Measuring Income Distribution and Poverty. In Counting the Poor; Oxford University Press: Oxford, UK, 2012; pp. 27–58. [Google Scholar] [CrossRef]
- Ravallion, M. Poverty Lines across the World; SSRN Scholarly Paper; The World Bank Development Research Group Director’s Office: Rochester, NY, USA, 2010; Available online: https://papers.ssrn.com/abstract=1597057 (accessed on 4 September 2022).
- Sahn, D.E.; Stifel, D. Exploring Alternative Measures of Welfare in the Absence of Expenditure Data. Rev. Income Wealth 2003, 49, 463–489. [Google Scholar] [CrossRef]
- Alkire, S.; Foster, J. Counting and multidimensional poverty measurement. J. Public Econ. 2011, 95, 476–487. [Google Scholar] [CrossRef]
- Vyas, S.; Kumaranayake, L. Constructing socio-economic status indices: How to use principal components analysis. Health Policy Plan. 2006, 21, 459–468. [Google Scholar] [CrossRef] [PubMed]
- Filmer, D.; Pritchett, L.H. The Effect of Household Wealth on Educational Attainment: Evidence from 35 Countries. Popul. Dev. Rev. 1999, 25, 85–120. Available online: https://www.jstor.org/stable/172373 (accessed on 9 September 2022). [CrossRef]
- Filmer, D.; Pritchett, L.H. Estimating Wealth Effects Without Expenditure Data—Or Tears: An Application to Educational Enrollments in States of India. Demography 2001, 38, 115–132. [Google Scholar] [CrossRef]
- Howe, L.D.; Hargreaves, J.R.; Gabrysch, S.; A Huttly, S.R. Is the wealth index a proxy for consumption expenditure? A systematic review. J. Epidemiol. Community Health 2009, 63, 871–877. [Google Scholar] [CrossRef] [PubMed]
- Achia, T.N.; Wangombe, A.; Khadioli, N. A Logistic Regression Model to Identify Key Determinants of Poverty Using Demographic and Health Survey Data. 2010. Available online: http://erepository.uonbi.ac.ke/handle/11295/38629 (accessed on 20 July 2022).
- Montgomery, M.R.; Gragnolati, M.; Burke, K.A.; Paredes, E. Measuring living standards with proxy variables. Demography 2000, 37, 155–174. [Google Scholar] [CrossRef]
- Rutstein, S.; Johnson, K. The DHS Wealth Index; DHS Comparative Report 6; ORC Macro: Calverton, MD, USA, 2004. [Google Scholar] [CrossRef]
- McKenzie, D.J. Measuring Inequality with Asset Indicators. J. Popul. Econ. 2005, 18, 229–260. [Google Scholar] [CrossRef]
- Hjelm, L.; Handa, S.; de Hoop, J.; Palermo, T. Poverty and perceived stress: Evidence from two unconditional cash transfer programs in Zambia. Soc. Sci. Med. 2017, 177, 110–117. [Google Scholar] [CrossRef]
- Narayan, D.; Petesch, P. Moving out of Poverty: Volume 1. Cross-Disciplinary Perspectives on Mobility; World Bank: Washington, DC, USA, 2007. [Google Scholar] [CrossRef]
- Dewilde, C.; Raeymaeckers, P. The trade-off between home-ownership and pensions: Individual and institutional determinants of old-age poverty. Ageing Soc. 2008, 28, 805–830. [Google Scholar] [CrossRef]
- Iakōvou, M.; Berthoud, R. Young People’s Lives: A Map of Europe; University of Essex, Institute for Social and Economic Research: Colchester, UK, 2001. [Google Scholar]
- Bremer, J. Youth Unemployment and Poverty in Egypt. Poverty Public Policy 2018, 10, 295–316. [Google Scholar] [CrossRef]
- Hlasny, V.; AlAzzawi, S. Asset Inequality in the MENA: The Missing Dimension? Q. Rev. Econ. Financ. 2019, 73, 44–55. [Google Scholar] [CrossRef]
- Ozdamar, O.; Giovanis, E. Youth Multidimensional Poverty and Its Dynamics: Evidence from Selected Countries in the MENA Region. J. Poverty 2021, 25, 426–452. [Google Scholar] [CrossRef]
- OCDE. Renforcer L’autonomie et la Confiance des Jeunes au Maroc; Examens de l’OCDE sur la Gouvernance Publique; OECD: Washington, DC, USA, 2021. [Google Scholar] [CrossRef]
- Boudarbat, B.; Ajbilou, A. Youth Exclusion in Morocco: Context, Consequences, and Policies; SSRN Scholarly Paper; Rochester: New York, NY, USA, 2007. [Google Scholar] [CrossRef]
- Tabutin, D.; Schoumaker, B. The Demography of Sub-Saharan Africa from the 1950s to the 2000s. A Survey of Changes and a Statistical Assessment. Population 2004, 59, 457. [Google Scholar] [CrossRef]
- MYS. Stratégie Nationale Intégrée de La Jeunesse 2015–2030—Pour Une Jeunesse Citoyenne, Entreprenante, Heureuse et Épanouie. Diversity of Cultural Expressions. 2017. Available online: https://en.unesco.org/creativity/policy-monitoring-platform/strategie-nationale-integree-de (accessed on 20 April 2022).
- Urdal, H. The Devil in the Demographics: The Effect of Youth Bulges on Domestic Armed Conflict, 1950–2000. Text/HTML. World Bank. 2010. Available online: https://documents.worldbank.org/en/publication/documents-reports/documentdetail/794881468762939913/The-devil-in-the-demographics-the-effect-of-youth-bulges-on-domestic-armed-conflict-1950-2000 (accessed on 4 September 2022).
- Sommers, M. Governance, Security and Culture: Assessing Africa’s Youth Bulge. Int. J. Confl. Violence (IJCV) 2011, 5, 292–303. [Google Scholar] [CrossRef]
- Ozerim, M.G. Can the Youth Bulge Pose a Challenge for Turkey? A Comparative Analysis Based on MENA Region-Driven Factors. YOUNG 2019, 27, 414–434. [Google Scholar] [CrossRef]
- Barakat, B.; Urdal, H. Breaking the Waves? Does Education Mediate the Relationship between Youth Bulges and Political Violence? Policy Research Working Papers; The World Bank: Washington, DC, USA, 2009. [Google Scholar] [CrossRef]
- HCP. Pauvreté et Prospérité Partagée au Maroc du Troisième Millénaire, 2001–2014. HCP. 2021. Available online: https://www.hcp.ma (accessed on 9 April 2022).
- HCP; World Bank. Le Marché du Travail au Maroc: Défis et Opportunités. 2017. Available online: https://www.banquemondiale.org/fr/country/morocco/publication/labor-market-in-morocco-challenges-and-opportunities (accessed on 24 April 2022).
- Henze, V. On the Concept of Youth; Humboldt-Universität zu Berlin: Berlin, Germany, 2015. [Google Scholar]
- UNDESA. n.d. Definition of Youth. 50. Available online: https://www.un.org/esa/socdev/documents/youth/fact-sheets/youth-definition.pdf (accessed on 9 April 2022).
- Aassve, A.; Iacovou, M.; Mencarini, L. Youth poverty and transition to adulthood in Europe. Demogr. Res. 2006, 15, 21–50. [Google Scholar] [CrossRef]
- Sánchez, O.C.; Prats, M.M. Poverty among Children and Youth in Spain: The Role of Parents and Youth Employment Status. 46. Studies on the Spanish Economy. FEDEA. 1999. Available online: https://ideas.repec.org/p/fda/fdaeee/46.html (accessed on 9 April 2022).
- Albright, C.M.; Spillane, T.E.; Hughes, B.L.; Rouse, D.J. A Regression Model for Prediction of Cesarean-Associated Blood Transfusion. Am. J. Perinatol. 2019, 36, 879–885. [Google Scholar] [CrossRef] [PubMed]
- Kedir, A.M.; Sookram, S. Poverty and welfare of the poor in a high-income country: Evidence from trinidad and tobago. J. Int. Dev. 2013, 25, 520–535. [Google Scholar] [CrossRef]
- Hao, L.; Naiman, D.Q. Quantile Regression; SAGE Publications Inc.: New York, NY, USA, 2022; Available online: https://us.sagepub.com/en-us/nam/book/quantile-regression (accessed on 11 April 2022).
- Koenker, R.; Bassett, G. Regression Quantiles. Econometrica 1978, 46, 33. [Google Scholar] [CrossRef]
- Le Cook, B.; Manning, W.; Alegria, M. Measuring Disparities across the Distribution of Mental Health Care Expenditures. J. Ment. Health Policy Econ. 2013, 16, 3–12. [Google Scholar]
- Garza-Rodriguez, J.; Ayala-Diaz, G.; Coronado-Saucedo, G.; Garza-Garza, E.; Ovando-Martinez, O. Determinants of Poverty in Mexico: A Quantile Regression Analysis. Economies 2021, 9, 60. [Google Scholar] [CrossRef]
- De Silva, I. Micro-level determinants of poverty reduction in Sri Lanka: A multivariate approach. Int. J. Soc. Econ. 2008, 35, 140–158. [Google Scholar] [CrossRef]
- HCP. Famille Au Maroc: Les Réseaux de La Solidarité Familiale. Chapitre 2: Les Rapports Familiaux Modalités d’échange et Liens de Solidarité. Rabat: HCP. 2011. Available online: https://www.hcp.ma/downloads/Demographie-Famille-au-Maroc-les-reseaux-de-la-solidarite-familiale_t13086.html (accessed on 3 July 2022).
- Torres-Munguía, J.A.; Martínez-Zarzoso, I. What Determines Poverty in Mexico? A Quantile Regression Approach; IAI Discussion Papers, 246; Georg-August-Universität Göttingen: Göttingen, Germany; Ibero-America Institute for Economic Research (IAI): Göttingen, Germany, 2020; Available online: https://www.econstor.eu/handle/10419/217231 (accessed on 3 July 2022).
- Colclough, C. (Ed.) Education Outcomes and Poverty; Routledge: London, UK, 2013. [Google Scholar] [CrossRef]
- Ezzrari, A.; Ayache, K.; Nihou, A. Chapitre 4 La Dynamique de L’emploi des Jeunes au Maroc; OCP Policy Center: Rabat, Morocco, 2018; Available online: https://www.researchgate.net/publication/325120378_Chapitre_4_LA_DYNAMIQUE_DE_LEMPLOI_DES_JEUNES_AU_MAROC (accessed on 25 April 2022).
- da Silva, T.P. High and Persistent Skilled Unemployment in Morocco: Explaining It by Skills Mismatch; OCP Policy Center: Rabat, Morocco, 2017; 32p. [Google Scholar]
- Mincer, J.A. Schooling, Experience, and Earnings. NBER. 1974. Available online: https://www.nber.org/books-and-chapters/schooling-experience-and-earnings (accessed on 4 September 2022).
- Çelik, K.; Lüküslü, G.D. Unemployment as a chronic problem facing young people in Turkey. Res. Policy Turk. 2018, 3, 155–172. [Google Scholar] [CrossRef]
- Mínguez, A.M. The youth emancipation in Spain: A socio-demographic analysis. Int. J. Adolesc. Youth 2018, 23, 496–510. [Google Scholar] [CrossRef]
- Soudi, K. L’entraide Familiale au Maroc et Ses Impacts Sur La Pauvreté et L’inégalité. 2010. Available online: http://www.abhatoo.net.ma/maalama-textuelle/developpement-economique-et-social/developpement-social/societe/familles/l-entraide-familiale-au-maroc-et-ses-impacts-sur-la-pauvrete-et-l-inegalite (accessed on 4 September 2022).
- Van de Velde, C. Devenir Adulte. 2008. Available online: https://journals.openedition.org/lectures/2001 (accessed on 20 April 2022).
- ILO. Young People Not in Employment, Education or Training. 2019. Available online: http://www.ilo.org/emppolicy/projects/sida/18-19/WCMS_735164/lang--en/index.htm (accessed on 10 April 2022).
- Kabeer, N. Gender, development, and training: Raising awareness in the planning process. Dev. Pract. 1991, 1, 185–195. [Google Scholar] [CrossRef]
- Rowlands, J. Empowerment examined. Dev. Pract. 1995, 5, 101–107. [Google Scholar] [CrossRef]
- UN. World Youth Report 2020 on ‘Youth Social Entrepreneurship and the 2030 Agenda’|United Nations for Youth. 2020. Available online: https://www.un.org/development/desa/youth/publications/2020/01/wyr-2/ (accessed on 9 April 2022).
| Without Diploma | Medium Diploma | Higher Diploma | Total | |||||||||
|---|---|---|---|---|---|---|---|---|---|---|---|---|
| Male | Female | Total | Male | Female | Total | Male | Female | Total | Male | Female | Total | |
| Active | 88.4 | 23.8 | 50.5 | 48.6 | 13.3 | 33.5 | 46.1 | 35 | 40.2 | 59.4 | 14.4 | 35.1 |
| Inactive | 11.6 | 76.2 | 49.5 | 51.4 | 86.7 | 66.5 | 53.9 | 65 | 59.8 | 40.6 | 85.6 | 64.9 |
| Total | 100 | 100 | 100 | 100 | 100 | 100 | 100 | 100 | 100 | 100 | 100 | 100 |
| Active | ||||||||||||
| Unemployed | 10.1 | 5.8 | 8.9 | 23.2 | 28.5 | 24.1 | 40.1 | 51.3 | 45.3 | 18.4 | 20.9 | 19 |
| Permanent employee | 27.5 | 14.5 | 23.8 | 31.9 | 35.3 | 32.5 | 45.9 | 46.7 | 46.3 | 30.9 | 26.5 | 29.8 |
| Occasional employee | 10.2 | 1.4 | 7.7 | 7.4 | 1.1 | 6.3 | 1 | −0.3 | 0.4 | 8.2 | 1 | 6.3 |
| Self-employed | 15.8 | 6.5 | 13.2 | 15.1 | 5.5 | 13.4 | 9.3 | 1.6 | 5.7 | 15 | 5.3 | 12.5 |
| Unpaid | 36.4 | 71.8 | 46.4 | 22.4 | 29.6 | 23.7 | 3.7 | 0.7 | 2.3 | 27.5 | 46.3 | 32.4 |
| Total | 100 | 100 | 100 | 100 | 100 | 100 | 100 | 100 | 100 | 100 | 100 | 100 |
| Assets and Durable Goods | Household Utilities and Other | Housing Properties |
|---|---|---|
| - Has satellite dish - Has computer - Has television - Has Cooker - Has internet - Has refrigerator - Has mobile - Has Motorbike - Has car - Has telephone | - Water network - Electricity network - Kitchen - Toilet - Shower bath - Wastewater evacuation network - Water sources - Public network - Fountain - Well water | - House owner - Free house - House tenant - Hard housing - Hard floor - Room per person |
| Variable | Description | Code or Unit |
|---|---|---|
| Individual characteristics | ||
| Education level | The highest level attained by the individual | None = 1; Primary = 2; Lower secondary = 3; Upper secondary = 4; Higher = 5 |
| Employment status | The status of the individual in the activity, it provides information on whether the individual is active occupied or not | No = 0; Yes = 1 |
| Gender | Individual’s gender | Male = 1; Female = 2 |
| Age | Age groups calculated in completed years (five-year age group) | 15–19 = 1; 20–24 = 2; 25–29 = 3 |
| Characteristics of the household | ||
| Education rate | Rate of persons in the household, other than the individual, with secondary education | Continuous variable |
| Employment rate | Rate of persons in the household, other than the individual, in a state of activity | Continuous variable |
| Location region | Individual’s residence area | Urban = 1; Rural = 2 |
| Number of children | The number of children under the age of 15, who usually resides in the household | Discrete numerical variable |
| Household size | Number of the household members | Categorical variable (Less than 4 = 1; 4 = 2; 5 = 3; 6 or more = 4) |
| Marital status of the head | The marital status of the household head | Single = 1; Widowed = 2; Divorced = 3; Married = 4 |
| Location Region | Poverty Status | |||
|---|---|---|---|---|
| Non-Poor | Poor | |||
| Urban | Gender | Male | 90.1% | 9.9% |
| Female | 90.4% | 9.6% | ||
| Total | 90.3% | 9.7% | ||
| Rural | Gender | Male | 69.0% | 31.0% |
| Female | 67.2% | 32.8% | ||
| Total | 68.1% | 31.9% | ||
| Total | Gender | Male | 82.1% | 17.9% |
| Female | 81.3% | 18.7% | ||
| Total | 81.7% | 18.3% | ||
| WI Quintiles | ||||||
|---|---|---|---|---|---|---|
| 1 | 2 | 3 | 4 | 5 | ||
| Area | Urban | 2.9% | 9.0% | 25.7% | 35.0% | 27.5% |
| Rural | 46.9% | 36.5% | 11.1% | 3.7% | 1.8% | |
| Gender | Male | 21.6% | 20.6% | 19.7% | 21.8% | 16.3% |
| Female | 11.5% | 14.7% | 21.5% | 28.4% | 24.0% | |
| Total | 20.2% | 19.8% | 19.9% | 22.7% | 17.4% | |
| WI | Household Size | Per Capita Expenditure | Employment Rate | Education Rate | |
|---|---|---|---|---|---|
| WI quantiles | |||||
| Q1 | 7490.61 | 6.59 | 9383.37 | 0.30 | 0.05 |
| Q2 | 22,907.47 | 6.26 | 13,485.70 | 0.30 | 0.12 |
| Q3 | 37,992.05 | 5.30 | 21,844.04 | 0.28 | 0.31 |
| Q4 | 53,911.30 | 5.39 | 16,878.92 | 0.27 | 0.26 |
| Q5 | 68,808.80 | 5.34 | 15,854.05 | 0.28 | 0.27 |
| Poverty status | |||||
| Non-poor | 40,362.60 | 4.61 | 17,833.53 | 0.28 | 0.23 |
| Poor | 26,110.96 | 5.91 | 5218.98 | 0.30 | 0.07 |
| Total | 37,748.90 | 3.14 | 15,520.06 | 0.28 | 0.20 |
| Explanatory Variables | Estimate of Parameter | p-Value | Odds Ratio |
|---|---|---|---|
| Individual characteristics | |||
| Education level (base category: higher) | |||
| None | 0.710 | (0.000) *** | 2.034 |
| Primary | 0.401 | (0.003) *** | 1.494 |
| lower secondary | 0.160 | (0.225) | 1.174 |
| Upper secondary | 0.313 | (0.012) ** | 1.367 |
| Employment status (base category: Yes) | −0.031 | (0.469) | 0.970 |
| Gender (base category: Female) | −0.026 | (0.545) | 0.974 |
| Age (base category: 25–29) | |||
| 15–19 | 0.061 | (0.095) * | 1.063 |
| 20–24 | −0.003 | (0.949) | 0.997 |
| Characteristics of the household | |||
| Education rate | −2.894 | (0.000 *** | 0.055 |
| Employment rate | −0.118 | (0.043) ** | 0.889 |
| Location region (base category: Rural) | −0.726 | (0.000) *** | 0.484 |
| Number of children | 0.338 | (0.000) *** | 1.402 |
| Household size (base category: 6 or more) | |||
| Less than 4 | −2.010 | (0.000) *** | 0.134 |
| 4 | −1.130 | (0.000) *** | 0.323 |
| 5 | −0.813 | (0.000) *** | 0.443 |
| Marital status of the head (base category: Married) | |||
| Single | 0.354 | (0.000) *** | 1.425 |
| Widowed | 0.488 | (0.344) | 1.629 |
| Divorced | 0.447 | (0.020) ** | 1.563 |
| Fit measures | |||
| χ2 | 6483.165 (0.000) *** | ||
| Nagelkerke R Square | 0.266 | ||
| Log-likelihood | 15,249.105 | ||
| Observations | 19,695 | ||
| Factors | Mean WI | F-Value |
|---|---|---|
| WI (base category: Q5) | 68,808 | 120,591.607 (0.000) *** |
| Q1 | 7490 | |
| Q2 | 22,907 | |
| Q3 | 37,992 | |
| Q4 | 53,911 | |
| Education level (base category: higher) | 46,032 | 649.571 (0.000) *** |
| None | 25,606 | |
| Primary | 30,803 | |
| lower secondary | 40,367 | |
| Upper secondary | 45,246 | |
| Employment status (base category: No) | 38,189 | 6.002 (0.014) ** |
| Yes | 37,362 | |
| Gender (base category: Female) | 37,664 | 0.319 (0.572) |
| Male | 37,839 | |
| Age (base category: 25–29) | 38,005 | 4.310 (0.013) ** |
| 15–19 | 37,144 | |
| 20–24 | 38,156 | |
| Location region (base category: Rural) | 18,718 | 18,488.929 (0.000) *** |
| Urban | 49,804 | |
| Household size (base category: 6 or more) | 34,949 | 132.185 (0.000) *** |
| Less than 4 | 42,309 | |
| 4 | 39,869 | |
| 5 | 40,919 | |
| Marital status of the head (base category: Married) | 33,580 | 72.197 (0.000) *** |
| Single | 38,895 | |
| Widowed | 33,625 | |
| Divorced | 42,888 |
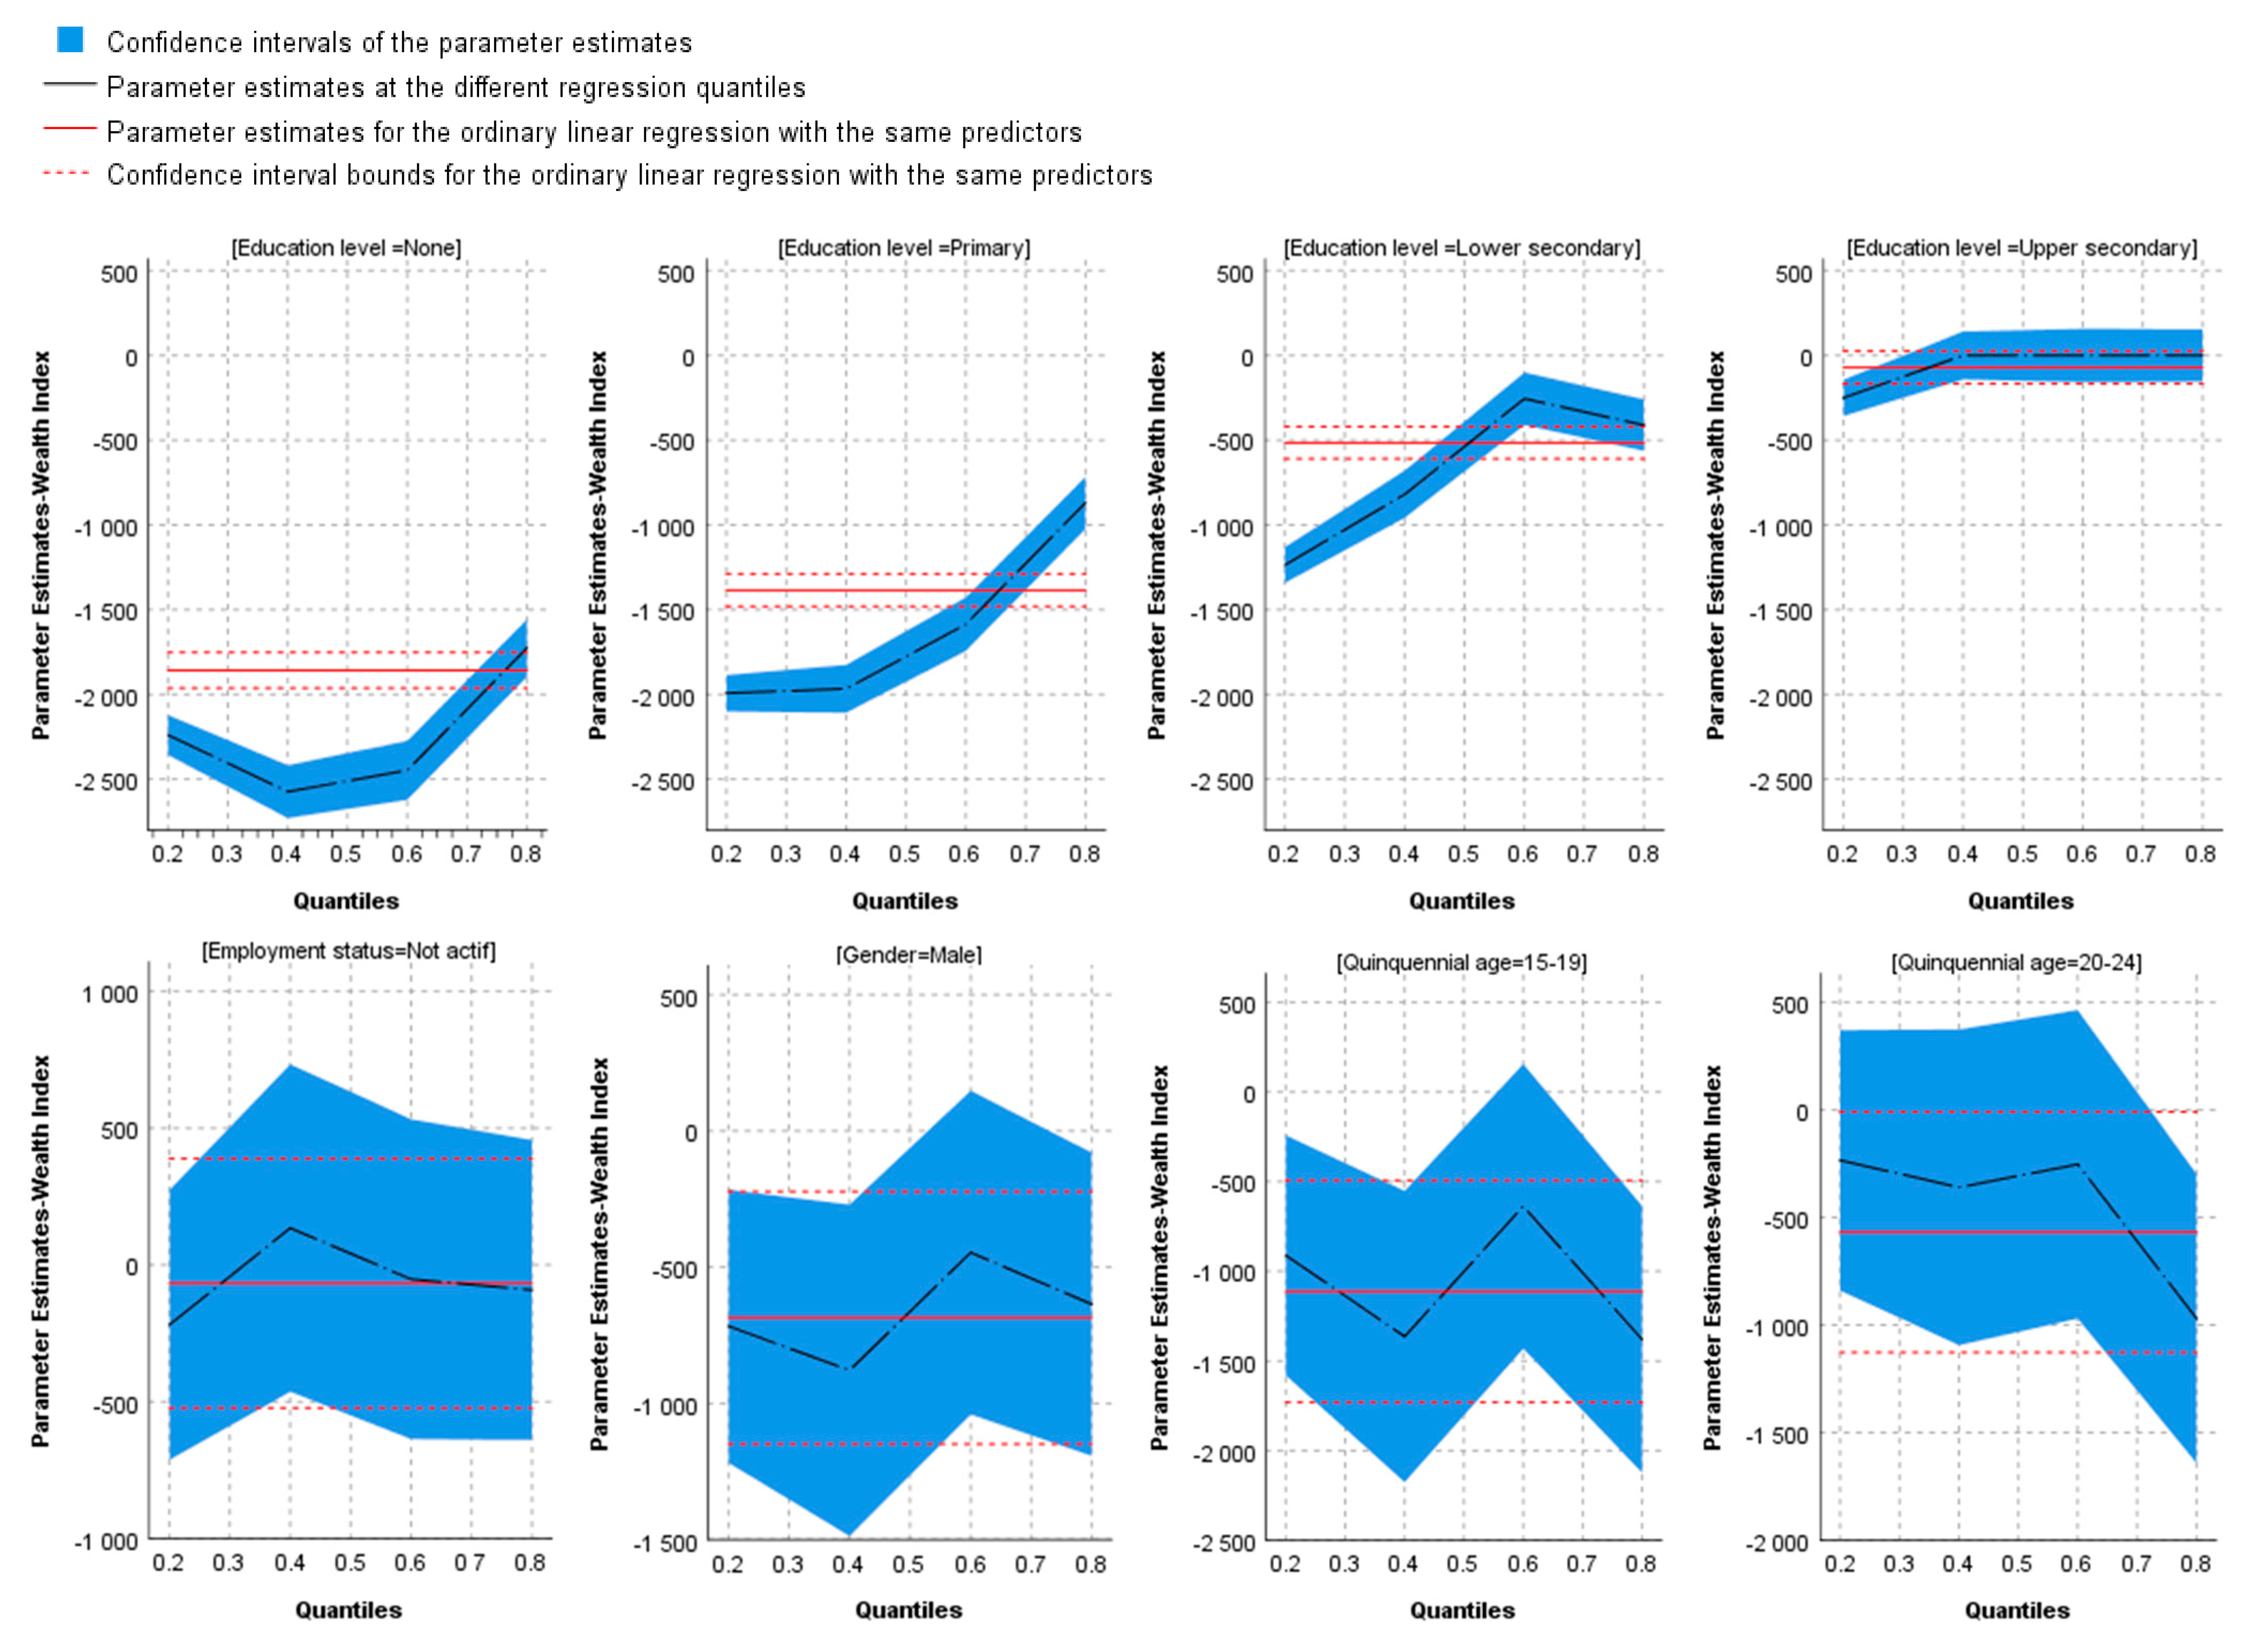
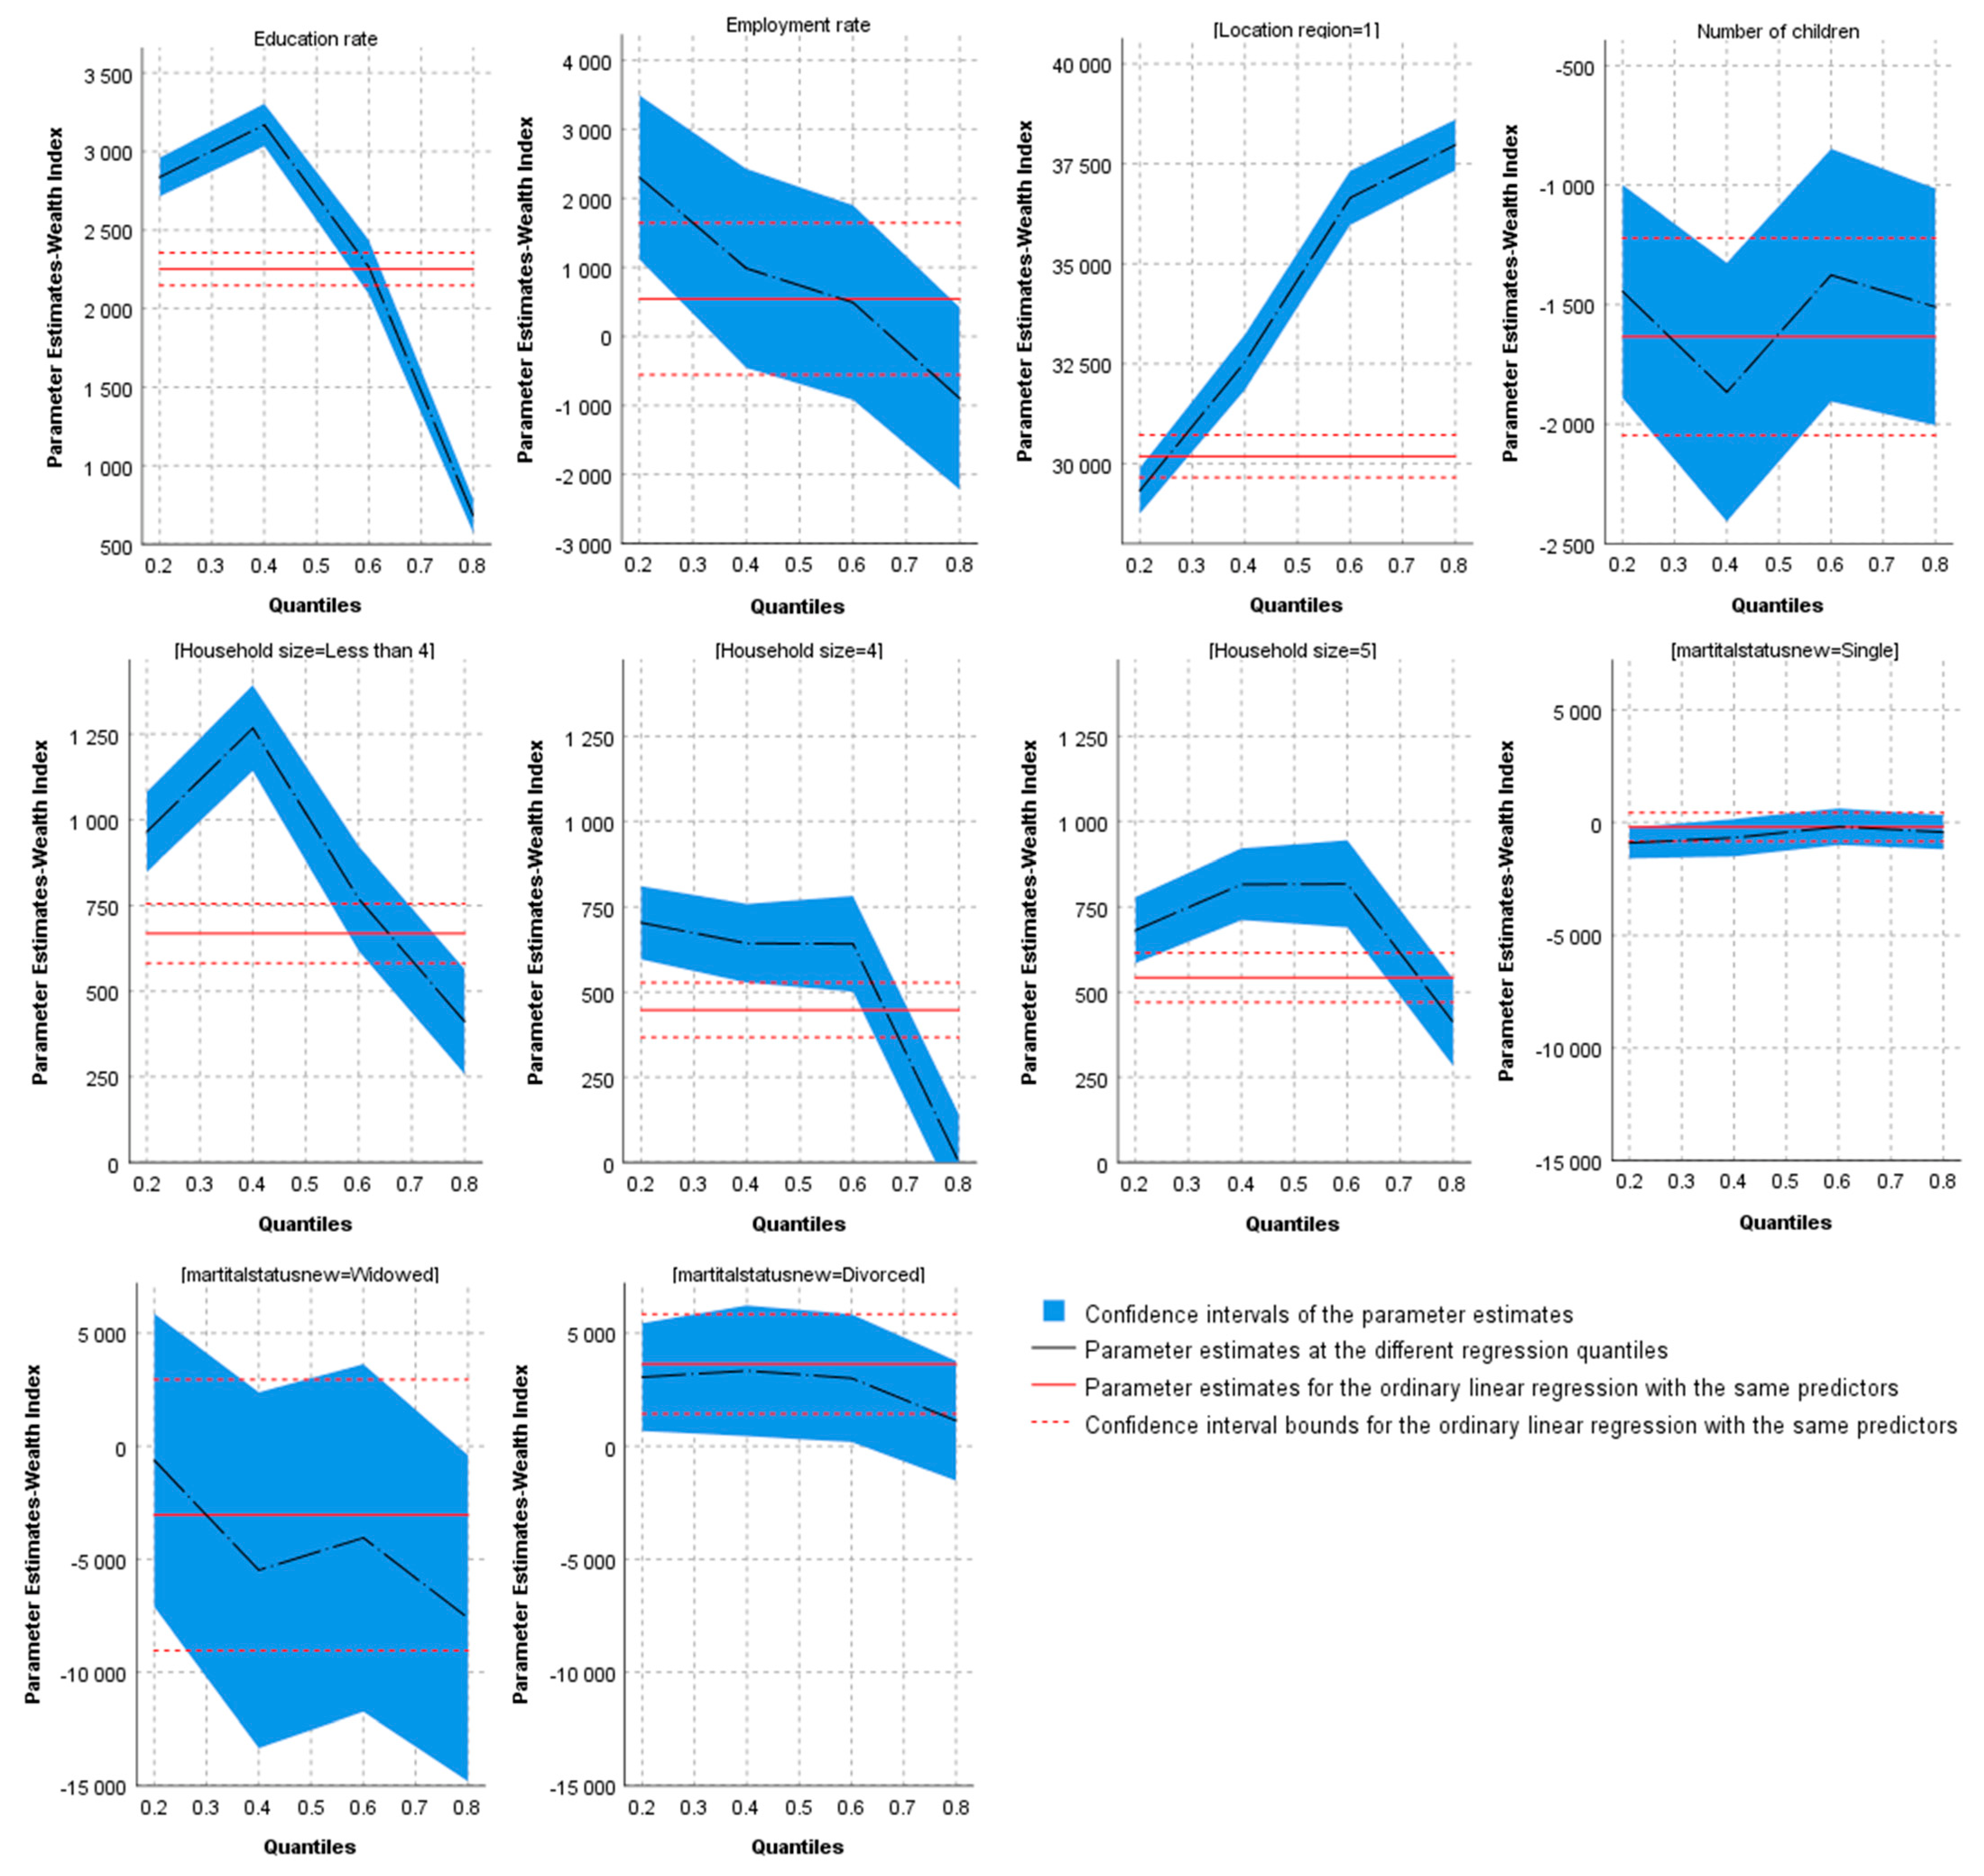
| q = 0.2 | q = 0.4 | q = 0.6 | q = 0.8 | |||||
|---|---|---|---|---|---|---|---|---|
| BETA | Sig. | BETA | Sig. | BETA | Sig. | BETA | Sig. | |
| Individual characteristics | ||||||||
| Education level (base category: higher) | ||||||||
| None | −2238.7 | 0.000 | −2573.1 | 0.000 | −2447.0 | 0.000 | −1725.2 | 0.000 |
| Primary | −1992.6 | 0.000 | −1966.0 | 0.000 | −1585.5 | 0.000 | −869.0 | 0.001 |
| lower secondary | −1236.5 | 0.000 | −818.9 | 0.000 | −255.5 | 0.001 | −411.0 | 0.000 |
| Upper secondary | −250.5 | 0.000 | 0.0 | 0.000 | 0.0 | 0.000 | 0.0 | 0.000 |
| Employment status (base category: Yes) | −187.5 | 0.468 | 189.8 | 0.554 | 97.0 | 0.755 | 71.4 | 0.806 |
| Gender (base category: Female) | −835.2 | 0.002 | −997.2 | 0.003 | −406.4 | 0.209 | −560.3 | 0.063 |
| Age (base category: 25–29) | ||||||||
| 15–19 | −747.2 | 0.038 | −1199.4 | 0.007 | −443.3 | 0.006 | −1181.6 | 0.003 |
| 20–24 | −189.4 | 0.560 | −216.9 | 0.590 | −45.0 | 0.908 | −749.8 | 0.040 |
| Characteristics of the household | ||||||||
| Education rate | 2837.0 | 0.000 | 3169.0 | 0.000 | 2263.4 | 0.000 | 677.0 | 0.000 |
| Employment rate | 2452.0 | 0.000 | 790.6 | 0.317 | 301.9 | 0.694 | −840.4 | 0.240 |
| Location region (base category: Rural) | 29,398.5 | 0.000 | 32,894.0 | 0.000 | 36,637.3 | 0.000 | 37,891.3 | 0.000 |
| Number of children | −1560.5 | 0.000 | −2132.4 | 0.000 | −1354.3 | 0.000 | −1587.5 | 0.000 |
| Household size (base category: 6 or more) | ||||||||
| Less than 4 | 964.6 | 0.000 | 1267.0 | 0.000 | 769.9 | 0.000 | 411.0 | 0.000 |
| 4 | 703.6 | 0.000 | 643.2 | 0.000 | 641.8 | 0.000 | 0.0 | 0.872 |
| 5 | 681.5 | 0.007 | 816.0 | 0.001 | 817.2 | 0.000 | 411.0 | 0.000 |
| Marital status of the head (base category: Married) | ||||||||
| Single | −915.1 | 0.009 | −679.5 | 0.112 | −191.3 | 0.647 | −433.7 | 0.267 |
| Widowed | −621.8 | 0.851 | −5475.6 | 0.173 | −4054.4 | 0.301 | −7600.3 | 0.039 |
| Divorced | 3058.6 | 0.012 | 3337.7 | 0.024 | 3010.7 | 0.037 | 1126.1 | 0.406 |
Publisher’s Note: MDPI stays neutral with regard to jurisdictional claims in published maps and institutional affiliations. |
© 2022 by the authors. Licensee MDPI, Basel, Switzerland. This article is an open access article distributed under the terms and conditions of the Creative Commons Attribution (CC BY) license (https://creativecommons.org/licenses/by/4.0/).
Share and Cite
Yassine, A.; Bakass, F. Do Education and Employment Play a Role in Youth’s Poverty Alleviation? Evidence from Morocco. Sustainability 2022, 14, 11750. https://doi.org/10.3390/su141811750
Yassine A, Bakass F. Do Education and Employment Play a Role in Youth’s Poverty Alleviation? Evidence from Morocco. Sustainability. 2022; 14(18):11750. https://doi.org/10.3390/su141811750
Chicago/Turabian StyleYassine, Abderrahman, and Fatima Bakass. 2022. "Do Education and Employment Play a Role in Youth’s Poverty Alleviation? Evidence from Morocco" Sustainability 14, no. 18: 11750. https://doi.org/10.3390/su141811750