1. Introduction
With the development of industrialization, the over-consumption of natural resources, and the continuous degradation of the environment worldwide, society has entered a critical bottleneck period for sustainable development. How industries develop to adapt to global environmental changes and mitigate the contradiction between economic growth and resource consumption is a challenge for the whole world. In 1987, the World Commission on Environment and Development (WECD) published
Our Common Future. Since then, the international community began to focus on sustainable development, and in 1992, the United Nations Environmental Planning Board (UNEP) presented
Agenda 21 of the Rio de Janeiro Declaration on Environment and Development, with 120 sustainable development indices to assess economic development, social investment, environmental quality, ecological protection, and climate change performance [
1]. The main part of sustainable development theory is industrial sustainability, where people try to seek sustainable economic progress through a more scientific approach.
Agriculture is one of the most important industries worldwide. Agricultural production, while securing the basic food supply, also brings climate change, water pollution, and biodiversity loss, so sustainable development of agriculture is an essential part to ensure global food security. For this reason, research on sustainability assessment of agriculture-related industries has gradually become a global research hotspot, with expanding research contents, wider application fields, and more comprehensive disciplines. Among the relevant studies, the Food and Agriculture Organization of the United Nations (FAO) has constructed 17 Sustainable Development Goals (SDGs) for global agricultural sustainable development based on the “pressure-state-response” framework. The Organization for Economic Co-operation and Development (OECD) developed Agri-environmental Indicators focusing on the production of quality agricultural products and the environmental protection of agricultural resources. A large body of scientific literature has developed indicator systems and scientific theoretical frameworks to assess various aspects of sustainability from different perspectives, based on different objectives, and applied to specific cases in agriculture. However, despite the massive scientific output in this field, sustainable agricultural development assessment (SADA) remains a vague term in empirical research, and no consensus has been reached on a common analytic framework that would meet the needs of both policymakers and researchers in this field.
Econometric analysis of literature information such as keywords, authors, journals, years, and citations can quantitatively reveal an academic field’s development history, research priorities, and future research directions. To critique and diagnose the current state of research, this study aims to critically and comprehensively review the research on sustainable agricultural development from 2002 to 2022, using a sample of 110 representative results in this field, and to systematically sort out the connotations and extensions of research in this field from the literature. The analysis results can help researchers and practitioners understand the current status of research, provide scientific reference and guide objectives for constructing future sustainable development evaluation indicators, and provide a scientific judgment basis for condensing future research objectives in this field.
The remainder of this paper is structured as follows.
Section 2 explains the data collection procedure carried out using the Preferred Reporting Items for Systematic Reviews and Meta-Analyses (PRISMA) guidelines, and describes the research methodology used to review publications.
Section 3 discusses the specific results of the publication trends in the discipline, including the most productive authors, journals, institutions, and research hotspots.
Section 4 is an analysis of evaluation indicators and assessment methods.
Section 5 summarizes the findings and provides recommendations for future directions.
2. Data Collection and Methodology
2.1. Data Collection—PRISMA
The PRISMA method is an extended framework from the Quality of Reporting of Meta-Analyses (QUOROM) inventory that helps researchers efficiently extract data for review studies [
2], this study applied the PRISMA method to identify suitable publications for inclusion in the bibliometric analysis (
Figure 1). The PRISMA methodology is divided into four stages to ensure credible data: identification, screening, eligibility, and inclusion.
The articles were obtained from the Web of Science (WOS) database of the Institute for Scientific Information (ISI) by selecting the article title, abstract, and keywords. The initial search utilized the key terms: “evaluation of agricultural sustainability,” “assessment of agricultural sustainability,” “sustainability indicators for agricultural,” and so on. The document type is an article, excluding book chapters, reports, working papers, and duplicate data, followed by an initial data generation of 445 records. We kept the search strategy broad, so as to include articles relevant to “agriculture” and its synonyms, or research related to “aquaculture,” and “crop production,” so 11 records from other sources were added. Then remove some articles that are not related to SADA, such as industrial and construction sustainability assessment, pure system assessment evaluating of agriculture systems, the impact on rural sustainability study, etc. All articles were based on the title and abstract that were manually screened, 289 articles were removed in the screening phase, leaving 167 articles on sustainability assessment or indicator construction in the agricultural sector to move to the next phase. In the eligibility phase, the selection criteria were: articles that included non-benchmark analyses, descriptive analyses, or literature surveys, as well as non-English articles, which met the above criteria were excluded. In addition, some articles from the reference list of other selected articles have been added. Finally, a total of 110 articles were collected.
2.2. Methodology
The data were collected from WOS in PDF format on 5 May 2022, summarizing information from articles, using bibliometric analysis methods and content analysis, combined with CiteSpace, a visual analysis software developed by Dr. Chen, and Ucinet, the most popular social network analysis software, to perform content analyses to identify core contributions and significant impacts in research in the field, and to uncover research hotspots.
When allocating rights and benefits to scientific results, the counting method is the starting point and basis, directly affecting the researcher’s contribution to scientific assessment. The main counting methods currently in use are full counts, fractional counts, proportional counts, pure geometric counts, harmonic counts, correct credit distribution scores, exponential weighting, and so on [
3]. There is no definitive answer as to which of the counting methods should be used for bibliometric studies, In order to provide a “fair” weight in the contribution and citation of a publication, this study chose the fractional counting method to determine the level of producing institutions. The credit allocation function (denoted as CA) is as follows:
where u refers to the counting unit (author or institution), and here it is assumed that u is an institution, then u
j refers to institution j, CAu
j is the reputation score of institution j, n refers to the number of institutions, and j refers to the institution serial number, j = (1, 2, …n).
CiteSpace is a citation network visualization tool that can draw co-citation maps, dynamically identify co-citation clusters, and represent the strength of relationships among topics with tree diagrams and connecting lines, etc. In the section on sustainability assessment literature research, we mainly used CiteSpace software, and social network analysis, supplemented with the NoteExpress literature management system, to statistically present information on basic characteristics and indicator construction of the sample literature, and presented them in graphs. In order to deeply understand the development of the discipline and make up for the shortage of literature information statistics in detailed content mining, some typical literature was selected from the search results for in-depth reading. In the part of literature content research, sample statistics and cluster analysis are mainly used to systematically sort out the current research status of sustainable agricultural development evaluation indicators and evaluation methods.
3. Performance and Net Analyses
Analyzing bibliometric data helps us understand research trends and hot topics, we conducted through the contribution of publications and total citations, performed a comprehensive bibliometric analysis of the literature on SADA studies from 2002 to 2022, including elements such as the number of annual publications, authors, institutions, countries, journals, cited articles, and cited journals of publications.
3.1. General Publication Trend
Therefore, as sustainable development has been elevated to a national strategy and transformed from a theoretical level of discussion to a practical level of implementation, addressing how to achieve sustainable development has become an immediate need for the government and a hot spot for academics, and the number of articles published on SADA has been increasing year by year with the implementation and promotion of sustainable development strategies. The time of publication reflects the evolution, development status, and trend of the research field. In the early stage of research in a certain field, due to the lack of relevant theories and foundations, the number of relevant papers published is low; as the research progresses, the number of scholars and institutions entering the field increases, and the number of publications grows faster; after the research matures, the number of publications tends to be stable.
As can be seen from
Figure 2, the annual growth rate of publications was 28.39%. The number of publications fluctuated slightly until 2013, with a total of 25 articles published, the main research objectives focused on the sustainability assessment of agricultural systems [
4,
5,
6,
7] and exploration of evaluation methods [
8,
9,
10,
11]. Since 2014, sustainability assessment research has received increasing attention and papers have been published at an accelerated rate, making it a current research hotspot. 57 articles were published between 2014 and 2019 with the common goals of constructing evaluation model frameworks, innovating evaluation methods, and assessing sustainability progress. During this period, multiple new methods were applied, Lazard et al. (2014) assessed aquaculture sustainability using a comparative methodology [
12], Wang et al. (2015) constructed a fuzzy control-based evaluation model [
13], and Ryan et al. (2016) developed farm-level sustainability indicators [
14]. The highest number of publications was 2019, accounting for 16.36% of the total number of papers, with 18 articles on several countries and regions such as India [
15], Ireland [
16], Poland [
17], Iran [
18], Spain [
19], Brazil [
20], and China [
21,
22], reflecting the importance that academia places on regional agricultural sustainability assessment. After 2020, the research entered a specialized and independent discipline, the volume of literature became more stable and fruitful, as the field of SADA has matured, more emphasis has been placed on understanding sustainability, and some alternative terms for “sustainable development” emerged during this period, such as “high-quality development,” [
23] “green development,” [
24,
25] and so on.
3.2. Most Productive Authors
According to the distribution rule of literature information authors, in a mature research field, the authors who published one paper account for about 60% of all authors in the field, and the authors who published n papers are about 1/n2 of the number of authors who published one paper. The total number of signed authors in the sample literature is 402, among which the authors who published one paper account for 89.6%, so the research in the field of SADA is still immature. Core authors are the main drivers of academic progress and scientific development in a field. The study found that the most prolific was de Olde, who published three articles as the first author, receiving 184 citations.
Social network analysis (SNA) visualizes the relationships and states of different things by examining the connections between them with the help of node-to-node connections, distances, and node sizes.
Figure 3 shows the collaborative network of all authors in the field from 2002 to 2022, with each node representing an author, and the node size corresponds to the degree of articles published by the author, the thickness of the connection line between two nodes is defined as the density of cooperation between two authors.
As
Figure 3 shows, the line between [de Olde, Sorensen, and others] is the thickest, with the largest number of papers and publications focusing on assessing sustainability at the farm level, including Indicator selection and sustainability performance. Followed by [Bockstaller, Messean, and others] with 3 publications, whose publications focus on the assessment framework [
26,
27,
28]. [Liu, Jhan, and Lin] [
9,
29], [Astier, Masera, and others] [
30,
31], [Boshrabadi and Mehrjerdi] [
32,
33], and [Ul Haq and Boz] [
34,
35] are studies based on different regions, aquaculture in Taiwan, China, case studies in Latin America and Iran, and farm studies in Rize province, respectively. The multiple collaborations between the authors reflected the fact that although the scope of their studies differs, they all showed an interest in this field.
3.3. Most Influential Institutions
Agricultural sustainability has been described in many ways by different institutions, in order to identify the main research institutions and to promote inter-institutional collaboration, we collected institutional information from authors in the literature to obtain the top 10 most influential institutions in the research field for the period 2002–2022 (
Table 1).
A total of 214 institutions in the statistical sample contributed to this research area, and
Table 1 shows the 10 most influential of them, accounting for 12.85% of the total. The largest contributor of articles was the Institut National de la Recherche Agronomique (INRA), established in 1946, with 1.91 publications. INRA was the largest national agricultural research institute in France, and a total of eight authors in the sample articles were involved in research in this area, making it the most important contributor to the sustainability assessment publications. China Agricultural University was the second largest contributor to the fractional counting method, with 1.71 publications. However, there were only three articles from China Agricultural University, and the larger TP
F value was due to the fact that the authors of the three articles were independent or had few collaborators.
Degree refers to the number of other nodes directly connected to a node, the more times a node acts as an “intermediary”, the greater its intermediation centrality. The top-ranked item by degree was INRA, with a degree of 31; the second was the University of Lorraine, with a degree of 20; the third was the Research Institute of Organic Agriculture, with a degree of 19, these three institutions had a high centrality in the cooperative network. The cooperative relationship between authors forms the cooperative relationship between institutions. From the perspective of scholars who are currently cooperating, the cooperation between research units was not sufficient, and most of the institutions that do cooperate were limited to proximity to the region, enjoy geographical convenience, and were less internationally cooperative.
3.4. Most Influential Journals
The journals of sustainable assessment are characterized by a wide distribution of sources, relative dispersion, and diverse categories, which hinder scholars from grasping the current status of research in this field. Journal statistics can facilitate researchers in determining access methods and selecting target journals. We obtained the top 10 most influential journals in the field of sustainable agricultural development assessment from 2002 to 2022 by counting the journals that contain articles (
Table 2).
The agricultural sustainability and green development assessment studies were published in a total of 50 journals during 2002–2022,
Table 3 shows the 10 most influential peer-reviewed journals. Sustainability was the most prolific journal with 21 publications (19.09%), followed by Ecological Indicators with 12 publications (10.91%), and Journal of Cleaner Production with 10 publications (9.09%). In addition, A journal’s impact factor is known recently as a scientometric parameter of its significance: a journal with a higher impact factor is of higher quality. According to the Journal Citation Reports 2020, the first, second, and third ranked were Journal of Cleaner Production (IF = 9.297), Ecological Economics (IF = 5.389), Sustainable Production and Consumption (IF = 5.032). Other prolific journals such as Ecological Indicators (IF = 4.958), Sustainability (IF = 3.251), Environment Development and Sustainability (IF = 3.219) also had high impact factors, researchers preferred these journals when publishing analytical studies on SADA. For total citations, papers published in Ecological Indicators, Sustainability, and Ecological Economics had the highest combined citations, indicating that papers published in these journals attracted more attention during the sample period, suggesting that they gave insightful information for researchers to extend SADA studies.
3.5. Subject Classification
Statistics on the disciplinary attributes of source journals according to their disciplinary classification numbers help to determine the disciplinary background of researchers and research subjects. In this paper, we analyzed the research directions with the search result analysis tool on the Web of Science. The summary results of the classification are shown in
Figure 4.
As can be seen from the
Figure 4, 44 of the 110 articles on SADA are from the direction of Environmental Sciences & Ecology, followed by studies focused on Agriculture itself, 13 articles from the perspective of Biodiversity & Conservation, and 11 articles on the category of Engineering; Environmental Sciences. In terms of disciplinary distribution, the articles on SADA are characterized by a wide range of disciplines and a wide and relatively scattered distribution of journal sources, which have not yet formed a core journal area, hindering scholars from grasping the current status of research in the field and further research.
3.6. Most Cited Articles
Citation counts are an essential part of bibliometric analyses,
Table 3 displays the top 10 cited articles in the publication.
The statistics show that 99 of the 110 articles in the period 2002–2022 had at least one citation. The top three global citations in publications are Gomez-Limon and Sanchez-Fernandez (2010) [
36], Pacini et al. (2003) [
4], and Chiou et al. (2005) [
1]. An article in Ecological Economics entitled “Empirical evaluation of agricultural sustainability using composite indicators” by Gomez-Limon and Sanchez-Fernandez (2010) received 185 citations [
36]. This study aimed to develop a practical methodology for evaluating the sustainability of farms using composite indicators and apply it to two agricultural systems. Second, the article “Evaluation of sustainability of organic, integrated and conventional farming systems: a farm and field-scale analysis” and “Evaluating sustainable fishing development strategies using fuzzy MCDM approach”, Cited 175 times and 155 times, respectively. Although the scope of the studies varied by country and species, the number of citations in the sample literature was generally at a high level, suggesting that these studies provided different perspectives for future generations to explore in this field and were of a high reference value.
3.7. Country Analysis
This study also analyzes the countries involved in the 110 articles according to the distribution of the authors’ nationalities. As
Figure 5 shows, the sample literature came from a total of 37 countries, the largest number of studies came from China, with a whopping 30 publications, followed by Italy with 11 publications, and France with 10 publications. As can be seen from the figure, the research is highly concentrated in various Asian and European countries, accounting for 78.4% of the total number of publications. China was one of the first countries to propose and implement a sustainable development strategy, over the past decades, China has made a great effort to implement the UN’s Millennium Goals. In the recent five-year plan, there were several references to measures to solve outstanding problems in the field of ecology and environment, and given great encouragement and sufficient support to sustainable industrial development. European countries are globally recognized as pioneers in sustainable development theory and practice, have made their efforts in various aspects of sustainable development strategies and actions, and have accumulated many advanced experiences, such as Kyoto Protocol and the Europe 2020 Strategy. European countries have contributed more literature to promote sustainable economic development by making suggestions and propaganda appeals in industrial sustainable development.
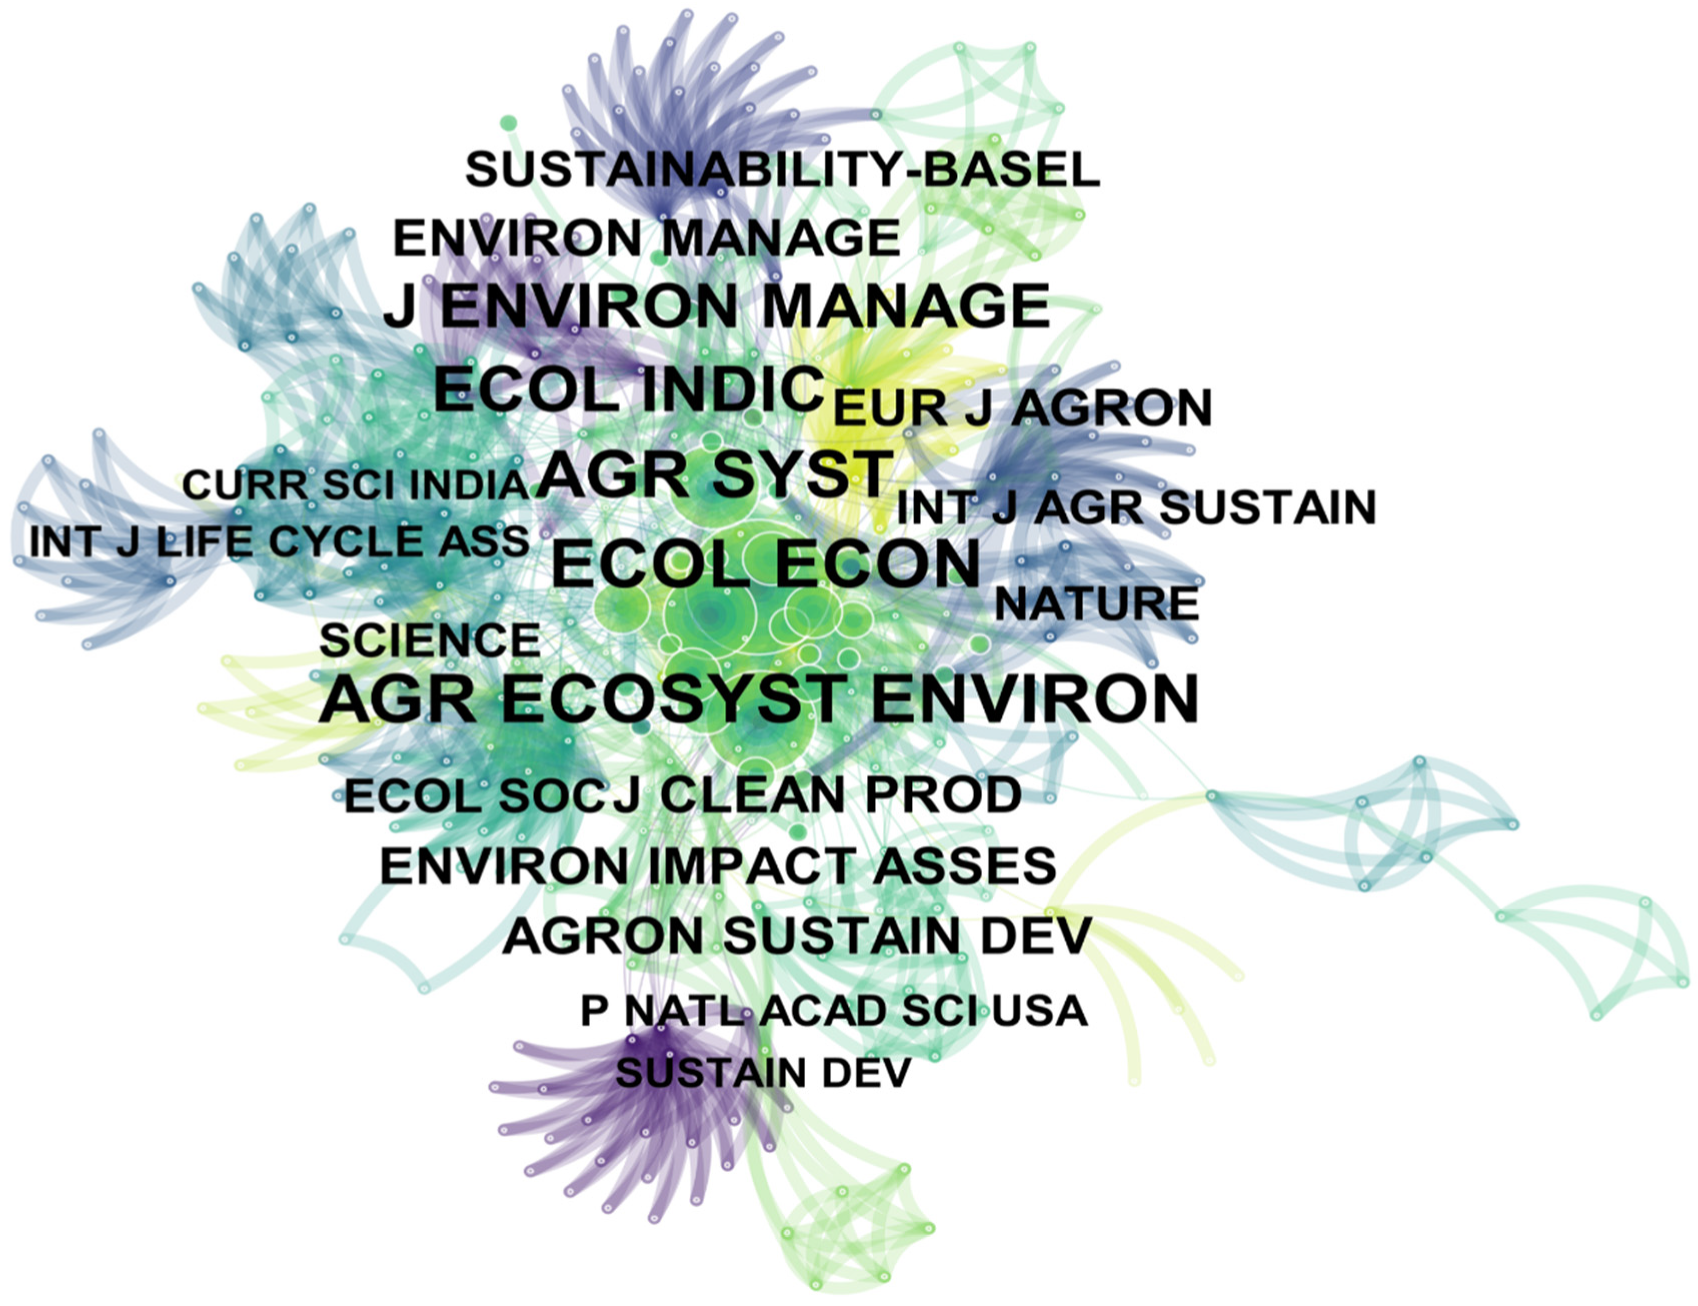
3.8. Cited Author and Cited Journal Analysis
Co-citation is the relationship between two journals that exist when they are cited simultaneously in one or more publications. The visual mapping analysis of the cited authors and cited journals involved in the sample articles was performed with the help of CiteSpace software. In
Figure 6 and
Figure 7, each circle represents a node, and the larger the node, the larger the corresponding font, indicating that the more frequently the author or journal appears, the greater the impact in the visualization mapping.
Figure 6 is plotted based on the authors being cited in the cited literature at the same time. As can be seen from the graph, the top author according to cited authors is Bockstaller, from the Association pour la Relance Agronomique en Alsace (ARAA), with a total of 18 citations. Bockstaller and his team have contributed extensively to the field of agroecological indicator assessment, represented by “How to validate environmental indicators,” “Use of agro-ecological indicators for the evaluation of farming systems,” and “Agri-environmental indicators to assess cropping and farming systems. A review”. The second one is Pretty with a citation count of 16, who has done more research on sustainable agriculture, represented by “Agricultural sustainability: concepts, principles and evidence,” “Introduction. Sustainable agriculture,” and others. Other authors with high citations include Bell, Binder, Hansen, etc. It is worth mentioning that the FAO appears more frequently in the cited authors’ graph, indicating that most of the articles on agricultural sustainable development assessment use the data or statistical annual reports from FAO, which have a great reference value in this field.
Figure 7 is plotted based on the citation of the cited literature by the citing journal at the same time. The top two journals in terms of citations are Ecological Economics (IF = 5.389) and Agriculture Ecosystems and Environment (IF = 5.567) from the Netherlands with 42 citations, the subject areas of the journals both are environmental science and ecology. In third place is Agricultural Systems (IF = 5.370) from England with 36 citations, belonging to agricultural and forestry sciences. In addition, the journals with more co-citations and greater influence are the Journal of Environmental Management (IF = 6.789), European Journal of Agronomy (IF = 5.124), and Ecological Indicators (IF = 4.958), etc.
3.9. Research Hotspots and Temporal Evolution
The keywords represent the focus of a paper, and to a certain extent reflect the overall structure. This article was based on a word frequency analysis method and used CiteSpace to visualize the frequency magnitude and clustering relationships of keywords, from which we can analyze the research hotspots of a research field.
As shown in
Table 4, the top-ranked items by citation counts are “framework,” and “indicator,” with citation counts of 28, and the second is “system,” with citation counts of 25. These three keywords appear most frequently in recent studies, indicating a high relevance to the topic. Other high-frequency keywords are “sustainability assessment,” “agricultural sustainability,” “management,” “agriculture,” and “impact.” In addition, from Centrality and Degree, “framework,” “indicator,” “management,” “agricultural sustainability,” and “system,” are at a high level, indicating that SADA is mainly studied by constructing indicator framework and system assessment [
15,
26,
33,
37,
38,
39].
The Timeline of author keywords analysis allows for visualizing the temporal evolution of SADA.
Figure 8 shows the clustering of high-frequency keywords by the LLR algorithm, the clustering results are presented according to their temporal evolution. Clusters are numbered from 0, the figure shows the top seven clusters with a high number of keywords, the importance of the clustering results decreases from top to bottom, and each node represents a keyword whose size is proportional to the number of its occurrences. According to keyword attribute, the largest cluster can be summarized as “sustainable development”, with the most keywords such as “productivity management,” “food security,” “farm sustainability,” and so on. The second to seventh clusters can be summarized as “sensitivity analysis,” “data envelopment method,” “socio-environment,” “cropping system,” “aquaculture,” and “intention.”
A specialty may go through an initial conceptualization phase, an expansion phase when researchers apply their methods to disciplinary areas beyond the original research problems, and a final phase of decline. The earlier keywords that appear were “indicator,” “conservation,” “parameter,” “methodology,” and “management.” Later on, keywords such as “ecosystem services assessment,” “aquaculture system,” and “climate change,” appeared. This means that researchers initially conducted studies on sustainability methods based on an agricultural conservation perspective, focusing more on sustainable development management and evaluation methods. As environmental and economic factors were explored in depth, more scientific econometric and statistical methods were applied to evaluation studies, and some researchers shifted their focus to examining environmental impacts and economic efficiency.
4. Indicators and Methods of SADA
4.1. Core Evaluation Indicators
Evaluation indicators are proxy variables for the characteristics of assessment objects, which are the refinement and concrete expression of evaluation dimensions and can objectively reflect the specific situation of evaluation objects. In order to learn from previous studies on SADA, this paper extracted 53 articles from the sample articles that involve the construction of evaluation systems and the presentation of indicators, counting information on their evaluation methods and indicators. At the level of primary indicators, most of them were analyzed from three dimensions (economic, social, and environmental) [
5,
6,
8,
18,
32,
35,
36,
37,
40,
41,
42]. Another part articles added resource input [
22,
25,
43], composite sustainability indices [
44], and political, education, institutional, and demographic indicators [
22,
33,
38].
At the specific index level, 298 original evaluation indexes were collected, extracting core words and grouping synonyms, the streamlined evaluation indexes were 48 in total. Using the faction function of Ucinet for assignment analysis, a total of 3 agglomerative subgroups were obtained. The word group combinations of each subgroup classification and core words of evaluation indicators are shown in
Table 5. The agglomerative subgroup themes were named economic, social, and environmental based on the attributes of the phrases in the cluster. From the classification of agglomeration, subgroup 1 has 14 indicators, accounting for 29% of the total number of high-frequency words in the evaluation index, with “income” “yield” and “productivity” as core vocabularies, reflecting the aim of sustainable agricultural development is to promote industrial transformation, increase income and productivity within the constraints of environmental carrying capacity, and ultimately contribute to high-quality agrarian development. Subgroup 2 has 16 indicators, accounting for 33%, with “laborers” “mechanization” and “benefits” as core vocabularies, indicating that sustainable agricultural development focuses on achieving a more equitable social distribution and green, efficient, low-carbon production through technological progress. Environmental indicators are a mandatory item in the construction of the SADA framework, subgroup 3 has 18 indicators, accounting for 38% of the total, and is based on the core vocabularies of “organic matter”, “pesticide”, “pollution” and ”energy”, showing the inseparability of sustainable agricultural development and environmental protection.
4.2. Indicator Selection and Empowerment
A reasonable and scientific choice of indicators is the basis of assessment. In terms of indicator selection, most articles are based on published research, such as constructing from agricultural census data [
24], or from panel data [
25], or existing assessment systems and then combining these multidimensional indicators into indices or composite indicators through various methods [
45,
46,
47,
48]. The second was from questionnaires and interviews, establishing indicator frameworks through surveys [
40,
49], establishing indicator systems based on interviews with management or farmers [
4,
35,
41]. Finally, it was a combination of the above methods, collecting indicators through multiple channels and multiple ways [
38,
50].
In order to further analyze the indicator empowerment, the indicator assignment methods of the sample literature were counted, and the literature that did not require indicator weights in the quantitative evaluation was excluded from the statistics. The results show that the empowerment methods can be divided into objective, subjective, and combined assignments. The objective assignment is mainly based on the entropy weight method or improved entropy weight method [
22,
24,
51,
52,
53,
54], or factor analysis after standardization [
35]. The subjective assignment is mainly based on the Analytic Hierarchy Process (AHP) [
13,
15,
43,
46,
47,
55,
56]. AHP has become the most popular method because of its relative simplicity and ease of use, but the weights of indices are difficult to determine, and it is not easy to determine which index is more important because the importance is usually influenced by the interest and educational background of the experts. Furthermore, the importance of different indexes is affected by many uncertainties that require the involvement of many experts [
57].
4.3. Assessment Method
The evaluation of sustainable agricultural development is a complex project based on econometrics and statistics, closely related to society, economy, and environment. To accommodate different research objectives and subjects, various evaluation methods were adopted by the sample articles. Sattle et al. (2010) used a hybrid approach combining modeling techniques and survey methods to calculate economic and environmental indicators through the bioeconomic modeling system Multi-Objective Decision support system for Agroecosystem Management (MODAM) to assess the impact of economic performance [
40]. Bonny et al. (2010) adopted a combination of principal component analysis and indexation methods to estimate the impact of sustainable management measures [
8]. Liu et al. (2011) used the interpretative structural model and the grey relative technique [
9]. Castellini et al. (2012) assessed a bio-economic model combining on-farm data recording with the Multi-Criteria Decision Analysis [
11]. Zhou et al. (2012) presented a Driver Pressure-State-Impact-Response model [
58]. Antonio et al. (2014) used the Dominance-based Rough Set Approach [
10]. Sabaghi et al. (2016) introduced a fuzzy inference system to assess the sustainability of the product/process [
54]. Talukder et al. (2016) used Multi-Criteria Decision Analysis (MCDA) to aggregate categories and indicators [
49]. Nhemachena et al. (2018) applied the arithmetic mean as an aggregation method and calculated a composite index between 0 and 100 consistent with the agricultural sustainability goals [
45]. Wang et al. (2019) employed a contingency approach to comprehensively evaluate the sustainability performance of agricultural systems and used sensitivity analysis to identify key contingency streams that limit their sustainability [
59]. Li et al. (2019) used a technique for ordering preference by similarity to an ideal solution and coordination degree method to measure the sustainability of agriculture [
22]. Xu et al. (2021) proposed a hybrid ensemble approach combined with principal component analysis, entropy weights, and fuzzy-DEMATEL [
60]. Wang et al. (2021) used hierarchical analysis and a multi-factor comprehensive evaluation method [
61].
From the above analysis, we can see that the overall understanding of existing theories on the evaluation of agricultural sustainable development is still insufficient, and the construction of the assessment system has the problems of mechanical splicing and fragmentation. Evaluation indicators lack the generally accepted rules for normalization and weighting, as well as the commensurability of various variables. The combination of theory, practice evaluation, and methodological innovation needs further improvement.
5. Conclusions
This study is an application of bibliometric analysis to understand elements of relevant publications, research collaboration, and citation analysis with the aim of reviewing the research potential of SADA. According to the bibliometric analysis, publications on SADA grew at a rate of 28.39% from 2002 to 2022, with a significant increase since 2014, and reaching the highest number of publications in 2019. Overall, Collaboration among authors and institutions was not strong, representative teams had not been formed, and inter-institutional cooperation was mostly due to geographical convenience and insufficient international cooperation. Sustainability, Ecological Indicators, and Journal of Cleaner Production were the journals that were the most popular journal with more publications. As a result, works published in high-impact journals were more likely to be cited, such as articles published in Ecological Economics, Ecological Indicators, Environment Development and Sustainability, etc. The literature on SADA was characterized by relatively scattered journals, and various disciplinary categories, which hindered scholars from grasping the current state of research in the field and conducting in-depth studies. An article titled “Empirical evaluation of agricultural sustainability using composite indicators” by Gomez-Limon and Sanchez-Fernandez (2010) received 185 global citations and had a large impact in this field [
36]. The country analysis revealed that the authors of the sample articles were mostly from Asian and European countries. Cited author and Cited journal analysis revealed the authors and journals with greater influence in the references of the sample articles. A keyword analysis is used to gain more insight into the substance of a field, as well as to identify hotspots and future directions. By analyzing the temporal variations of keywords, the study found that researchers initially focused more on sustainable operations in agriculture or methods for assessing the degree of sustainability, as research progressed and more scientific methods were applied, environmental impact and economic efficiency were given more attention.
Indicators are the core of an assessment article, summarizing and classifying the sustainable agricultural development evaluation indicators that appear in the articles can provide some reference for subsequent research. Following the study outcomes, at the level of primary indicators, most of the analysis is done from three dimensions (economic, social, and environmental). In this paper, specific indicators are divided into three subgroups, the core vocabularies of subgroup 1 are “income”, “production” and “productivity”, while that of subgroup 2 are “laborers” “mechanization” and “benefits”, and subgroup 3 are “organic matter” “pesticide” “pollution” and “energy”. The indicators were selected from a wide range of sources, such as existing studies, panel data, questionnaires, interviews, or a combination of the above. For indicator weights, the entropy weight method and Analytic Hierarchy Process are predominant, for evaluation analysis methods, the sample articles were evaluated using different methods to accommodate the different research objectives and topics. With the improvement of assessment methods, the development of the industrial economy, and the increase in environmental awareness, the exploration of sustainable agricultural development assessment will continue to be a research hotspot. In future studies, statistical methods will become more scientific, assessment indicators will gradually increase and be refined under the three major indicators of economy, society, and environment, and some studies will focus on examining the impact of the environment and the improvement of economic efficiency. The analysis of research advances in SADA provides researchers and practitioners with a clear understanding of the publication patterns and hotspots in the research field. We hope this review can be useful for other researchers and policymakers.


