Abstract
With the increasing popularity of new energy vehicles (NEVs), a large number of automotive batteries are intensively reaching their end-of-life, which brings enormous challenges to environmental protection and sustainable development. This paper establishes a closed-loop supply chain (CLSC) model composed of a power battery manufacturer and a NEV retailer. The benchmark scenario of CLSC members without blockchain technology is analyzed, and the optimal recycling strategy of the manufacturer and retailer using traceability information based on blockchain technology is discussed. We generate our findings from three aspects, as follows: the manufacturer or retailer is more willing to take the responsibility of recycling when the proportion of retired batteries that can be used in echelons is relatively high. Meanwhile, when the recycling cost is large, both manufacturers and retailers should adopt blockchain technology to obtain greater profits. Furthermore, with the improvement of traceability information transmission efficiency, a higher profit growth rate will be achieved.
1. Introduction
In order to alleviate the environmental pressure and promote the sustainable development of the automobile industry, new energy vehicles (NEVs) have become the main direction of the transformation and development of the global automobile industry [1]. At the 75th United Nations General Assembly, the Chinese government proposed: “China will launch more effective policies and measures, strive to reach the peak of carbon dioxide emissions by 2030, and strive to achieve carbon neutrality by 2060. The EU further raised the emission reduction range, with a carbon emission level of 47.5% in 2030. The automobile industry needs to build an innovation system for low-carbon development, and NEVs will usher in development opportunities. With the expansion of China’s NEV market, the arrival of the peak of battery recovery has attracted the attention of the market. The recovery of batteries has become a thriving new industry. According to the China Automotive Technology and Research Center, the cumulative number of retired power batteries in China will reach 780,000 tons by 2025. Considering the exponential growth of the number of retired batteries in the future, the market scale of China’s retired battery recycling will exceed 40 billion yuan by 2025. By 2030, the market scale of battery recycling will exceed 100 billion. The Ministry of Industry and Information Technology (MIIT) of China issued the industry standard conditions for the comprehensive utilization of retired power batteries of NEVs in January 2020, which clearly requires vehicle enterprises to undertake the main responsibility for battery recycling. Since then, lots of battery manufacturers and NEV retailers, such as Volkswagen (Automobile brand, Wolfsburg, Germany), BYD (Automobile brand, Shenzhen, China), and CATL (Power battery manufacturer, Ningde, China), have begun to build their own power battery recycling systems.
With the intention of maximizing material performance and minimizing environmental pollution, we need to properly deal with these obsolete batteries [2]. The ideal model of battery recycling for NEVs is echelon utilization and then recycling. Echelon utilization refers to the process of essential detection, classification, and battery repair of retired power batteries of NEVs, intending to apply retired batteries to other fields, such as electric tools, solar/wind energy storage devices, and so on [3]. Recycling is to extract valuable metal materials from retired batteries. It is suitable for ternary lithium batteries containing expensive metals such as cobalt and nickel. At the end of 2017, BMW (Automobile brand, Munich, Germany) started the action of recycling the retired batteries of its electric vehicles. Furthermore, BMW said that it would utilize the retired batteries of 700 recycled BMW I3 electric vehicles for energy storage. The project has achieved several energy storage and supply missions in the BMW Leipzig factory.
NEV battery recycling enterprises are confronted with various challenges under the “joint force” of upstream and downstream, such as opaque information and echelon utilization of the energy storage market. Facing the massive battery recycling market, the recycling and treatment of small workshops in the non-standard market is prominent, and numerous batteries flow into informal enterprises, resulting in huge environmental pollution and potential safety hazards [4]. Moreover, the opacity of information gives birth to a lot of profit-seeking spaces and hidden dangers to security and environmental protection.
Several NEV companies’ internal recycling is chaotic, battery usage is difficult to track, and quite a few second-hand businesses’ recycling is irregular, which makes battery recycling extremely hard. NEV retailers, battery manufacturers, and the government are facing a multitude of challenges. Blockchain technology can trace the complete life cycle of lithium-ion batteries in the whole supply chain [5,6,7]. If properly used, it can support the responsible and efficient recycling and reuse of batteries for electric vehicles and portable electronic devices. The world has realized the necessity of a circular economy. With the increasingly stringent government regulations and the gradual improvement of consumer demand, NEV retail companies and battery manufacturing companies need higher compliance, and the traceability of blockchain technology can help enterprises better implement this.
In view of the above background, whether the recycling closed-loop supply chain (CLSC) should adopt the blockchain technology and, if the blockchain technology is adopted, who should bear the recycling responsibility are all issues worthy of attention. This paper aims to bridge the gap left by existing research by solving the following problems:
- 1.
- Under the reasonable echelon utilization ratio, who should bear the responsibility of recycling in the CLSC?
- 2.
- What factors affect the application of blockchain technology in the CLSC?
- 3.
- When blockchain technology is adopted, how can the traceability level be determined based on blockchain technology?
In order to answer the research questions above, we established four models: (I) manufacturer recycling without blockchain technology (MN model), (II) retailer recycling without blockchain technology (RN model), (III) manufacturer recycling with blockchain technology (MW model), and (IV) retailer recycling with blockchain technology (RW model). Firstly, we compare the profits under different recycling models. Secondly, we analyze the profit changes under different echelon utilization ratios. Finally, we test the robustness of the results.
In general, firstly, the existing relevant literature emphasizes the role of blockchain technology in supply chain management. However, this paper focuses on the application of blockchain technology in the recycling supply chain. Secondly, the previous literature has mainly focused on the quality of recycled products and environmental impact, while this paper considers the echelon utilization of power batteries and various recycling and collection costs based on the actual situation and previous research. Last but not least, we take into account the information traceability level of blockchain technology and the sensitivity of consumers to traceable information. As a consequence, based on the previous literature and combined with the characteristics of echelon utilization of NEV batteries, this article puts forward four different recycling models and analyzes the impact of blockchain technology on the recycling strategies of CLSC members.
The remainder of the paper is organized as follows. Section 2 reviews relevant literature. Section 3 describes the model assumptions and the notations. Section 4 discusses four different decision models under the background of using blockchain technology and analyzes the impact of recycling cost and traceability information transmission efficiency on NEV battery recycling. Section 5 provides a numerical experiment to demonstrate related issues. Finally, Section 6 presents conclusions and management enlightenment. All the proof in this paper is provided in Appendix A.
2. Literature Review
2.1. Blockchain Technologies
Recently, the traceability and disintermediation of blockchain have been widely used [8,9,10]. A large amount of literature has investigated the impacts of blockchain technology on supply chain management [11,12,13]. Combining the action research method and case study, Sundarakani et al. [14] investigated the need for blockchain in the Industry 4.0 environment from a big data perspective in supply chain management. Analogously, Saberi et al. [15] proposed and discussed the application of blockchain technology in supply chain management. Moreover, Chang et al. [16] considered the current situation of blockchain in global cross-border trade and supply chain management and put forward the cooperation mode and research direction for enterprises, governments, and academia. Xia et al. [17] proposed a vehicle-to-vehicle (V2V) electricity trading scheme based on Bayesian game pricing in a blockchain-enabled Internet of Vehicles. Previously, much of the research in blockchain has examined the platform supply chain [18,19]. In consideration of the influence of product information disclosure by rental service platforms on consumer surplus and platform profit, Choi et al. [20] discussed the role of blockchain technology. Furthermore, Shen, Xu, and Yuan [18] demonstrated the value of blockchain in disclosing the quality of second-hand products in the supply chain. Similarly, blockchain is widely used in various food supply chains [21,22]. Most scholars believe that blockchain can help improve the traceability of the food supply chain and ensure food safety and quality [23,24]. Aiming at the quality problem of fresh products in cold chain logistics, Wu, Fan, and Cao [5] examined the strategy of adopting blockchain technology in the fresh product supply chain (FPSC). In addition, for the FPSC, investment decision-making and coordination in the green agricultural food supply chain are deliberated by combining blockchain and big data [25]. The current research emphasized the role of blockchain technology in supply chain management, involving various supply chains, such as second-hand supply chains, FPSC supply chains, and power trading supply chains. However, the focus is completely different. We pay attention to the application of blockchain technology in the recycling supply chain.
2.2. Reverse Recycling of CLSC
A large amount of research has been implemented based on recycling [26,27]. Partly considering the impact of recycling on the environment, Gu et al. [28] put forth that the recycling and reuse of batteries will help to reduce the consumption of raw materials and lessen the impact on the environment, which may not be economically beneficial. Shekarian et al. [29] investigated the decision on the optimal pricing and collection strategy of CLSC. Li et al. [30] believe that the widespread implementation of trade-in programs to boost sales and enhance product recycling is not invariably beneficial to the environment. Considering the competition in products and recycling, Wang et al. [31] explored the optimal pricing strategy of CLSC with a highly competitive recycling market and product market. Similarly, Huang et al. [32] considered the pricing decision under the condition that the collection and remanufacturing costs were interrupted. Moreover, Wu [33] discussed the competitive pricing strategies of supply chain members and described the balanced decision-making about consumers’ preference for recycled products. Much of the research on recycling has examined consumer willingness and government behavior [34,35]. Sun and Li [36] focused on recyclable green logistics packaging and explored the behavior choices of the government, logistics enterprises, and consumers. Under different recycling modes, Xie et al. [37] considered the impact of government subsidies, closed-loop supply chain operation strategy, and patent licensing strategy. Tang et al. [38] considered the impact of green initiatives on consumers’ purchase behavior and verified that CLSC remanufactured in competitive markets can achieve the same rate of return as the central coordination channel through contracts between manufacturers and retailers. Zhang and Li [39] believed that the government should consider the decision-making threshold of closed-loop supply chain members to ensure the maximum effect of different carbon regulatory policies when implementing carbon tax policies or subsidy policies. Furthermore, Wang et al. [40] demonstrated the impact of consumer behavior on the competitive dual-collection supply chain when faced with multiple collection channels of second-hand products. Numerous scholars believe that the quality level of recycled products will have an impact on the decision-making of the supply chain. Wan et al. [41] investigated the impact of recycled product quality on carbon emission reduction and pricing decisions in the CLSC and further explored the corresponding changes in market demand. Gong et al. [42] explored the impact of different recycling models and channel power structures on CLSC’s optimal decision-making and performance. However, the existing research results are mainly explored from the perspectives of recycled product quality, consumer awareness, and environmental impact, and there is a lack of targeted research on the recycling and echelon utilization characteristics of retired batteries.
2.3. Reuse of Retired NEVs Batteries
In recent years, the circular use of NEV batteries has been of high concern to several scholars. For instance, Kumar et al. [43] raised a number of challenges for the sustainability of the EV battery supply chain, such as ineffective battery recycling and reuse, battery disposal, and insufficient charging infrastructure. This kind of literature concentrates on the technical problems in the process of battery recovery; for example, Yun et al. [44] summarized the existing recycling technologies in mechanical procedures and chemical recycling, and Glöser-Chahoud et al. [45] argued for the need for industrial disassembly systems to reach higher levels of circularity. In terms of the economic and environmental analysis of battery recycling and reuse, Heymans et al. [46] performed an economic analysis on the secondary use of EV batteries for residential energy storage and load balancing. In addition, Mazzeo [47] conducted a 3E (energy, economy, and environment) analysis on the interaction between night EV charging and the residential photovoltaic cell system. However, there is rarely literature on battery recycling strategies, with it mostly focusing on government subsidies and reward and punishment mechanisms; Gu et al. [48] investigated a loss-averse EV manufacturer’s optimal electric vehicle production strategy under subsidy and battery recycling. However, Tang et al. [49] pointed out that the traditional subsidy mechanism is not effective in the current recycling market and put forward the socio-economic and environmental impact of recycling retired EV batteries under the reward and punishment mechanism. Concerning the recycling and reuse of NEV batteries, the current literature mainly analyzes the technical problems in the process of battery recycling, the environmental analysis of battery recycling, and government subsidy strategies. However, there is little literature on the battery recycling strategy of NEVs, and there is a lack of specific research on battery echelon utilization.
In summary, first and foremost, the existing relevant literature emphasizes the role of blockchain technology in supply chain management, involving second-hand supply chains, FPSC supply chains, power trading supply chains, and other supply chains. However, this paper focuses on the application of blockchain technology in the recycling supply chain. Last but not least, the previous literature mainly focused on the quality of recycled products and their environmental impact. Especially in terms of battery recycling, most of the literature only focuses on the technical problems of battery recycling of NEVs and the impact of government subsidies. Consequently, this paper proposes four different recycling models and explores the impact of blockchain technology on the recycling strategies and profits of CLSC members.
3. Model Description and Assumptions
In this section, we first explain the notations and assumptions used in this paper. Then, the problem description is provided. Furthermore, we provide the basis for establishing the models.
3.1. Notations and Assumptions
Table 1 summarizes the basic notations used throughout the research.

Table 1.
Notations.
This paper mainly discusses the selection of supply chain recycling models under different echelon utilization ratios and traceability levels. Therefore, the corresponding assumptions are made.
Assumption 1.
The recycling cost and collection cost of retired batteries are lower than the cost of manufacturing new batteries, that is, which is the same for all retired batteries recycled and reused in echelons [4].
Assumption 2.
When the selected power battery is recycled from the consumer, all batteries will be detected and divided into two types. The first is echelon utilization. Retired power batteries are used as the carriers of electric energy in other fields, such as energy storage, which is conducive to giving full play to the residual value. The second is disassembly and recycling. The waste batteries are disassembled and the raw materials are refined in order to be recycled. We mainly consider the echelon utilization of retired batteries [50,51].
Assumption 3.
The main value of NEVs lies in power batteries. Accordingly, wemainly consider the recycling and echelon utilization of power batteries, while the recycling of raw materials of other auto parts is not discussed in the CLSC [52].
3.2. Model Description
This research considers a supply chain based on battery recycling of NEVs, which is composed of a manufacturer and a retailer. Based on reality and referring to studies in the literature [40,52], the battery manufacturer is considered a leader. As the “heart” of NEVs, the power battery technology directly determines the performance, quality, and safety of the whole vehicle. For example, when achieving strategic cooperation with BMW, Tesla, and other NEV retailers, the CATL as a battery manufacturer can usually choose the appropriate cooperation model. Realistic recycling methods and echelon utilization of retired batteries are considered. Firstly, the recycling model without blockchain technology is discussed. Then, we analyze the optimal recycling model and traceability level of supply chain members in the scenario of adopting blockchain technology. The structural framework of different models is shown in Figure 1.
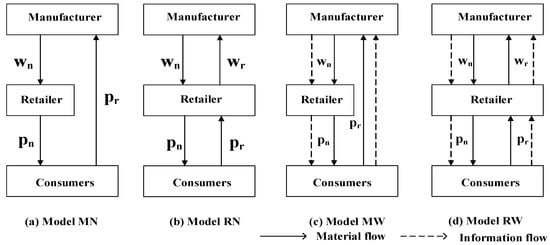
Figure 1.
Framework under different recycling models.
This section introduces four CLSC models for retired battery recycling. In the absence of blockchain technology, the battery manufacturer collects retired batteries and uses them in echelons (Model MN, Figure 1a). In practice, in the field of NEV recycling, Bangpu (Battery manufacturer, Changsha, China) cooperates with international top automobile retail enterprises such as Volkswagen and Audi to recycle retired batteries. The NEV retailer collects retired batteries and uses parts of them in echelons, and the rest are resold to the battery manufacturer for disassembly (Model RN, Figure 1b). Actually, Japan’s Mitsubishi will use retired batteries to power its buildings. European car companies such as Audi and Renault are trying to combine retired batteries with building power supplies to make echelon use of retired batteries. Under the background of blockchain technology, the battery manufacturer collects retired batteries and carries out echelon utilization (Model MW, Figure 1c). Honeycomb Energy (Battery manufacturer, Changzhou, China) will build a 5G platform for battery blockchain. The NEV retailer collects retired batteries and uses parts of them in the echelon, and the rest are resold to the battery manufacturer for disassembly and treatment (Model RW, Figure 1d). In recent years, car companies including Porsche, Mercedes Benz, and BMW have begun to explore blockchain technology.
3.3. Market Demand and Cost Structure
Without blockchain, the sales volume of new products decreases linearly with the rise in price. Subsequently, we discovered that the relationship between product price and quantity, where represents the market size, represents the price sensitivity.
With blockchain, it is crucial to determine the appropriate level of battery traceability information [53,54]. In this case, the adoption of blockchain technology has a positive impact on consumers with traceability information preferences. It is assumed that under the influence of blockchain technology, the increase in demand for new products is , where represents the traceability information transmission level of blockchain technology, referred to as the traceability level, and represents consumers’ sensitivity to the traceability level. Accordingly, we get that the relationship between product price and quantity is
Actually, consumers will bear the cost of returning the used battery, including time and money. Therefore, the willingness to recycle used batteries needs to be considered. Only when the profit is greater than the willingness to return will the consumer return the used battery. We assume return willingness conforms to the uniform distribution of 0 to 1. The recycler pays consumers to recycle used batteries; thus, the net consumer surplus with consumer return willingness is obtained by returning the used battery. All consumers will be willing to return the used product only if . Consequently, the recycling quantity of used batteries, denoted by , can be formulated as [33,55].
There are two kinds of costs in the recycling process of retired batteries, one is the collection cost and the other is the recycling cost. Recycling costs comprise disassembly, testing, evaluation, etc. Furthermore, there are multitudinous NEV battery manufacturers, and consumers are scattered when using batteries. Extra collection costs need to be paid on the collection of retired batteries. Therefore, we assume that the collection cost of retired batteries is and the recycling cost is . Furthermore, in order to adopt blockchain technology to achieve the traceability level, a strictly convex service function can be used to describe the relationship between the traceability level and its related costs. This is similar to the cost expression used by [56].
We express as traceability information transmission efficiency, which can reflect the ratio of profit to cost of traceability information level. It can be clearly seen that the increase in or the decrease in leads to the increase in the level of . Namely, supply chain members can improve efficiency by improving the level of traceability information, thereby reducing the required cost.
4. Model Solving and Equilibrium Analysis
4.1. Benchmark Model without Adopting Blockchain Technology
4.1.1. Model MN
The CLSC of retired battery recycling is composed of a single battery manufacturer and a NEV retailer [40,57]. In the model MN, the battery manufacturer collects used batteries directly from consumers. Then, after testing, the power battery is divided into batteries that need to be disassembled directly, and the parts can be used in echelon utilization. Furthermore, the unit income obtained from the retired battery in echelon is .
The profit function for the manufacturer is written as:
The profit function for the retailer is written as:
In general, not all NEV batteries can be recycled at the end of their life cycle; thus we assume . The Lagrange equation for Equations (3)–(5) is constructed as follows:
Solving the Kuhn–Tucker condition of (6), we can obtain the following lemma. All the proof processes can be seen in Appendix A.
Lemma 1.
Under the benchmark scenario, the optimal pricing strategies of the manufacturer and retailer are:
According to Lemma 1, the demand and optimal profits of the manufacturer and retailer under the benchmark scenario are as follows:
From Equations (10)–(11), we provide the following corollary.
Corollary 1.
Without adopting blockchain technology,
(1); if, then.
(2); if, then.
(1) and (2) of Corollary 1 indicate that the recycling price and quantity increase with the proportion of retired batteries used in echelon utilization and their unit income. Under certain conditions, the optimal profit of the battery manufacturer increases with and . This means that companies that recycle retired batteries should increase the proportion of echelon utilization of retired batteries and make rational use of retired batteries to create greater profits. Actually, in order to promote the sustainable development of enterprises and reduce enterprise costs, several companies have carried out battery echelon utilization to form a beneficial recycling model. As an example, Mitsubishi in Japan will utilize retired batteries for echelon utilization to power its buildings.
4.1.2. Model RN
In the RN model, the NEV retailer collects used power batteries directly from consumers. Then, parts of retired batteries are used for echelon utilization, and the unusable parts are resold to the battery manufacturer.
The profit function for the manufacturer is written as:
The profit function for the retailer is written as:
The Lagrange equation for Equations (12)–(14) is constructed as follows:
Solving the Kuhn–Tucker condition of (15), we can obtain the following lemma. All the proof processes can be seen in Appendix A.
Lemma 2.
Under the benchmark scenario, the optimal pricing strategies of the manufacturer and retailer are:
According to Lemma 2, the demand and optimal profits of the manufacturer and retailer under the benchmark scenario are as follows:
From Equations (20)–(21), we provide the following corollary.
Corollary 2.
Without adopting blockchain technology,
(1); if , thenand.
(2); if
, then and.
According to Corollary 2, the recycling price and quantity increase with the proportion of retired batteries used in echelon utilization and their unit income. The NEV retailer uses batteries in echelons, and the battery manufacturer recycles the remaining parts that cannot be used in echelons. However, under certain conditions, the optimal profits of the NEV retailer and battery manufacturer both increase with the proportion of retired batteries used in echelons. Specifically, no matter which member of the CLSC makes reasonable echelon utilization, other members can benefit from it. The echelon utilization of retired batteries is conducive to the formation of an effective recycling model, which can increase corporate profits and help the sustainable development of the NEV industry.
4.2. Model of Adopting Blockchain Technology
As previously mentioned, the adoption of blockchain technology has had a positive impact on consumers with traceability information preferences. Thus, the demand function under the scenario of adopting blockchain technology refers to Equation (2).
4.2.1. Model MW
Using blockchain technology to trace the battery life cycle of NEVs and ensure the best management can reduce the recycling cost while saving on the collection cost of retired batteries. Subsequently, we assume that the collection cost of retired batteries is and the recycling cost (including traceability, disassembly, evaluation, etc.) is , where represents the optimization coefficient of recycling cost, represents the optimization coefficient of collection cost. In the model MW, the battery manufacturer collects used power batteries directly from consumers.
The profit function for the manufacturer Is written as:
The profit function for the retailer is written as:
The Lagrange equation for Equations (22)–(24) is constructed as follows:
Solving the Kuhn–Tucker condition of (25), we can obtain the following lemma. All the proof processes can be seen in Appendix A.
Lemma 3.
Under the benchmark scenario, the optimal pricing strategies of the manufacturer and retailer are:
According to Lemma 3, the demand and optimal profits of the manufacturer and retailer under the benchmark scenario are as follows:
By Equations (30)–(31), we provide the following corollary.
Corollary 3.
Without adopting blockchain technology,
(1); if, then.
(2); if, then.
(3)If, then,.
Corollary 3 reveals that the recycling price and quantity increase with the proportion of retired batteries used in echelon utilization and their unit income. Under certain conditions, the optimal new product price and traceability level increase with consumers’ preference for traceability information. Actually, with the increase of consumers’ preference for traceability information, members of the CLSC hope to gain consumers’ trust and increase market demand. The company seeks effective methods, such as blockchain, to obtain the whole process information of NEV batteries. For example, CATL announced that it plans to build a battery recycling facility to promote the whole life cycle management of NEV batteries.
4.2.2. Model RW
In the model RW, the car retailer collects used power batteries directly from consumers. Then, parts of retired batteries are used for echelon utilization, and the unusable parts are resold to battery manufacturers.
The profit function for the manufacturer is written as:
The profit function for the retailer is written as:
The Lagrange equation for Equations (32)–(34) is constructed as follows:
Solving the Kuhn–Tucker condition of (35), we can obtain the following lemma. All proof process can be seen in Appendix A.
Lemma 4.
Under the benchmark scenario, the optimal pricing strategies of the manufacturer and retailer are:
According to Lemma 4, the demand and optimal profits of the manufacturer and retailer under the benchmark scenario are as follows:
By Equations (41) and (42), we provide the following corollary.
Corollary 4.
With adopting blockchain technology,
(1); if, then,
(2); if, then,
(3) If, then,,,.
Corollary 4 confirms that the recycling price and quantity increase with the number of retired batteries used in echelons. Moreover, it Is noted that although the retailer uses parts of retired batteries in echelons and the battery manufacturer recycles the rest, the profit of the battery manufacturer still increases with the echelon utilization proportion. Under certain circumstances, the traceability level and the optimal profit of CLSC members increase with consumers’ preference for traceability information. Specifically, with the increase of consumers’ preferences for traceability information, CLSC members adopt blockchain technology to trace the whole process information of NEV batteries in order to obtain higher profits. Actually, in line with the current development tone, several companies, such as Honeycomb Energy (a Chinese battery manufacturer), will build a blockchain platform for batteries and cooperate with new energy vehicle retailers to maximize profits.
5. Numerical Analysis
This section will perform numerical experiments on the model. According to the actual situation and combined with the existing literature [58], we set the size of the parameters. Regarding the administrative measures for echelon utilization of NEV batteries issued by the Ministry of Industry and Information Technology of China, we will determine the proportion of echelon utilization , the unit income obtained by echelon utilization of retired batteries is . According to Shao et al. [59], the market size and value sensitivity coefficient are and , respectively. Meanwhile, the cost of producing new products is . Referring to Liu et al. [25], the collecting cost of a used product is . The optimization coefficients for collection cost and recycling cost are and , respectively.
Observation 1. With the increase of traceability information transmission efficiency, the new product prices of model MW and model RW increase, while the new product prices of model MN and model RN remain unchanged (See Figure 2).
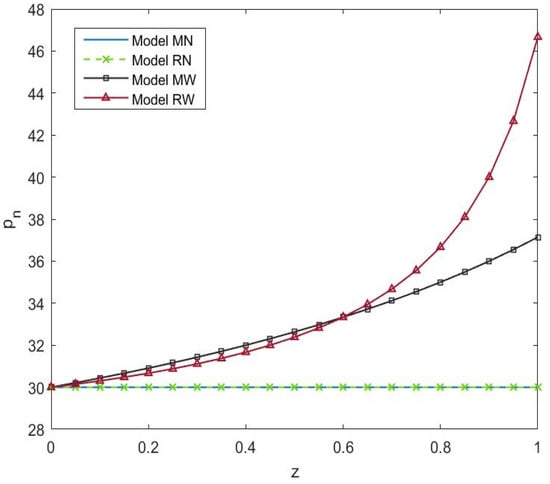
Figure 2.
Effect of on new product prices.
Figure 2 illustrates that the new product prices of model RW and model MW increase with the traceability information transmission efficiency. Moreover, the growth of the model RW is fast, and the growth of the model MW is relatively slow. The of model MN and model RN are the same and do not change with . On the contrary, when the NEV retailer recycles used batteries, it is more sensitive to changes in traceability information transmission efficiency. That is quite understandable because the NEV retailer is closer to consumers. When consumers have a higher preference for traceability, the retailer is more vulnerable to their own recycling. For the retailer, self-recycling will achieve a higher profit. For instance, Tesla has established a closed-loop system for the battery life cycle that effectively connects all links from production to recycling to reuse. Its batteries are traceable and conducive to sales and recycling.
Observation 2. As the proportion of echelon utilization increases, the recycling price increases accordingly. The growth rates of model MW and model MN are fast, while the growth rates of model RW and model RN are gentle (as shown in Figure 3).
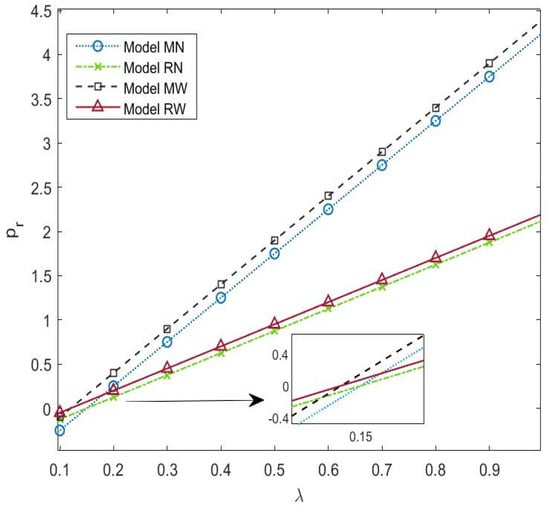
Figure 3.
Effect of echelon utilization ratio on recycling price.
Figure 3 demonstrates that when the proportion of echelon utilization is relatively low, the recycling price obtained by consumers is particularly small. It is due to members of the CLSC having to bear the cost of recycling and collection, and when they cannot enjoy the profits brought by echelon utilization, the recycling price they pay will be particularly small. When echelon utilization increases, the recycling price also increases accordingly. And for consumers, the battery manufacturer recycles their retired batteries, which will enable them to obtain a greater recycling price. Therefore, consumers should observe the use of their retired batteries and select appropriate enterprises for recycling them at the right time. Meanwhile, members of the recycling CLSC can use appropriate methods to use the retired batteries in echelons.
Observation 3. No matter in which model, for the manufacturer, when the proportion of echelon utilization increases, its optimal profit increases (as in Figure 4).
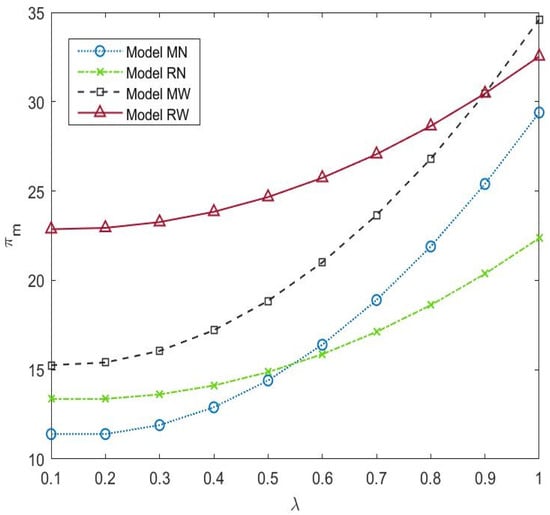
Figure 4.
Effect of echelon utilization ratio on manufacturer’s profit.
Figure 4 illustrates that for the profit of the manufacturer, when the proportion of echelon utilization is relatively small, blockchain technology should be adopted and the NEV retailer should bear the recycling responsibility; when the proportion of echelon utilization is relatively high, the manufacturer should be allowed to recycle and utilize echelon to obtain a higher profit. It means that blockchain technology can trace the whole process of the battery, improve the reliability of consumers, optimize the recycling and collection costs, and ultimately help improve profits. Meanwhile, reasonable echelon utilization can form an efficient recycling model and improve profit. For the manufacturer, no matter who is responsible for recycling and echelon utilization, blockchain technology should be adopted.
Observation 4. When the echelon utilization ratio is relatively low, the profit of model MW is the highest and that of model RN is the lowest. Conversely, the profit of model RW is the highest and that of model MN is the lowest (as below in Figure 5).
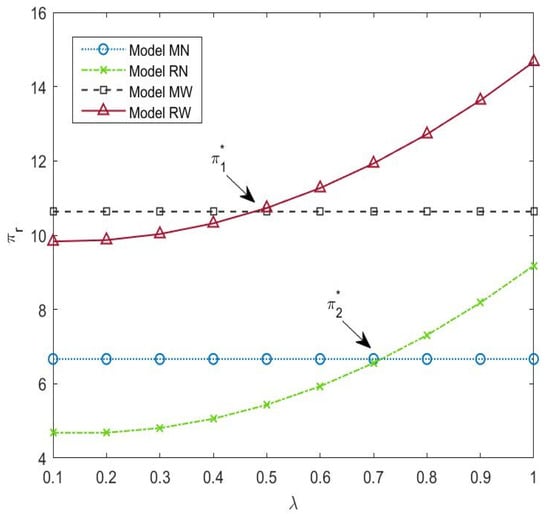
Figure 5.
Effect of echelon utilization ratio on retailer’s profit.
As depicted in Figure 5, when using blockchain technology when the echelon utilization ratio is relatively low, , the manufacturer bears the recycling responsibility, which will enable the retailer to obtain a higher profit. When the echelon utilization ratio reaches , choosing model RW will make the retailer more profitable. Without blockchain technology, similar to the above, when the echelon utilization ratio reaches , the retailer should recycle batteries by itself. Comprehensively, the retailer should consider adopting blockchain technology and choose who should bear the responsibility of recycling within a reasonable range of echelon utilization ratio.
Observation 5. When the traceability information transmission efficiency and recycling cost are relatively small, the profit of the battery manufacturer is the largest in the MW model and the smallest in the RN model. On the contrary, the profit of battery manufacturers is the largest in the RW model and the smallest in the MN model (as illustrated in Figure 6).
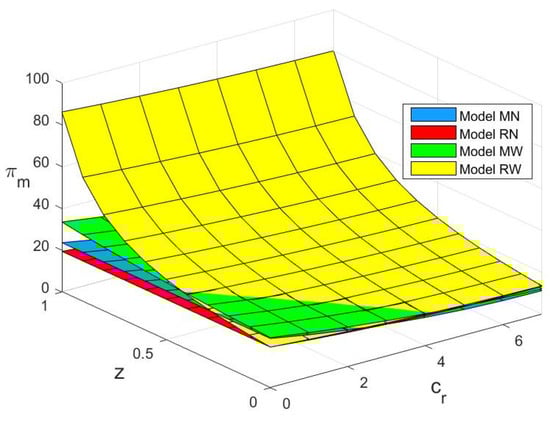
Figure 6.
The manufacturer’s profit under different models.
Figure 6 demonstrates that the manufacturer’s profit decreases with the increase in recycling costs. When blockchain technology is adopted, the manufacturer’s profits increase with . For the manufacturer, when the traceability information transmission efficiency and recycling costs are relatively low, the manufacturer should recycle and use several retired batteries in echelons; on the contrary, the manufacturer should choose to let the retailer recycle retired batteries to obtain a higher profit. Actually, CLSC members should be encouraged to adopt blockchain technology, and in the vast majority of cases, the manufacturer should make the NEV retailer bear the responsibility of battery recycling to obtain higher profits.
Observation 6. When the recycling cost is relatively small or the traceability information transmission efficiency is relatively large, the retailer’s profit is the largest in the RW model and the smallest in the MN model. When the cost of recycling is relatively large and the traceability information transmission efficiency is relatively small, the retailer’s profit is the largest in the MW model and the smallest in the RN model (as depicted in Figure 7).
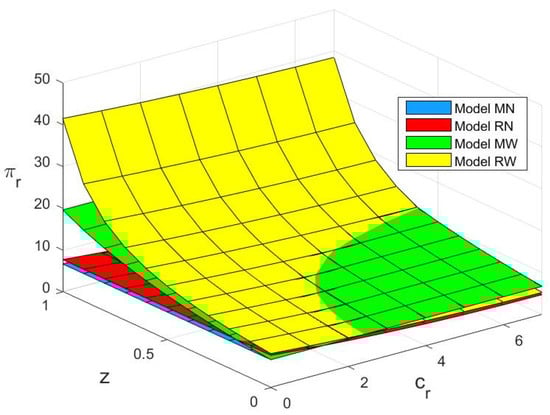
Figure 7.
The retailer’s profit under different models.
Figure 7 illustrates that the retailer’s profit increases with the traceability information transmission efficiency and decreases with the increase in recycling costs. When the traceability information transmission efficiency is relatively low and the recycling cost is high, the retailer chooses to let the manufacturer adopt blockchain technology and recycle retired batteries with a higher profit. When the traceability information transmission efficiency is relatively high or the recycling cost is low, the retailer should recycle retired batteries by itself and use the parts that can be used in echelons with blockchain technology to trace the whole cycle process of batteries. For the retailer, when using blockchain technology to achieve high traceability information transmission efficiency, they should take the initiative to recycle retired batteries and use them in echelons, which is conducive to improving their own profits and making batteries well recycled.
6. Conclusions
This paper discusses the CLSC model selection strategy for battery recycling of NEVs based on blockchain technology. We can summarize the key findings as follows. First of all, supply chain members are more willing to take the responsibility of recycling when the proportion of echelon utilization is relatively high. Secondly, when the cost of recycling is high, both manufacturers and retailers should adopt blockchain technology to obtain greater profits. Meanwhile, the manufacturer’s recycling model should be selected. Finally, a higher profit growth rate will be obtained with the increase of traceability information transmission efficiency.
This research provides new insights into the recycling model of NEVs. First of all, in the selection of battery recycling models, it is recommended to select NEV retailers for recycling, adopt blockchain technology to improve the recycling efficiency and the recycling price.
Second, when the cost of recycling is relatively high, blockchain technology should be adopted to obtain higher traceability, information transmission efficiency, and profits. Specifically, NEV batteries span multiple industries, from production, client use, echelon utilization, and final environmental recovery. Cross-industry data collection and trusted circulation are particularly arduous, resulting in higher recycling and processing costs. However, blockchain technology can improve the traceability level, optimize the recycling and processing costs, and bring greater profits to the CLSC.
Third, without blockchain technology, CLSC members typically adjust the recycling mode as the cost of recycling increases. In general, when the recycling cost is relatively high, they often choose to let other members recycle their retired batteries. On the contrary, if blockchain technology is adopted, CLSC members often choose to recycle by themselves.
Future research can be expanded and improved. Firstly, we only consider the single recycling model of one manufacturer and one retailer, and do not consider the competition between multiple manufacturers and multiple retailers. In addition, we can further explore the model of mutual cooperation among members of the recycling CLSC in the future.
Author Contributions
Conceptualization, J.Y. and P.X.; methodology, J.Y. and P.X.; formal analysis, J.Y. and P.X.; investigation, J.Y.; resources, P.X.; data curation, J.Y. and P.X.; writing—J.Y. and P.X.; writing—review and editing, J.Y.; supervision, P.X.; project administration, J.Y. and P.X.; funding acquisition, J.Y. and P.X. All authors have read and agreed to the published version of the manuscript.
Funding
This work was financially supported by National Natural Science Foundation of China (Grant NO. 71801118), Scientific Research Fund of Liaoning Provincial Education Department (Grant NO. LQN202024), Social Science Planning Foundation of Liaoning Province (Grant NO. L21CGL014), and Liaoning University Business School 2020 Academic Postgraduate Research Innovation Project (Grant No. 20GIP003).
Conflicts of Interest
The authors declare no conflict of interest.
Appendix A
Proofs of Lemma 1.
We solve the retailer’ s Stackelberg game via backward induction. From Equation (5), we obtain , so is a concave function of . Let , we obtain . Replace into Equation (6), we obtain , , so is a concave function of ,. Let , , and , then we can get two sets of solutions , Because it cannot be completely recycled , we obtain , . Replace and in and , we obtain , ,, , . □
Proof of Corollary 1.
Based on the equilibrium solutions obtained in Lemma 1, we have
(1) ; if , then .
(2) ; if , then .
Corollary 1 is proved. □
Proofs of Lemma 2.
Similar to Lemma 1, we employ backward induction, however, the difference is supplier’s decision variables become , , and from , , and . In addition, the decision sequence is unchanged.
We solve the manufacturer’ s Stackelberg game via backward induction. From Equation (15), we obtain , , so is a concave function of ,. Let , , , we obtain , . Replace , into Equation (12), we obtain , . So is a concave function of and . Let , , we obtain , . Replace, in and , we obtain , , , , , .□
Proof of Corollary 2.
Based on the equilibrium solutions obtained in Lemma 2, we have
(1) ; if , then and .
(2) ; if , then and .
Corollary 2 is proved. □
Proof of Lemma 3.
We solve the retailer’ s Stackelberg game via backward induction. From Equation (24), we obtain , so is a concave function of . Let , we obtain . Replace into Equation (25), we obtain , , , so is a concave function of , , . Let , , , and , we obtain , , . Replace , and in and , we obtain , , , , ,. □
Proof of Corollary 3.
Based on the equilibrium solutions obtained in Lemma 3, we have
(1) ; if ,then .
(2) ; if , then .
(3) If ,then , .
Corollary 3 is proved. □
Proofs of Lemma 4.
Similar to Lemma 3, we employ backward induction, however, the difference is supplier’s decision variables become , , , and from , , and . In addition, the decision sequence is unchanged.
We solve the manufacturer’ s Stackelberg game via backward induction. From Equation (35), we obtain , , , thus is a concave function of , , . Let , , , , we obtain , , . Replace , , into Equation (36), we obtain , . Thus is a concave function of and . Let , , we obtain , . Replace , in and , we obtain , , , , , , . □
Proof of Corollary 4.
Based on the equilibrium solutions obtained in Lemma 4, we have
(1) ; if , ,
(2) ; if , ,
(3) If , then , , , .
Corollary 4 is proved. □
References
- Pei, H.; Hu, X.; Yang, Y.; Tang, X.; Hou, C.; Cao, D. Configuration optimization for improving fuel efficiency of power split hybrid powertrains with a single planetary gear. Appl. Energy 2018, 214, 103–116. [Google Scholar] [CrossRef]
- Gu, X.; Zhou, L.; Huang, H.; Shi, X.; Ieromonachou, P. Electric vehicle battery secondary use under government subsidy: A closed-loop supply chain perspective. Int. J. Prod. Econ. 2021, 234, 108035. [Google Scholar] [CrossRef]
- Yu, H.; Dai, H.; Tian, G.; Xie, Y.; Wu, B.; Zhu, Y.; Li, H.; Wu, H. Big-Data-Based Power Battery Recycling for New Energy Vehicles: Information Sharing Platform and Intelligent Transportation Optimization. IEEE Access 2020, 8, 99605–99623. [Google Scholar] [CrossRef]
- Gu, X.; Ieromonachou, P.; Zhou, L.; Tseng, M.-L. Optimising quantity of manufacturing and remanufacturing in an electric vehicle battery closed-loop supply chain. Ind. Manag. Data Syst. 2018, 118, 283–302. [Google Scholar] [CrossRef]
- Wu, X.-Y.; Fan, Z.-P.; Cao, B.-B. An analysis of strategies for adopting blockchain technology in the fresh product supply chain. Int. J. Prod. Res. 2021, 1–18. [Google Scholar] [CrossRef]
- Park, A.; Li, H. The Effect of Blockchain Technology on Supply Chain Sustainability Performances. Sustainability 2021, 13, 1726. [Google Scholar] [CrossRef]
- Wang, M.; Wang, B.; Abareshi, A. Blockchain Technology and Its Role in Enhancing Supply Chain Integration Capability and Reducing Carbon Emission: A Conceptual Framework. Sustainability 2020, 12, 10550. [Google Scholar] [CrossRef]
- Li, Z.-P.; Ceong, H.-T.; Lee, S.-J. The Effect of Blockchain Operation Capabilities on Competitive Performance in Supply Chain Management. Sustainability 2021, 13, 12078. [Google Scholar] [CrossRef]
- Lim, M.K.; Li, Y.; Wang, C.; Tseng, M.L. A literature review of blockchain technology applications in supply chains: A com-prehensive analysis of themes, methodologies and industries. Comput. Ind. Eng. 2021, 154, 14. [Google Scholar] [CrossRef]
- Fan, Z.P.; Wu, X.Y.; Cao, B.B. Considering the traceability awareness of consumers: Should the supply chain adopt the blockchain technology? Ann. Oper. Res. 2022, 309, 837–860. [Google Scholar] [CrossRef]
- Yin, W.; Ran, W. Theoretical Exploration of Supply Chain Viability Utilizing Blockchain Technology. Sustainability 2021, 13, 8231. [Google Scholar] [CrossRef]
- Liu, L.; Li, F.T.; Qi, E.S. Research on Risk Avoidance and Coordination of Supply Chain Subject Based on Blockchain Tech-nology. Sustainability 2019, 11, 14. [Google Scholar]
- Kouhizadeh, M.; Sarkis, J. Blockchain Practices, Potentials, and Perspectives in Greening Supply Chains. Sustainability 2018, 10, 3652. [Google Scholar] [CrossRef]
- Sundarakani, B.; Ajaykumar, A.; Gunasekaran, A. Big data driven supply chain design and applications for blockchain: An action research using case study approach & nbsp. Omega-Int. J. Manag. Sci. 2021, 102, 19. [Google Scholar]
- Saberi, S.; Kouhizadeh, M.; Sarkis, J.; Shen, L. Blockchain technology and its relationships to sustainable supply chain management. Int. J. Prod. Res. 2018, 57, 2117–2135. [Google Scholar] [CrossRef]
- Chang, Y.; Iakovou, E.; Shi, W. Blockchain in global supply chains and cross border trade: A critical synthesis of the state-of-the-art, challenges and opportunities. Int. J. Prod. Res. 2019, 58, 2082–2099. [Google Scholar] [CrossRef]
- Xia, S.; Lin, F.; Chen, Z.; Tang, C.; Ma, Y.; Yu, X. A Bayesian Game Based Vehicle-to-Vehicle Electricity Trading Scheme for Blockchain-Enabled Internet of Vehicles. IEEE Trans. Veh. Technol. 2020, 69, 6856–6868. [Google Scholar] [CrossRef]
- Shen, B.; Xu, X.; Yuan, Q. Selling secondhand products through an online platform with blockchain. Transp. Res. Part E Logist. Transp. Rev. 2020, 142, 102066. [Google Scholar] [CrossRef]
- Wu, J.; Yu, J. Blockchain’s impact on platform supply chains: Transaction cost and information transparency perspectives. Int. J. Prod. Res. 2022, 1–14. [Google Scholar] [CrossRef]
- Choi, T.-M.; Feng, L.; Li, R. Information disclosure structure in supply chains with rental service platforms in the blockchain technology era. Int. J. Prod. Econ. 2019, 221, 107473. [Google Scholar] [CrossRef]
- Joo, J.; Han, Y. An Evidence of Distributed Trust in Blockchain-Based Sustainable Food Supply Chain. Sustainability 2021, 13, 10980. [Google Scholar] [CrossRef]
- Zhu, L. Economic Analysis of a Traceability System for a Two-Level Perishable Food Supply Chain. Sustainability 2017, 9, 682. [Google Scholar] [CrossRef]
- Casino, F.; Kanakaris, V.; Dasaklis, T.K.; Moschuris, S.; Stachtiaris, S.; Pagoni, M.; Rachaniotis, N.P. Blockchain-based food supply chain traceability: A case study in the dairy sector. Int. J. Prod. Res. 2020, 59, 5758–5770. [Google Scholar] [CrossRef]
- Li, K.; Lee, J.-Y.; Gharehgozli, A. Blockchain in food supply chains: A literature review and synthesis analysis of platforms, benefits and challenges. Int. J. Prod. Res. 2021, 1–20. [Google Scholar] [CrossRef]
- Liu, P.; Long, Y.; Song, H.-C.; He, Y.-D. Investment decision and coordination of green agri-food supply chain considering information service based on blockchain and big data. J. Clean. Prod. 2020, 277, 123646. [Google Scholar] [CrossRef]
- Santos, L.P.; Proença, J.F. Developing Return Supply Chain: A Research on the Automotive Supply Chain. Sustainability 2022, 14, 6587. [Google Scholar] [CrossRef]
- Su, J.; Li, C.; Zeng, Q.; Yang, J.; Zhang, J. A Green Closed-Loop Supply Chain Coordination Mechanism Based on Third-Party Recycling. Sustainability 2019, 11, 5335. [Google Scholar] [CrossRef]
- Gu, X.; Ieromonachou, P.; Zhou, L.; Tseng, M.-L. Developing pricing strategy to optimise total profits in an electric vehicle battery closed loop supply chain. J. Clean. Prod. 2018, 203, 376–385. [Google Scholar] [CrossRef]
- Shekarian, E.; Marandi, A.; Majava, J. Dual-channel remanufacturing closed-loop supply chains under carbon footprint and collection competition. Sustain. Prod. Consum. 2021, 28, 1050–1075. [Google Scholar] [CrossRef]
- Li, L.; Dababneh, F.; Zhao, J. Cost-effective supply chain for electric vehicle battery remanufacturing. Appl. Energy 2018, 226, 277–286. [Google Scholar] [CrossRef]
- Wang, N.; He, Q.; Jiang, B. Hybrid closed-loop supply chains with competition in recycling and product markets. Int. J. Prod. Econ. 2019, 217, 246–258. [Google Scholar] [CrossRef]
- Huang, Z.; Shao, W.; Meng, L.; Zhang, G.; Qiang, Q. Pricing Decision for a Closed-Loop Supply Chain with Technology Licensing under Collection and Remanufacturing Cost Disruptions. Sustainability 2022, 14, 3354. [Google Scholar] [CrossRef]
- Wu, C.-H. OEM product design in a price competition with remanufactured product. Omega 2013, 41, 287–298. [Google Scholar] [CrossRef]
- Zhu, X.D.; Yu, L.F.; Li, W. Warranty Period Decision and Coordination in Closed-Loop Supply Chains Considering Re-manufacturing and Consumer Behavior. Sustainability 2019, 11, 4237. [Google Scholar] [CrossRef]
- Li, J.; Du, W.; Yang, F.; Hua, G. The Carbon Subsidy Analysis in Remanufacturing Closed-Loop Supply Chain. Sustainability 2014, 6, 3861–3877. [Google Scholar] [CrossRef]
- Sun, H.; Li, J. Behavioural Choice of Governments, Enterprises and Consumers on Recyclable Green Logistics Packaging. Sustain. Prod. Consum. 2021, 28, 459–471. [Google Scholar] [CrossRef]
- Xie, B.; Guo, T.; Zhao, D.; Jiang, P.; Li, W. A Closed-Loop Supply Chain Operation Problem under Different Recycling Modes and Patent Licensing Strategies. Sustainability 2022, 14, 4471. [Google Scholar] [CrossRef]
- Tang, S.; Wang, W.; Zhou, G. Remanufacturing in a competitive market: A closed-loop supply chain in a Stackelberg game framework. Expert Syst. Appl. 2020, 161, 113655. [Google Scholar] [CrossRef]
- Zhang, F.; Li, N. The Impact of CSR on the Performance of a Dual-Channel Closed-Loop Supply Chain under Two Carbon Regulatory Policies. Sustainability 2022, 14, 3021. [Google Scholar] [CrossRef]
- Wang, N.; Song, Y.; He, Q.; Jia, T. Competitive dual-collecting regarding consumer behavior and coordination in closed-loop supply chain. Comput. Ind. Eng. 2020, 144, 106481. [Google Scholar] [CrossRef]
- Wan, P.; Ma, L.X.; Liu, J.N. Analysis of Carbon Emission Reduction and Pricing for Sustainable Closed-Loop Supply Chain Considering the Quality of Recycled Products. Appl. Ecol. Env. Res. 2019, 17, 9947–9963. [Google Scholar] [CrossRef]
- Gong, Y.; Chen, M.; Zhuang, Y. Decision-Making and Performance Analysis of Closed-Loop Supply Chain under Different Recycling Modes and Channel Power Structures. Sustainability 2019, 11, 6413. [Google Scholar] [CrossRef]
- Kumar, P.; Singh, R.K.; Paul, J.; Sinha, O. Analyzing challenges for sustainable supply chain of electric vehicle batteries using a hybrid approach of Delphi and Best-Worst Method. Resour. Conserv. Recycl. 2021, 175, 105879. [Google Scholar] [CrossRef]
- Yun, L.; Linh, D.; Shui, L.; Peng, X.; Garg, A.; LE, M.L.P.; Asghari, S.; Sandoval, J. Metallurgical and mechanical methods for recycling of lithium-ion battery pack for electric vehicles. Resour. Conserv. Recycl. 2018, 136, 198–208. [Google Scholar] [CrossRef]
- Glöser-Chahoud, S.; Huster, S.; Rosenberg, S.; Baazouzi, S.; Kiemel, S.; Singh, S.; Schneider, C.; Weeber, M.; Miehe, R.; Schultmann, F. Industrial disassembling as a key enabler of circular economy solutions for obsolete electric vehicle battery systems. Resour. Conserv. Recycl. 2021, 174, 105735. [Google Scholar] [CrossRef]
- Heymans, C.; Walker, S.B.; Young, S.B.; Fowler, M. Economic analysis of second use electric vehicle batteries for residential energy storage and load-levelling. Energy Policy 2014, 71, 22–30. [Google Scholar] [CrossRef]
- Mazzeo, D. Nocturnal electric vehicle charging interacting with a residential photovoltaic-battery system: A 3E (energy, economic and environmental) analysis. Energy 2018, 168, 310–331. [Google Scholar] [CrossRef]
- Gu, H.; Liu, Z.; Qing, Q. Optimal electric vehicle production strategy under subsidy and battery recycling. Energy Policy 2017, 109, 579–589. [Google Scholar] [CrossRef]
- Tang, Y.; Zhang, Q.; Li, Y.; Li, H.; Pan, X.; McLellan, B. The social-economic-environmental impacts of recycling retired EV batteries under reward-penalty mechanism. Appl. Energy 2019, 251, 113313. [Google Scholar] [CrossRef]
- Zheng, Z.; Chen, M.; Wang, Q.; Zhang, Y.; Ma, X.; Shen, C.; Xu, D.; Liu, J.; Liu, Y.; Gionet, P.; et al. High Performance Cathode Recovery from Different Electric Vehicle Recycling Streams. ACS Sustain. Chem. Eng. 2018, 6, 13977–13982. [Google Scholar] [CrossRef]
- Moore, E.A.; Russell, J.D.; Babbitt, C.W.; Tomaszewski, B.; Clark, S.S. Spatial modeling of a second-use strategy for electric vehicle batteries to improve disaster resilience and circular economy. Resour. Conserv. Recycl. 2020, 160, 104889. [Google Scholar] [CrossRef]
- Zhao, X.; Peng, B.; Zheng, C.; Wan, A. Closed-loop supply chain pricing strategy for electric vehicle batteries recycling in China. Environ. Dev. Sustain. 2021, 24, 7725–7752. [Google Scholar] [CrossRef]
- Rana, S.K.; Kim, H.C.; Pani, S.K.; Rana, S.K.; Joo, M.I.; Rana, A.K.; Aich, S. Blockchain-Based Model to Improve the Per-formance of the Next-Generation Digital Supply Chain. Sustainability 2021, 13, 10008. [Google Scholar] [CrossRef]
- Sun, S.; Wang, X.; Zhang, Y. Sustainable Traceability in the Food Supply Chain: The Impact of Consumer Willingness to Pay. Sustainability 2017, 9, 999. [Google Scholar] [CrossRef]
- Feng, L.; Govindan, K.; Li, C. Strategic planning: Design and coordination for dual-recycling channel reverse supply chain considering consumer behavior. Eur. J. Oper. Res. 2017, 260, 601–612. [Google Scholar] [CrossRef]
- Ghoshal, A.; Kumar, S.; Mookerjee, V. Dilemma of Data Sharing Alliance: When Do Competing Personalizing and Non-Personalizing Firms Share Data. Prod. Oper. Manag. 2018, 29, 1918–1936. [Google Scholar] [CrossRef]
- Wang, L.; Wang, X.; Yang, W. Optimal design of electric vehicle battery recycling network—From the perspective of electric vehicle manufacturers. Appl. Energy 2020, 275, 115328. [Google Scholar] [CrossRef]
- Liu, W.; Yan, X.; Li, X.; Wei, W. The impacts of market size and data-driven marketing on the sales mode selection in an Internet platform based supply chain. Transp. Res. Part E: Logist. Transp. Rev. 2020, 136, 101914. [Google Scholar] [CrossRef]
- Shao, Y.; Deng, X.; Qing, Q.; Wang, Y. Optimal Battery Recycling Strategy for Electric Vehicle under Government Subsidy in China. Sustainability 2018, 10, 4855. [Google Scholar] [CrossRef]


Publisher’s Note: MDPI stays neutral with regard to jurisdictional claims in published maps and institutional affiliations. |
© 2022 by the authors. Licensee MDPI, Basel, Switzerland. This article is an open access article distributed under the terms and conditions of the Creative Commons Attribution (CC BY) license (https://creativecommons.org/licenses/by/4.0/).