Abstract
Prefabricated walls are frequently utilized as retaining structures in different applications. A new type of prefabricated greening ecological retaining wall (PGERW) is proposed in this research. Full-scale tests and numerical simulations were conducted to investigate the stress characteristics of the PGERW. To this end, the load–stress relationship, load–displacement relationship, and crack development of the retaining wall columns were carefully evaluated. It was found that when the load acting on the 3 m high column reached the ultimate load-bearing capacity (about 150 kN), an “arc + 7”-shaped crack pattern emerged. A V-shaped crack composed of bolt–chamfer cracks formed when the load applied to a 2.5 m high column reached the ultimate load-bearing capacity (about 335 kN). The design of hollow thin-walled columns can effectively reduce the amount of concrete used and, as a consequence, reduce its carbon emissions, while meeting the design strength requirements of the retaining wall. The PGERW addresses the challenges of improving the extent of greening and drainage performance of traditional prefabricated retaining walls. It has excellent applicability to highway slope construction and therefore can be applied in several contexts.
1. Introduction
As commonly used retaining structures, retaining walls (RWs) are extensively utilized in highways, railways, tunnels, and other applications. At present, there is a clear lack of the greening function in the traditional RWs. Because of noise, dust, vibrations, and other hazards generated during construction, the cast-in-place RWs may have adverse influences on the environment and can negatively impact human physical and mental health and quality of life. Although prefabricated RWs have been used in the past, their sustainable adoption is still limited by the low extent of greening and poor drainage performance. Therefore, improvements are required to achieve an efficient structure through integrating the advantages of greening, a high extent of prefabrication, and good drainage performance.
The commonly used RWs include the gravity RWs [1,2], which rely on the balance between the self-weight of the RW and the earth pressure to maintain the stability of the wall and have disadvantages including long construction periods and poor greening function; gabion RWs [3,4], which are flexible gravity retaining structures formed by stacking gabion cages containing various grades of stone in an orderly manner; reinforced earth RWs [5,6], which are formed by adding steel bars in the soil to stabilize the soil by the friction between the steel bars and the soil, but their construction quality is greatly affected by the construction site factors and slope surfaces are required to be gentle; cantilever/counterfort RWs [7,8], which maintain stability by the weight of the fill on the bottom plate but have the disadvantages of complex construction technology, long construction periods, and excessive corrosion of drain pipes; and sheet pile walls [9,10,11], which uses baffles to block the soil between the deeply buried piles and they have similar disadvantages to those of the cantilever/counterfort RWs.
The greening ecological RWs not only have the function of landscape, but also can achieve a certain effect in preventing soil erosion, so they are widely promoted and applied in engineering construction. The commonly used greening ecological RWs include the eco-concrete RWs [12], in which the large aggregates are bonded together through eco-concrete, and some soil and fertilizer can be added to the gaps between the aggregates to provide an environment for plant growth. However, because the eco-concrete RWs retain too many holes in the process of pouring and forming, the overall strength of the RWs and the adaptability to deformation is weak. For this reason, the eco-bag RWs [13], flexible retaining walls made of special eco-bags (with certain water permeability and strength), have been introduced. The eco-bag is filled with soil and fertilizers for plant growth, and plants can be planted on the surface of the eco-bag. However, after the eco-bag enters the water, the soil in the bag easily hardens into a block, which is not conducive to the drainage of the RWs. In gabion RWs [3,4], the grid is filled with planting substrate for plant growth, but the planting substrate is easily washed away by water when the water flow rate is high, which is not conducive to the long-term growth of plants. Geocell retaining walls [14] are assembled from a honeycomb three-dimensional cell structure filled with multiple layers of soil and stone. Plants can be directly planted on the geocell, but the water permeability is poor. There are also some studies on designing environmentally sustainable systems by improving building material properties; for example, Laila et al. [15,16] used renewable resources (granite pulver) as concrete material to achieve resource recycling.
Regarding the connection of prefabricated concrete structures, Sun et al. [17] developed a new method adopting high-strength bolts, connecting steel frames, embedded boundary steel frames, and steel jackets. They also researched the structures’ load-bearing capacity characteristics during failure. Ding et al. [18] carried out full-scale tests on concrete units connected by grade 5.6 and 8.8 bolts and explored the effect of the bolt strength on the seismic performance of connection joints. An FEA was also performed using the ABAQUS software, and the experimentally observed data were compared with the simulation results. By applying a variety of connection methods in the core area of concrete unit joints, Liu et al. [19] investigated the performance of specific joints of a full-scale precast concrete structure. Several key performance characteristics, including failure modes, hysteretic behavior, strength, deformation performance, and stiffness degradation, were examined under low-cycle reverse loading, and a novel cross-lapping connection method for concrete slabs was proposed.
The investigations on the load-bearing characteristics of sheet pile walls include the study of Mattos et al. [9], who evaluated several limit equilibrium design methods available in international standards and manuals using the suggested probabilistic design procedure based on multiphase Monte Carlo simulations. The results revealed that the safety coefficient and soil/wall friction significantly affect the relative conservativeness of these design methods. Based on model tests, Ming et al. [10] discussed the factors affecting the deformation of sheet pile walls with pressure relief platforms and provided suggestions for the rational values of sheet width and buried depth. Taku et al. [11] performed a 2D FEA of cantilever sheet pile walls using the ABAQUS software. The effects of varying friction angle and related parameters, such as the expansion angle and interfacial friction coefficient between the earth walls, on the crucial performance indicators were examined. A comparison of the results yielded by the traditional earth pressure coefficient method and those of the FEA revealed that the proposed method was suitable for rapid design and analysis of sheet pile walls.
The present study used the sheet pile wall and cantilever RW concept and developed prefabricated greening ecological retaining walls (PGERWs) suitable for heights of 1–5 m. The proposed PGERW comprises precast hollow thin-walled columns and 0.15 m thick walls, a shutter-shaped retaining slab structure, inclined supports, and a cast-in-place bottom slab. The retaining slab and thin-walled columns are connected by the precast inclined supports; the connections between inclined supports and thin-walled columns, retaining slab and inclined supports, and thin-walled columns and cast-in-place bottom slab are provided by bolts. Grade C30 concrete was assumed for both the bottom slab and the column. When the height of the PGERW is between 1 and 3 m, single columns can usually be used, while for a PGERW higher than 3 m, the upper column and the 2.5 m lower column are combined to form a 3.5~5 m RW. Considering that the load-bearing characteristics of such PGERWs are unknown, full-scale destructive tests were performed on the thin-walled columns of PGERWs. The load-bearing characteristics and crack development were also determined using 3D numerical simulations.
2. Structural Characteristics of PGERWs
2.1. Structure
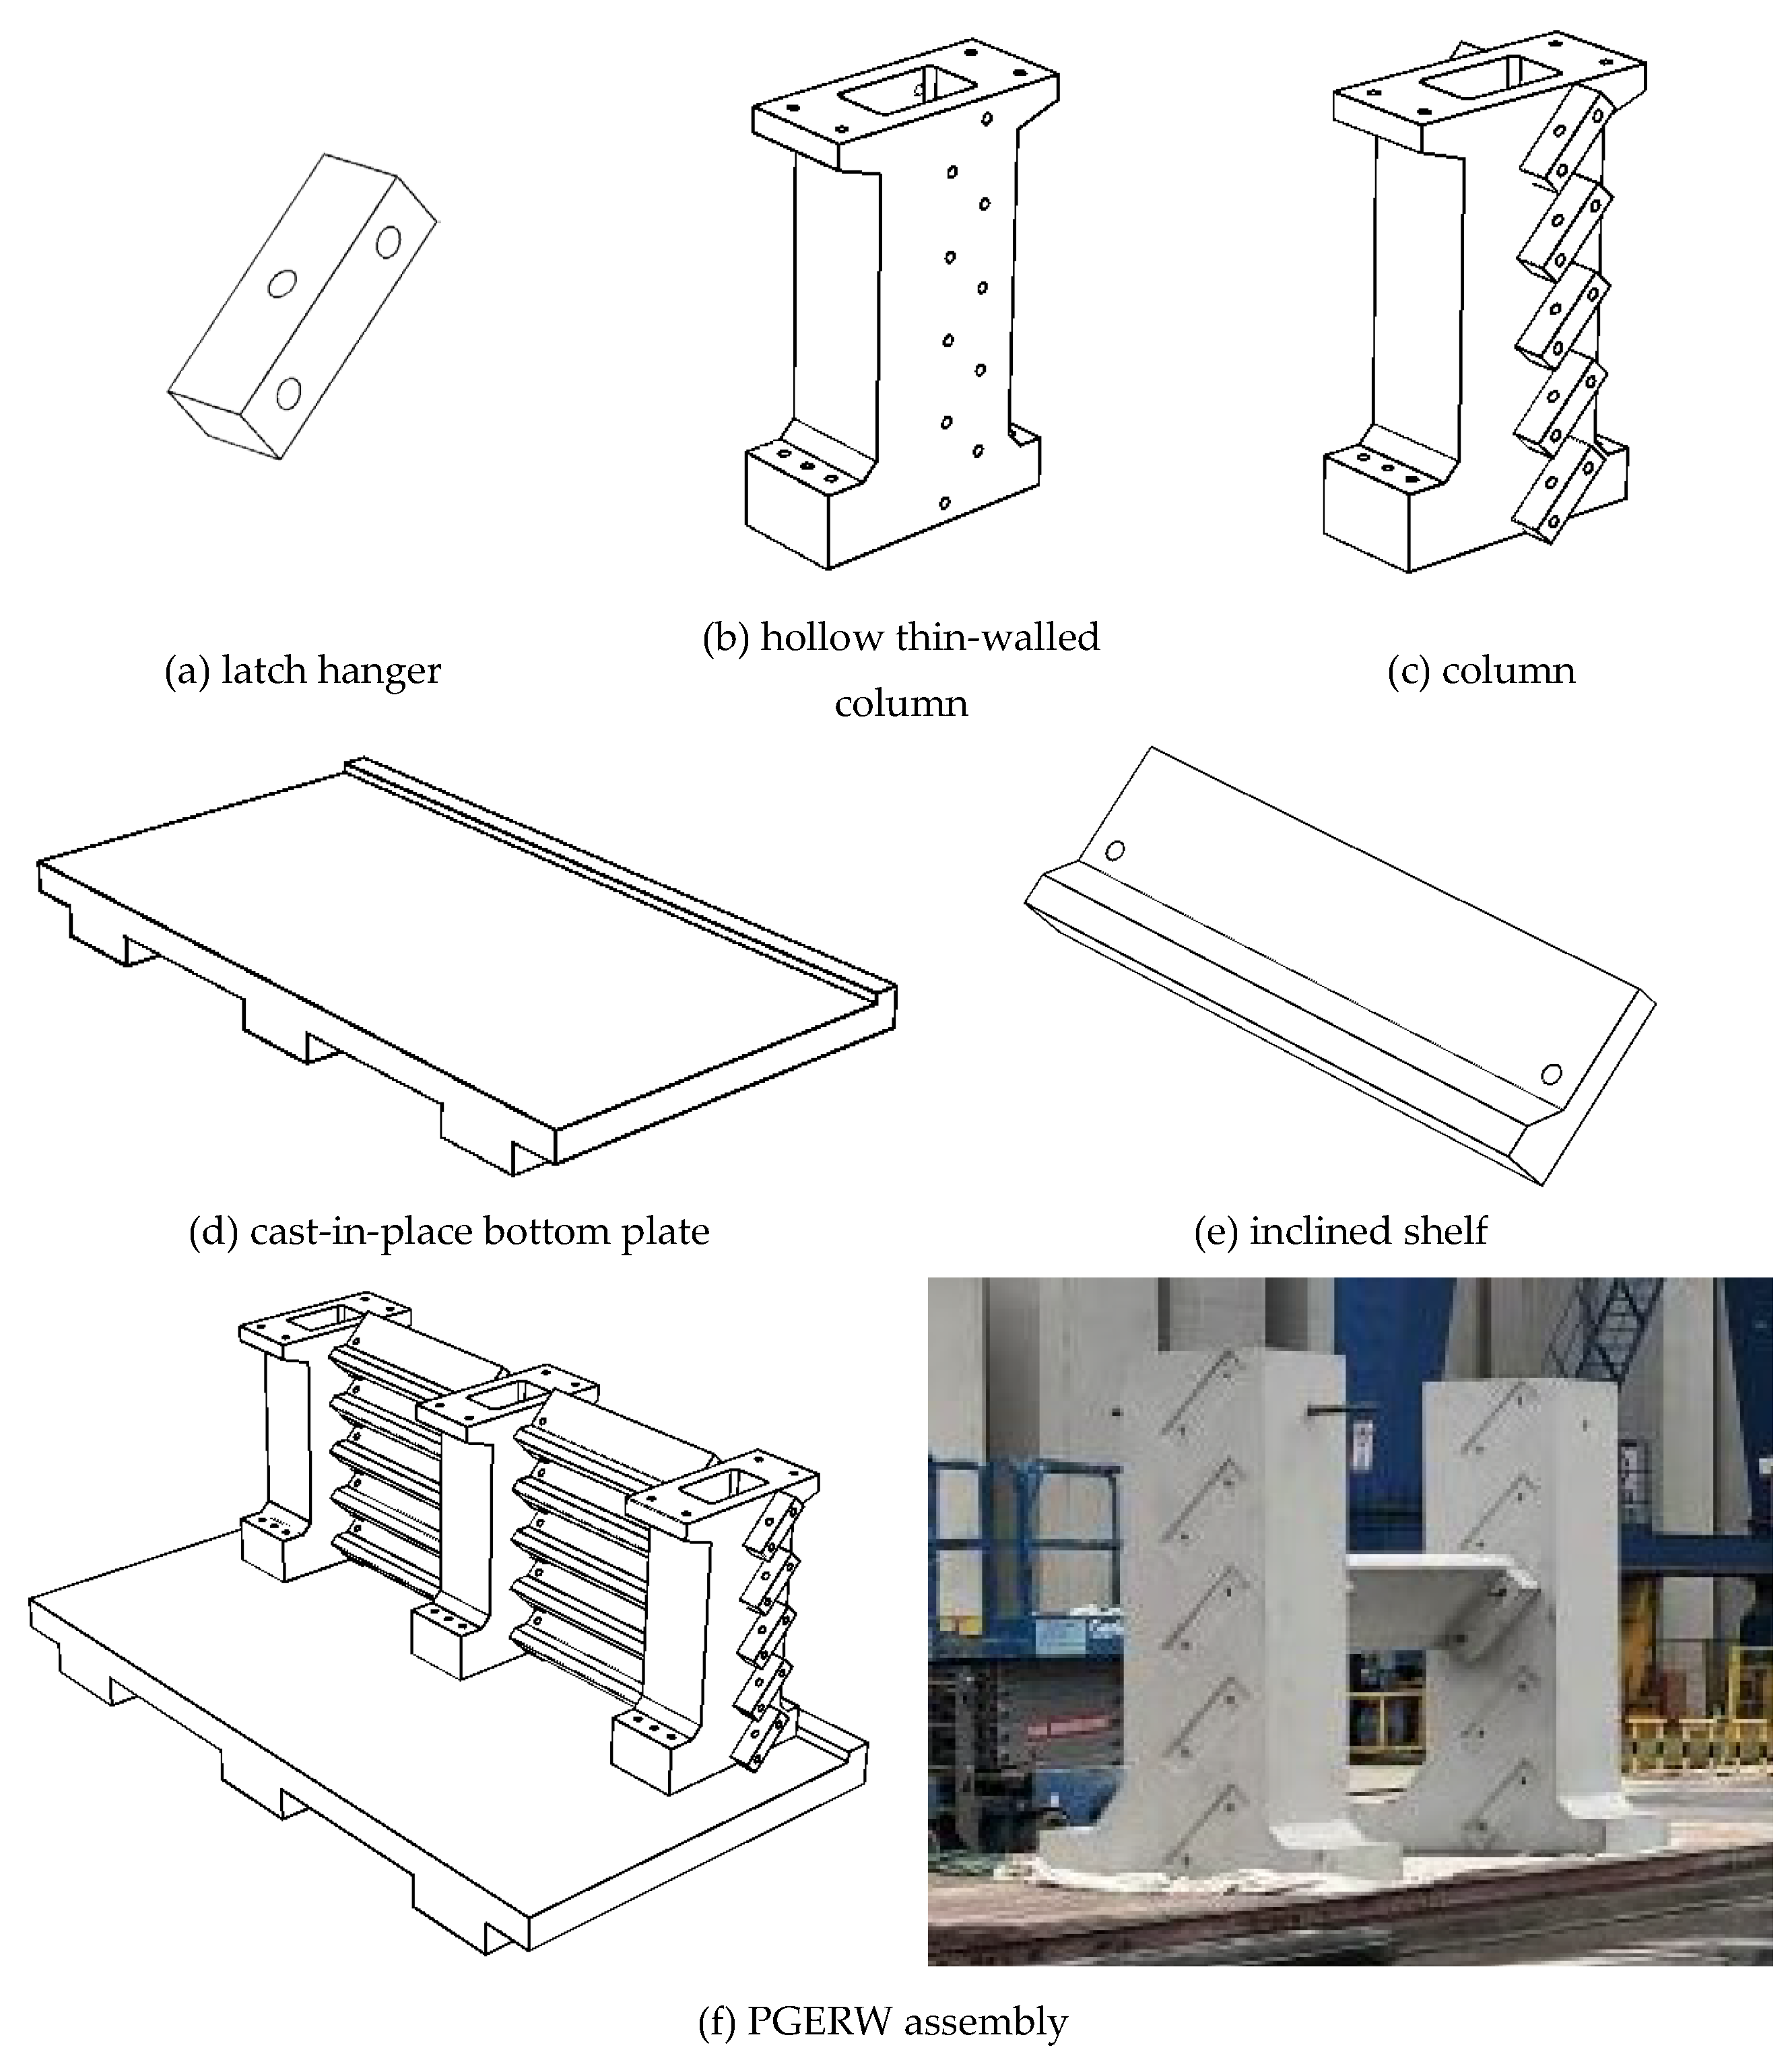
The PGERWs, whose height can be adjusted, are generally composed of columns, latch hangers, and inclined shelves. The positioning latch hangers are added to the two sides of the columns to support the inclined shelves. The bottom is fixed on the construction site through the cast-in-place bottom plate. The structure of a PGERW is shown in Figure 1.
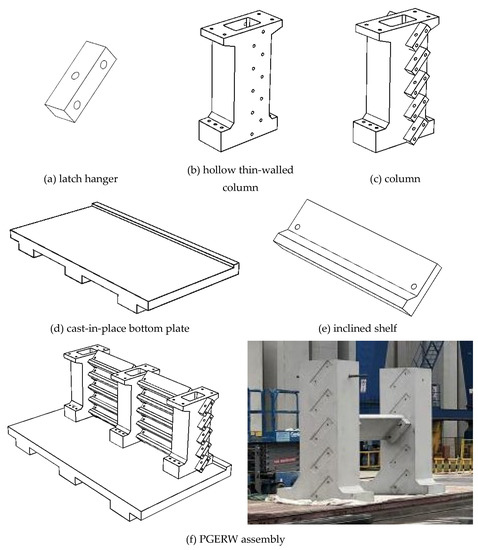
Figure 1.
Structural diagram of PGERW.
2.2. Advantage
The components of PGERWs are modularly manufactured at the factory with strict quality control, enhancing the consistency and uniformity of the materials during mass production and therefore improving the durability of the final product.
The column is designed as a hollow thin-walled structure, which can effectively reduce the amount of concrete and carbon emissions. The precast parts of the PGERWs have a simple structure and prefabrication process using lightweight molds and can easily be transported. These characteristics enable relatively easy lifting of the precast parts during the construction process without the need for a large-capacity crane, reducing the dependency on the construction site environment and ground stiffness.
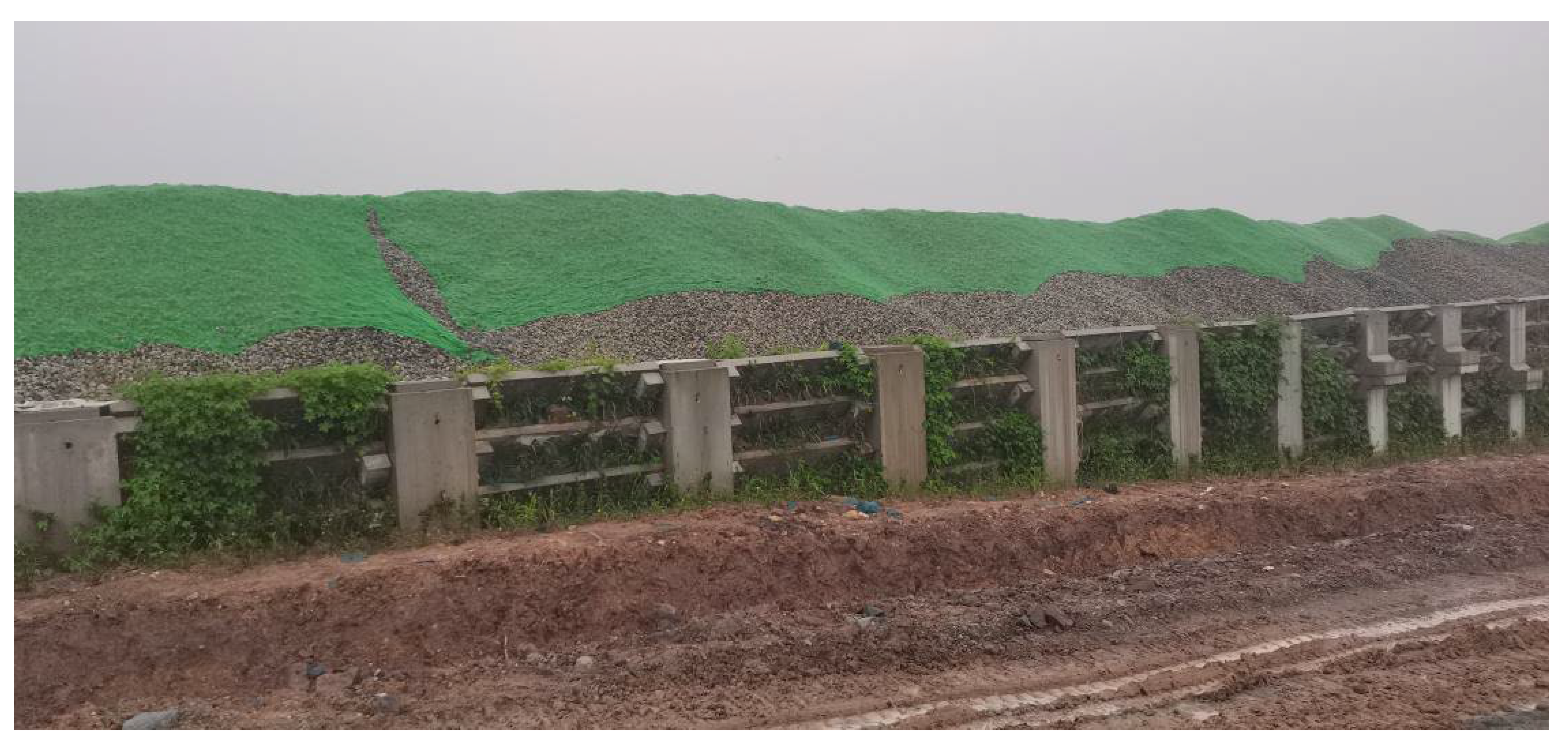
After the PGERWs are assembled on the construction site, placing biodegradable eco-bags filled with soil and fertilizer for plant growth on the inclined shelves can effectively promote plant growth. The inclination angle formed by the inclined shelves can ensure the smooth discharge of the water without the need to add drain holes. This avoids the problems caused by blocked drain holes and ensures efficient drainage. Figure 2 shows the greening effect of PGERWs after 6 months of construction.
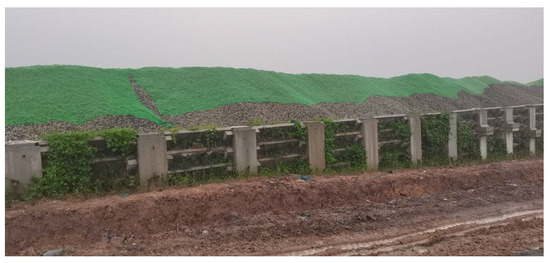
Figure 2.
The greening effect of PGERWs.
3. Methodology
In the single-column RW system, the 1.5, 2, 2.5, and 3 m high RWs have almost similar structural forms and force transfer mechanisms. Meanwhile, classical soil pressure theories (e.g., Rankine’s and Coulomb’s earth pressure theories) indicate that the resultant soil force acting on the RW is directly proportional to the square of its height under the normal use condition. Therefore, the 3 m high RW is subjected to the largest earth pressure, representing the case with the highest potential risk of destruction. In the present study, a full-scale destructive test was performed on both 3 m and 2.5 m high columns of single-column RWs, and the test results were compared with numerical simulations. The main goal was to obtain consistent and accurate results providing a basis for the successful construction of the future in situ test section.
3.1. Design of Full-Scale Test
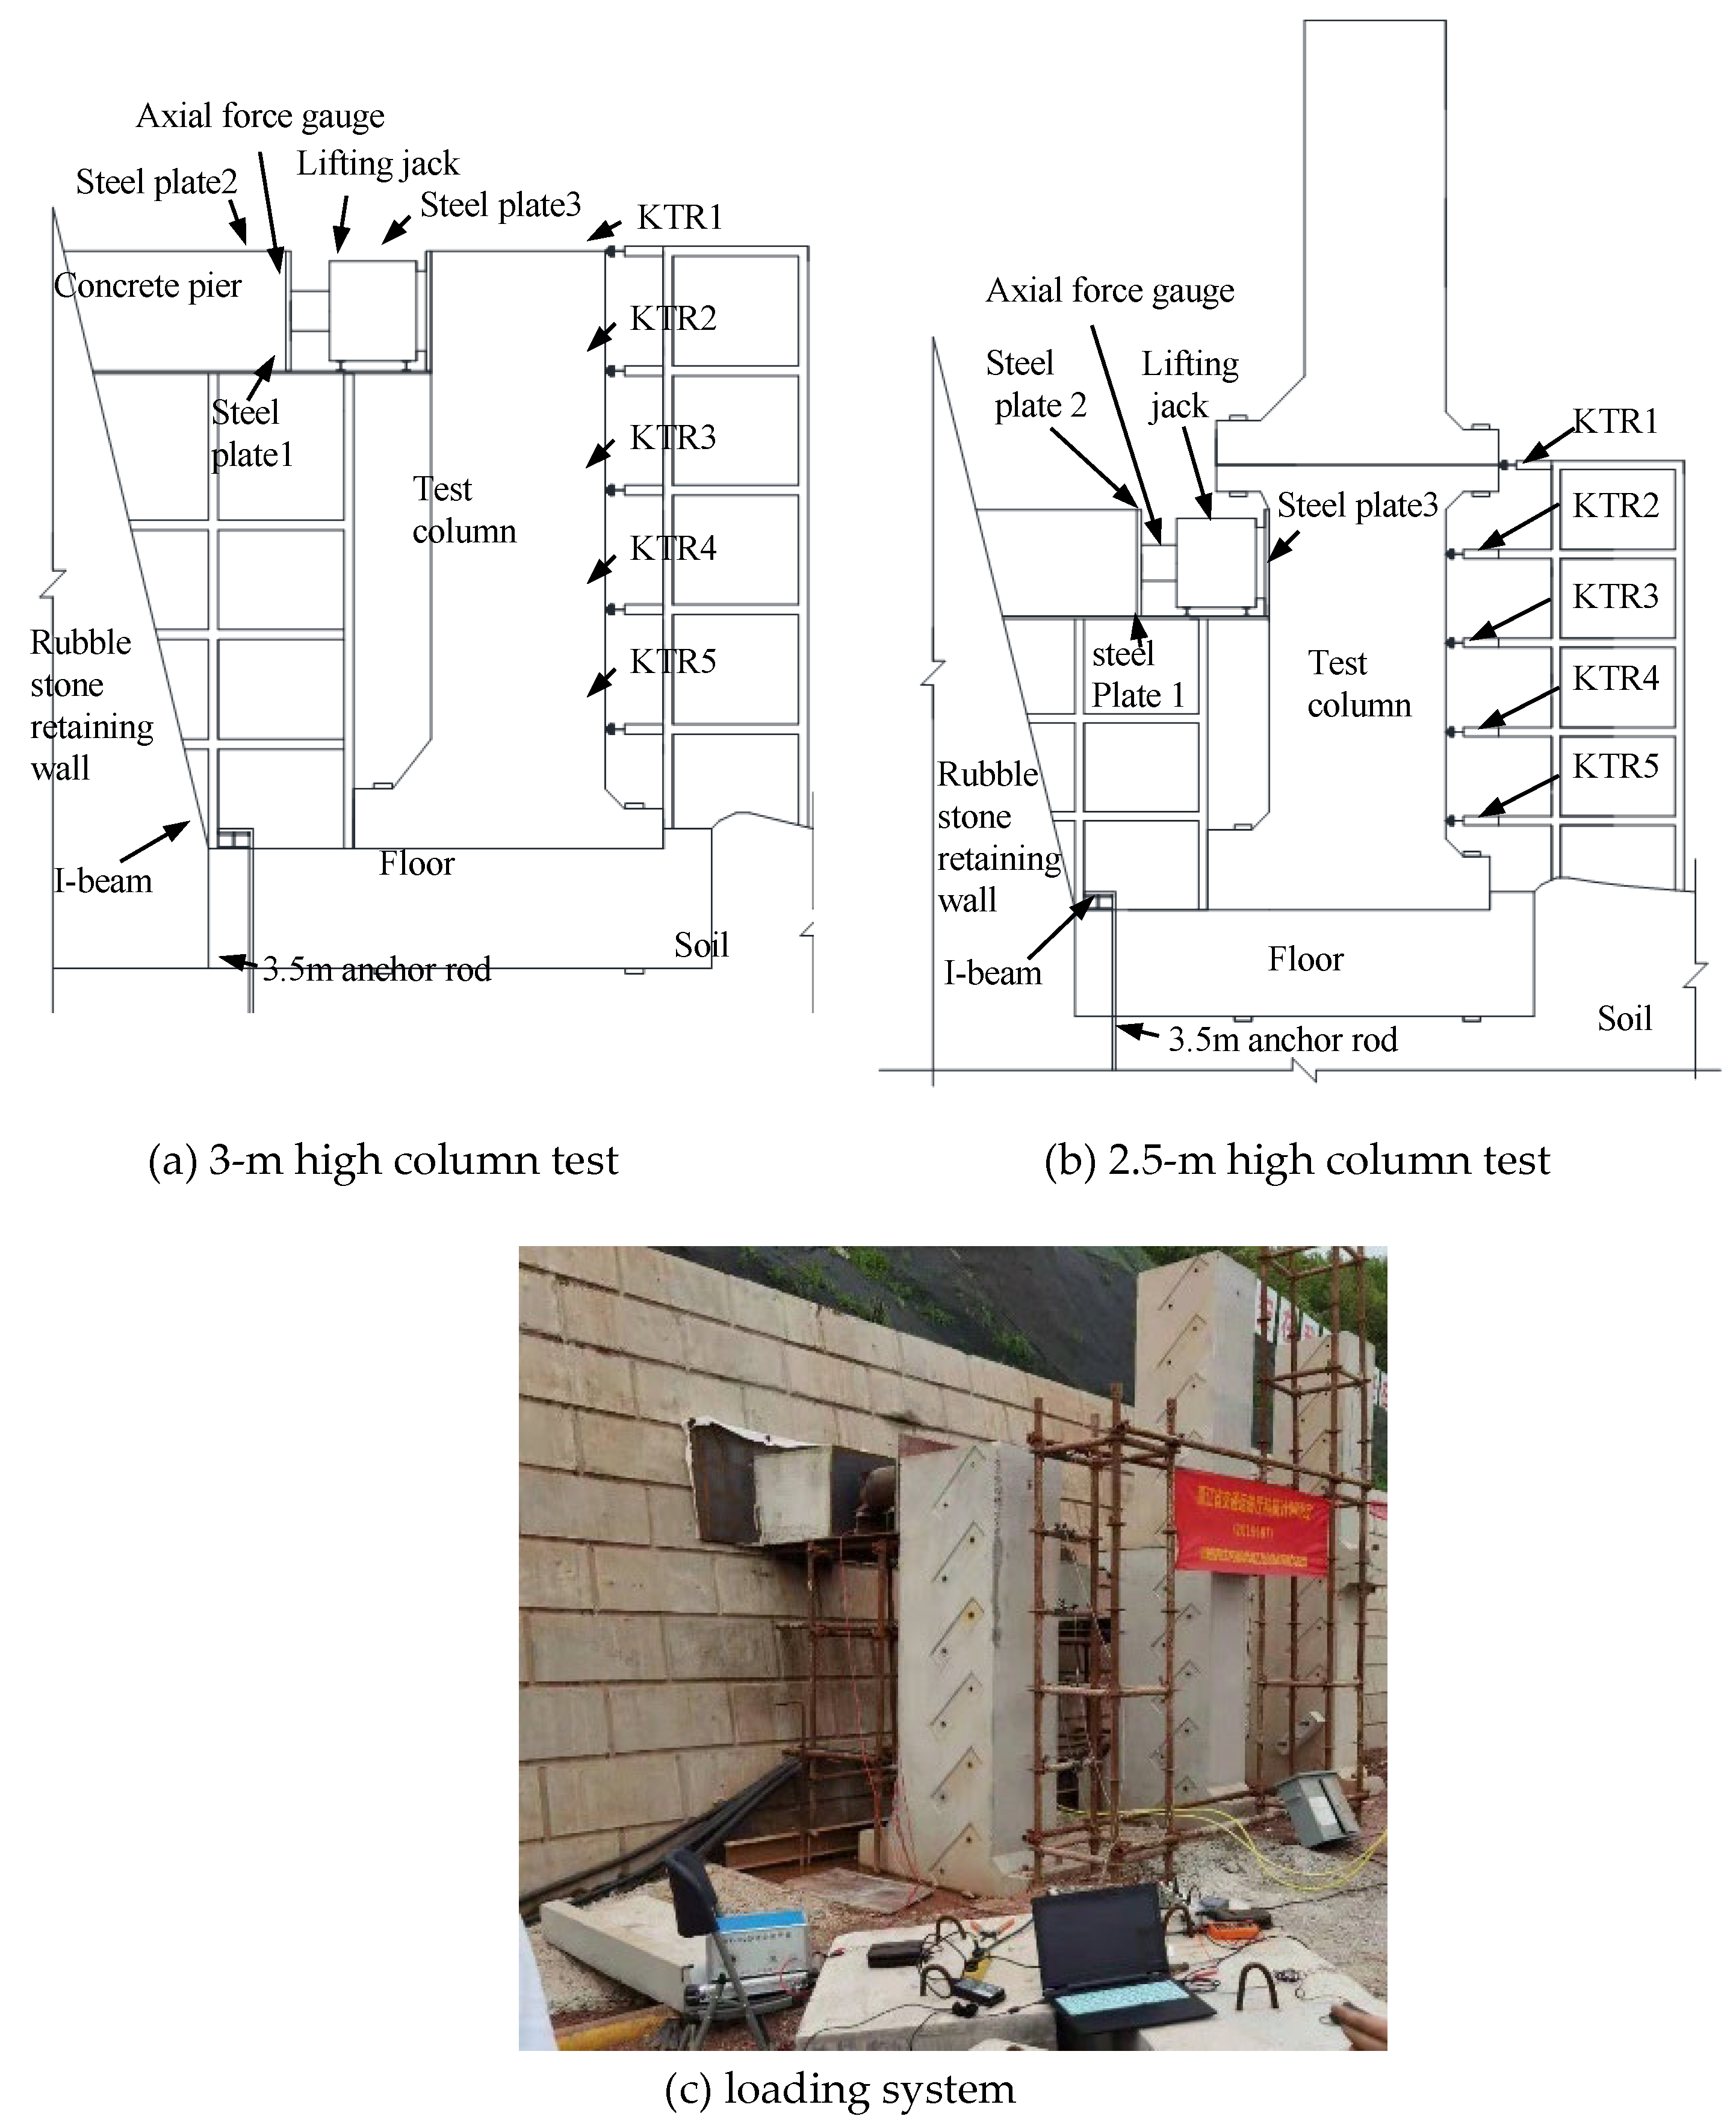
The experimental loading arrangement is shown in Figure 3. A scaffold made of Ø50 steel tubular sections was utilized as the support, on which 15 mm steel plates were placed to form a platform. Subsequently, the concrete piers were cast in situ on the upper part of the steel plates, before which an axial force gauge was installed, and a lifting jack was placed in front of the axial force gauge. After that, 15 mm thick steel plates were placed between the axial force gauge and the concrete pier and between the lifting jack and the column to convert the point load into the surface load. Meanwhile, an anchor rod was embedded into the structure to avoid overturning the whole wall during the test. In addition, self-recovery linear displacement sensors (KTR) were placed in front of the RW.
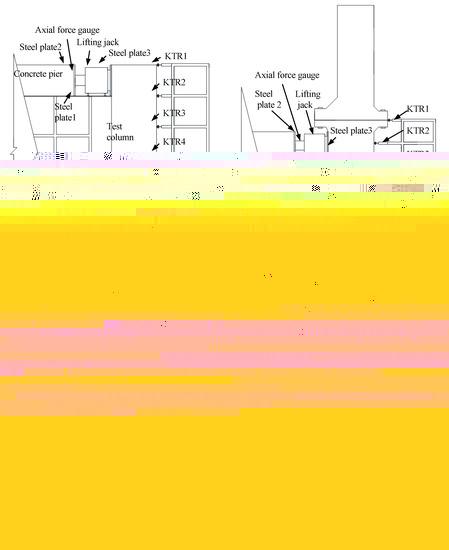
Figure 3.
Loading arrangements for the two types of columns.
To simulate the maximum earth pressure action on the columns and achieve the ultimate load-bearing capacity, the driving force of the loading jack was made equivalent to this earth pressure. The loading jack was located such that it acted at the top of the column to achieve the largest possible bending moment (see Figure 3a). However, the loading jack could not be arranged to act at the top of the 2.5 m high column due to the local variation in its cross-section; hence, it was placed to act 2.1 m away from the column bottom (see Figure 3b). A cast-in-place bottom slab was poured and connected to the columns using high-strength bolts.
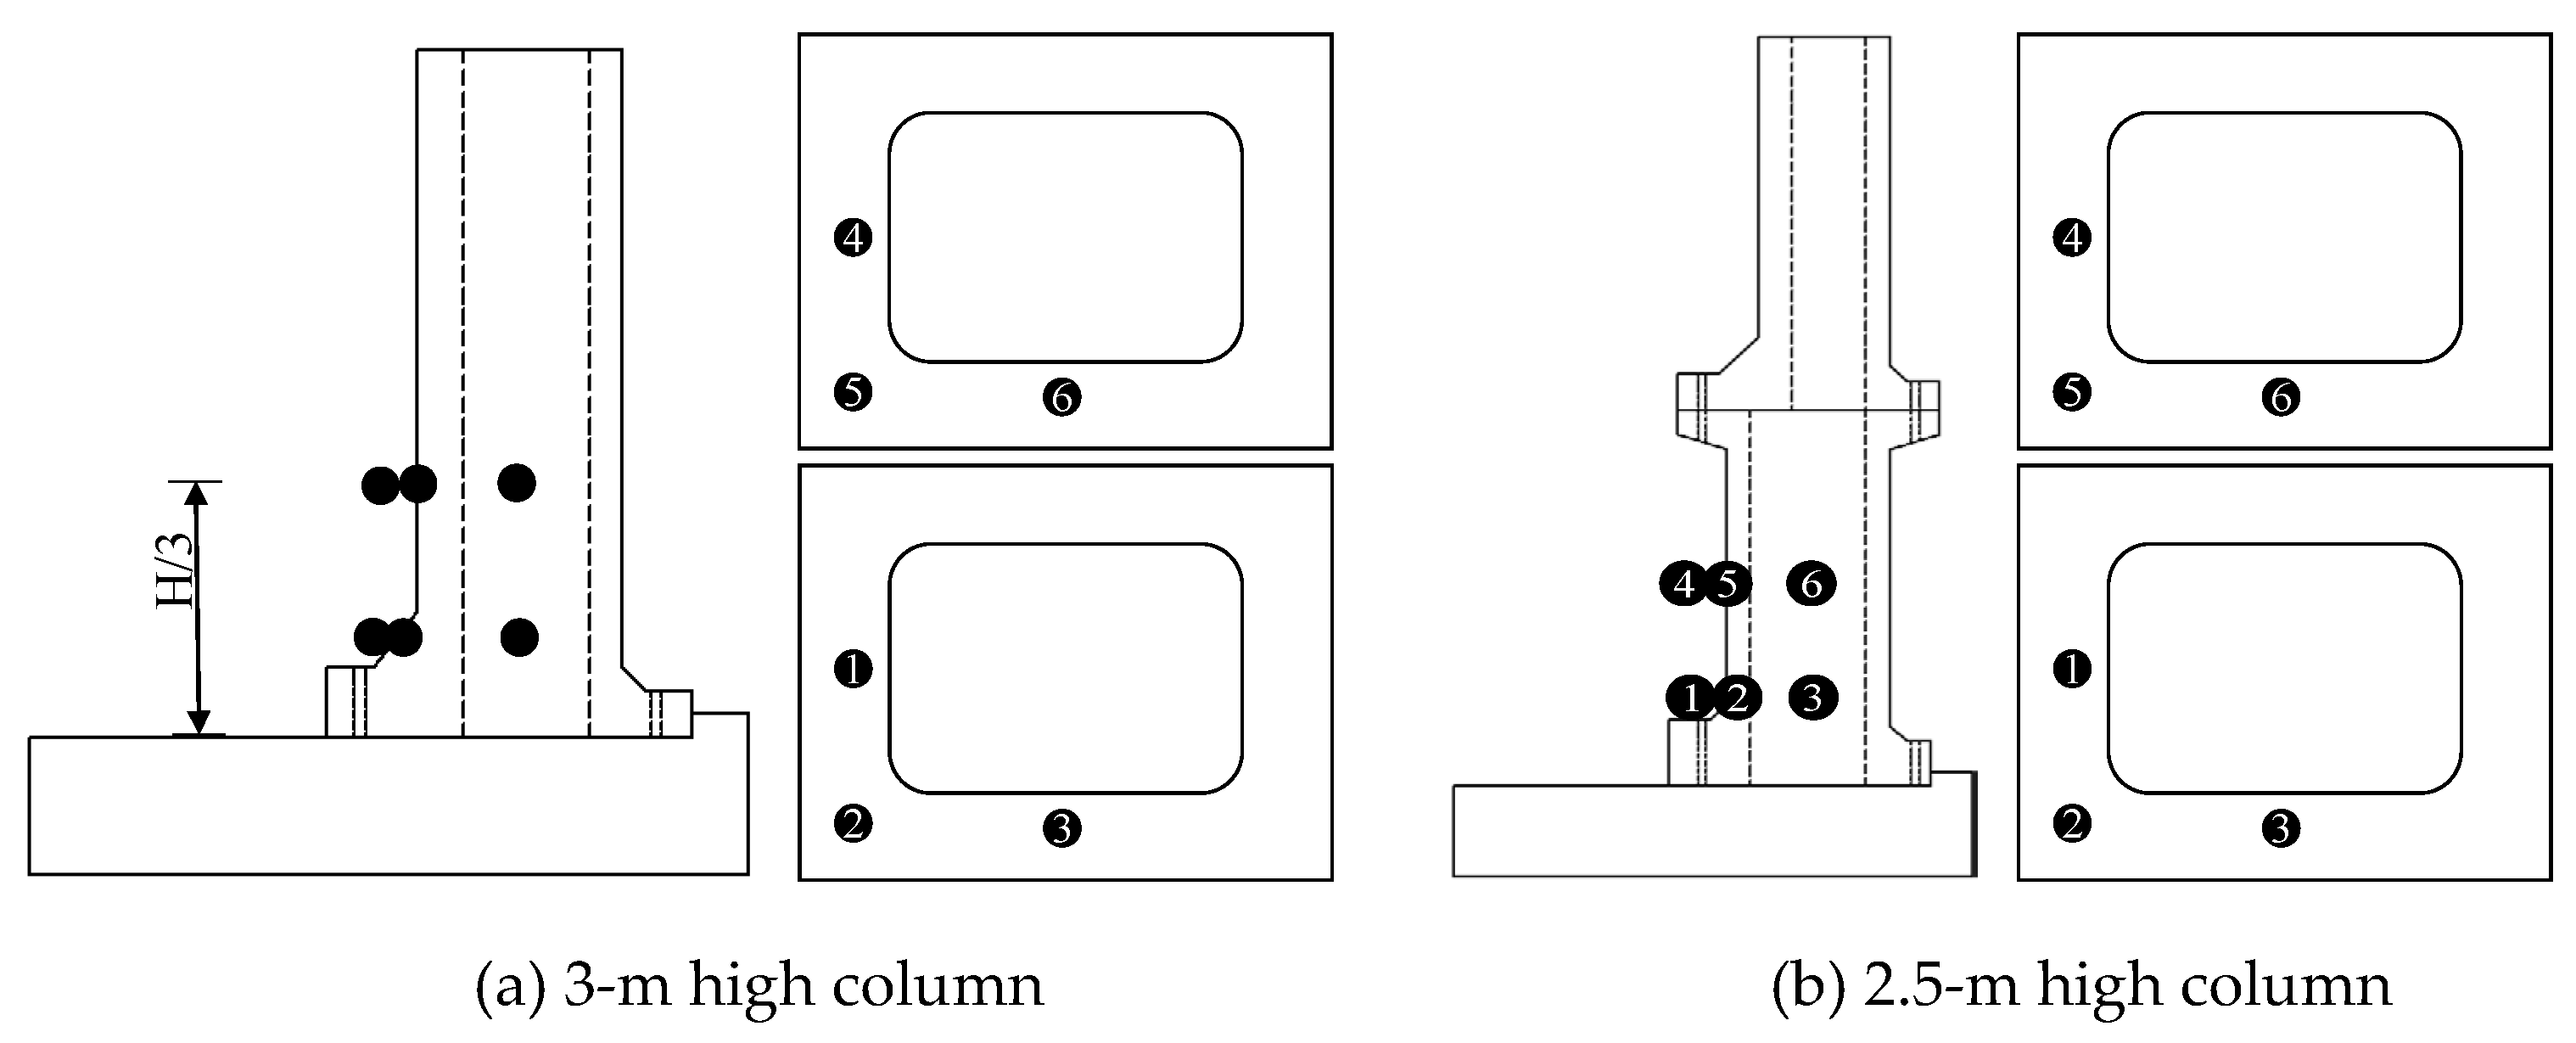
Based on soil mechanics principles, the application point of the soil pressure resultant force is located at one-third of the column height. Therefore, three strain gauges were embedded in the cross-section at one-third of the column height, close to the soil side (sensor #4), at the corner (sensor #5), and on the column side (sensor #6), respectively. The other three strain gauges were embedded in the cross-section at the chamfer of the column; they were located just below sensors #4-6. The positions of the steel bar strain gauges are exhibited in Figure 4.
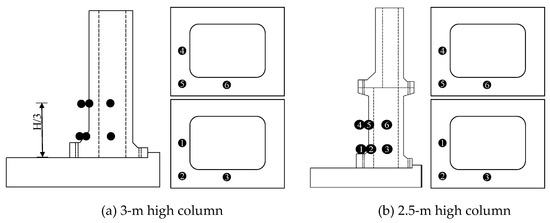
Figure 4.
Sensor locations.
3.2. Numerical Model Building
ABAQUS software was adopted to simulate the destructive test on the column of the PGERW. The model was established through the “part” module that comes with ABAQUS. The mesh size of the 3-meter column was 50 mm, and that of the 2.5-meter column was 100 mm. The model was established using eight-node hexahedral solid elements (C3D8). The steel reinforcement cage inside the column was modeled using truss elements (T3D2). The established model was assembled through the “assembly” module and set the contact in the “interaction” module. The tangential direction of the column and the bottom plate adopted "penalty algorithms", and the normal direction adopted "hard contact". The column and the upper bearing steel plate adopted "tie contact", the reinforcement cage was embedded in the concrete structure using the "embedded region", and then the constraints were set in the “load” module. The load was simplified to a concentrated load at the center of the steel plate. The bottom slab was considered to be fully fixed; i.e., the displacements along the x-, y-, and z-axes were fully constrained. To simulate the response and damage of the column under the action of multi-level loading, multiple analysis steps were set in the step module to simulate the step-by-step loading process.
The concrete damage constitutive model was adopted after GB50010-2010 and is shown in Figure 5a. The dilatation angle is 30°, the flow potential offset is 0.1, the ultimate strength ratio between biaxial compression and uniaxial compression is 1.16, the invariant stress ratio is 0.667, and the viscosity coefficient is taken as 0.0005 in the damage plastic model. HRB400 steel bars were assumed, the thickness of the steel plate was 2 cm, and PSB1080 bolts were adopted. Since the physical tests were stopped when the concrete cracks became obvious, the steel rebars did not yield and the elastic constitutive model was selected for simulations. The load was simplified to a concentrated load at the center of the steel plate. The bottom slab was considered to be fully fixed; i.e., the displacements along the x-, y-, and z-axes were fully constrained. The structural parameters of the numerical model are listed in Table 1, and the model is shown in Figure 5.
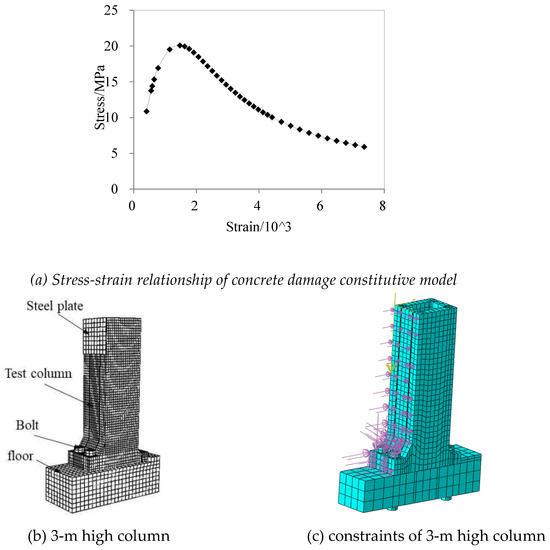
Figure 5.
Stress–strain relationship of concrete damage constitutive model and meshes adopted in FEA.

Table 1.
Structural parameters of the numerical model.
3.3. Parameters of Loading System
As explained previously, to obtain large bending moments, the loading jack was placed to act on the top of the 3 m high column and at 2.1 m of the 2.5 m high column. According to the calculation method for the active earth pressure acting on embankment RWs under uniform load [20], the resultant force of the earth pressure was calculated as 115 kN, and the bending moment at the column bottom was calculated as 115 kN·m. Since the loading jack had a large size and applied a distributed force onto the RW, this force was converted into a resultant force. The application point of the resultant force of the loading jack was located 2.7 m away from the column bottom. Further, the resultant force was equated to a concentrated force of 42.6 kN at 2.7 m. Similarly, for a 5 m column, the equivalent concentrated force applied at about 2.1 m from the bottom would be equal to 291.5 kN.
4. Analysis of Full-Scale Column Test Results
4.1. Changes in Steel Rebar Strains after Pouring of RW Columns
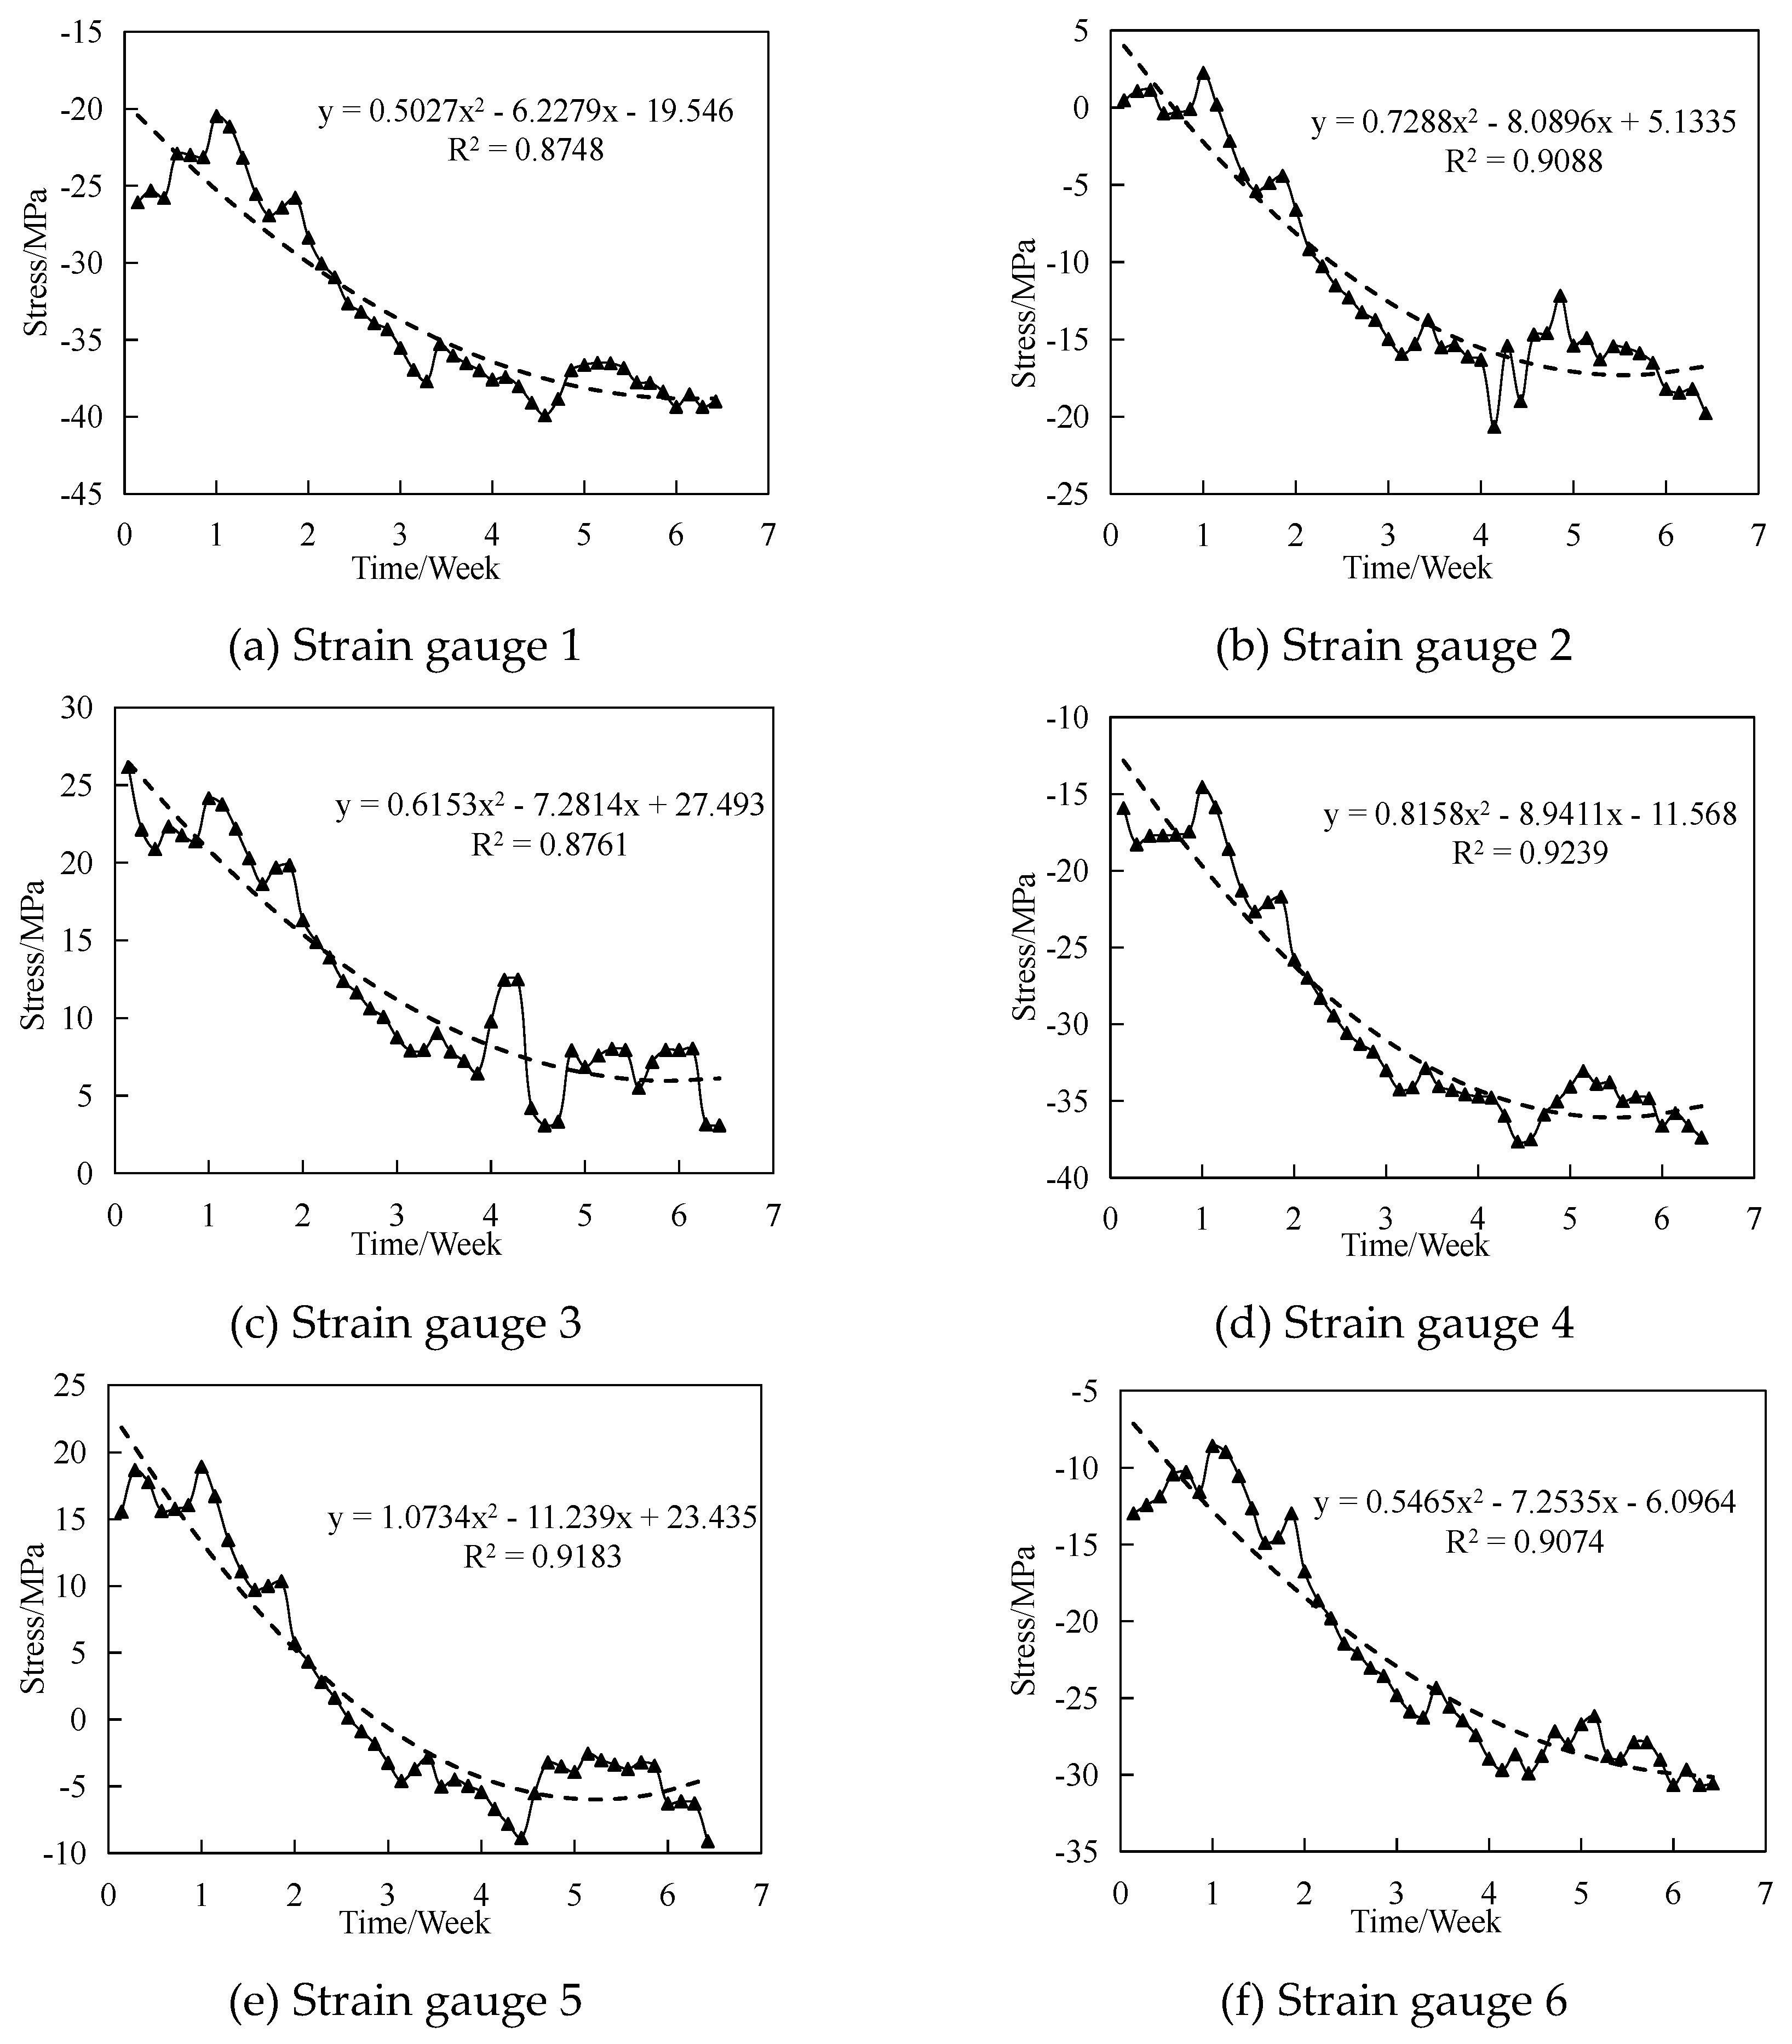
The initial frequency of the steel bar strain gauges embedded in the concrete structure is influenced by the phase change, hydration heat, and environmental factors. Because the concrete bleeding rate after pouring is lower than the evaporation rate of the concrete surface, a negative pressure is generated in the capillary tubes, causing plastic shrinkage and deformation of the mud. Moreover, the hydration heat generated during concrete hardening influences the readings of the steel bar strain gauges. These factors simultaneously affect the vibrating wire steel bar strain gauge (VWSBSG) readings, which directly causes the initial frequency to deviate from the fundamental frequency before the gauge leaves the factory. To counteract this, the evolution of the readings of the VWSBSGs embedded in the precast components was carefully observed (see Figure 6).
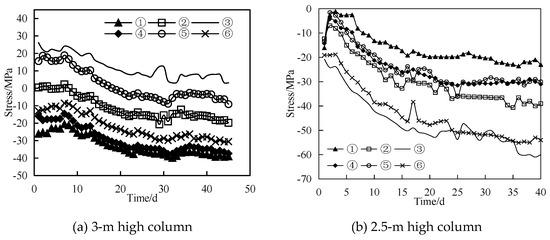
Figure 6.
Time-histories of stresses recovered from strain gauge measurements after column pouring.
As shown in the plotted results, the stress of the VWSBSGs gradually tends to be stable with time, and the readings of the gauges become basically stable at 35 days. Furthermore, the VWSBSGs exhibit various stress values because the shape of the concrete varies from part to part. This issue leads to differences in the influences of the hydration heat and drying shrinkage efficiency of the concrete. It is also found that some VWSBSGs display a phenomenon of tension–compression alternation over time (strain gauges 2 and 5 plotted in Figure 6a). Such a phenomenon can be attributed to the hydration heat of this part of the concrete in the early stage. Specifically, the heat release and expansion induce thermal deformation, the concrete is cooled with the prolongation of time, and the temperature tends to be steady. In the meantime, the concrete continues to bleed outward, leading to drying shrinkage, exerting pressure on the VWSBSGs, and finally, producing the phenomenon of the tension–compression alternation.
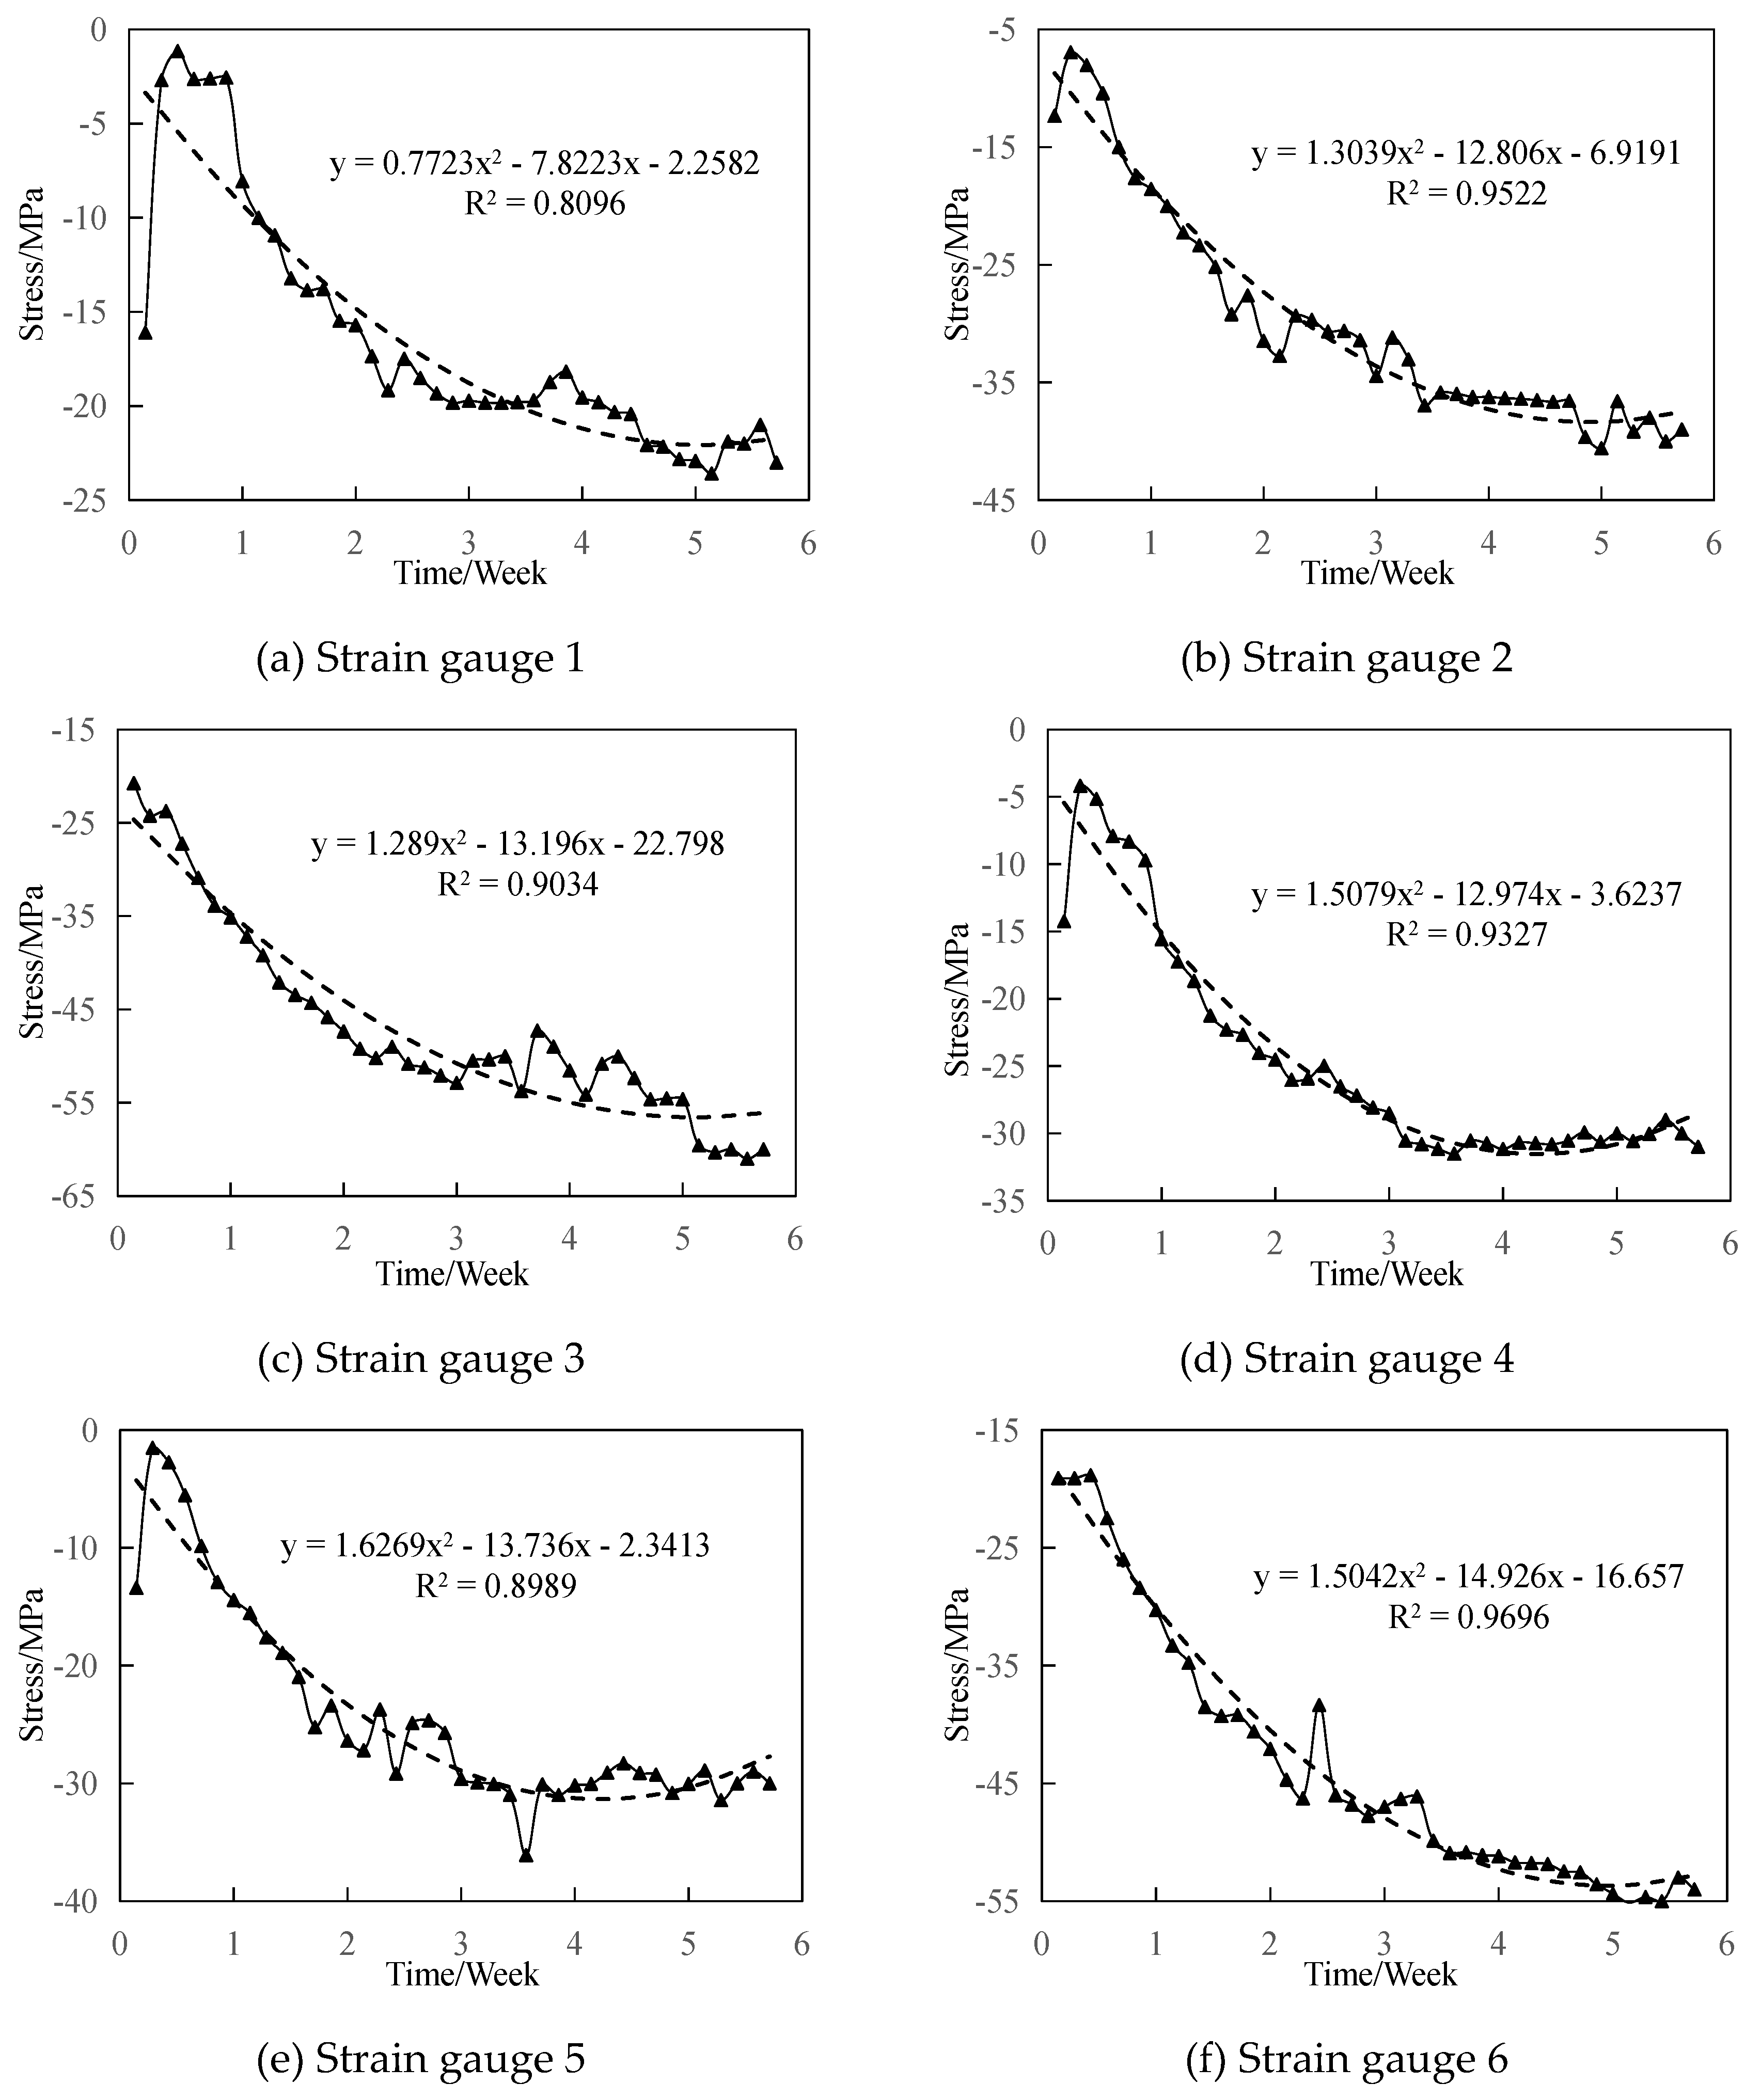
Using Figure 6, the changes in the stress time-histories after the pouring of the RWs were further analyzed based on the strain gauge measurements. The stress time-histories at each strain gauge location for the 3 m high column were fitted with second-order polynomial curves (see Figure 7 and Figure 8). On this basis, the following conclusions were reached: (i) the stresses at different locations changed in similar ways, and the stress trends in the various components in each structure were essentially parallel (see Figure 6), (ii) the final stresses were reasonably predictable and assumed to occur near the minimum of the corresponding quadratic fitting curves at 35 days, (iii) the maximum pressure stress reading of each VWSBSG did not exceed 65 MPa, (iv) the substantial difference between the 2.5 m high column and the 3 m high column was that all the strain gauges embedded in the 2.5 m high column were subjected to pressure. The possible reason was that the maintenance of the structure after pouring was different.
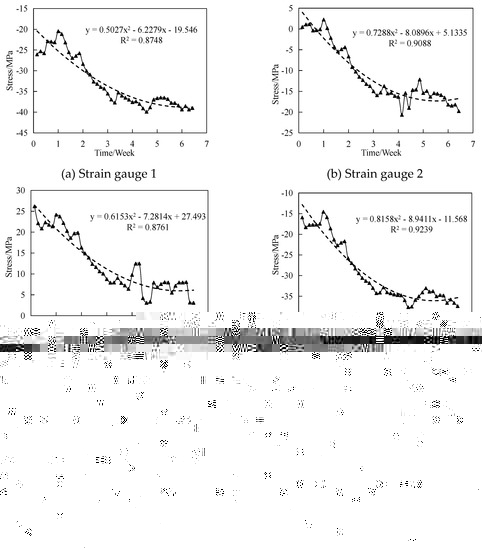
Figure 7.
Time-histories of stresses obtained from strain gauges embedded in 3 m high column.
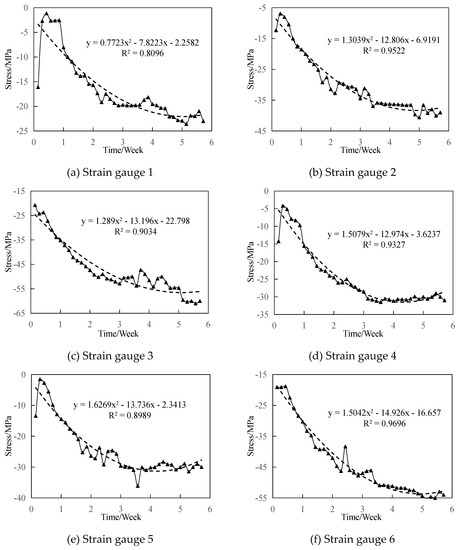
Figure 8.
Time-histories of stresses obtained from strain gauges embedded in 2.5 m high column.
4.2. Load–Stress Relationships for RW Columns
4.2.1. The 3 m High Column
In view of the lack of relevant experiences, the loading step was set to 15 kN and the load was controlled using the readings of the VWSBSGs during the destructive test on the 3 m high column. Then, the crack widths were observed to determine whether the structure reached the serviceability limit state. Moreover, the frequency reduction rate of the axial force gauge and the deformation rate of the structure were evaluated. If the frequency modulus reduction rate of the axial force gauge was greater than the growth rate of the displacement at the column top, it was assumed that the structure reached the ultimate limit state.
The results obtained from the VWSBSGs shown in Figure 9a reveal that the stress in the lateral steel rebars increased with the decrease in the column height and the stresses in rebars in the middle and corner parts grew as the column height increased. It can also be seen that strain gauges 1 and 2 (i.e., those attached to the column chamfer on the soil side) experienced the greatest stresses. Before the applied load reached 60 kN, the stresses in strain gauges 1, 2, 4, and 5 increased roughly linearly with the applied load. The reason was that the whole column was approximately in the elastic range before large cracks formed. When the load exceeded 60 kN, the stress increments of strain gauges 1 and 2 sharply increased, while those of strain gauges 4 and 5 changed from a mildly ascending trend to a gradual descent. This happened because the large cracks in concrete quickly expanded with the growing load, leading to stress redistribution within the whole structure. Furthermore, it can be seen that strain gauges 3 and 6 were subject to almost no stress, which was in agreement with the results predicted by the FEA.
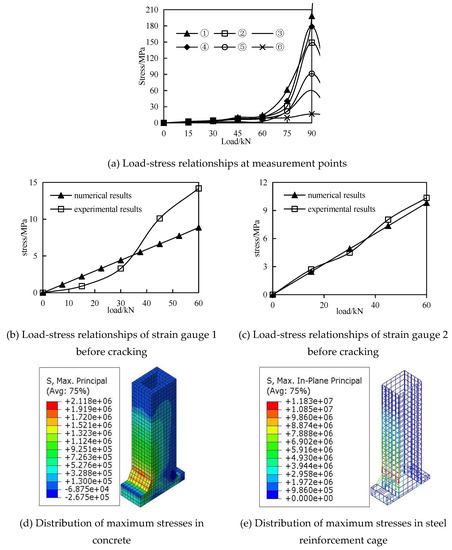
Figure 9.
Load–stress relationships and maximum stress field in 3 m column.
Based on these findings, the resistance of the chamfer at the column back must be appropriately enhanced to provide a larger overall column resistance. To this end, increasing the chamfer height and the reinforcement ratio in the chamfer are highly recommended.
4.2.2. The 2.5 m High Column
Subsequently, we proceeded to perform the full-scale destructive test on the 2.5 m high column. During the previous destructive test on the 3 m high column, the loading step was large due to there being no experience serving as a reference work at present; hence, the results obtained were not detailed enough. Therefore, in the test on the 2.5 m high column, the loading step is set to 7.5 kN, and it is controlled based on the frequency modulus readings of the vibrating wire axial force gauges. Additionally, the limit state of normal use is determined by observing cracks on the structure. Similarly, the frequency modulus reduction rate of the axial force gauge is compared with the deformation velocity of the structure to determine the limit state of the bearing capacity of the column. Specifically, the structure would reach the limit state of the bearing capacity when the frequency modulus reduction rate of the axial force gauge becomes less than the deformation velocity.
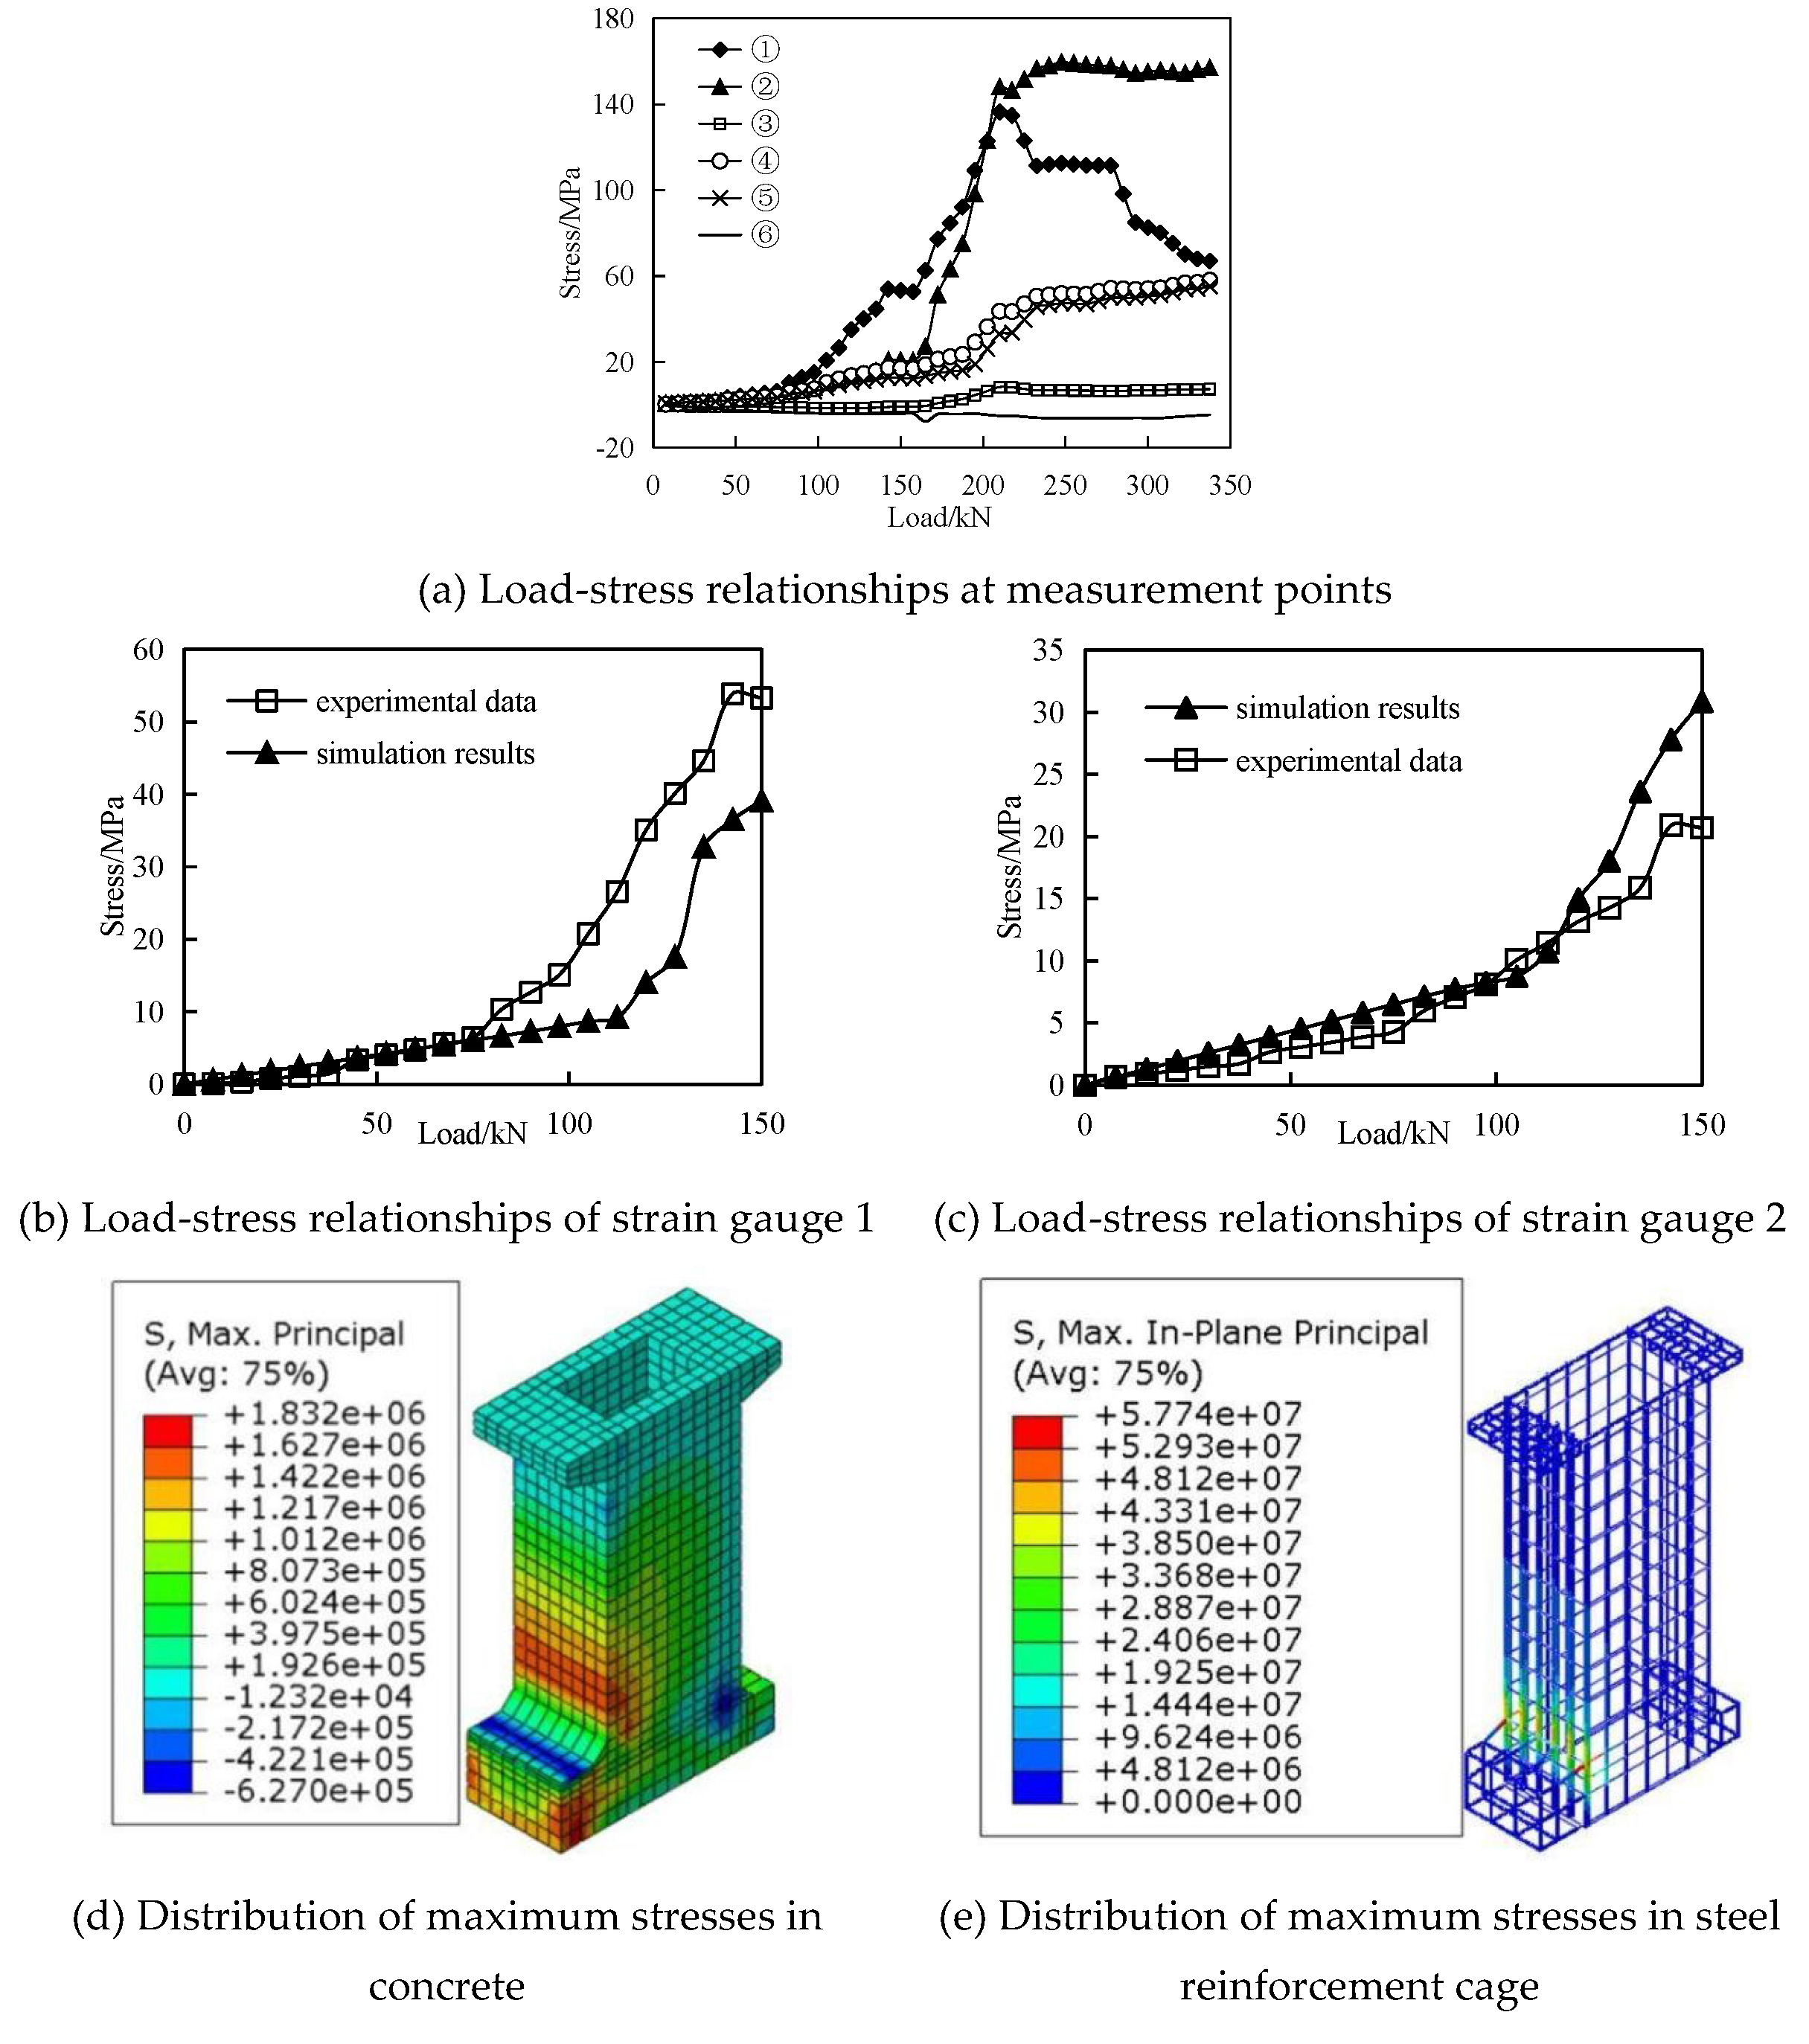
According to Figure 10a, before the load reached 150 kN, the stress within concrete mostly changed linearly because of the small width of the crack that appeared on the concrete surface. Additionally, the width of the concrete cracks increased when the load grew, reaching 0.15 mm at 202.5 kN. After that, the readings of the VWSBSGs no longer increased. The reason was that the large concrete cracks stimulated stress redistribution in concrete, so the frequency readings of the strain gauges remained unchanged or decreased. Similar to the case of the 3 m high column, strain gauges 3 and 6 (on the column side) were exposed to almost no stress, displaying small readings.

Figure 10.
Evaluation of load–stress relationships and maximum stress field in 2.5 m high column.
As shown in Figure 10b,c, the position of the steel bars suffering large stress is represented by strain gauges 1 and 2. It is revealed that the stress of the steel bar is first raised slowly with the growth of the applied load. When the load reaches the ultimate tensile stress of the concrete, the stress of the steel bar incrementally grows with the load, and the slope of the load–stress curve increases (i.e., the increasing rate rises). Meanwhile, it is observed that the stress situation before the appearance of large cracks in the structure is basically consistent with that predicted by the FEA.
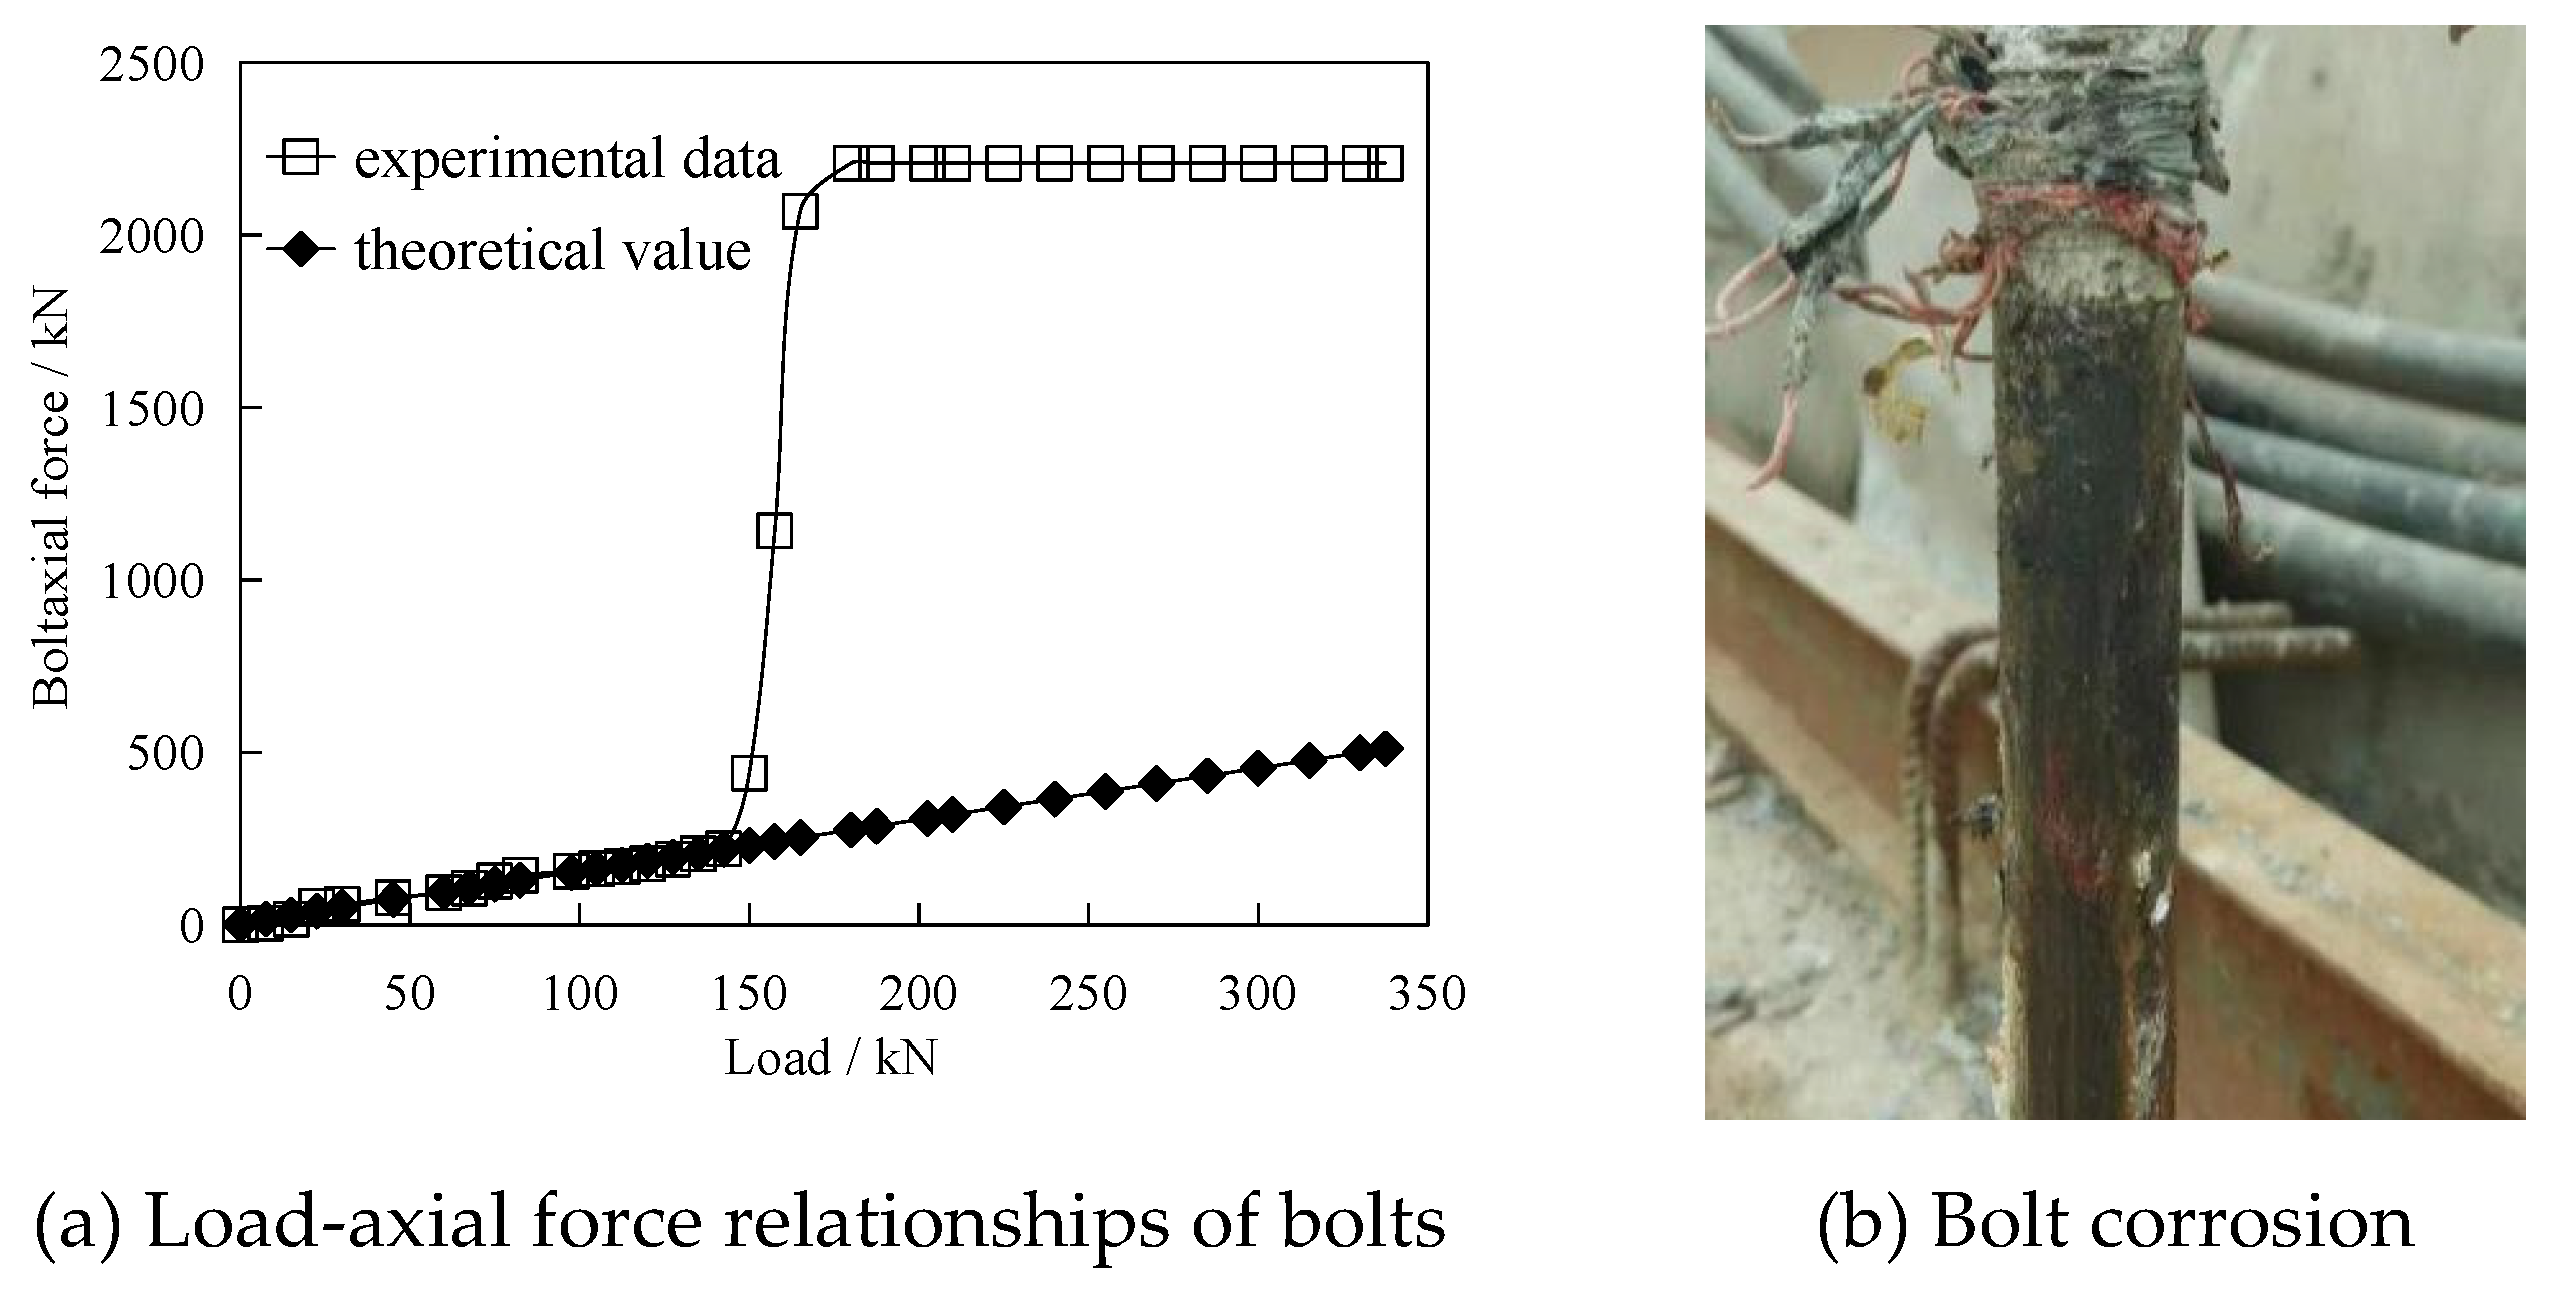
To explore the stresses produced in the bolts, strain gauges were attached to the bolts of the 2.5 m high column and were protected by being placed inside with 0.7 mm thick stainless steel pipes and wrapped with electrical tape (see Figure 11). According to the plotted results, the axial force increased linearly before the bolts were loaded with 150 kN. After loading, cracks occurred in the column, and the stresses were redistributed. Therefore, a sudden increase in the frictional force between the bolt and the bolt hole in concrete developed and eventually triggered the failure of strain gauges. In this test, high-strength grade 10.9 bolts were utilized, and the probability of damaging them under this load was very low. From the perspective of the mechanics of materials, the axial force showed a linear growth but failed to reach the design strength value until the end of the test.
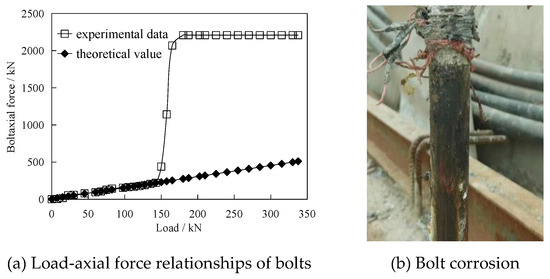
Figure 11.
Load–axial stress relationships for bolts and their corrosion.
4.3. Load–Displacement Analysis of RW Columns
4.3.1. The 3 m High Column
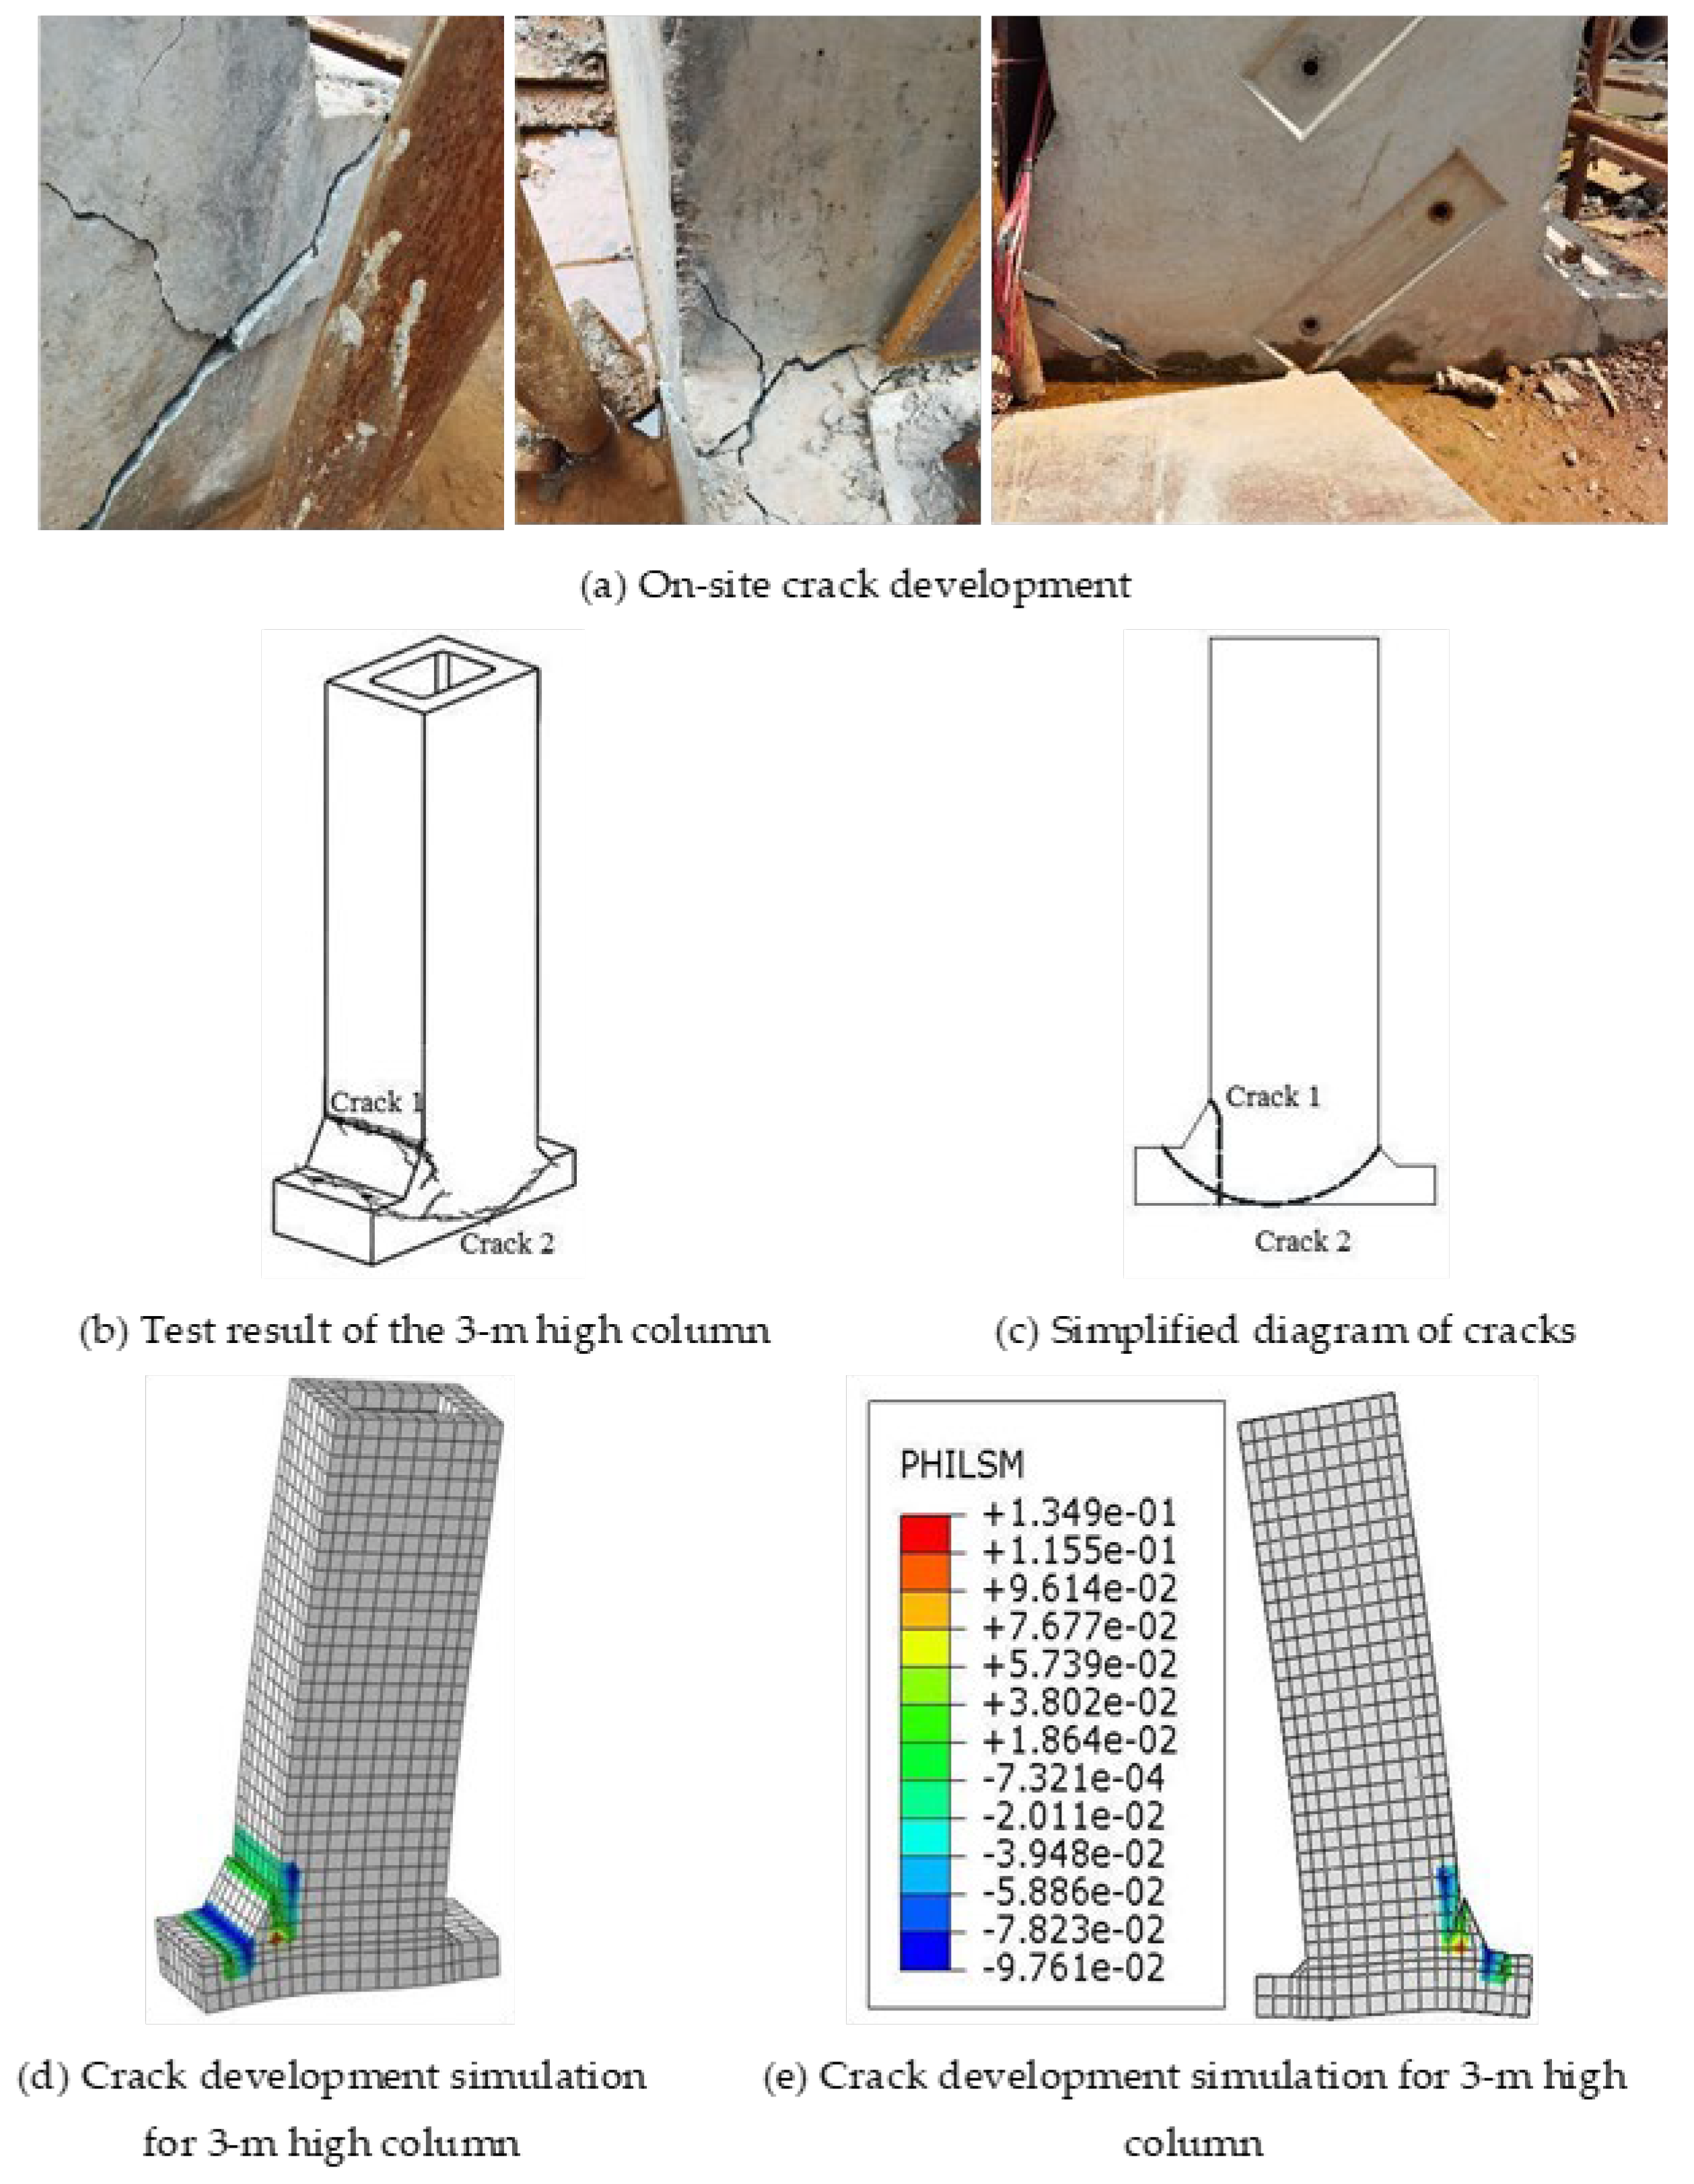
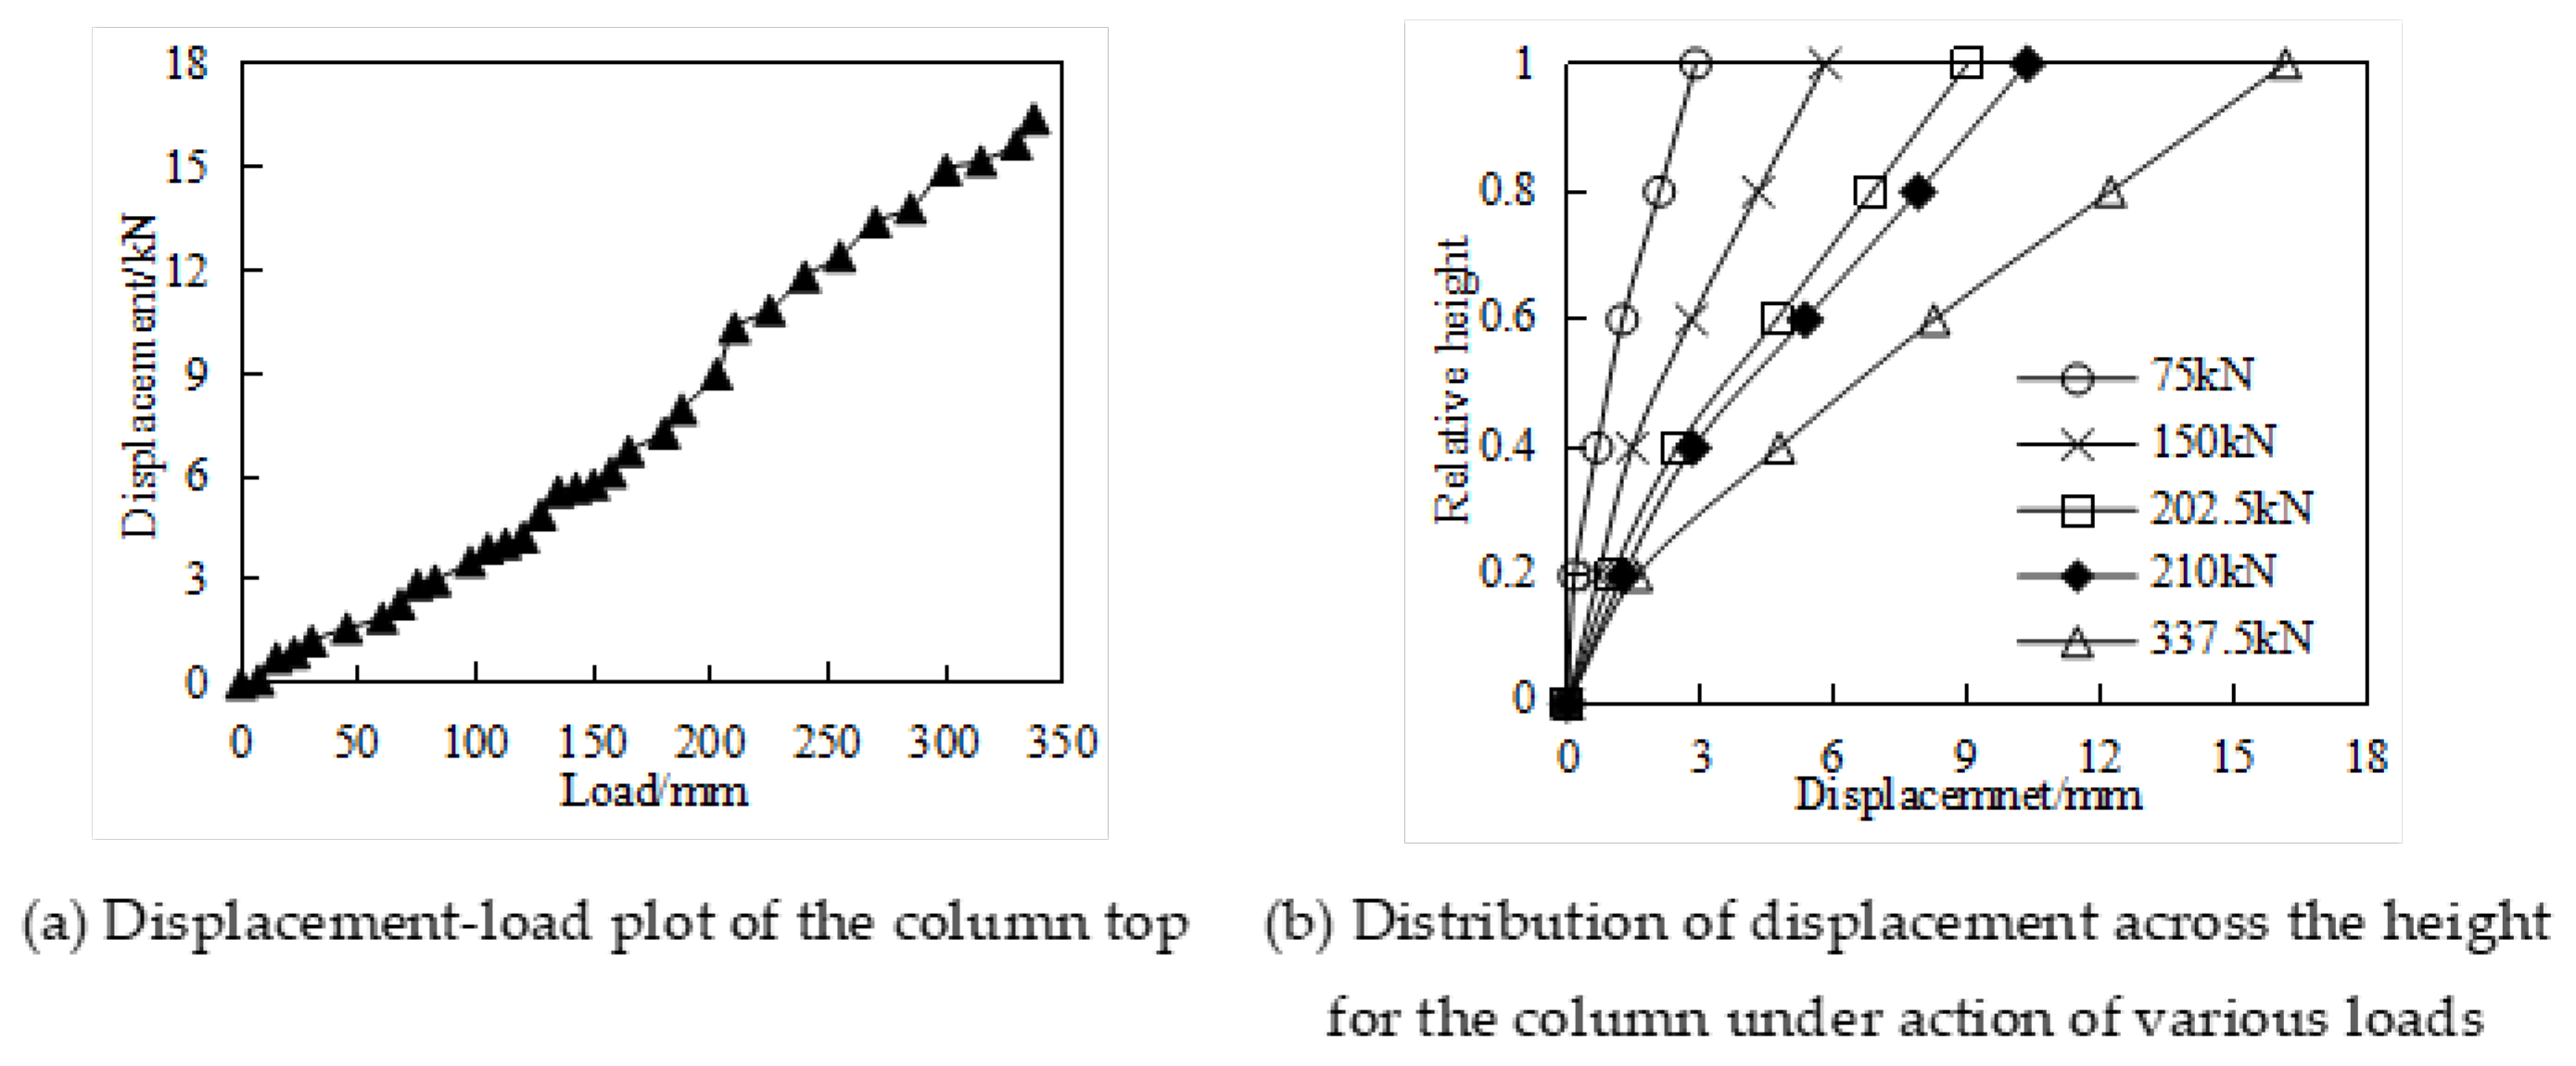
According to Figure 12a, the displacement of the 3 m high column top in terms of the applied load almost presents a linear variation for the loads lower than 60 kN. When the load exceeds 60 kN, it is measured by the crack meter that the maximum crack width would be up to 0.18 mm; the development speed of the crack increases after that, and the growth rate of the displacement of the column top rises. Under the action of the 90 kN load, the width growth rate at the place associated with the crack development (crack 1 in Figure 13) lessens, and crack 2 of nearly 2 mm width suddenly appears. At this time, the displacement rate of the column top changes because the concrete no longer bears the generated stresses after reaching a particular width of the crack, and now the steel bars are mainly affected by the tension field, resulting in stress redistribution. Additionally, the concrete at the bolt hole becomes the weak point, and it is suddenly damaged due to the low reinforcement ratio and small thickness. As the load increases, the sound of steel bar breakage can be heard. At this time, cracks 1 and 2 formed a combination of 7-like and arc-like shapes. The distribution of the displacement across the height of the column under variously applied loads is also exhibited in Figure 12b. In the case of the load equal to 30 kN, the column displacement profile approximates that resulting from the column’s rotation around the steel bar at its bottom. Furthermore, the column visibly bends when the load reaches the value corresponding to the limit state of normal use (i.e., 60 kN).
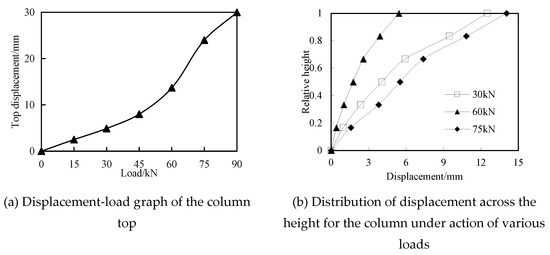
Figure 12.
Displacement field of 3 m column under action of stepwise loading.
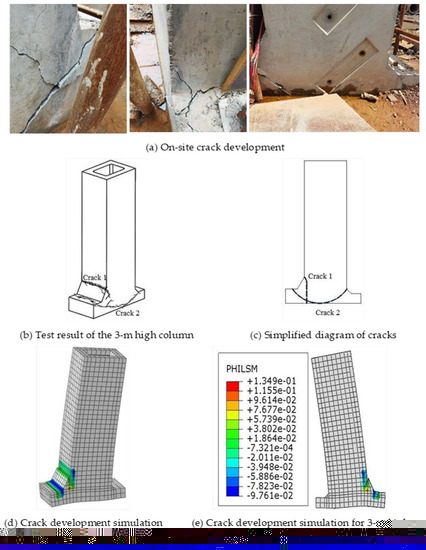
Figure 13.
Comparison of crack development on the 3 m high column.
4.3.2. The 2.5 m High Column
The results plotted in Figure 14a show that before the load reached 150 kN, the displacement of the 2.5 m high column top changed linearly with the applied load. When the load was 150 kN, the maximum width of the crack reached 0.05 mm (see Figure 15), and the displacement growth rate at the column top increased suddenly, followed by accelerated crack growth. When the load reached 202.5 kN, the maximum width of the crack was as large as 0.15 mm. Subsequently, as the load increased continuously, the growth rate of the crack width at the location of the crack development (cracks 1 and 2 in Figure 15) was lower than that in other places, and crack 2 of about 2 mm width suddenly appeared. The main reason behind this was that after the crack width reached a particular value, concrete quickly experienced the stress-free condition and the steel rebars had to bear increased tension, leading to the stress redistribution. Furthermore, the weak point was transferred to concrete at the bolt hole with a low reinforcement ratio and small thickness; thus, it was suddenly damaged. As the load increased, the displacement growth rate at the column top increased again, and the sound of the steel rebar breaking was heard soon after. At this time, cracks 1, 2, 3, and 4 were fully developed. The displacement profiles across the column height at various load levels are shown in Figure 14b. When the load was 75 kN, the column displacement profile was approximately the same as that obtained from the column rotation around the steel rebars at the column bottom. Moreover, the column bent when the load increased to the cracking value of 150 kN.
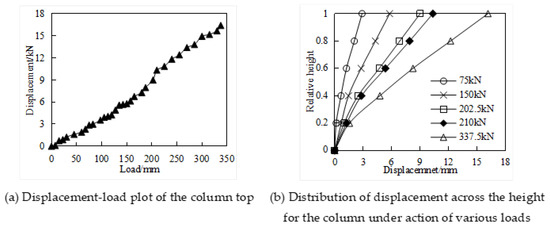
Figure 14.
Displacement field analysis of 2.5 m high column under action of stepwise loading.
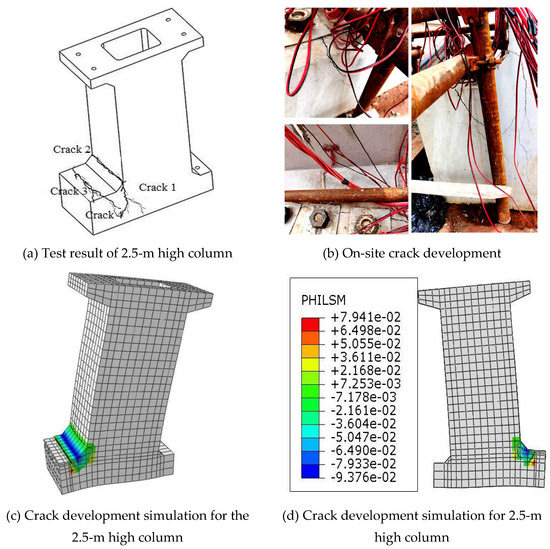
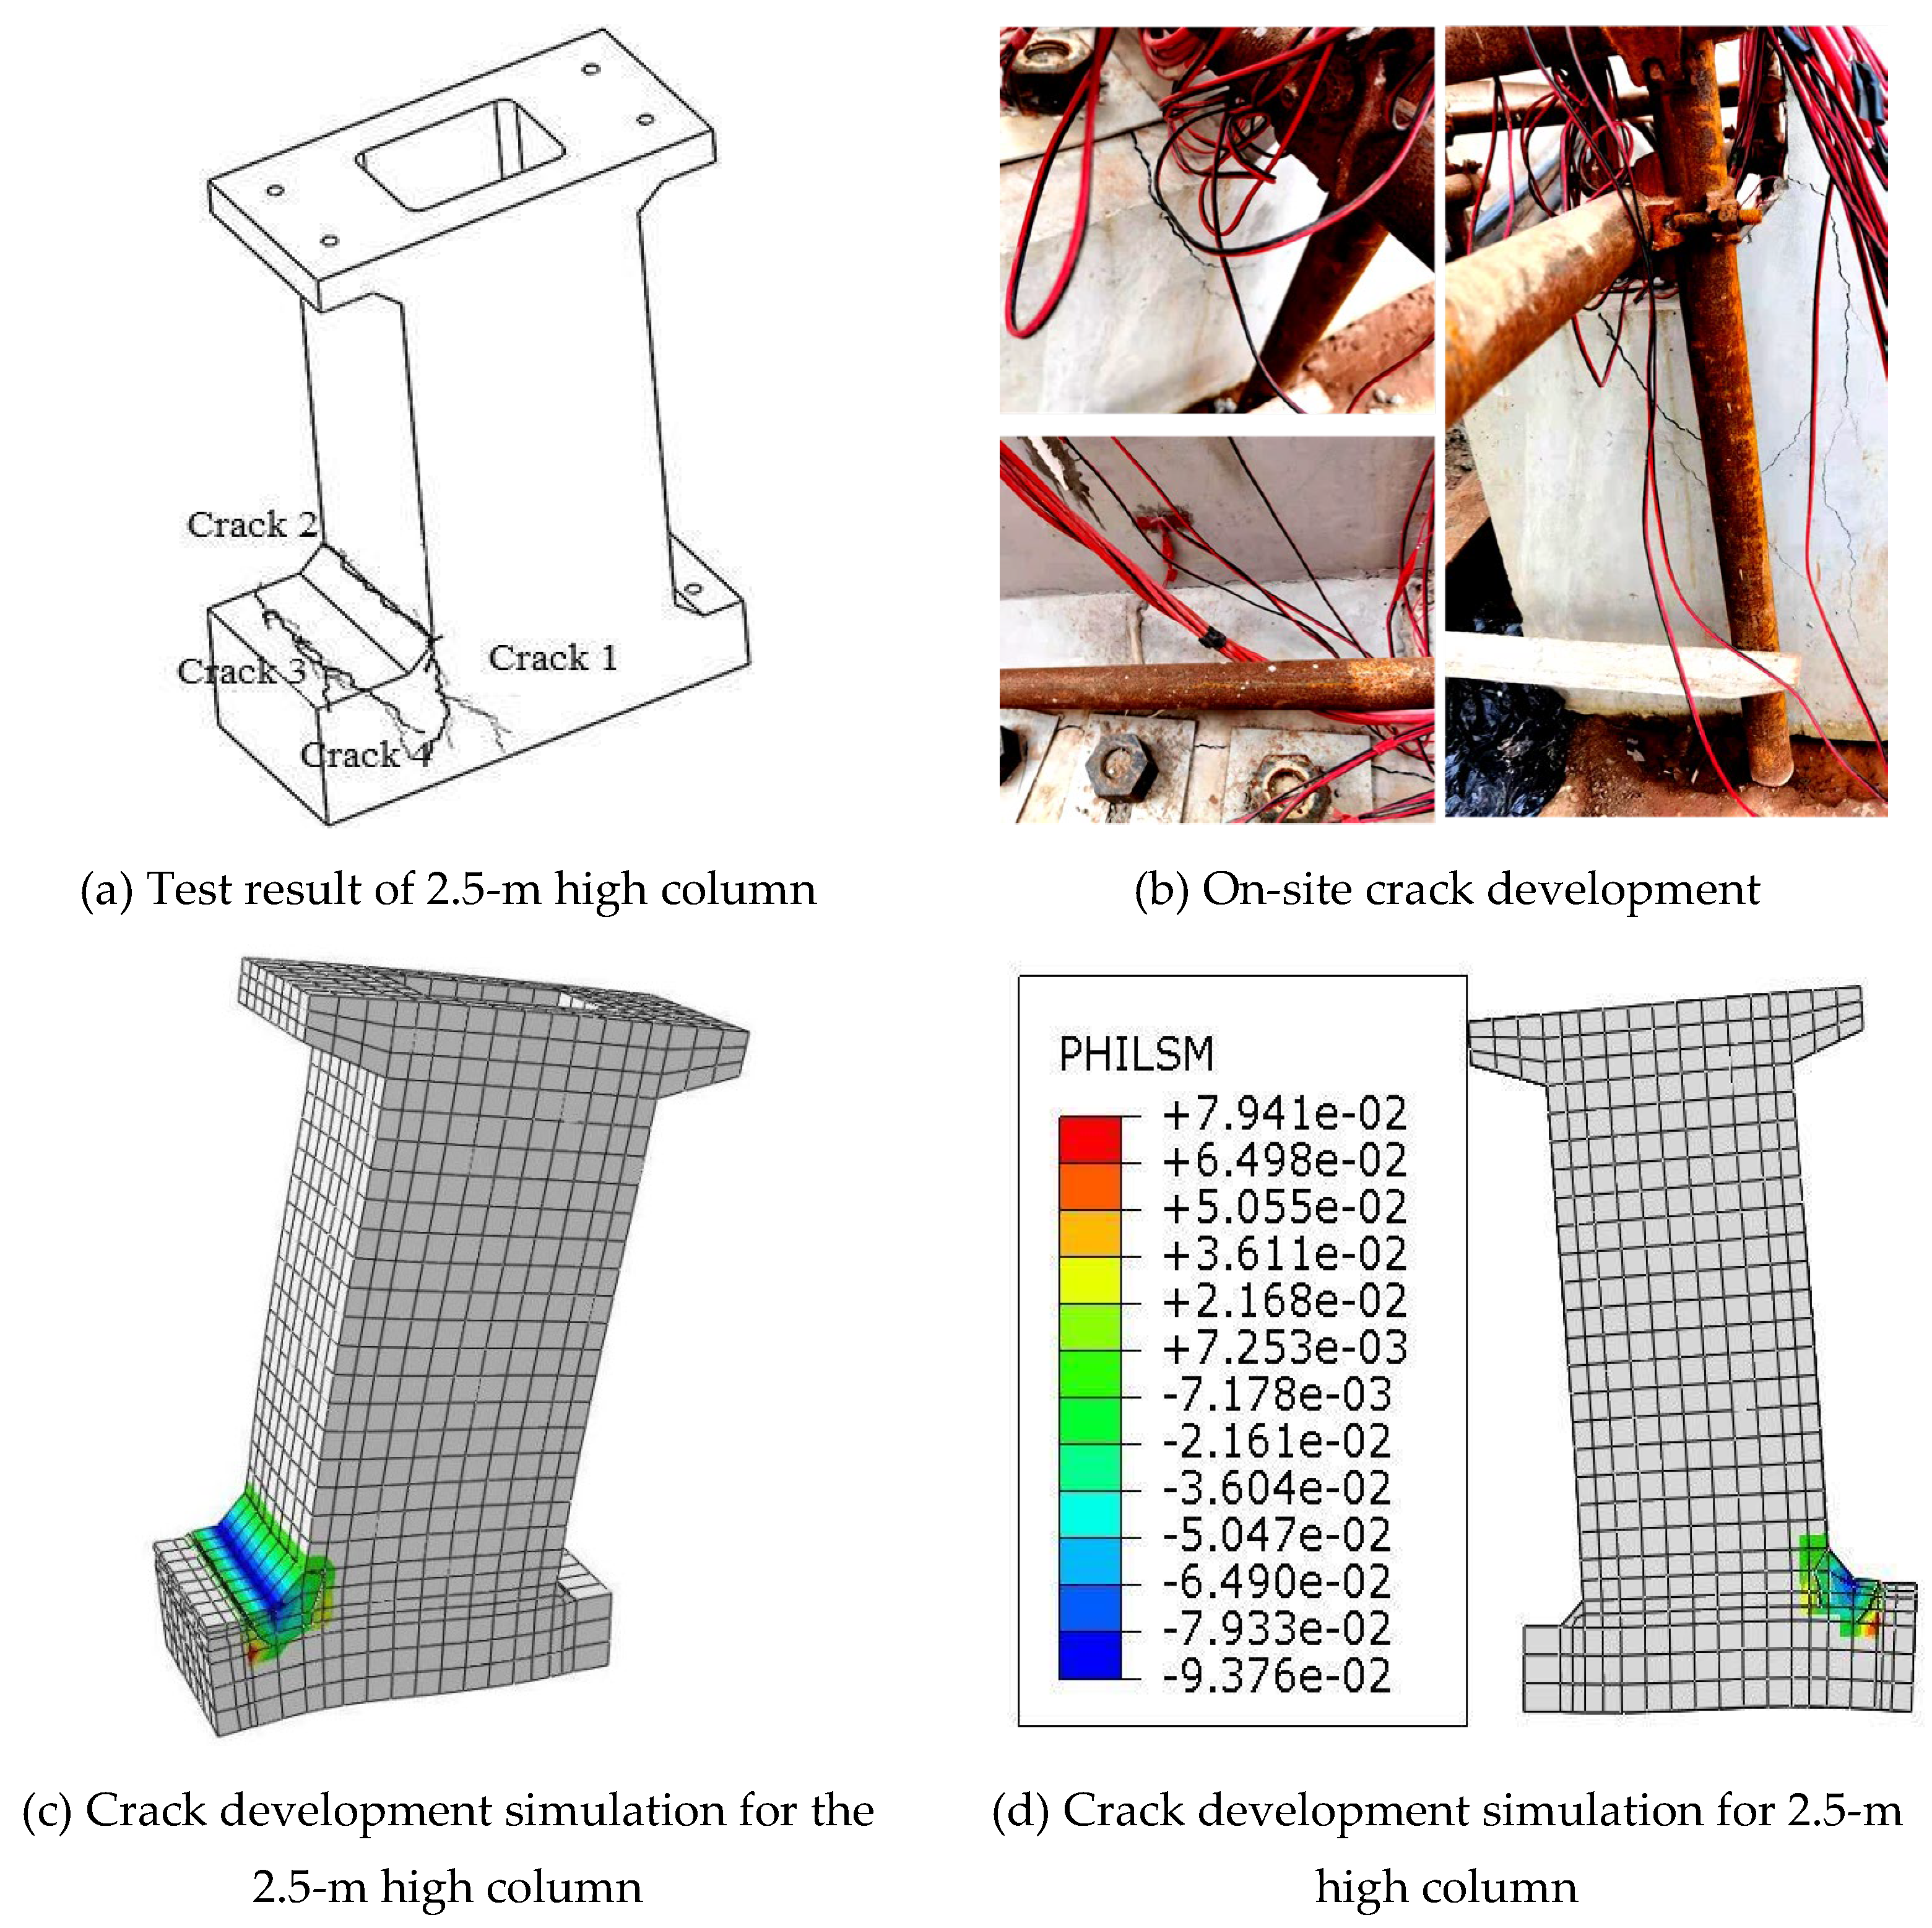
Figure 15.
Comparison of crack development in 2.5 m high column.
4.4. Development Law of Cracks in the RW Column
4.4.1. The 3 m High Column
According to Figure 13a–c, crack 1 on the 3 m high column is first formed at the chamfered corner and then extended to both ends. Then, it thoroughly penetrates the column back to build a complete crack 1, which is then developed at a lower speed. As the load increases, crack 2 suddenly appears with a maximum width of 2 mm, where a brittle failure occurs. When the load reaches the ultimate bearing capacity (about 150 kN), the cracks on the column are naturally finalized. In other words, an arc-shaped crack passes the bolt, the column bottom, and the chamfer before the column, and a “7”-shaped crack penetrating the column back is formed.
The FEA-based model is operated in a stepwise loading mode according to the actual test process; that is, multiple-step loadings are created and transferred. As shown in Figure 13d–e, the extended finite-element method (XFEM) [21,22] is adopted to explore the crack development law. In detail, the parameters of crack development at the bolt and chamfer are first defined. Based on the energy method, the tensile stress required for the crack generation is 2.36 MPa (design strength 1.43 MPa). Moreover, the crack development in the FEA is basically identical to that in the FEA. In other words, crack 1 appeared first, followed by crack 2. Crack 1 expands downward perpendicular to the chamfer, while crack 2 first spreads downward, then toward the column side, and finally propagates to the bolt before the column, thus forming an arc-shaped crack.
4.4.2. The 2.5 m High Column
As shown in Figure 15, under the load of about 150 kN, crack 1 initially formed at the chamfer corner and spread to both ends as the load continued to increase. When the load reached 202.5 kN, crack 1 completely penetrated through the column back to form crack 2, after which the development speed of crack 1 was reduced. When the load increased to about 300 kN, crack 3 appeared suddenly, with a maximum width of 2.2 mm, indicating that a brittle failure occurred at the bolt–concrete interface. When the load reached the ultimate load-bearing capacity (about 335 kN), a V-shaped crack composed of bolt–chamfer cracks was fully developed.
To examine the comparison between the destructive test simulation results and the field test results of the 2.5 m high column, the crack development parameters at the bolt and chamfer are first defined. On this basis, the tensile stress required for the defined crack development is 2.01 MPa. According to the presented graphs and results in Figure 15, the crack development on the 2.5 m high column is basically in line with the simulation result. Specifically, cracks 1 and 2 first appear, and then crack 3 occurs and spreads to form crack 4. Crack 1 first spreads in a direction perpendicular to the chamfer and then develops toward crack 4, while crack 4 first spreads downward perpendicular to the ground and then moves toward crack 1.
From this, the development law of crack development in the PGERW columns can be obtained: After the load on the 3 m high column was increased to the ultimate load-bearing capacity (about 150 kN), an “arc + 7”-shaped crack combination developed. A V-shaped crack composed of bolt–chamfer cracks formed when the load on the 2.5 m high column was increased to the ultimate load-bearing capacity (about 335 kN). The FEA was used for numerical simulations of the columns, yielding results consistent with the experimental data.
5. Conclusions
A new type of PGERW was proposed. Using full-scale model tests and numerical simulations, the concrete stress characteristics in the precast hollow columns during solidification and hardening were investigated. Additionally, the load–stress and load–displacement relationships of the RW columns, stress changes in connecting bolts, and crack development in the RW columns were investigated in detail. The main obtained results are summarized as follows:
- (1)
- The tensile and compressive stresses alternated during the solidification and hardening of concrete of the precast hollow columns due to the influences of the hydration heat and concrete drying shrinkage. Compared with the 28-day curing period of the traditional reinforced concrete, it takes a longer time (35 days) for the internal stress to be completely released and the overall structure to become stable.
- (2)
- The column is designed as a hollow thin-walled structure, which can effectively reduce the amount of concrete and carbon emissions. The full-scale test and simulation results show that the tensile stresses required to generate cracks in the columns are 2.36 MPa (3 m) and 2.01 MPa (2.5 m), which fully meet the requirements of the retaining wall design strength of 1.43 MPa.
- (3)
- The ultimate load-bearing capacity of a 3 m high column is about 150 kN, and that of a 2.5 m high column is about 335 kN. The maximum stress area of the column reinforcement is the location of VWSBSGs 1 and 2, which is consistent with the force distribution of the traditional cantilever retaining wall. In the design of the retaining wall, it is necessary to reinforce this position to improve the overall bearing capacity of the retaining wall.
- (4)
- The PEGRWs solve the problems of low extent of greening and poor drainage performance. Placing biodegradable eco-bags filled with soil and fertilizer for plant growth on the inclined shelves can effectively promote plant growth. The inclination angle formed by the inclined shelves can ensure the smooth discharge of the water without the need to add drain holes.
- (5)
- The components of PGERWs are modularly manufactured at the factory and thus have the advantages of lightweight, less difficulty in hoisting, and convenient transportation; therefore, they can improve the durability of the final product. The PGERWs can be applied in several contexts.
In the practical application of PGERWs, the bolt connection between latch hangers, hollow thin-walled columns, and inclined shelves is very difficult due to the insufficient precision of concrete structures in factory prefabrication. The next step should be to appropriately simplify the structure to reduce the difficulty of construction.
Author Contributions
Conceptualization, X.W. and X.L.; software, C.Z.; methodology, H.D.; validation, K.W., T.H., and J.T.; data curation, Y.Q.; writing—original draft preparation, X.W. and C.Z.; writing—review and editing, X.L. and K.W. All authors have read and agreed to the published version of the manuscript.
Funding
This research was funded by the National Natural Science Foundation of China (52109139, 52009122), China Postdoctoral Science Foundation (2022M712724), Natural Science Foundation of Zhejiang Province (LQ20E080022, LQ21E090002), and Science and Technology Project supported by the Department of Transportation of Zhejiang Province (2019007).
Data Availability Statement
Not applicable.
Conflicts of Interest
The authors declare no conflict of interest.
References
- Patsevich, A.; El Shamy, U. Discrete-Element Method Study of the Seismic Response of Gravity Retaining Walls. Int. J. Géoméch. 2020, 20, 04020197. [Google Scholar] [CrossRef]
- Varga, R.; Žlender, B.; Jelušič, P. Multiparametric Analysis of a Gravity Retaining Wall. Appl. Sci. 2021, 11, 6233. [Google Scholar] [CrossRef]
- Balasbaneh, A.T.; Bin Marsono, A.K. Applying multi-criteria decision-making on alternatives for earth-retaining walls: LCA, LCC, and S-LCA. Int. J. Life Cycle Assess. 2020, 25, 2140–2153. [Google Scholar] [CrossRef]
- Wang, Y.; Smith, J.V.; Nazem, M. Optimisation of a Slope-Stabilisation System Combining Gabion-Faced Geogrid-Reinforced Retaining Wall with Embedded Piles. KSCE J. Civ. Eng. 2021, 25, 4535–4551. [Google Scholar] [CrossRef]
- Fathipour, H.; Payan, M.; Chenari, R.J. Limit analysis of lateral earth pressure on geosynthetic-reinforced retaining structures using finite element and second-order cone programming. Comput. Geotech. 2021, 134, 104119. [Google Scholar] [CrossRef]
- Yazdandoust, M. Investigation on the seismic performance of steel-strip reinforced-soil retaining walls using shaking table test. Soil Dyn. Earthq. Eng. 2017, 97, 216–232. [Google Scholar] [CrossRef]
- Farhat, M.; Issa, M.; Ibrahim, M.; Rahman, M. Full-Scale Experimental Testing and Finite Element Analysis of a Totally Prefabricated Counterfort Retaining Wall System. PCI J. 2017, 62, 72–88. [Google Scholar] [CrossRef]
- Farhat, M.; Issa, M. Design Principles of Totally Prefabricated Counterfort Retaining Wall System Compared with Existing Cast-in-Place Concrete Structures. PCI J. 2017, 62, 89–106. [Google Scholar] [CrossRef]
- Mattos, J.; Viviescas, J.C.; Osorio, J.P. Reliability Comparative Analysis of Codes for the Design of Cantilever Sheet Pile Walls: Basis for Studying the Principles of International Standards. Int. J. Géoméch. 2021, 21, 04021064. [Google Scholar] [CrossRef]
- Zhang, M.; Wang, W.; Hu, R.; Wang, Z. Investigation of Influencing Factors on the Deformation of Sheet Pile Wall with a Relieving Platform. Adv. Mater. Sci. Eng. 2021, 2021, 1–16. [Google Scholar] [CrossRef]
- Muni, T.; Devi, D.; Baishya, S. Parametric Study of Sheet Pile Wall using ABAQUS. Civ. Eng. J. 2021, 7, 71–82. [Google Scholar] [CrossRef]
- Niu, X.Y.; Xing, Y.F. Design and Calculation of a Large Self-Anchored Ecological Block Retaining Wall. Appl. Mech. Mater. 2012, 253–255, 789–795. [Google Scholar] [CrossRef]
- Wang, X.; Zhu, C.; Diao, H.; Ning, Y. Structural Behavior of Prefabricated Ecological Grid Retaining Walls and Application in a Highway in China. Symmetry 2021, 13, 746. [Google Scholar] [CrossRef]
- Xie, Y.; Yang, X. Characteristics of a New-Type Geocell Flexible Retaining Wall. J. Mater. Civ. Eng. 2009, 21, 171–175. [Google Scholar] [CrossRef]
- Laila, L.R.; Gurupatham, B.G.A.; Roy, K.; Lim, J.B.P. Effect of super absorbent polymer on microstructural and mechanical properties of concrete blends using granite pulver. Struct. Concr. 2020, 22, E898–E915. [Google Scholar] [CrossRef]
- Laila, L.R.; Gurupatham, B.G.A.; Roy, K.; Lim, J.B.P. Influence of super absorbent polymer on mechanical, rheological, durability, and microstructural properties of self-compacting concrete using non-biodegradable granite pulver. Struct. Concr. 2020, 22, E1093–E1116. [Google Scholar] [CrossRef]
- Sun, J.; Qiu, H.; Xu, J. Experimental Verification of Vertical Joints in an Innovative Prefabricated Structural Wall System. Adv. Struct. Eng. 2015, 18, 1071–1086. [Google Scholar] [CrossRef]
- Ding, K.; Ye, Y.; Ma, W. Seismic performance of precast concrete beam-column joint based on the bolt connection. Eng. Struct. 2021, 232, 111884. [Google Scholar] [CrossRef]
- Liu, H.; Wang, Z.; Du, X.; Shen, G.Q. The seismic behaviour of precast concrete interior joints with different connection methods in assembled monolithic subway station. Eng. Struct. 2021, 232, 111799. [Google Scholar] [CrossRef]
- Zhou, X.L.; Yuan, G.Y.; Chen, D.Z. Technical Guidelines for Design and Construction of Highway Retaining Walls, 1st ed.; China Communications Press: Beijing, China, 2008; pp. 295–302. [Google Scholar]
- Roth, S.-N.; Léger, P.; Soulaïmani, A. A combined XFEM–damage mechanics approach for concrete crack propagation. Comput. Methods Appl. Mech. Eng. 2015, 283, 923–955. [Google Scholar] [CrossRef]
- Liao, F.; Huang, Z. Using XFEM for modelling localized fracture of reinforced concrete beams. Comput. Model. Concr. Struct. 2014, 1, 551–560. [Google Scholar]


Publisher’s Note: MDPI stays neutral with regard to jurisdictional claims in published maps and institutional affiliations. |
© 2022 by the authors. Licensee MDPI, Basel, Switzerland. This article is an open access article distributed under the terms and conditions of the Creative Commons Attribution (CC BY) license (https://creativecommons.org/licenses/by/4.0/).