Article

The Characteristics of Dissolved Organic Matter and Soil Microbial Communities in the Soils of Larix principis-rupprechtii Mayr. Plantations in the Qinling Mountains, China

1
College of Resources and Environmental Sciences, Gansu Agricultural University, Lanzhou 730070, China
2
College of Life Science, Northwest Normal University, Lanzhou 730070, China
3
Wolfson College, Oxford University, Oxford OX2 6UD, UK
4
Institute of Biomedical and Environmental Science and Technology, University of Bedfordshire, Luton LU1 3JU, UK
5
School of Life Science, Shanxi University, Taiyuan 030006, China
6
School of Biological Science and Engineering, North Minzu University, Yinchuan 750021, China
*
Author to whom correspondence should be addressed.
Sustainability 2022, 14(19), 11968; https://doi.org/10.3390/su141911968
Submission received: 1 August 2022 / Revised: 15 September 2022 / Accepted: 17 September 2022 / Published: 22 September 2022
(This article belongs to the Section Soil Conservation and Sustainability)

Abstract

:
Soil microorganisms and dissolved organic matter (DOM) play vital roles in nutrient cycling and maintaining plant diversity. The aim of this study was to clarify the relationship between DOM component characteristics and microbial community structure in the soil of Larix principis-rupprechtii Mayr. plantations. We quantified the responses of the soil microbial and DOM characteristics to stand age in a plantation forest ecosystem using phospholipid fatty acid (PLFA) analyses, ultraviolet-visible spectroscopy, and fluorescence spectroscopy. Three humic-like components and a fulvic-like component were identified from the soil samples, and humic-like substances were the dominant component of the soil DOM of the stands of different ages. The fluorescence index showed that the sources of soil DOM in the stands of different ages throughout the growth stages may be mostly plant residues, with very little contribution from microbial sources. Furthermore, the results demonstrated that stand age and growth season had a significant effect on the contents of the soil PLFA biomarkers of L. principis-rupprechtii Mayr. Additionally, significantly higher contents of different species of soil PLFA biomarkers were observed in the young forest (17a) than in the sapling forest (7a) and half-mature forest (27a), suggesting that stand age differences in the quality and quantity of larch litter and soil physicochemical characteristics affect the microbial community structure. Redundancy analysis (RDA) showed that changes in the soil DOM quality and components that were driven by growth season and stand age were the major drivers of variations in the soil microbial community structure in the study region. Overall, the seasonal variations in DOM quality and components may contribute to the variability of soil microorganisms, and the soil microbial responses to tree age will depend upon the provisioning of these resources.

1. Introduction

Dissolved organic matter (DOM), a natural chemical substance in soil, accounts for only approximately 0.5–1% of the soil organic matter (SOM) [1]. DOM consists of various bioactive compounds that are easily utilized by soil microbes but also includes compounds that are difficult for microorganisms to degrade [2] and protein-like, carbohydrate-like, polysaccharide-like, humic-like and fulvic acid-like compounds [3]. Soil DOM comes from multiple sources, such as plant residue, animal waste, root exudate, and soil organic matter decomposition [4]. Although soil DOM accounts for only a minor part of SOM, it is the most mobile and active component in the soil and is the direct source of carbon and potential substrates for soil microbes. Therefore, soil DOM plays an important ecological role in carbon cycling, energy substance for soil microorganisms, and the provision of plant-available nutrients [5].
Forest ecosystems are the largest carbon pool of terrestrial ecosystems and play an important role in maintaining the carbon balance [6]. Soil microbes are important parts of forest ecosystems and play an important role in SOM decomposition, nutrient cycling, and maintaining the structure and function of forest ecosystems [7]. Soil microorganisms are sensitive to changes in forest stand age [8], and forests of different ages may select for different soil microbial communities [9]. Differences in the composition and content of root secretions in forest evolution are an important element altering the soil microbial community structure. Previous studies have shown that SOM is an important carbon source for soil microbes and is the dominant factor regulating the soil microbial community structure [10]. Furthermore, soil microbial metabolites and residues are major sources of soil DOM, and the composition and content of DOM greatly affect soil microbial activity [10,11]. As an important nutrient pool in the soil, DOM has a key influence on nutrient cycling in terrestrial ecosystems [12,13], and the formation, quality, and content of DOM in the soil are affected by many factors, including biological factors (microbiological activity), vegetation factors (vegetation type and stand age) and climatic factors (air temperature and hydrological conditions) [14,15]. Due to the sensitivity of soil DOM to changes in environmental factors, soil DOM characteristics are used as important indicators for evaluating soil quality [1]. The multifunctionality of DOM in maintaining soil functional sustainability and its ecological importance has increased the scientific interest in conducting studies on the variation in DOM characteristics in response to different factors. Thus, information on the soil microbial responses to changes in soil DOM characteristics is important for understanding soil carbon cycling and nutrient cycling.
The Qinling Mountains are located in the transitional zone between the subtropical and warm temperate zones of China and are the boundary between the northern and southern regions of China. The forest ecosystem of the Qinling Mountains is the ecological barrier of the northwest region of China and is also one of the main areas of ecological security in China. The Qinling Mountains are rich in natural forest resources, and the total forest area is 2.52 million hectares (the area of natural forest is 2.18 million hectares, and the plantation forest area is 0.34 million hectares). Over the past few decades, most of the natural forests in the Qinling Mountains have been logged and replaced by plantation forests [16]. Currently, in some areas of the Qinling Mountains (especially in North Piedmont), plantation forest areas account for more than 50% of the total forest area, and Larix principis-rupprechtii Mayr. is the main tree species of plantation forests in this area. This plantation tree species is widely distributed in parts of northwestern China. However, larch plantation forests have exhibited significant declines in soil quality during growth, and the degradation of plantation forests in the Qinling Mountains has seriously affected the ecological function of plantation forests in recent years. Previous studies have indicated that soil microbes are sensitive to forest land-use changes and that the soil quality and fertility of plantation forests gradually decline with increasing forest age. A decline in soil quality will upset the dynamic balance of soil microbial communities, which will further aggravate soil degradation [17]. However, only a few studies have explored the relationship between the changes in soil microbes and the changes in soil DOM chemodiversity in plantation forest ecosystems.
With the application of fluorescence excitation-emission matrix (EEM) spectroscopy to soil DOM analysis, we can quickly and accurately obtain substantial information on the fluorescence characteristics of soil DOM [18]. Although EEM spectroscopy cannot provide exact information about the chemical structure of DOM, this technique is suitable for studying the differences in soil DOM under different vegetation types [19]. Previous studies have indicated that DOM characteristics are site-specific and affected by the type of land use [20], and these studies have advanced our understanding of the soil biogeochemical cycle by evaluating the soil DOM characteristics. There is no clear information about how DOM characteristics vary with growth stage and stand age in a plantation forest ecosystem. Information on the influencing factors of DOM characteristics is critical for understanding soil carbon cycling and soil fertility in the Qinling Mountains. However, such information is very limited for soil DOM characteristics in the region. This limits our understanding of the carbon cycles and soil quality in the Qinling Mountains region because of potential differences in soil DOM characteristics resulting from differences in season and stand age. However, variations in DOM composition and content and their effects on the soil microbial community structure have not been described in larch plantation ecosystems with different stand ages.
In this study, we investigated the relationship between the composition characteristics of DOM and the microbial community structure changes in the soils of L. principis-rupprechtii Mayr. using excitation-emission matrix fluorescence combined with parallel factor (EEM-PARAFAC) and phospholipid fatty acid (PLFA) analyses. The aims of this study are to: (1) characterize the composition and structure of soil DOM, (2) assess the dynamics of DOM components and the microbial community in the soil of L. principis-rupprechtii Mayr., (3) determine whether the soil microbial community structure correlates with the variations in the soil DOM components, and (4) determine whether the soil microbial community structure and DOM characteristics correlate with the changes in DOM components.

2. Materials and Methods

2.1. Study Site

The present study was conducted in a natural larch plantation area (N: 34°02′18.1″ and E: 107°20′51.1″) in Taibai County, Shaanxi Province, which is located in the northern foothills of the Qinling Mountains (Figure S1). The study area has a continental monsoonal climate, and the annual average precipitation is 1000 mm. The average annual temperature is 7.7 °C, with average temperatures of 19.0 °C in summer and −3.7 °C in winter. The average high temperatures from May to September 2021 were 20, 23, 25, 24 and 20 °C (monthly weather and the sampling time information are shown in Table S1). The study site is elevated over a range of 1620–1700 m, and the soil layer is less than 60 cm thick and has been historically free from human disturbance. The soil type is a Luvisol in the FAO classification and is classified as brown soil [21].

2.2. Experimental Design

At different locations within the study site, separate larch plantation forests of different ages were selected for sampling. In April 2021, three representative sampling sites with similar topographies, forest densities and ground cover plants were selected. The tree ages of these larch plantation forests were 7 years (7a, sapling forest), 17 years (17a, young forest) and 27 years (27a, half-mature forest), and the mean forest density of the larch plantation forests was 2500 tree·ha−1. In this region, the germination period in larch plantation forests is in April, the fast-growth period is in July and August, and the late growth period is in September. In this study, soil sampling was conducted from the middle of May to September. To standardize soil sample collection each month, we chose each sampling day after there had been seven consecutive days without rainfall in the study region. The field experiment used a randomized design with three replicates in each stand age area, and three plots (20 × 20 m each) were established in each stand age area.
Generally, most of the roots of L. principis-rupprechtii Mayr. are distributed 0–30 cm deep because it is a shallow-rooted tree species. Therefore, the soil samples were collected from the 0–30 cm soil depth. When sampling every month, we first removed the litter from the soil surface and used a soil auger (5 cm in diameter) to randomly collect soils from the same 0–30 cm layer. A multisampling method (10 sample points at each plot) was used to randomly collect soil samples (0–30 cm), three times from each stand age. The sampling points were located 30 cm from a tree trunk. To ensure the accuracy of the experiment, each sampling point was marked during sampling each month to avoid resampling from the same plot. Soil samples from the same plot were mixed and combined into one mixed sample for each plot, and each mixed sample was divided into two parts: (1) The first part was air-dried at room temperature out of sunlight, and the dried samples were then ground and sieved through a mesh (2 mm). Then, the soil samples were ground into a fine powder, passed through a sieve (0.25 mm) and stored at 4 °C for chemical property analysis. (2) The second part of the samples were sieved (2 mm mesh), placed in sterile plastic bags, cryopreserved on dry ice, and shipped to the laboratory for PLFA analysis.

2.3. Soil Physicochemical Properties and DOM Analysis

Soil organic carbon (SOC) contents were analyzed by the K2CrO7-H2SO4 method [22]. Soil total nitrogen (TN) contents were measured by the semimicro-Kjeldahl method [23]. We used the water-soil oscillation method to obtain the soil DOM. For soil DOM extraction, 5 g of soil samples and 35 mL of deionized water were well mixed with a shaker (at a temperature of 60 °C) at 300 rpm for 0.5 h [1,24]. The soil-water mixture was centrifuged at 10,000 rpm for 7 min, then the supernatant was filtered using an acetate fiber membrane (0.45 μm), and the filtrate was stored at −20 °C for the analysis of dissolved organic carbon (DOC) content and fluorescence spectra.
Generally, soil DOM is quantified on the basis of its DOC content [15]. In this study, the soil DOC content was analyzed using a TOC analyzer (Shimadzu, TOC-L, Japan). Analysis of the EEM fluorescence spectra was performed with a fluorescence spectrometer (Shimadzu, RF-6000, Japan), and the following parameters were used: for the light source, a xenon lamp and 700 V at room temperature; excitation wavelengths of 200–500 nm at a step length of 5 nm; emission wavelengths of 250–550 nm at a step length of 1 nm; and a scan speed of 6000 nm·min−1. The influences of inner filter effects (IFE) of all the EEMs were corrected by absorbance measurements, and the effects of Raman scattering were eliminated by subtracting the Milli-Q water blank. UV–Vis spectral parameters were measured with a 10 mm quartz cell at a 250 to 400 nm scanning wavelength by a UV-spectrophotometer (Shimadzu, UV-1780, Japan). In this study, we used Milli-Q water as the blank control.
UV–Vis spectral parameters, specific UV–Vis absorbance at 254 nm (SUVA254), and slope ratio (SR) were selected to evaluate the aromaticity and molecular weight of soil DOM. The value of SUVA254 is positively correlated with the aromaticity of a soil DOM component. A high value of SUVA254 indicates that there are more benzene-like compounds in the component as well as more aromatic substances [25]. The SR value is negatively correlated with the molecular weight of a soil DOM component [26].
In addition, several important fluorescence spectral parameters (including the fluorescence index (FI), humification index (HIX), freshness index (β:α) and biological index (BIX) were used. The FI is usually used to identify the origin of soil DOM. FI values ≤ 1.2 indicate the DOM that originated from SOM and plant residues. FI values ≥ 1.8 indicate that the DOM originated from microbes, and FI values ranging from 1.2–1.8 indicate that DOM originated from SOM, plant residues and microbes [27]. The HIX is positively correlated with the content of humus or the extent of humification of SOM and is closely related to the activity of soil microbes [24,27]. The BIX can indicate the source of DOM. BIX values ranging from 0.6–0.7 indicate that the DOM has only slight biological/microbial origins, values ranging from 0.7–0.8 indicate a transitional stage of biological/microbial sources, values ranging from 0.8–1 indicate a large proportion of biological/microbial sources, and values >1 indicate exclusively biological/microbial sources [28,29]. The β:α ratio represents the freshness of DOM; a high value of the β:α ratio indicates a high proportion of fresh DOM, and a change in the β:α ratio represents the amount of newly generated DOM [1].

2.4. PARAFAC Modeling

Three-dimensional fluorescence spectral analysis was performed using the PARAFAC method. PARAFAC analysis was performed with DOM-Fluor v.1.7, a free software package in MATLAB-7.0 (Natick, M.A., USA), to analyze the fluorescence characteristics of the soil DOM components. We used core consistency diagnostics and a split-half validation method to identify the DOM components [1], and the maximum peak intensity (Fmax) in Raman units (R.U.) was used to evaluate the relative content of each component of DOM.

2.5. Soil Microbial PLFA Analysis

The abundance of soil microbes was characterized using PLFA analysis [30]. In this study, total lipids were extracted from 5 g of freeze-dried soil using a single-phase methanol–chloroform–citric acid buffer system (2:1:0.8). Phospholipids were separated from neutral and glycolipids using a silica column and were then transformed by alkaline methanolysis into fatty acid methyl esters (FAMEs). The FAME samples were dissolved in hexane (99%) and analyzed using a gas chromatograph (GC-2014C Series, Shimadzu, Japan) with a Sherlock microbial identification system (version 6.1; MIDI Inc. Newark, D.E., USA) and an Agilent DB-5ms (60 m × 0.25 mm × 0.25 μm) capillary column. The GC temperature progression was set by MIDI software. The concentrations of each PLFA were determined as nmol g1 dry soil based on their ratio to the international standard (C19:0) [31]. Different PLFA biomarkers were used to characterize different soil microbial communities. General bacteria (unspecific bacteria) consist of PLFAs of 11:0, 12:0, i13:0, 14:0, 15:0, 16:0, 17:0, 18:0, 19:0, 20:0, 22:0, 23:0 and 24:0 [32,33]. Gram-positive bacteria (G+) were indicated by the PLFA of i14:0 [33]. Gram-negative bacteria (G-)consist of PLFAs of 10:0 2OH, 15:1w5c, 17:1w7c, 17:1w9c, 18:1w5c, 18:1w7c, 21:1w6c and 24:1w9c [31,32,34]. Fungi were represented by the PLFAs of 18:1w9c, 18:2w6,9c, 18:3w6c and 20:5w3c [34]. The PLFAs of 10Me 17:1w7c, 10Me 16:0, and 10Me 18:0 represented the content of actinomycetes [35]. The protozoan PLFAs were quantified by the sum of the 20:2w6c, 20:2w6,9c, 20:3w3c, 20:4w6c, 22:6w3c and 22:5w6c PLFAs [33,36]. The total bacterial PLFAs of the soil microorganisms included the PLFAs of G- bacteria, G+ bacteria, actinomycetes, and general bacteria. The total PLFA of the soil microorganisms was the sum of all the identified PLFAs.

2.6. Statistical Analysis

Prior to further analysis, the normality of the distribution of all data was tested using Kolmogorov-Smirnov analysis in SPSS version 23.0 (SPSS Inc., Chicago, IL, USA), and the data were log10-transformed to normalize their distribution. One-way analysis of variance (ANOVA) was used to analyze the significant differences in the contents of SOC, TN, DOC, fluorescent components, and fluorescence parameters among different growth stages and stand ages by using Tukey’s multiple comparison post hoc tests. All data analyses were performed using SPSS 23.0. The figures were created using Sigma-Plot 14.0 and Origin 2021. Redundancy analysis (RDA) was performed using CANOCO 5.0.

3. Results

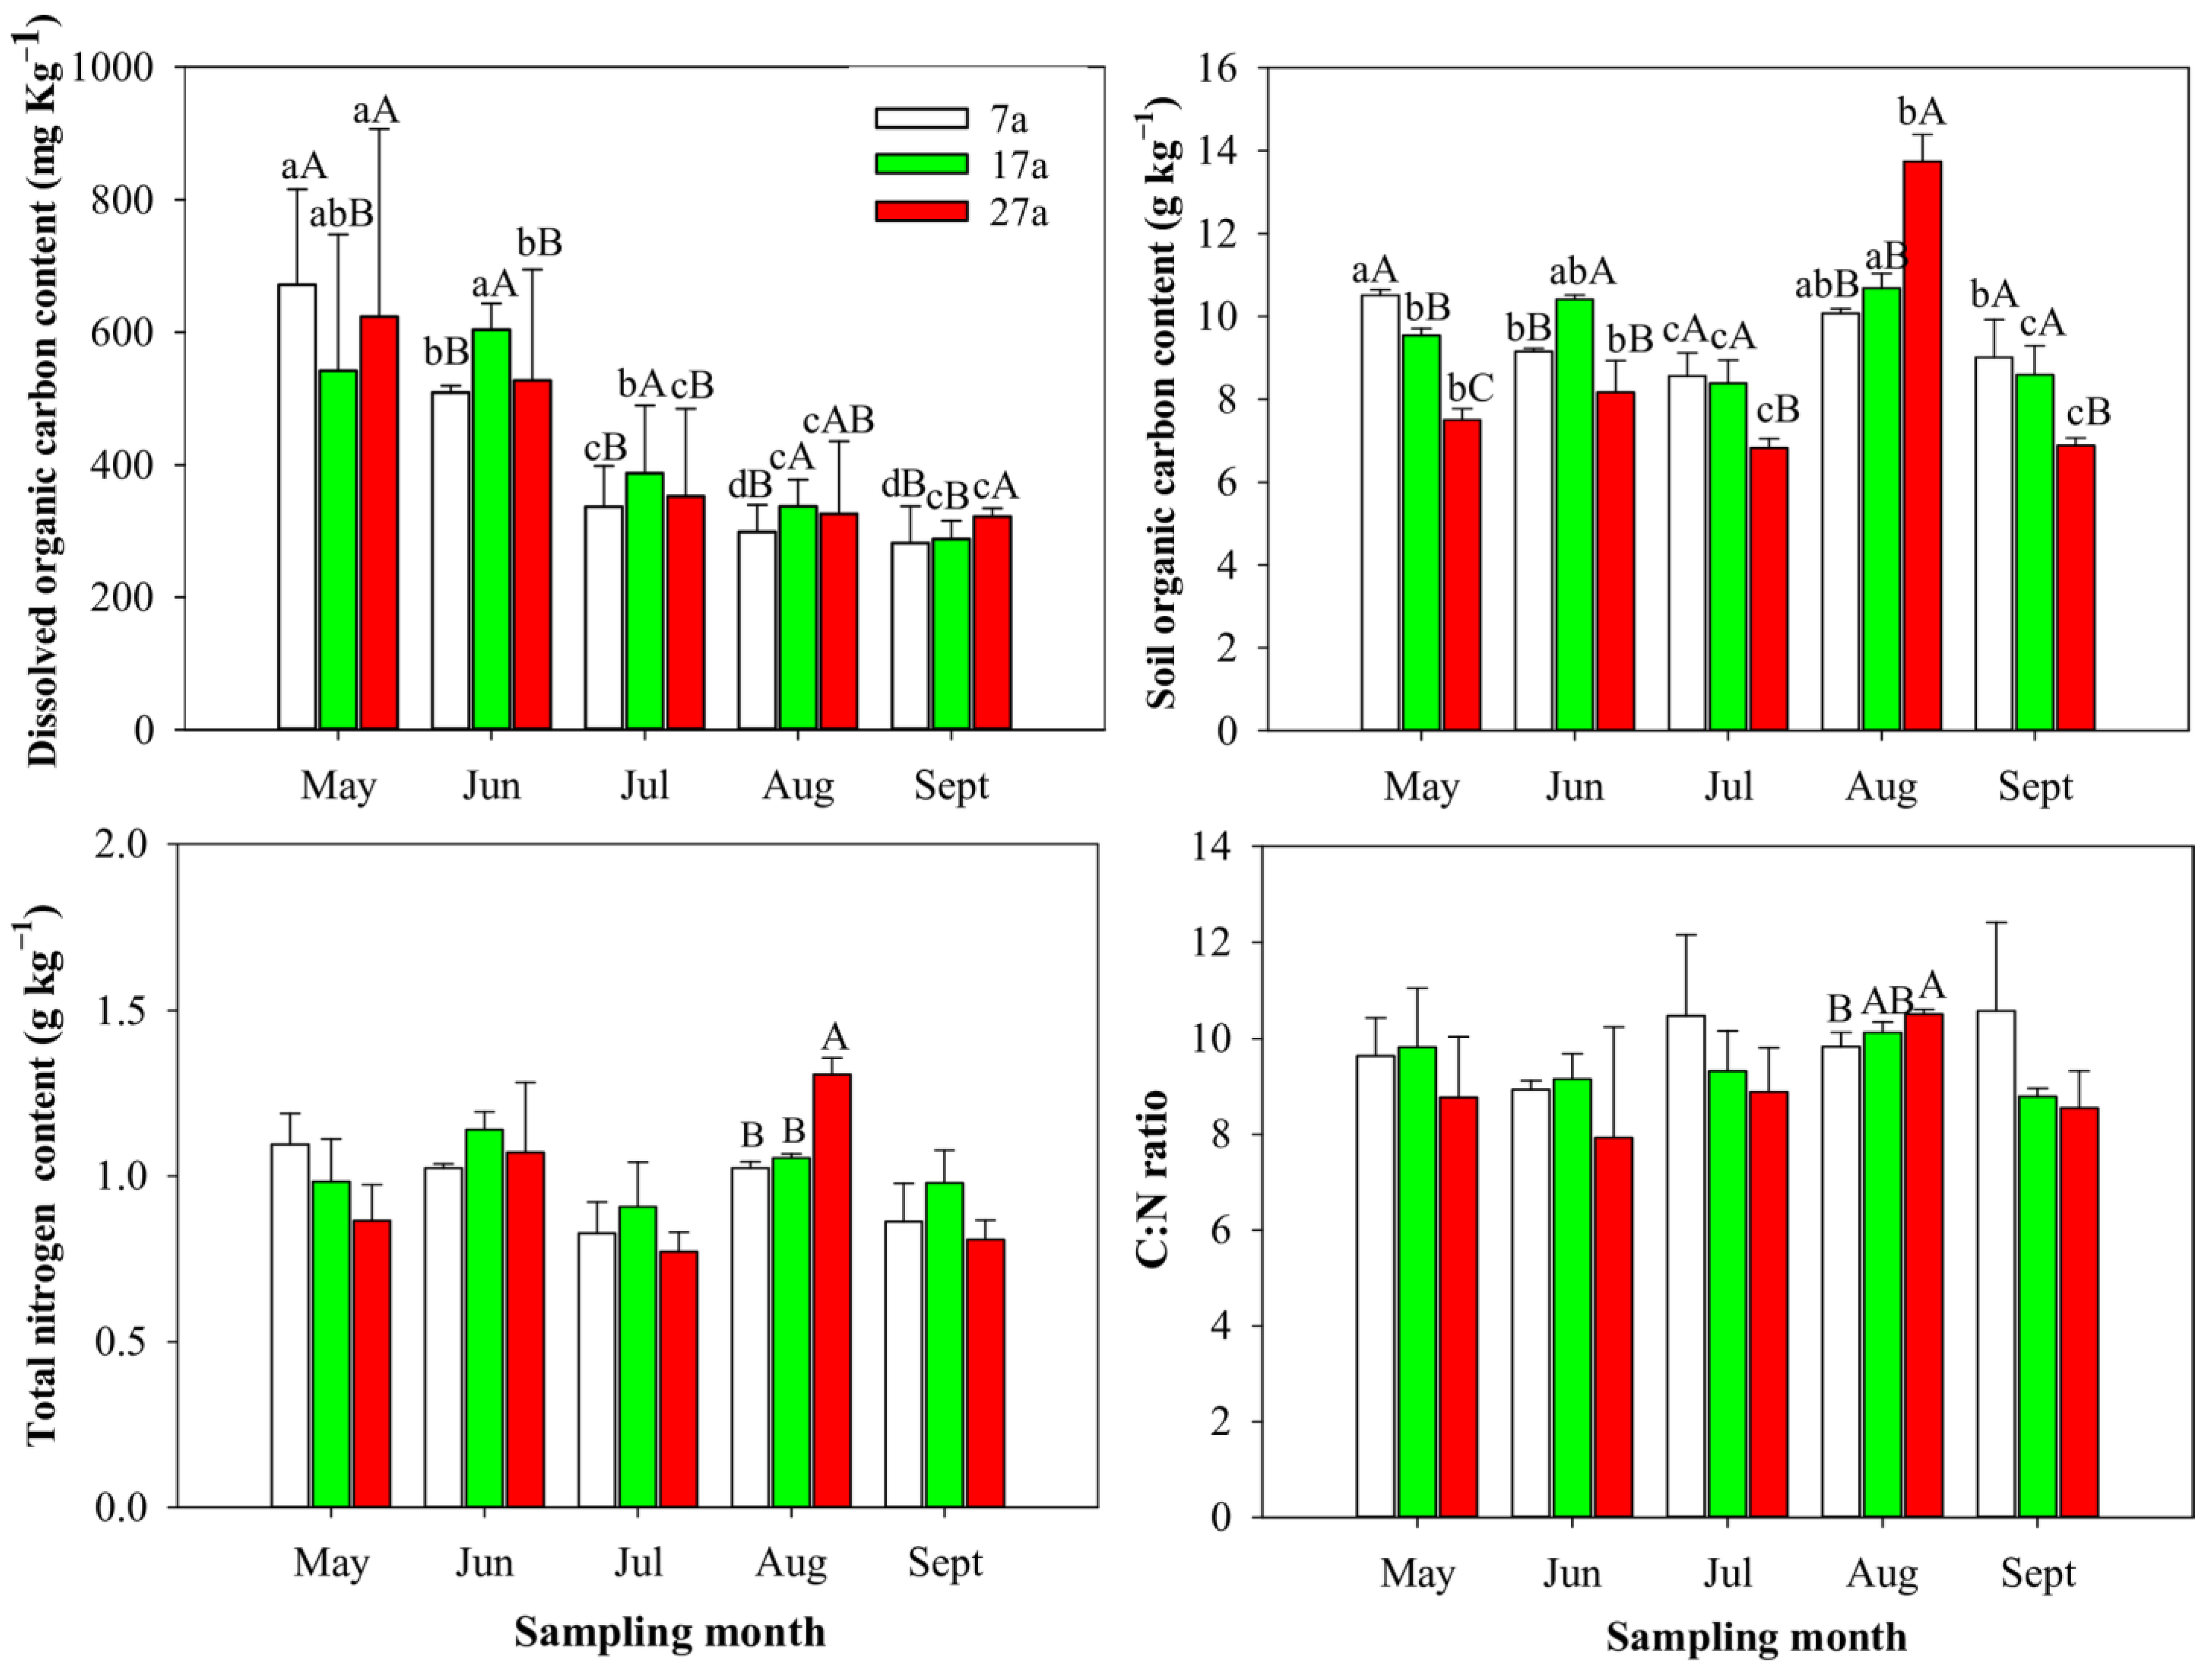
3.1. Seasonal Changes in the Soil Physicochemical Properties of Stands of Differently Ages

Significant seasonal variations in soil DOC and SOC contents were observed during the different months, whereas no significant variation in the soil total N contents and C:N ratio was observed during different seasons (Figure 1). Generally, DOC contents in the soils of stands of different ages significantly decreased with growth, and the highest soil DOC contents were observed in the early growth stage (Figure 1). Furthermore, the soil of the sapling forest had a higher DOC content than that of the other larch stands (p < 0.05) (Figure 2). The SOC contents across larch stands peaked in August, but no obvious seasonal trend in SOC content was observed among the different larch stands (Figure 1). Overall, the soils of the young forest (17a) had higher DOC contents than those of the other larch stands, and the lowest SOC content was observed in the half-mature forest (27a) (Figure 2). In the fast-growing season (August), we observed higher soil TN contents and C:N ratios in the half-mature forest than in the sapling forest and young forest (Figure 1). However, the total N content and C:N ratio in soils of different stand ages did not show significant differences (p > 0.05) (Figure 2 and Table S2).

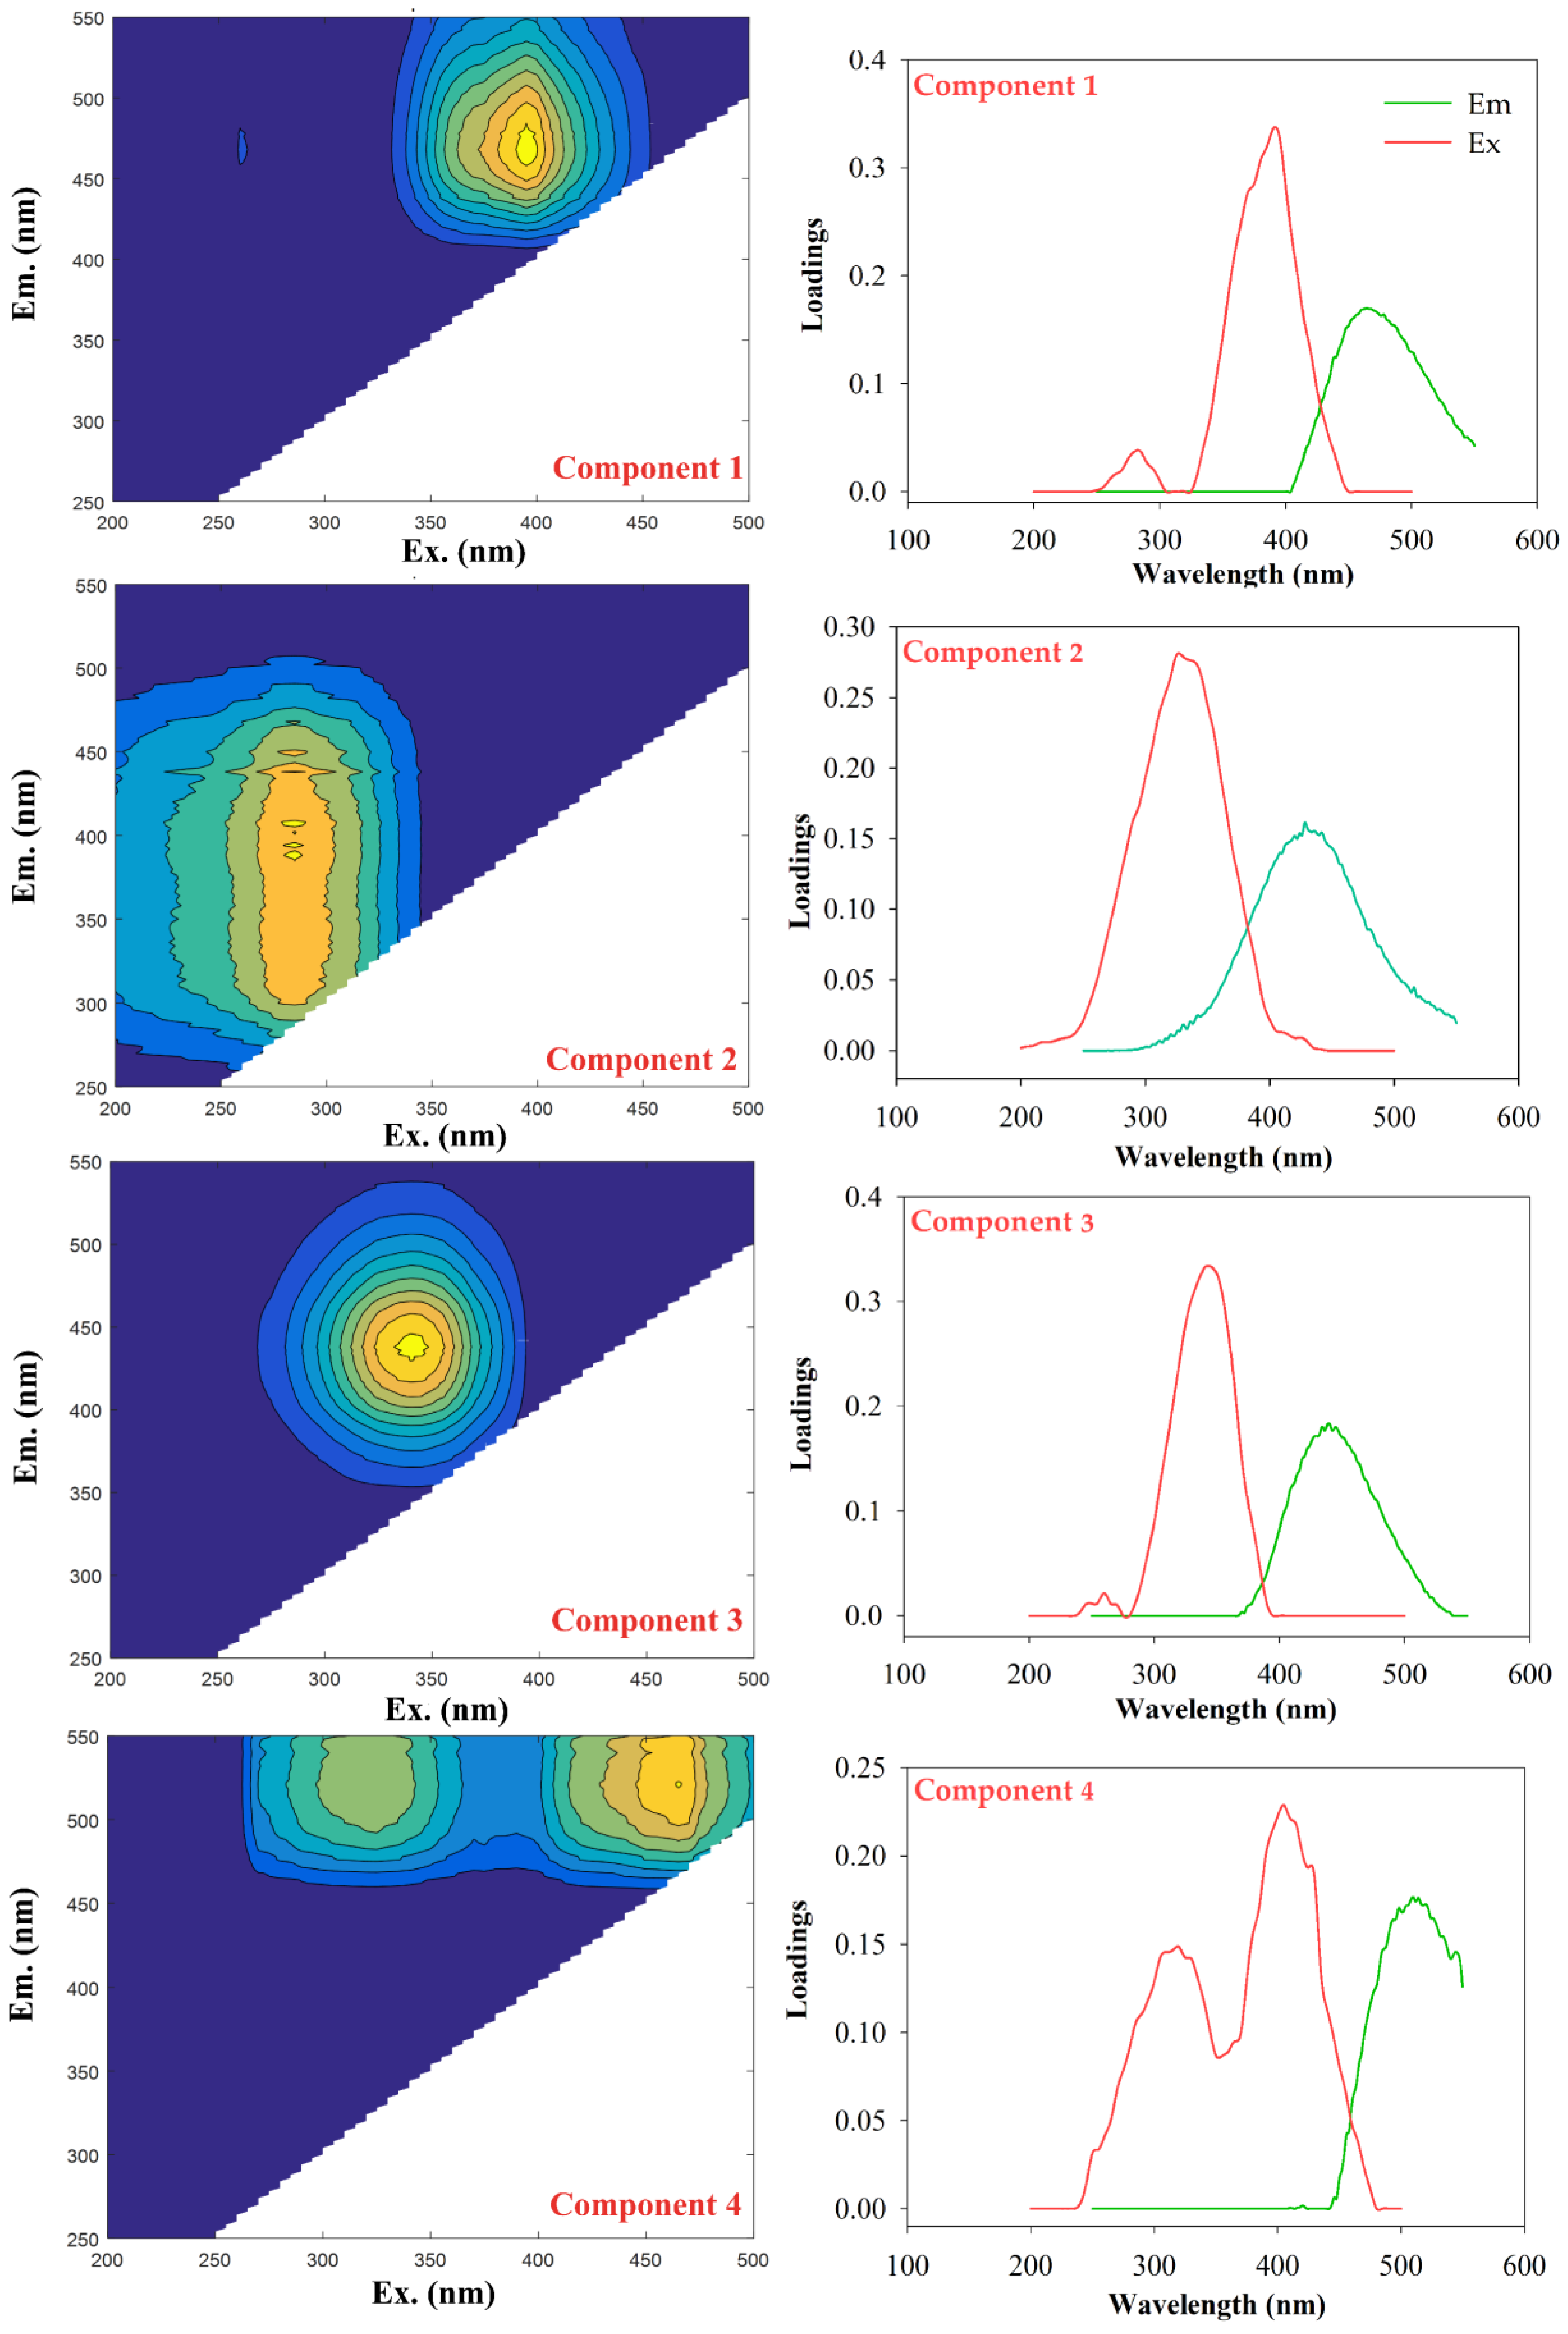
3.2. Characteristics of the Different Components Identified via EEM-PARAFAC Analysis

In this study, the soil DOM components from L. principis-rupprechtii Mayr. were decomposed into a four-component model. Table S3 shows that three humic-like structures (component 1, component 2 and component 3) and a fulvic-like structure (C4) were identified via EEM-PARAFAC analysis. The excitation wavelength (Ex) and emission wavelength (Em) loadings of the main peak locations and detailed information on the four components are summarized in Figure 3. The peak Ex/Em of component 1 (component 1) was 280 (390)/464 nm and was classified as a terrestrial humic-like fluorescent compound. The second component (component 2), with an excitation wavelength peak at 325 nm and a 428 nm emission wavelength represented a UVA humic acid-like structure with a low molecular weight that is usually associated with microbial processes in soil. The third component (component 3), with an excitation wavelength peak at 260 (345) nm and an emission wavelength of 440 nm represented a high molecular weight UVC humic acid-like component. The fourth component (component 4), with two peaks at Ex values of 320 and 405 nm and a 510 nm Em value was closely related to a typical fulvic-like fluorescent component structure (Table S3).

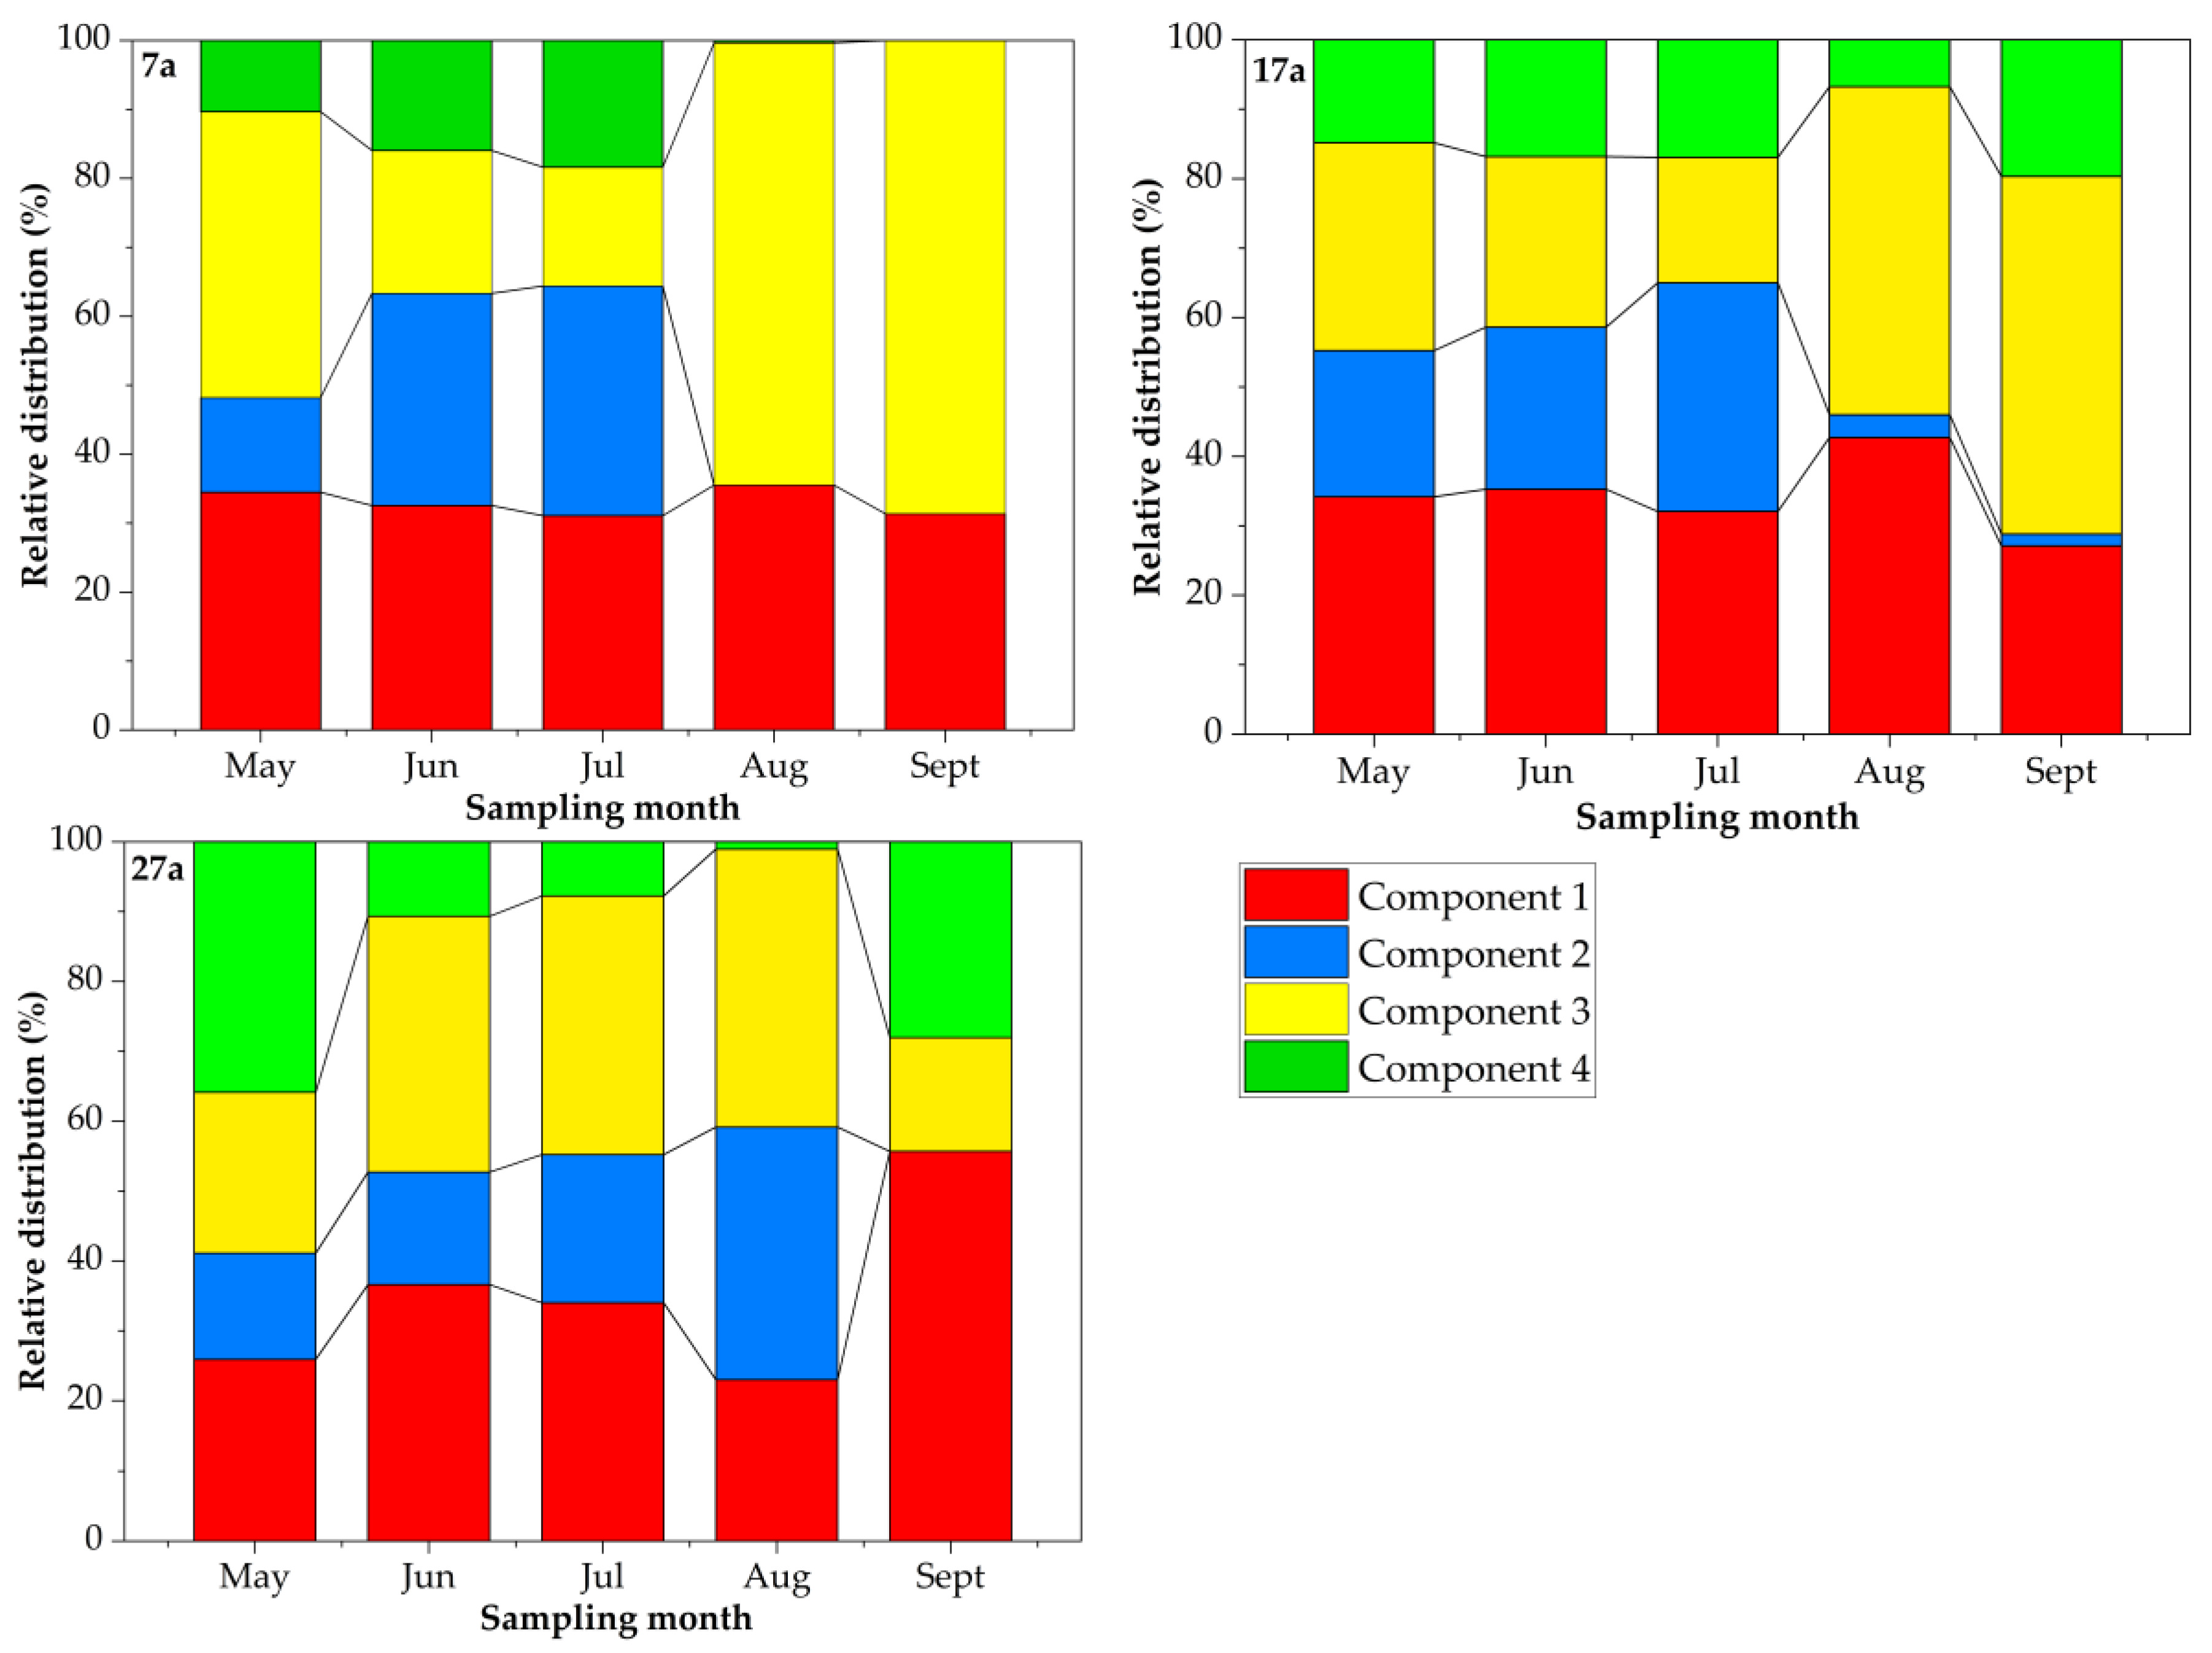
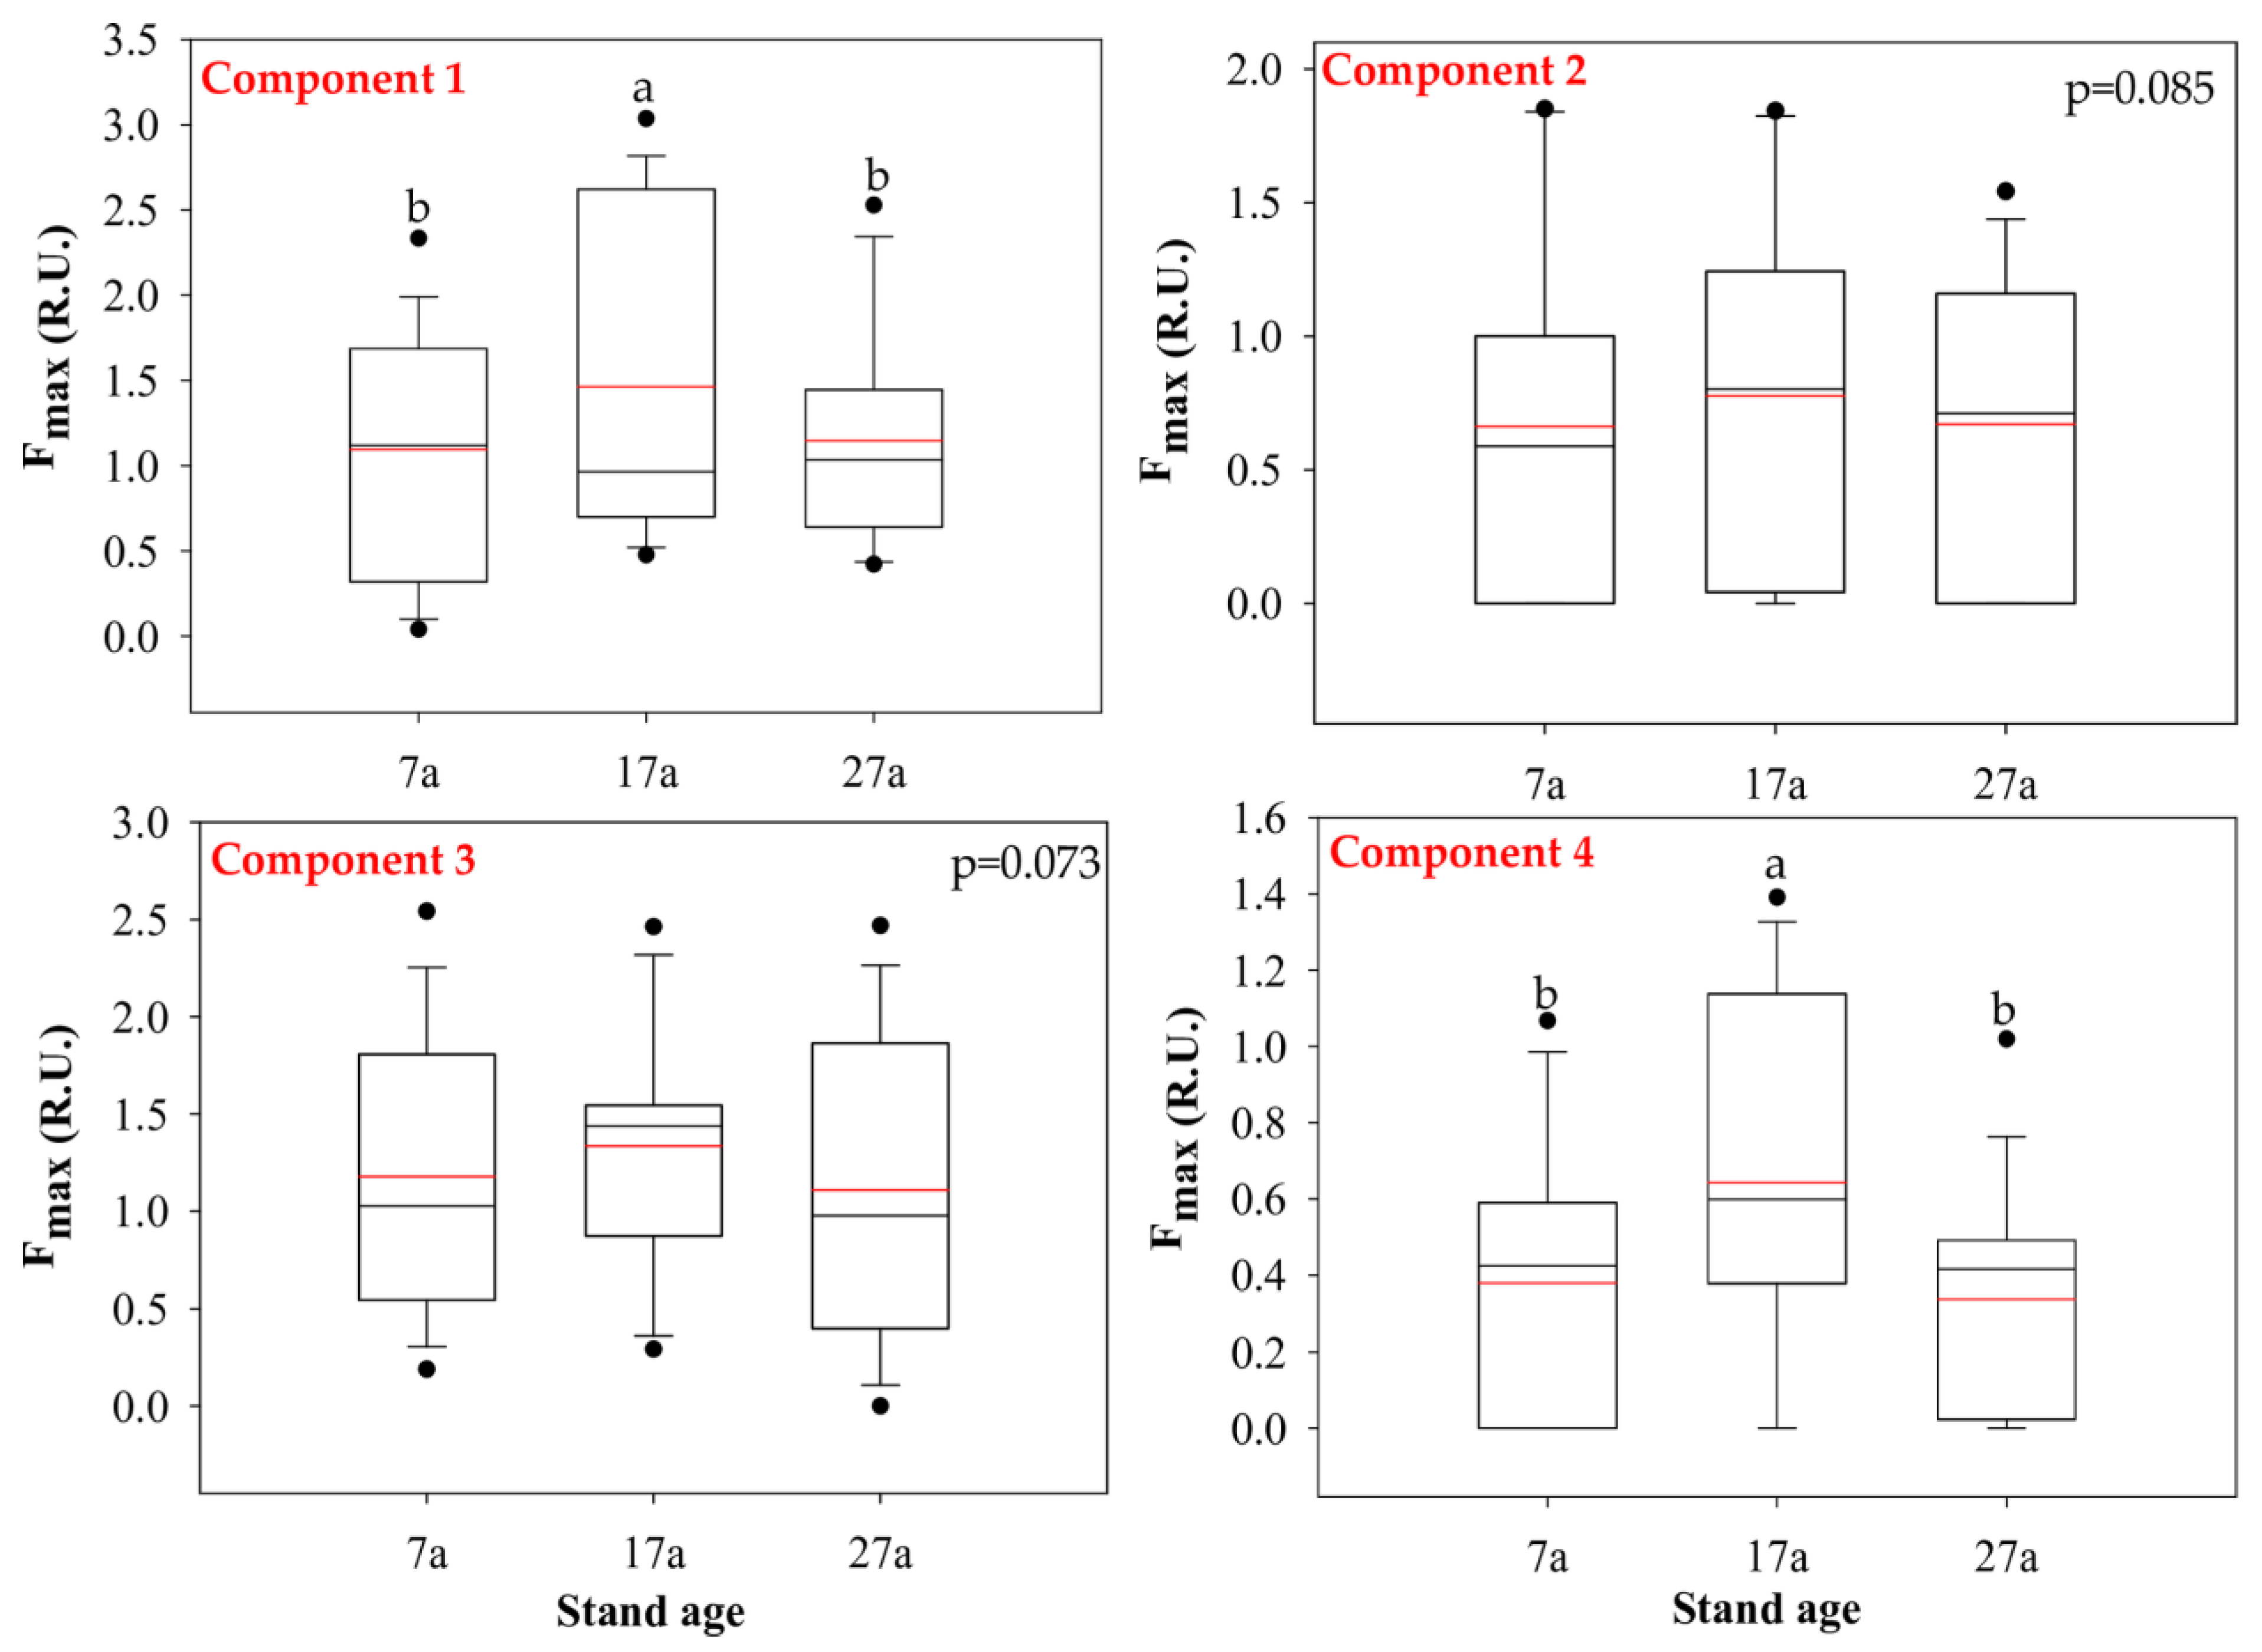
3.3. Relative Distribution of DOM Components

The relative distributions of the four components (component 1, component 2, component 3 and component 4) of DOM in the soil of L. principis-rupprechtii Mayr. were determined by PARAFAC analysis, as shown in Figure 4. Generally, the proportions of humic-like components (component 1, component 2 and component 3) in the soils of the differently aged L. principis-rupprechtii Mayr. were higher than that of the fulvic acid-like component (component 4) across the different seasons. The proportions of component 1 in the sapling forest (7a) and the young forest (17a) showed no obvious seasonal fluctuation, and little change was observed across the different sampling months. However, the proportion of component 1 in the half-mature forest (27a) showed obvious seasonal variation, and the proportion of component 1 increased with growth and peaked in September (55.67%). The proportions of component 2 and component 3 in the sapling forest (7a) and the young forest (17a) showed obvious seasonal changes. With the growth of larch stands, the proportions of component 2 in the sapling forest and young forest increased gradually, peaked in July (33.31% and 32.92%, respectively), then decreased and reached a minimum in September (0% and 1.73%, respectively). However, the proportions of component 3 in the sapling forest (7a) and young forest (17a) exhibited the opposite trend. With the growth of larch stands, the proportions of component 3 decreased gradually, with the lowest proportions in July (17.22% and 18.07%, respectively), then increased and peaked in September (68.64% and 51.50%, respectively) (Figure 4 and Figure S2). However, no clear seasonal variation tendencies in the proportions of component 4 were observed in the sapling forest (7a) and young forest (17a) with the growth of the larch stands. Furthermore, obvious temporal changes were observed in the proportions of the four components (component 1, component 2, component 3 and component 4) in the half-mature forest (27a); however, no clear seasonal change trends were observed in the proportions of the four components with larch stand growth.
The Fmax values (fluorescence intensity at the peak maxima) of the different fluorescent components of DOM from the soil of L. principis-rupprechtii Mayr. are summarized in Figure 5 and Table S4. The Fmax values of component 1 and component 4 demonstrated significant differences between the different stand ages. Generally, the mean Fmax values of component 1 and component 4 in the young forest (17a) were significantly higher than those in the other larch stands (p < 0.05). These Fmax values indicated that the young forest (17a) soils had higher component 1 and component 4 contents than those of the other larch stands. However, no significant differences were observed in component 2 and component 3 contents among the different stands (p > 0.05).

3.4. Variations in UV–Visible Absorbance and Fluorescence Spectra Indicators of DOM

Generally, the SUVA254 values of all larch stands increased with growth and peaked in August. The young forest (17a) had the highest SUVA254 values among the larch stands of different ages, and the half-mature forest (27a) had the lowest SUVA254 values among all stands (Figure 6A). No significant seasonal trends in the SR values of all larch stands were observed. Generally, the young forest (17a) had the highest SR values, and the half-mature forest (27a) had the lowest SR values of all larch stands (Figure 6B).
Significant seasonal changes in the FI values of the young forest (17a) were observed among the different growth seasons (p < 0.05), and the FI values decreased with growth. However, for the sapling forest (7a) and young forest (17a), no clear seasonal trends with growth were observed (p > 0.05). (Figure 6C). Overall, the HIX values of all the stands in this study were significantly lower than two. The HIX values of all the stand ages showed a seasonal trend of increasing and then decreasing with growth, peaking in August and reaching the lowest values in September (Figure 6D). Generally, the HIX values of the young forest (17a) were higher than those of the other stand ages; however, no significant differences in HIX values were observed among the stands of different ages across growth seasons (except in May and August, p < 0.05). The β:α values of all larch stands showed a significant increasing trend with growth (p < 0.05) and peaked in September (Figure 6E). The BIX values of the young forest (17a) and the half-mature forest (27a) showed similar seasonal trends in the β:α values, increasing with growth and peaking in September (Figure 6F). Additionally, no significant differences in FI, β:α and BIX values were observed among the larch stands of different ages across growth seasons (p > 0.05).

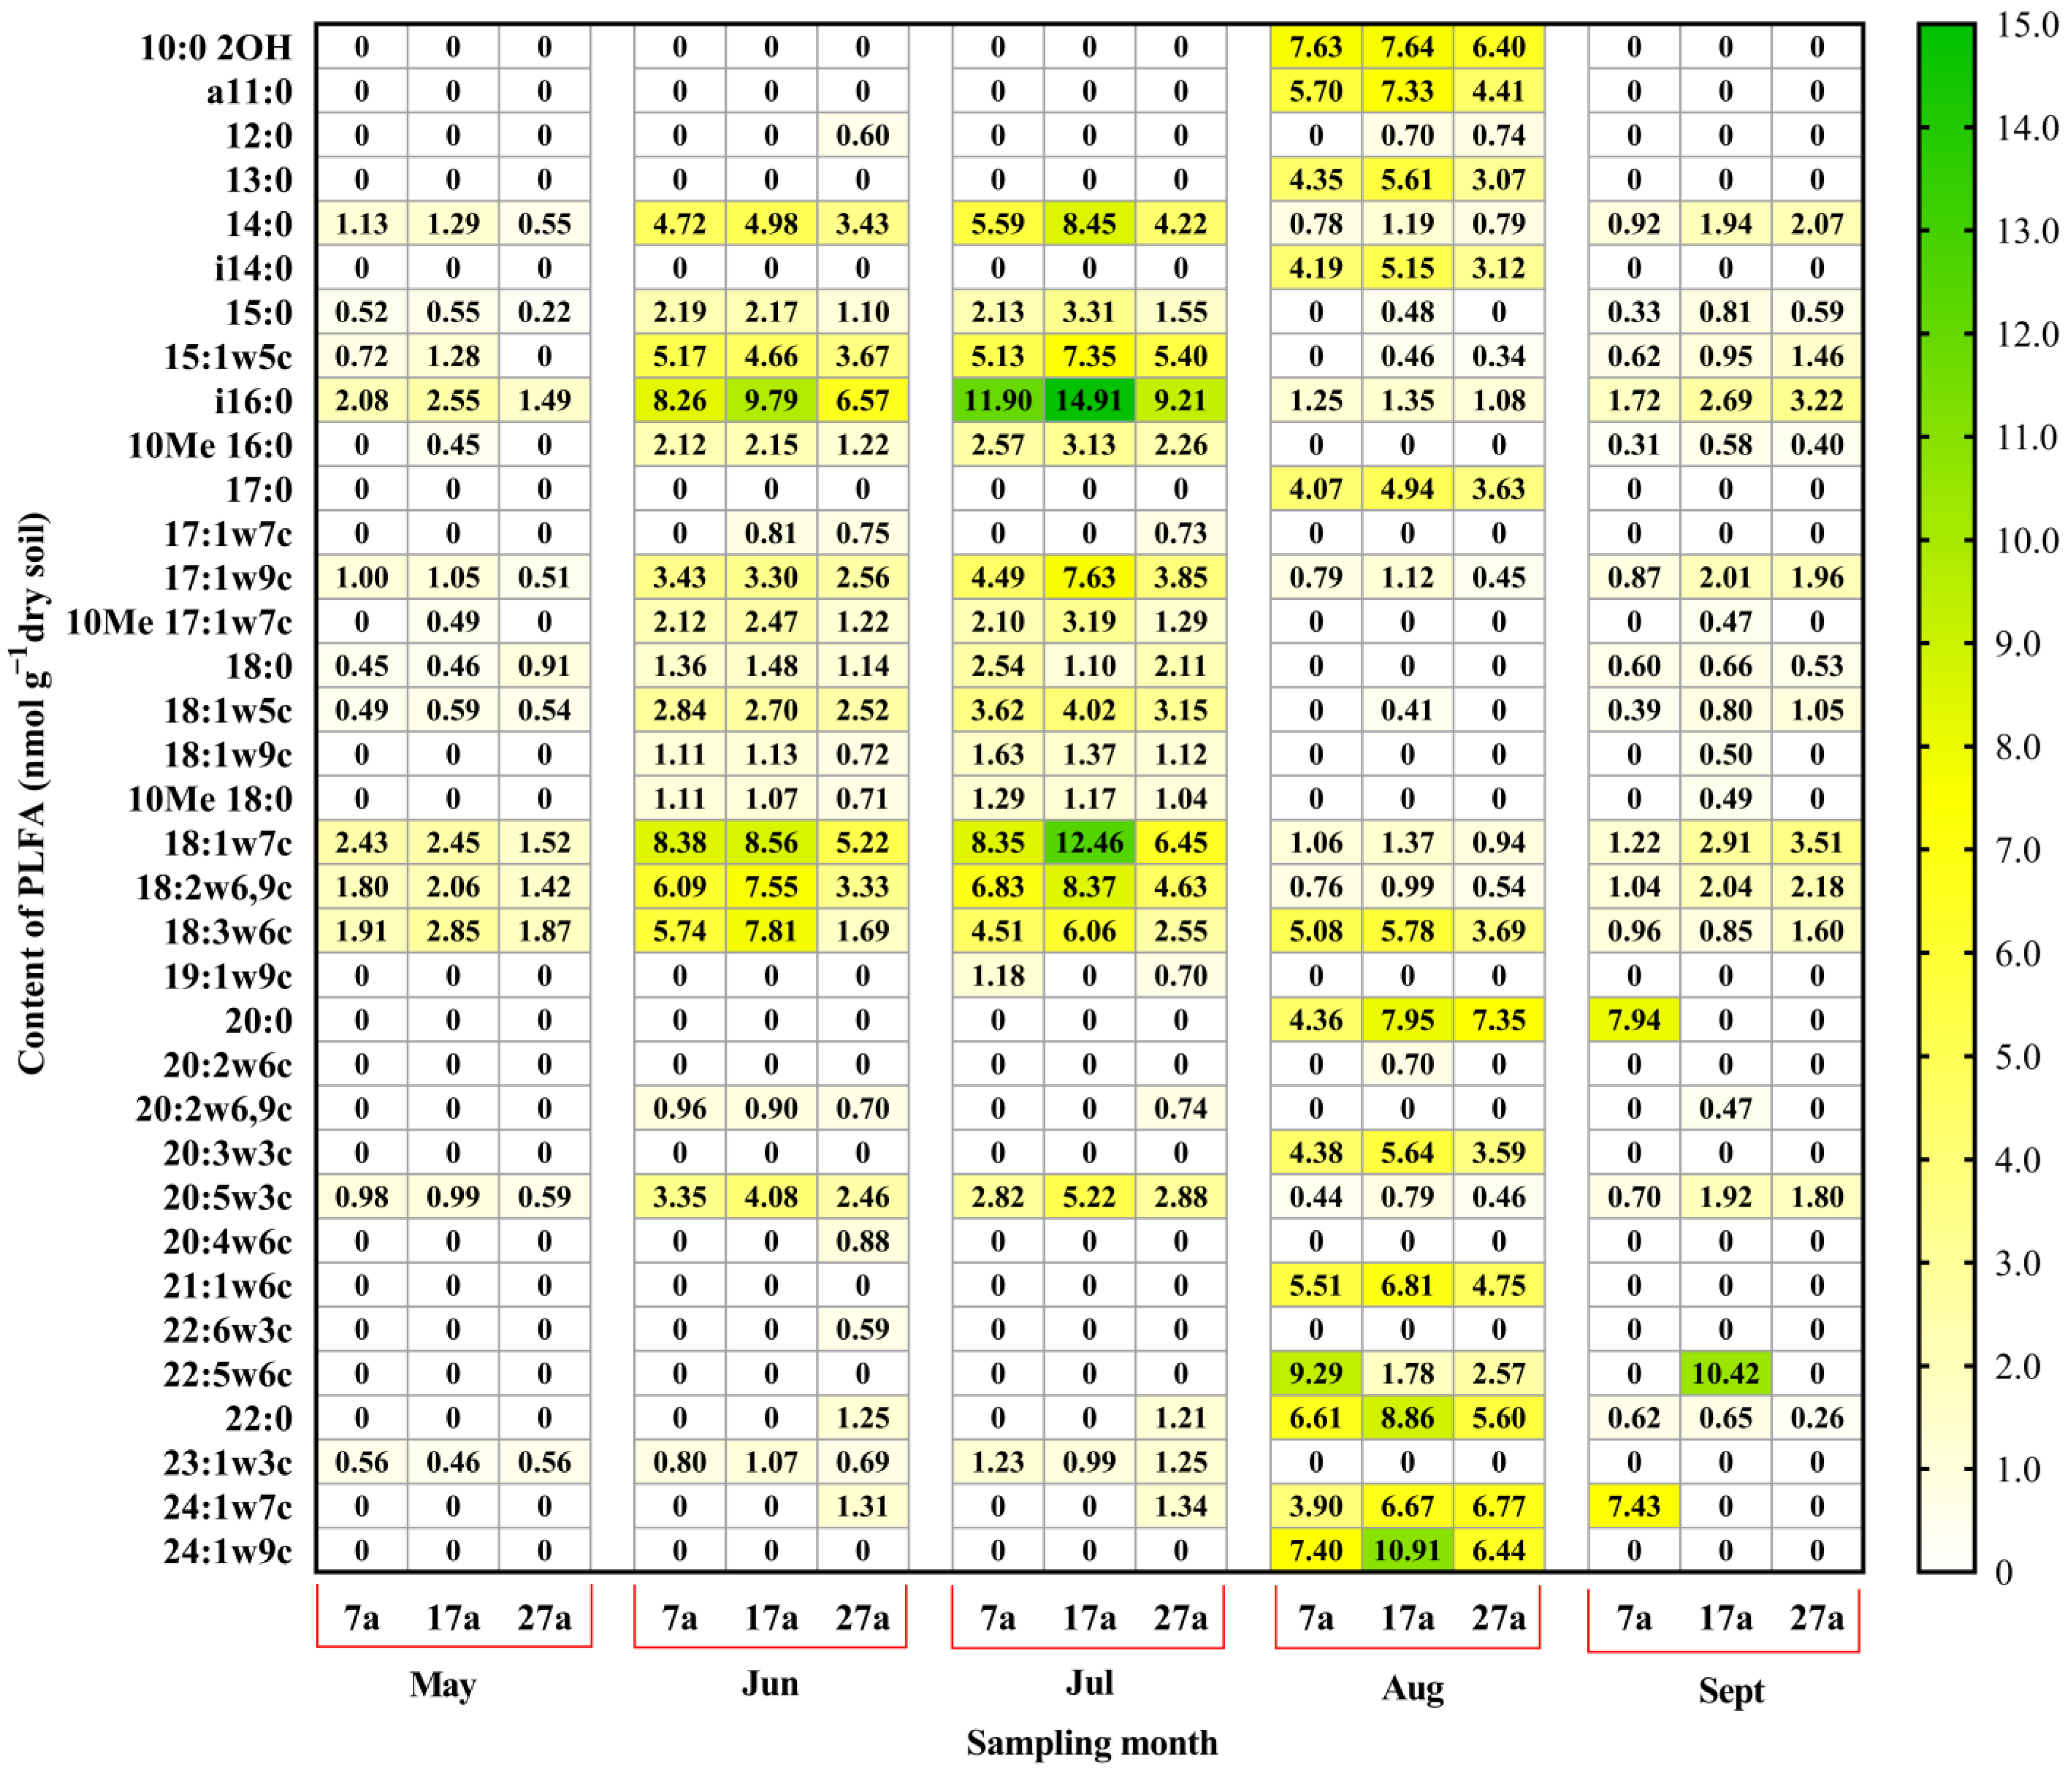
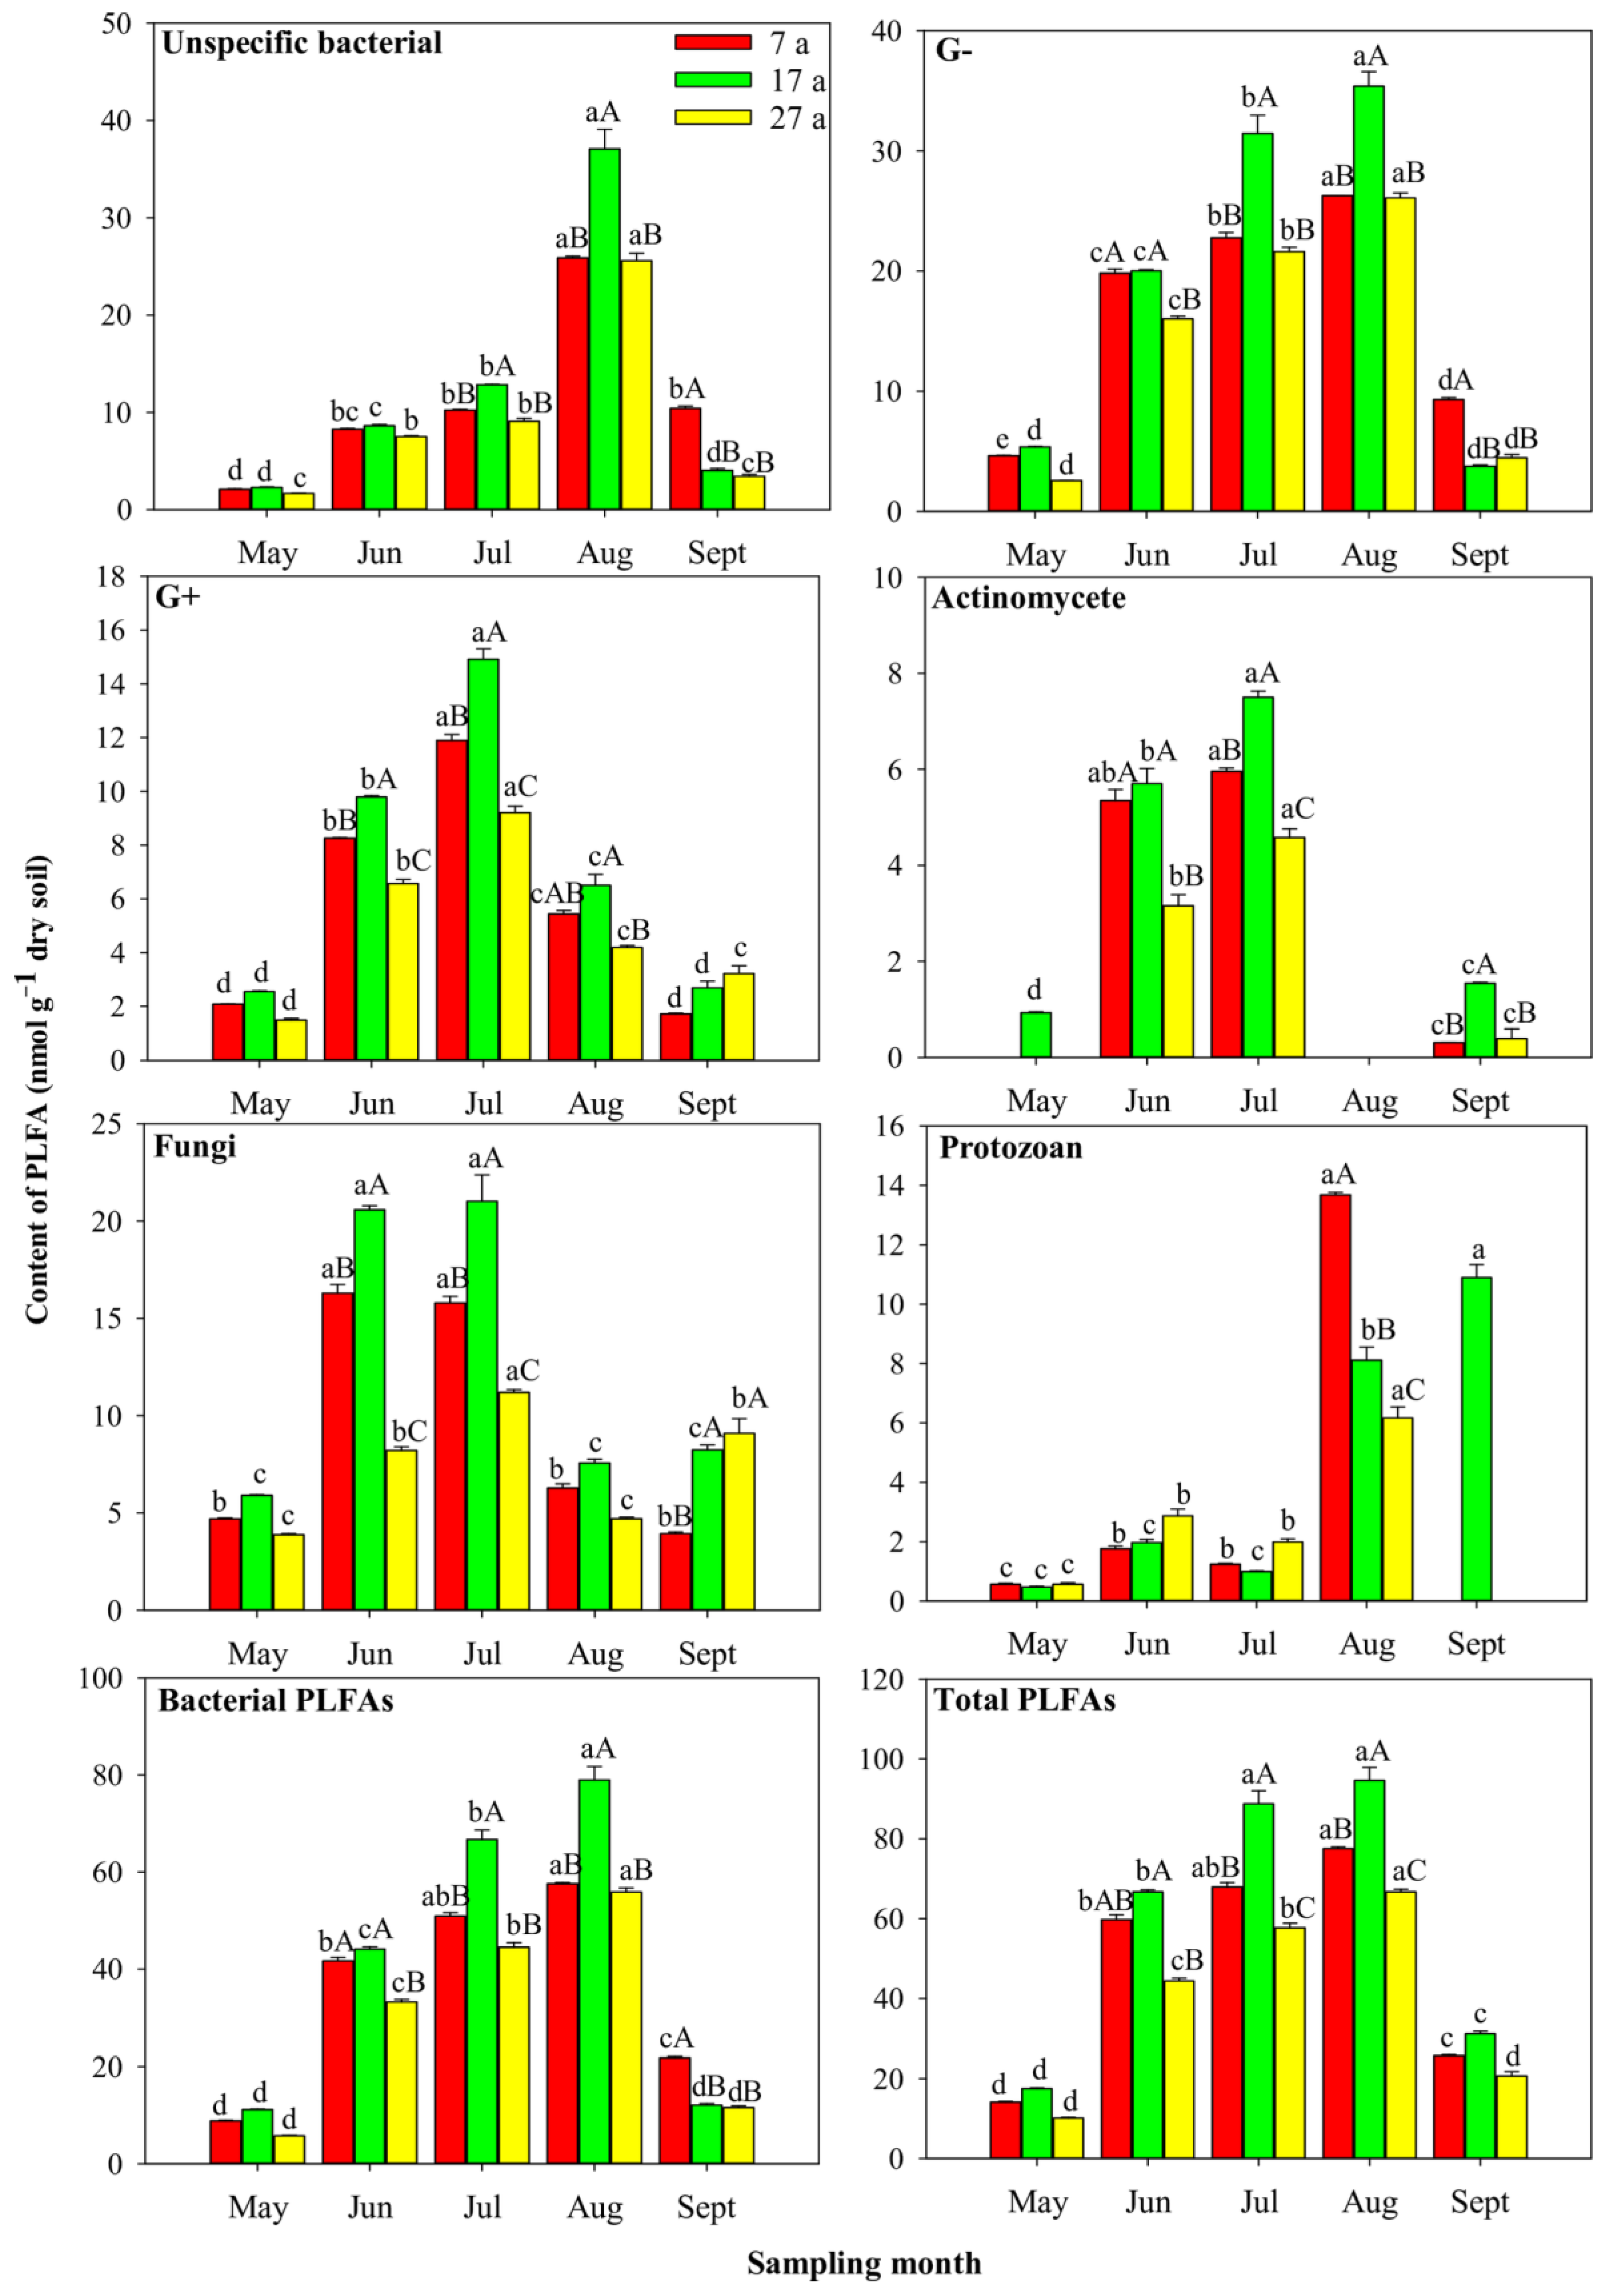
3.5. Seasonal Variations in Soil Microbial PLFAs in Stands of Different ages

Large variations in the PLFA biomarkers of different soil microorganisms were observed in the soils of all larch stands across the growth seasons (Figure 7). The species and contents of the PLFA biomarkers of bacteria, fungi, actinomycetes, and protozoans varied seasonally. Across different growing seasons, the common PLFA biomarkers of all the larch stands were 14:0, i16:0, 17:1w9c, 18:1w7c, 18:2w6,9c, 18:3w6c and 20:5w3c. The soil of all the larch stands had higher contents of 14:0, i16:0,18:1w7c, 18:2w6,9c and 18:3w6c across growth seasons, and the maximum concentrations of these PLFA biomarkers were observed in July. Furthermore, the content of PLFA biomarkers of different soil microorganisms in the young forest (17a) was higher than that in the sapling forest (7a) and half-mature forest (27a). The half-mature forest (27a) generally had the lowest content of PLFA biomarkers of different soil microorganisms among all the larch stands. Additionally, some PLFA biomarkers of soil microbes in all the larch stands were observed only in specific growth periods; for example, 10:0 2OH, a11:0, 12:0, 13:0, i14:0, 20:3w3c,21:1w6c and 24:1w9c were observed only in August.
In addition, the total abundance of different groups of PLFA biomarkers of soil microorganisms of all larch stands showed large seasonal variation (Figure 8). The total microbial abundance of different types of soil microbes across the larch stands increased with growth and peaked in July or August. Total microbial abundance (total PLFAs of different types of soil microbes) showed a distinct difference between different stand ages. Generally, the contents of PLFA biomarkers of different types of soil microbes were higher in the young forest (17a) than in the sapling forest (7a) and half-mature forest (27a) (except for the PLFA biomarkers of protozoa). For all larch stands, the highest content of PLFA biomarkers of the unspecific bacterial, gram-positive bacteria (G+), gram-negative bacteria (G-), actinomycetes, fungi, and protozoa were observed in the-fast growth period (July or August). Furthermore, seasonal differences in PLFA biomarkers of the soil microbe community indicated that the highest proportions of PLFAs were bacteria, of which the gram-negative bacteria (G-) had the largest proportion, followed by the PLFA biomarkers of unspecific bacterial and gram-positive bacteria.

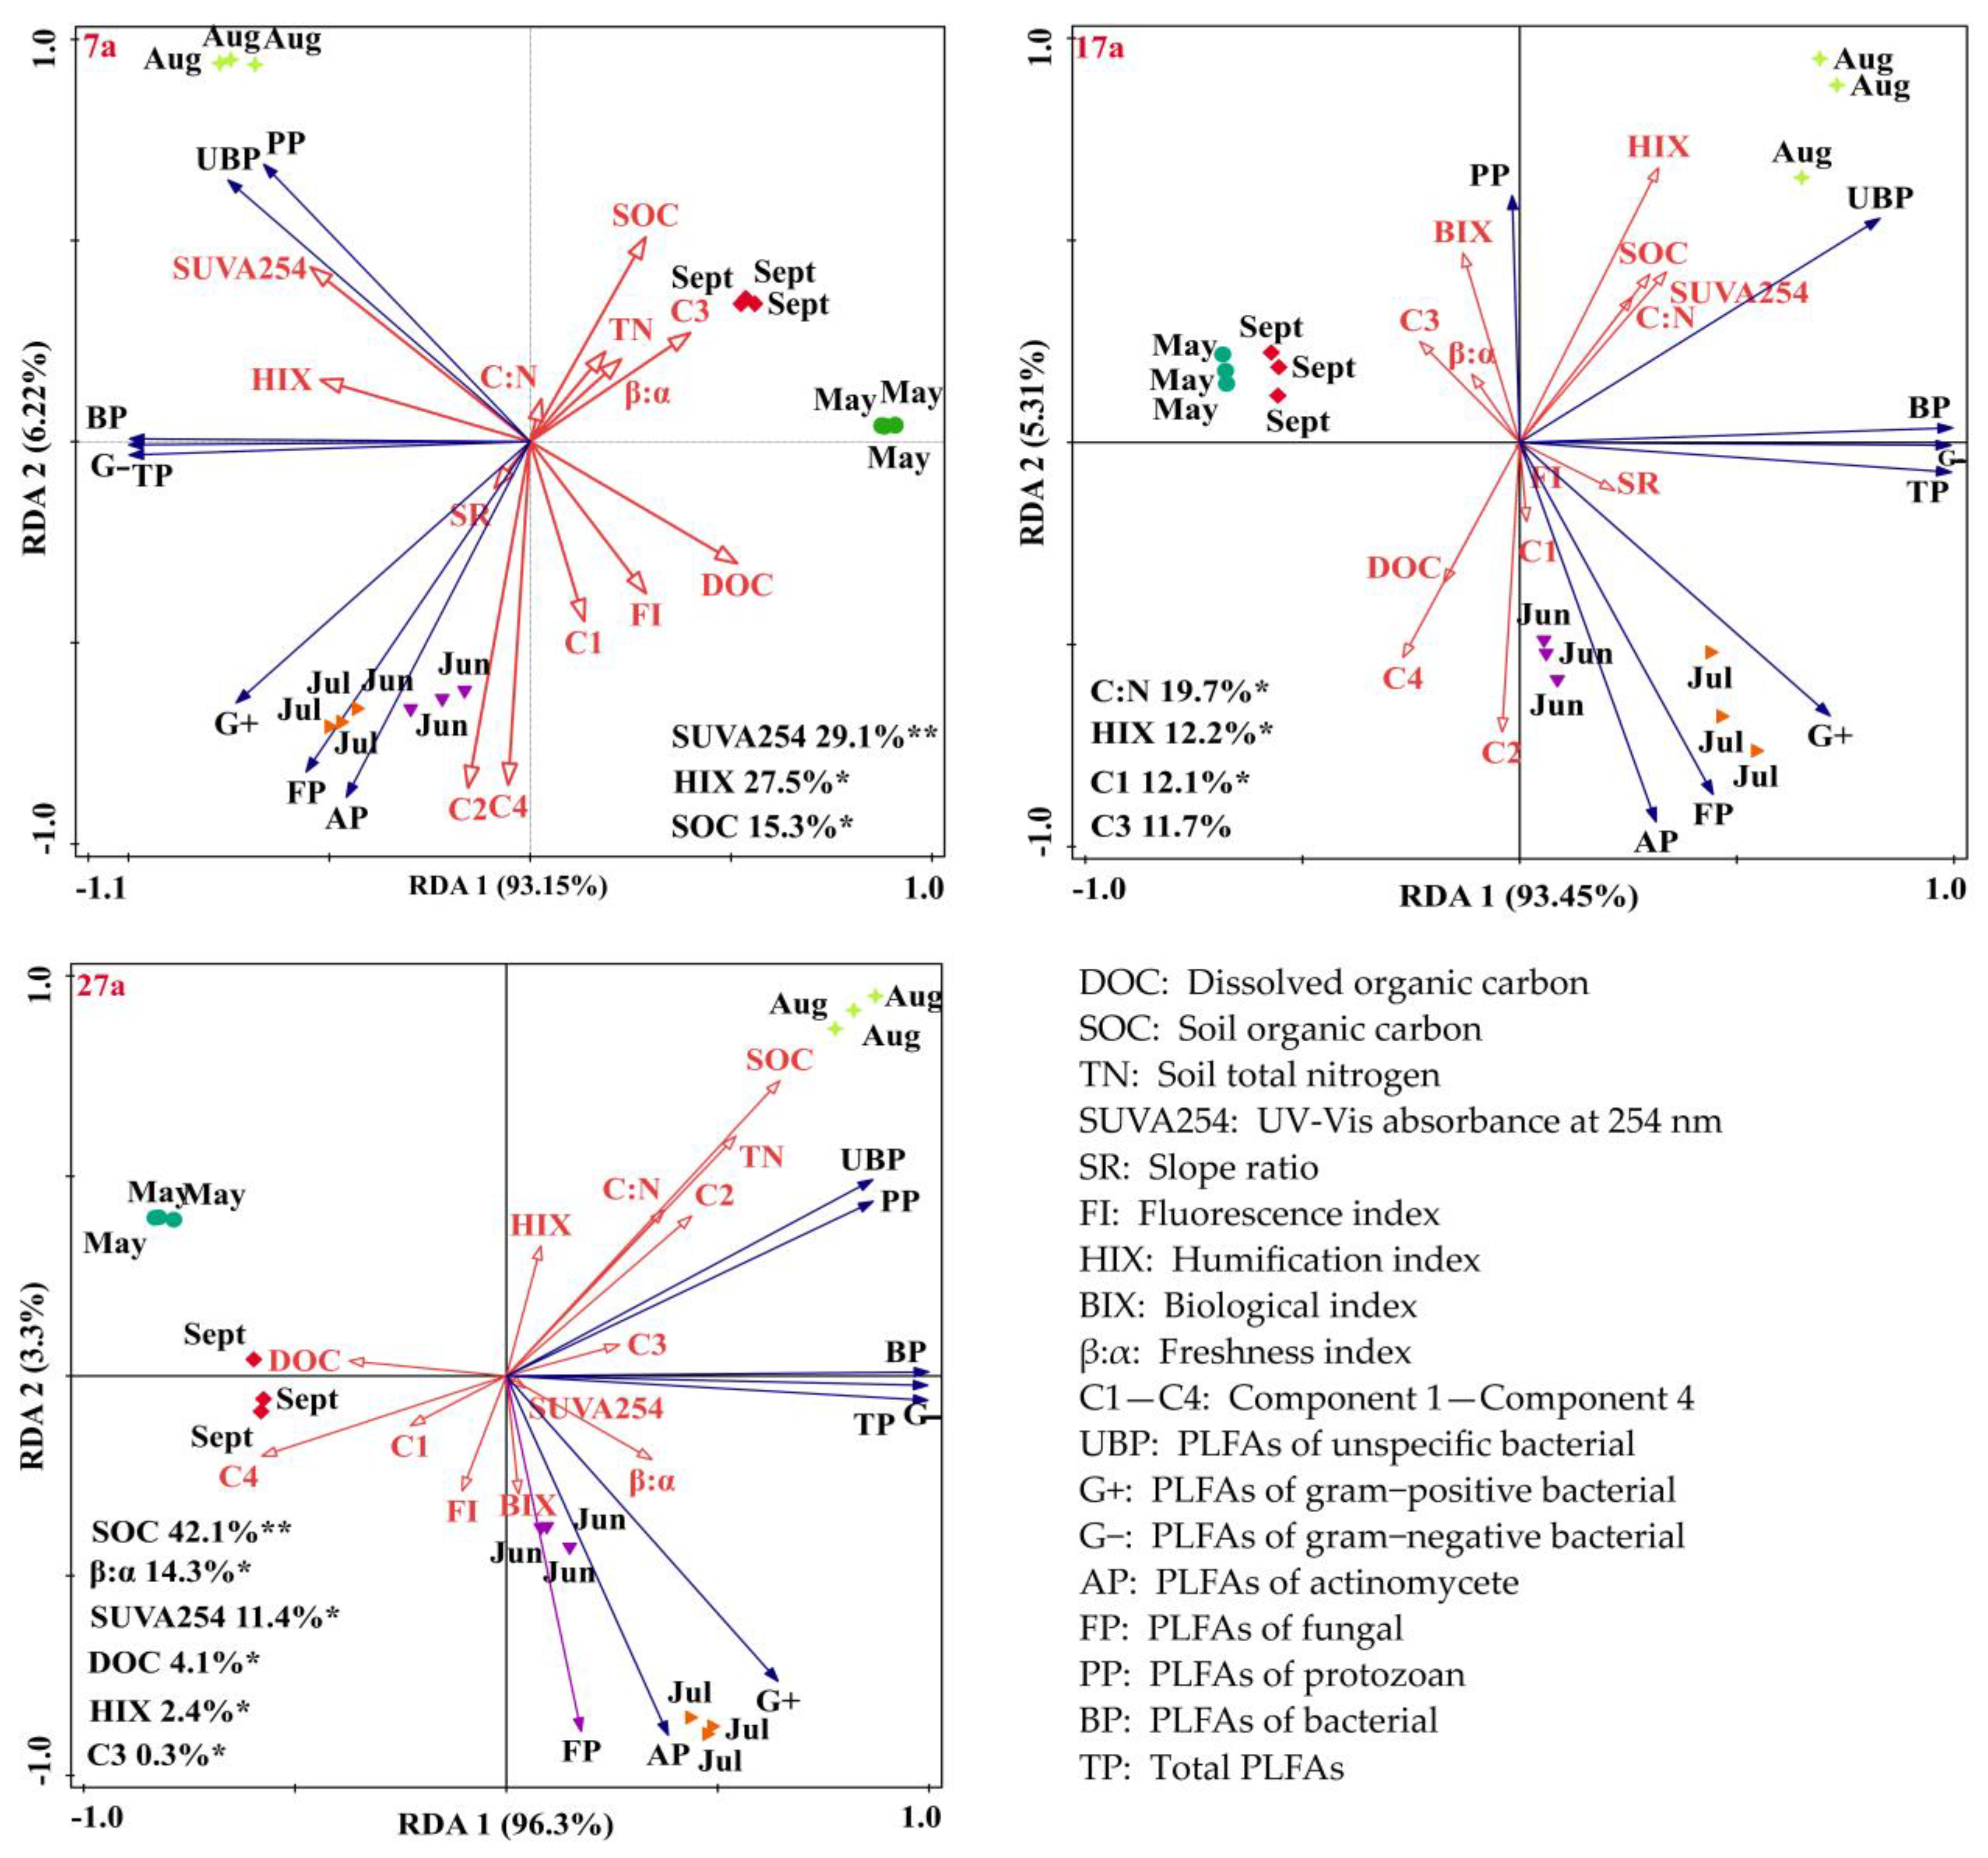
3.6. Correlations between the Soil Physicochemical Factors, Characteristics of DOM and Soil Microbial Community Composition

RDA suggested that changes in soil physicochemical factors and the characteristics of the soil DOM component played a key role in shaping the structure of the soil microbial communities in larch stands of different ages (Figure 9). In the present study, bacterial diversity remained steady over the different stand ages. For different stand ages, the factors that strongly correlated with soil microbial community characteristics were different; for example, the SUVA254, HIX values of DOM, and SOC contents were key factors influencing the soil microbial community characteristics of the sapling forest (7a), and the soil C:N ratio, HIX values of DOM, and component 1 and component 2 contents of soil DOM were major factors affecting the soil microbial community characteristics of the young forest (17a). However, for the half-mature forest (27a), SOC, DOC and component 3 content, and β:α, SUVA254, HIX values of DOM were major factors affecting the soil microbial community. In particular, the HIX value of the DOM was the common factor affecting the structure and composition of the soil microbial community of all stand ages.
Changes in the four components (component 1, component 2, component 3, and component 4) of soil DOM, SUVA254, FI, HIX, SOC and DOC had an obvious effect on the soil bacterial structures and compositions of the sapling forest (7a), and the changes in TN, SR, β:α and C:N had a relatively low impact. DOC, FI, and component 1 were strongly negatively correlated with the PLFA abundance of unspecific bacterial, protozoan, bacterial, G- and total soil microorganisms, but had a positive association with the PLFA abundance of G+, fungi, and actinomycetes. SOC and C3 exhibited significant negative correlations with changes in the PLFA abundance of G+, fungi and actinomycetes, but a positive association with the PLFA abundance of unspecific bacteria and protozoans.
Changes in components 2, 3 and 4 of DOM, BIX, HIX, SOC, SUVA254, DOC, and C:N had an obvious effect on the soil bacterial structures and compositions of the young forest (17a), but the changes in FI, component 1, SR, and β:α had a relatively low impact. HXI, BIX, SOC, SUVA254, C:N and component 3 exhibited significant negative correlations with changes in the PLFA abundance of G+, fungi and actinomycetes, but a significant positive association with the protozoans. Furthermore, component 4, component 2 and DOC had a significant positive association with the PLFA abundance of actinomycetes, fungi and G+. For the half-mature forest (27a), the changes in SOC, TN, component 2, C:N, component 4, DOC, β:α and HIX had an obvious effect on the soil bacterial structures and compositions, but the changes in component 3, FI, BIX and component 1 had a relatively low impact (Figure 9). Component 4 and DOC exhibited significant negative correlations with changes in the PLFA abundance of unspecific bacterial, protozoan, bacterial, G- and total soil microorganisms, but SOC, TN, component 2, C:N, β:α and HIX possessed strongly positive correlations with them.

4. Discussion

4.1. Seasonal Variations in Soil Physicochemical Properties of Stands of Different Ages

In this study, large ranges of SOC and DOC contents across different growing seasons were observed, and soil TN content and C:N were not affected by stand age and the growing seasons; indicating that growing season and stand age can significantly influence SOC turnover, which was consistent with findings in other reports [37,38,39]. Furthermore, this finding indicated that stand age plays a major role in forest ecosystem nutrient cycling and soil microbial community structure. Changes accompanying stand ages and ambient temperature may alter the characteristics of the litter [40,41], affect the availability of soil microbes and the structure of the soil microbial community, and affect nutrient cycling and turnover of SOM [18]. Therefore, the SOC contents across the larch stands peaked in August. In this study, the young forest (17a) had higher DOC contents in the soil than did the other stand ages, indicating that it had a better soil microbial community structure [1]. In forest ecosystems, litter decomposition by soil microorganisms is an important factor affecting the characteristics of soil C and N [24]. Generally, litter with a lower C:N ratio can be decomposed more quickly by soil microorganisms, resulting in a high rate of decomposition of SOM [42]. The optimal C:N ratio for litter to be decomposed by microorganisms is less than or equal to 25; however, the litter C:N of L. principis-rupprechtii Mayr. In this region was greater than 25 (>80) [43], which proved difficult for soil microorganisms to decompose. Furthermore, the SOC and DOC contents decreased significantly with stand age, reflecting a purely consumption-based model of SOC and DOC change in this study. This result is opposite to the finding of Li et al. (2019) [1], indicating that the consumption rate of SOC and DOC was higher than the input rate of SOC and DOC, which may have led to an imbalance in soil nutrient cycling and a consequent decrease in soil fertility in the study region.
Furthermore, with soil DOC content as the indicator for evaluating soil DOM content, compared with other studies, we found that the DOC content in soils from different land-use types differed significantly. For example, the DOC contents in the soils from Eucalyptus urophylla plantation forests in Guangdong, China, and upland forests in Alaska, USA were 6.86 and 15.2 mg L−1, respectively, (in this study, the DOC contents in the soils of larch stands of different ages were 40.3 to 95.93 mg L−1) [38,44]. However, Li et al. (2019) reported that the soil DOC content in soils from a Robinia pseudoacacia natural forest in Yan’an, China, was 201.25 mg kg−1 [1]. Significant differences in soil DOC content may be due to different tree types, soil types and soil–water content [45,46]. To better understand the variation in the DOM characteristics caused by differences in environmental factors, we suggest that additional information on geography, environment, climatic factors, and geology should be considered when studying the biogeochemical cycle of DOM.

4.2. Effects of Seasonal Variations on Soil DOM Characteristics of Stands of Different Ages

Generally, DOC is used as an indicator in the quantitative evaluation of DOM content in soil [27]. In this study, significant differences were observed in the soil DOC content of larch stands of different ages, and the soil DOC increased and then decreased with stand age. Previous research has indicated that the activity of soil microorganisms can affect litter decomposition and then affect the content of DOC in soil [47]. A high DOC content in soils can enhance soil microbial activity and microbial abundance [10,14], which means that there were significant differences in the soil microbial activity among larch stands of different ages in this study. The results indicated that the soil microbial activity of the young forest (17a) was higher than that in the other stands. This was confirmed by the soil of the young forest (17a), which had the highest content of total PLFA among the different stand ages. Additionally, the SOC content showed a similar change trend with stand age as did the DOC content in the soil, suggesting that SOC is a regulating factor of DOC content in soil [14].
In this study, three humic acid-like substances and one fulvic acid-like substance were identified from the soil samples. In particular, the main component of the soil DOM of different stand ages was humic acid-like substances, indicating that humic acid-like components were mainly derived from the decomposition of the litter of L. principis-rupprechtii Mayr. Differences in soil microbial activity and soil organic matter content led to the differences in the content of humic acid-like components and fulvic acid-like components among different stand ages [10,48]. Although no differences in the DOM components were observed among all larch stands, the relative distribution of the four components exhibited obvious seasonal variations due to the seasonal variations in the quantity and consumption of DOM [49,50]. In the present study, the main components of soil DOM of all the larch stands were humic-like components, and the proportions of the fluorescence intensity of humic-like components were significantly higher than those of the flavonoid components, indicating that the source of soil DOM was probably mainly derived from the decomposition of litter [51].
Previous research has suggested that the SUVA254 and SR values of soil DOM are significantly affected by soil nutrient characteristics [1]. Higher SOC and DOC contents could accelerate the degree of soil humification and increase the proportion of aromatic components and large molecular weight substances in soil DOM [14,38]. The SUVA254 and SR values of all the larch stands showed similar upward trends, indicating that the molecular weight and humification degree of the soil DOM increased with growth and peaked in the fast-growth stage, which was confirmed by the seasonal variations in SOC content and HIX indexes. Previous research suggests that litter decomposition by microorganisms is the main source of soil DOM in forest ecosystems, and the degree of soil decay and soil microbial abundance and activity were positively correlated [10]. Therefore, the young forest (17a) had the highest SUVA254 values of all the larch stands, indicating higher microbial activity in the soil [52].
Seasonal changes in the FI values of the differently aged L. principis-rupprechtii Mayr. Indicated that in the early growth stage (May and June) the soil DOM was derived from mixed sources (as reflected by FI values ranging from 1.20–1.38 and BIX values < 1). However, in the middle and later growth stages (July to September), the soil DOM in all the stands originated mainly from plant residues and SOM rather than from biological/microbial sources (as reflected by FI values for all stands < 1.2 and BIX < 1). Additionally, the BIX further showed that the microbial-derived DOM contribution to the total DOM pool was somewhat limited in all growth stages and that the contributions of other DOM sources were smaller (as reflected by BIX values for all stands < 1). The narrow range of BIX values in all the larch stands of different growth stages indicated that the soil in our study region originated from a single source. The higher HIX values in all the stands in May represented a higher degree of humification than that observed in the other growth stages. However, the HIX values of all the stands decreased with growth, indicating that the degree of humification also decreased with growth. This was due to the decrease in soil DOC content with growth, which limited the microbial activity in the soil [18]. Previous studies have shown that the degree of humification is negatively correlated with the proportion of fresh DOM [53]. Therefore, the highest β:α ratio at all the larch stands generally appeared in the late growth stage in the present study.

4.3. Effects of Seasonal Variations on Microbial Community Structure

In this study, seasonal variation and differences in stand age significantly affected the soil microbial PLFAs of the larch plantation forests. Previous studies have shown that within a certain ambient temperature, soil microbial activity was positively correlated with ambient temperature [41]. Generally, high ambient temperature results in high soil microbial activity. The biomass and activity of soil microbes are higher during the vigorous growing period, which is closely related to the increase in carbon supply due to plant root growth [54]. Suitable soil nutrients can obviously affect the abundance and structure of soil microorganisms; accompanied by the release of a large number of photochemical products into the soil, the activity of soil microorganisms during the fast-growth season is promoted [52]. Therefore, the contents of PLFAs of different species of soil microbes were higher in July or August (the fast-growing season) in this study. However, the actinomycetes content in the soil of all the larch stands peaked in July and then declined. This may be because the soil environment was more conducive to actinomycete growth in July, and the abundance of actinomycetes decreased due to the enhanced inhibition of actinomycetes by other microorganisms in the soil in August [55].
Generally, high-quality soils benefit from the stability of a stable soil microbial community structure due to the high abundance of soil microbes [56]. The variations in the soil microbial community structure reflect the adaptability of soil microorganisms to the soil environment. In this study, the PLFA content of different groups of soil microbes followed the trend of bacteria >fungi >actinomycetes> protozoa across growth seasons. This finding showed that bacteria had strong adaptability to changes in soil nutrients and indicated that bacteria play a key role in soil nutrient cycling [57]. Compared with the PLFA biomarker content of other soil microorganisms, gram-negative bacteria (G-) accounted for the largest proportion of total PLFAs across all the larch stands, which may be because gram-negative bacteria (G-) are better adapted to soil environmental changes [58]. In this study, higher abundances of different groups of PLFAs were observed in the soil of the young forest (17a), indicating that the habitat in the young forest (17a) is suitable for soil microbial growth. Additionally, the highest SOC content was observed in the young forests (17a) due to the quantity of SOC exudates contributing to soil microbial growth [59].

4.4. Effect of Soil Environmental Factors on the Soil Microbial Community

The stand age of L. principis-rupprechtii Mayr. greatly altered the structures of the soil microbial community and affected the soil DOM characteristics (including the availability and molecular characterization of DOM). The interactions of stand age with soil microbes are vital to soil C dynamics [60]. Overall, the relationship between the soil microbial community and DOM characteristics in the half-mature forest (27a) was remarkably intense compared to that in the sapling forest (7a) and young forest (17a) in this study. The results indicated that stand age altered the soil DOM components and soil microbial community structure, further affecting SOM decomposition [11]. The RDA results indicated that the abundance of soil microbes was significantly linked to soil DOM characteristics in all the larch stands. These results suggest that factors affecting soil microbial communities during different growth periods and stand age heterogeneity should be considered to better understand the response of biogeochemical processes to variations in soil resources in future studies [61]. Across all the soil samples of different stand ages, HXI described 27.5% (7a), 12.2% (17a) and 2.4% (27a) of the soil microbial PLFA variation. This finding further confirmed that stand age had a stronger influence on soil microbial communities by changing the availability of DOM.
In addition, in the present study, the changes in soil DOM characteristics due to the difference in stand age were the most important factors explaining the observed variation in the soil bacterial community structure. Several factors were strongly correlated with the soil microbial community structure, including SUVA254, HIX, SOC, DOC, C:N, β:α and DOM components. However, for stands of different ages, there were significantly different drivers of soil microbial community variation. This is due to the shifts in the soil physicochemical conditions and availability of DOM among stands of different ages, and these factors may be important factors influencing the soil microbial community structure [11].

5. Conclusions

In this study, we observed that the soil physicochemical factors, DOM characteristics and different groups of PLFA biomarker abundances of soil microbes in all the larch stands were closely related to growth seasons and stand ages. The characteristics of the fluorescence parameters indicated that humic-like components were the dominant components in the soil DOM of all stand ages and that soil DOM originated primarily from terrestrial plants (plant residues) and SOM rather than from microbes. Additionally, stand age had significant effects on the abundances of PLFA biomarkers of soil microbes. Generally, soil DOM characteristics explained the largest changes in the soil microbial community response to growth season and stand age in this study. These results could help clarify the dynamics of the soil microbial community structure and the biogeochemical cycle of DOM in plantation forest ecosystems. Collectively, in the process of plantation forest management (such as soil nutrient management), the effect of the heterogeneity of the growth season and stand age on soil microbes must be considered in the assessment of plantation forest ecosystem functions, and different management methods should be adopted for different stand ages.

Supplementary Materials

The following supporting information can be downloaded at: https://www.mdpi.com/article/10.3390/su141911968/s1, Table S1: Variation in precipitation and mean monthly temperature. All data were collected from the China Meteorological Data Service Centre. Table S2: Summary of the soil physicochemical properties. Table S3: Four fluorescent components of DOM in the soil of L. principis-rupprechtii Mayr. identified in this study. Table S4: Summary of the different components (Fmax) identified in this study. Figure S1: Map of the study site. Figure S2: Seasonal changes in the proportions of four fluorescent components of the soil DOM from L. principis-rupprechtii Mayr. of different ages. References [1,4,24,46,62,63,64,65,66,67,68,69,70] are cited in the supplementary materials.

Author Contributions

Field sampling, data acquisition and analysis, conceptualization, funding support, and writing—review & editing: H.L. and M.J.C.C.; Data acquisition: Y.Y.; and analysis tool contribution: H.C. All authors have read and agreed to the published version of the manuscript.

Funding

This research was supported by the Scientific Research Start-up Funds for Openly Recruited Doctors of Gansu Agricultural University (Grant No. GAU-KYQD-2018-18), and the Natural Science Foundation of Gansu Province, China (Grant No. 20JR10RA522).

Institutional Review Board Statement

Not applicable.

Informed Consent Statement

Not applicable.

Data Availability Statement

Not applicable.

Conflicts of Interest

The authors declare that there are no conflict of interest.

References

  1. Li, W.; Jia, X.; Li, M.; Wu, H. Insight into the vertical characteristics of dissolved organic matter in 5-m soil profiles under different land-use types on the Loess Plateau. Sci. Total Environ. 2019, 692, 613–621. [Google Scholar] [CrossRef] [PubMed]
  2. Romero, C.M.; Engel, R.E.; D’Andrilli, J.; Chen, C.; Zabinski, C.; Miller, P.R.; Wallander, R. Bulk optical characterization of dissolved organic matter from semiarid wheat-based cropping systems. Geoderma 2017, 306, 40–49. [Google Scholar] [CrossRef]
  3. Karavanova, E. Dissolved organic matter: Fractional composition and sorbability by the soil solid phase (review of literature). Eurasian Soil Sci. 2013, 46, 833–844. [Google Scholar] [CrossRef]
  4. Parlanti, E.; Wörz, K.; Geoffroy, L.; Lamotte, M. Dissolved organic matter fluorescence spectroscopy as a tool to estimate biological activity in a coastal zone submitted to anthropogenic inputs. Org. Geochem. 2000, 31, 1765–1781. [Google Scholar] [CrossRef]
  5. Gmach, M.R.; Cherubin, M.R.; Kaiser, K.; Cerri, C.E.P. Processes that influence dissolved organic matter in the soil: A review. Sci. Agr. 2019, 77, e20180164. [Google Scholar] [CrossRef]
  6. Fahad, S.; Hasanuzzaman, M.; Alam, M.; Ullah, H.; Saeed, M.; Khan, I.A.; Adnan, M. Environment, Climate, Plant and Vegetation Growth; Springer: Berlin/Heidelberg, Germany, 2020. [Google Scholar]
  7. Roesch, L.F.; Fulthorpe, R.R.; Riva, A.; Casella, G.; Hadwin, A.K.; Kent, A.D.; Daroub, S.H.; Camargo, F.A.; Farmerie, W.G.; Triplett, E.W. Pyrosequencing enumerates and contrasts soil microbial diversity. ISME J. 2007, 1, 283–290. [Google Scholar] [CrossRef] [PubMed]
  8. He, R.; Yang, K.; Li, Z.; Schädler, M.; Yang, W.; Wu, F.; Tan, B.; Zhang, L.; Xu, Z. Effects of forest conversion on soil microbial communities depend on soil layer on the eastern Tibetan Plateau of China. PLoS ONE 2017, 12, e0186053. [Google Scholar] [CrossRef] [PubMed]
  9. Lou, Y.; Davis, A.S.; Yannarell, A.C. Interactions between allelochemicals and the microbial community affect weed suppression following cover crop residue incorporation into soil. Plant Soil 2016, 399, 357–371. [Google Scholar] [CrossRef]
  10. Yang, J.; Duan, Y.; Zhang, R.; Liu, C.; Wang, Y.; Li, M.; Ding, Y.; Awasthi, M.K.; Li, H. Connecting soil dissolved organic matter to soil bacterial community structure in a long-term grass-mulching apple orchard. Ind. Crop. Prod. 2020, 149, 112344. [Google Scholar] [CrossRef]
  11. Wang, W.; Zhang, Q.; Sun, X.; Chen, D.; Insam, H.; Koide, R.T.; Zhang, S. Effects of mixed-species litter on bacterial and fungal lignocellulose degradation functions during litter decomposition. Soil Biol. Biochem. 2020, 141, 107690. [Google Scholar] [CrossRef]
  12. Lutsenko, T.; Arzhanova, V.; Kim, N.Y. Transformation of dissolved organic matter in soils of the felled areas in fir-spruce forests (Primorskii Krai). Eurasian Soil Sci. 2006, 39, 604–610. [Google Scholar] [CrossRef]
  13. Jiao, N.; Herndl, G.J.; Hansell, D.A.; Benner, R.; Kattner, G.; Wilhelm, S.W.; Kirchman, D.L.; Weinbauer, M.G.; Luo, T.; Chen, F. Microbial production of recalcitrant dissolved organic matter: Long-term carbon storage in the global ocean. Nat. Rev. Microbiol. 2010, 8, 593–599. [Google Scholar] [CrossRef] [PubMed]
  14. Kalbitz, K.; Solinger, S.; Park, J.-H.; Michalzik, B.; Matzner, E. Controls on the dynamics of dissolved organic matter in soils: A review. Soil Sci. 2000, 165, 277–304. [Google Scholar] [CrossRef]
  15. Wu, H.; Lin, L.; Shen, G.; Li, M. Heavy-metal pollution alters dissolved organic matter released by bloom-forming Microcystis aeruginosa. RSC Adv. 2017, 7, 18421–18427. [Google Scholar] [CrossRef]
  16. Li, H.; C. Crabbe, M.J.; Xu, F.; Wang, W.; Ma, L.; Niu, R.; Gao, X.; Li, X.; Zhang, P.; Ma, X. Seasonal variations in carbon, nitrogen and phosphorus concentrations and C: N: P stoichiometry in different organs of a Larix principis-rupprechtii Mayr. plantation in the Qinling Mountains, China. PLoS ONE 2017, 12, e0185163. [Google Scholar]
  17. Mendes, R.; Kruijt, M.; De Bruijn, I.; Dekkers, E.; Van Der Voort, M.; Schneider, J.H.; Piceno, Y.M.; DeSantis, T.Z.; Andersen, G.L.; Bakker, P.A. Deciphering the rhizosphere microbiome for disease-suppressive bacteria. Science 2011, 332, 1097–1100. [Google Scholar] [CrossRef]
  18. Justine, M.F.; Yang, W.; Wu, F.; Tan, B.; Naeem Khan, M.; Li, Z. Dissolved organic matter in soils varies across a chronosequence of Pinus massoniana plantations. Ecosphere 2017, 8, e01764. [Google Scholar] [CrossRef]
  19. Yamashita, Y.; Kloeppel, B.D.; Knoepp, J.; Zausen, G.L.; Jaffé, R. Effects of watershed history on dissolved organic matter characteristics in headwater streams. Ecosystems 2011, 14, 1110–1122. [Google Scholar] [CrossRef]
  20. Praise, S.; Ito, H.; Sakuraba, T.; Pham, D.V.; Watanabe, T. Water extractable organic matter and iron in relation to land use and seasonal changes. Sci. Total Environ. 2020, 707, 136070. [Google Scholar] [CrossRef]
  21. FAO. World Reference Base for Soil Resources: A Framework for International Classification, Correlation and Communication; World Soil Resources Reports 103; Food and Agriculture Organization of the United Nations: Rome, Italy, 2006. [Google Scholar]
  22. Yeomans, J.C.; Bremner, J.M. A rapid and precise method for routine determination of organic carbon in soil. Commun. Soil Sci. Plant 1988, 19, 1467–1476. [Google Scholar] [CrossRef]
  23. Bremmer, J.; Mulvaney, C. Methods of Soil Analysis. Nitrogen-Total. Part 2. Chemical and Microbiollogical Properties, 2nd ed.; American Society of Agronomy. Inc.: Madison, WI, USA, 1982; pp. 295–624. [Google Scholar]
  24. Zhang, R.; Huang, Q.; Yan, T.; Yang, J.; Zheng, Y.; Li, H.; Li, M. Effects of intercropping mulch on the content and composition of soil dissolved organic matter in apple orchard on the loess plateau. J. Environ. Manage. 2019, 250, 109531. [Google Scholar] [CrossRef] [PubMed]
  25. Ward, C.P.; Cory, R.M. Complete and partial photo-oxidation of dissolved organic matter draining permafrost soils. Environ. Sci. Technol. 2016, 50, 3545–3553. [Google Scholar] [CrossRef]
  26. Tiefenbacher, A.; Weigelhofer, G.; Klik, A.; Pucher, M.; Santner, J.; Wenzel, W.; Eder, A.; Strauss, P. Short-term effects of fertilization on dissolved organic matter in soil leachate. Water 2020, 12, 1617. [Google Scholar] [CrossRef]
  27. Zhang, A.; Zhou, X.; Li, M.; Wu, H. Impacts of biochar addition on soil dissolved organic matter characteristics in a wheat-maize rotation system in Loess Plateau of China. Chemosphere 2017, 186, 986–993. [Google Scholar] [CrossRef]
  28. Huguet, A.; Vacher, L.; Relexans, S.; Saubusse, S.; Froidefond, J.-M.; Parlanti, E. Properties of fluorescent dissolved organic matter in the Gironde Estuary. Org. Geochem. 2009, 40, 706–719. [Google Scholar] [CrossRef]
  29. Li, S.; Hou, X.; Shi, Y.; Huang, T.; Yang, H.; Huang, C. Rapid photodegradation of terrestrial soil dissolved organic matter (DOM) with abundant humic-like substances under simulated ultraviolet radiation. Environ. Monit. Assess. 2020, 192, 1–15. [Google Scholar] [CrossRef]
  30. Bossio, D.A.; Scow, K. Impacts of carbon and flooding on soil microbial communities: Phospholipid fatty acid profiles and substrate utilization patterns. Microb. Ecol. 1998, 35, 265–278. [Google Scholar] [CrossRef] [PubMed]
  31. Wu, Y.; Ma, B.; Zhou, L.; Wang, H.; Xu, J.; Kemmitt, S.; Brookes, P.C. Changes in the soil microbial community structure with latitude in eastern China, based on phospholipid fatty acid analysis. Appl. Soil Ecol. 2009, 43, 234–240. [Google Scholar] [CrossRef]
  32. Veum, K.S.; Lorenz, T.; Kremer, R.J. Phospholipid fatty acid profiles of soils under variable handling and storage conditions. Agron. J. 2019, 111, 1090–1096. [Google Scholar] [CrossRef]
  33. Zhang, S.; Jian, Y.; Yan, B.; Jin, J.; Wu, J.; Liang, C.; Liu, J. Land Consolidation with Seedling Cultivation Could Decrease Soil Microbial PLFA Diversity. Phyton-Int. J. Exp. Bot. 2022, 91, 1745–1756. [Google Scholar] [CrossRef]
  34. Yao, X.; Zhang, N.; Zeng, H.; Wang, W. Effects of soil depth and plant–soil interaction on microbial community in temperate grasslands of northern China. Sci. Total Environ. 2018, 630, 96–102. [Google Scholar] [CrossRef] [PubMed]
  35. Gong, L.; Wang, J.; Abbas, T.; Zhang, Q.; Cai, M.; Tahir, M.; Wu, D.; Di, H. Immobilization of exchangeable Cd in soil using mixed amendment and its effect on soil microbial communities under paddy upland rotation system. Chemosphere 2021, 262, 127828. [Google Scholar] [CrossRef] [PubMed]
  36. Liu, M.; Sui, X.; Hu, Y.; Feng, F. Microbial community structure and the relationship with soil carbon and nitrogen in an original Korean pine forest of Changbai Mountain, China. BMC Microbiol. 2019, 19, 1–14. [Google Scholar] [CrossRef]
  37. Fellman, J.B.; Hood, E.; D’amore, D.V.; Edwards, R.T.; White, D. Seasonal changes in the chemical quality and biodegradability of dissolved organic matter exported from soils to streams in coastal temperate rainforest watersheds. Biogeochemistry 2009, 95, 277–293. [Google Scholar] [CrossRef]
  38. Fellman, J.B.; D’Amore, D.V.; Hood, E.; Boone, R.D. Fluorescence characteristics and biodegradability of dissolved organic matter in forest and wetland soils from coastal temperate watersheds in southeast Alaska. Biogeochemistry 2008, 88, 169–184. [Google Scholar] [CrossRef]
  39. Luo, Z.; Wang, G.; Wang, E. Global subsoil organic carbon turnover times dominantly controlled by soil properties rather than climate. Nat. Commun. 2019, 10, 1–10. [Google Scholar] [CrossRef]
  40. Burton, J.; Chen, C.; Xu, Z.; Ghadiri, H. Gross nitrogen transformations in adjacent native and plantation forests of subtropical Australia. Soil Biol. Biochem. 2007, 39, 426–433. [Google Scholar] [CrossRef]
  41. Du, C.; Xu, C.Y.; Jian, J.S.; He, W.X.; Hou, L.; Geng, Z.C. Seasonal dynamics of bacterial communities in a Betula albosinensis forest. Eur. J. Soil Sci. 2018, 69, 666–674. [Google Scholar] [CrossRef]
  42. Sanchez, F.G. Loblolly pine needle decomposition and nutrient dynamics as affected by irrigation, fertilization, and substrate quality. Forest Ecol. Manage. 2001, 152, 85–96. [Google Scholar] [CrossRef]
  43. Li, H.; Crabbe, M.J.C.; Xu, F.; Wang, W.; Niu, R.; Gao, X.; Zhang, P.; Chen, H. Seasonal variations in carbon, nitrogen and phosphorus concentrations and C: N: P stoichiometry in the leaves of differently aged Larix principis-rupprechtii Mayr. plantations. Forests 2017, 8, 373. [Google Scholar] [CrossRef]
  44. Ye, Q.; Wang, Y.-H.; Zhang, Z.-T.; Huang, W.-L.; Li, L.-P.; Li, J.; Liu, J.; Zheng, Y.; Mo, J.-M.; Zhang, W. Dissolved organic matter characteristics in soils of tropical legume and non-legume tree plantations. Soil Biol. Biochem. 2020, 148, 107880. [Google Scholar] [CrossRef]
  45. Harrison, R.B.; Footen, P.W.; Strahm, B.D. Deep soil horizons: Contribution and importance to soil carbon pools and in assessing whole-ecosystem response to management and global change. Forest Sci. 2011, 57, 67–76. [Google Scholar]
  46. Gao, J.; Liang, C.; Shen, G.; Lv, J.; Wu, H. Spectral characteristics of dissolved organic matter in various agricultural soils throughout China. Chemosphere 2017, 176, 108–116. [Google Scholar] [CrossRef] [PubMed]
  47. Jun, X.; Ya-nan, Z.; Xuan-jing, C.; Ke, W.; Chun-li, X.; Dan-ping, L.; Yue-qiang, Z.; Ding-yong, W.; Xiao-jun, S. Effect on Soil DOM Content and Structure Characteristics in Different Soil Layers by Long-Term Fertilizations. Spectrosc. Spect. Anal. 2018, 38, 2250–2255. [Google Scholar]
  48. Wu, M.; Li, P.; Li, G.; Petropoulos, E.; Feng, Y.; Li, Z. The chemodiversity of paddy soil dissolved organic matter is shaped and homogenized by bacterial communities that are orchestrated by geographic distance and fertilizations. Soil Biol. Biochem. 2021, 161, 108374. [Google Scholar] [CrossRef]
  49. Fellman, J.B.; Hood, E.; Spencer, R.G. Fluorescence spectroscopy opens new windows into dissolved organic matter dynamics in freshwater ecosystems: A review. Limno. Oceanogr. 2010, 55, 2452–2462. [Google Scholar] [CrossRef]
  50. Perdrial, J.N.; McIntosh, J.; Harpold, A.; Brooks, P.D.; Zapata-Rios, X.; Ray, J.; Meixner, T.; Kanduc, T.; Litvak, M.; Troch, P.A. Stream water carbon controls in seasonally snow-covered mountain catchments: Impact of inter-annual variability of water fluxes, catchment aspect and seasonal processes. Biogeochemistry 2014, 118, 273–290. [Google Scholar] [CrossRef]
  51. Yano, Y.; McDowell, W.H.; Kinner, N.E. Quantification of biodegradable dissolved organic carbon in soil solution with flow-through bioreactors. Soil Sci. Soc. Am. J. 1998, 62, 1556–1564. [Google Scholar] [CrossRef]
  52. Fan, L.; Tarin, M.W.K.; Zhang, Y.; Han, Y.; Rong, J.; Cai, X.; Chen, L.; Shi, C.; Zheng, Y. Patterns of soil microorganisms and enzymatic activities of various forest types in coastal sandy land. Glob. Ecol. Conserv. 2021, 28, e01625. [Google Scholar] [CrossRef]
  53. Mao, R.; Li, S. Temporal controls on dissolved organic carbon biodegradation in subtropical rivers: Initial chemical composition versus stoichiometry. Sci. Total Environ. 2019, 651, 3064–3069. [Google Scholar] [CrossRef] [PubMed]
  54. Luo, S.-P.; He, B.-H.; Zeng, Q.-P.; Li, N.-J.; Yang, L. Effects of seasonal variation on soil microbial community structure and enzyme activity in a Masson pine forest in Southwest China. J. Mt. Sci.-Engl. 2020, 17, 1398–1409. [Google Scholar] [CrossRef]
  55. Gong, B.; Chen, S.; Lan, W.; Huang, Y.; Zhu, X. Antibacterial and antitumor potential of actinomycetes isolated from mangrove soil in the Maowei Sea of the southern coast of China. Iran. J. Pharm. Res. 2018, 17, 1339. [Google Scholar]
  56. Kong, T.; Wu, X.; Zhao, X.; Liu, M.; Huang, J.; Zhang, D. Soil microbial quantity and soil enzyme activity characteristics of riparian zone in upper reachesof Hunhe river. Bull. Soil Water Conserv. 2014, 34, 123–128. (In Chinese) [Google Scholar]
  57. Li, W.; Lv, X.; Ruan, J.; Yu, M.; Song, Y.-B.; Yu, J.; Dong, M. Variations in soil bacterial composition and diversity in newly formed coastal wetlands. Front. Microbiol. 2019, 9, 3256. [Google Scholar] [CrossRef] [PubMed]
  58. Fanin, N.; Kardol, P.; Farrell, M.; Nilsson, M.-C.; Gundale, M.J.; Wardle, D.A. The ratio of Gram-positive to Gram-negative bacterial PLFA markers as an indicator of carbon availability in organic soils. Soil Biol. Biochem. 2019, 128, 111–114. [Google Scholar] [CrossRef]
  59. De Vries, F.T.; Manning, P.; Tallowin, J.R.; Mortimer, S.R.; Pilgrim, E.S.; Harrison, K.A.; Hobbs, P.J.; Quirk, H.; Shipley, B.; Cornelissen, J.H. Abiotic drivers and plant traits explain landscape-scale patterns in soil microbial communities. Ecol. Lett. 2012, 15, 1230–1239. [Google Scholar] [CrossRef]
  60. Six, J.; Feller, C.; Denef, K.; Ogle, S.; de Moraes Sa, J.C.; Albrecht, A. Soil organic matter, biota and aggregation in temperate and tropical soils-Effects of no-tillage. Agronomie 2002, 22, 755–775. [Google Scholar] [CrossRef]
  61. Smith, A.P.; Marín-Spiotta, E.; Balser, T. Successional and seasonal variations in soil and litter microbial community structure and function during tropical postagricultural forest regeneration: A multiyear study. Global Change Biol. 2015, 21, 3532–3547. [Google Scholar] [CrossRef] [PubMed]
  62. Goffin, A.; Guérin, S.; Rocher, V.; Varrault, G. Towards a better control of the wastewater treatment process: Excitation-emission matrix fluorescence spectroscopy of dissolved organic matter as a predictive tool of soluble BOD5 in influents of six Parisian wastewater treatment plants. Environ. Sci. Pollut. Res. 2018, 25, 8765–8776. [Google Scholar] [CrossRef]
  63. Murphy, K.R.; Hambly, A.; Singh, S.; Henderson, R.K.; Baker, A.; Stuetz, R.; Khan, S.J. Organic Matter Fluorescence in Municipal Water Recycling Schemes: Toward a Unified PARAFAC Model. Environ. Sci. Technol. 2011, 45, 2909–2916. [Google Scholar] [CrossRef]
  64. Guo, W.; Xu, J.; Wang, J.; Wen, Y.; Zhuo, J.; Yan, Y. Characterization of dissolved organic matter in urban sewage using excitation emission matrix fluorescence spectroscopy and parallel factor analysis. J. Environ. Sci. 2010, 22, 1728–1734. [Google Scholar] [CrossRef]
  65. Qin, X.-Q.; Yao, B.; Jin, L.; Zheng, X.-Z.; Ma, J.; Benedetti, M.F.; Li, Y.; Ren, Z.-L. Characterizing Soil Dissolved Organic Matter in Typical Soils from China Using Fluorescence EEM–PARAFAC and UV–Visible Absorption. Aquat. Geochem. 2020, 26, 71–88. [Google Scholar] [CrossRef]
  66. Gao, J.; Shi, Z.; Wu, H.; Lv, J. Fluorescent characteristics of dissolved organic matter released from biochar and paddy soil incorporated with biochar. RSC Adv. 2020, 10, 5785–5793. [Google Scholar] [CrossRef] [PubMed]
  67. Stedmon, C.A.; Markager, S. Resolving the variability in dissolved organic matter fluorescence in a temperate estuary and its catchment using PARAFAC analysis. Limnol. Oceanogr. 2005, 50, 686–697. [Google Scholar] [CrossRef]
  68. Shen, G.; Qu, D.; Li, K.; Li, M. Composition of Extracellular and Intracellular Polymeric Substances Produced by Scenedesmus and Microcystis. Environ. Eng. Sci. 2017, 34, 887–894. [Google Scholar] [CrossRef]
  69. Singh, S.; Inamdar, S.; Scott, D. Comparison of Two PARAFAC Models of Dissolved Organic Matter Fluorescence for a Mid-Atlantic Forested Watershed in the USA. J. Ecosyst. 2013, 2013, 1–16. [Google Scholar] [CrossRef]
  70. Singh, S.; D’Sa, E.J.; Swenson, E.M. Chromophoric dissolved organic matter (CDOM) variability in Barataria Basin using excitation–emission matrix (EEM) fluorescence and parallel factor analysis (PARAFAC). Sci. Total Environ. 2010, 408, 3211–3222. [Google Scholar] [CrossRef]
Figure 1. Seasonal variation in the physicochemical indicators in the soils of L. principis-rupprechtii Mayr. of different ages. Values are shown as the means ± standard deviations (n = 3). Lowercase and capital letters indicate significant differences among different sampling months and larch stands of different ages (p < 0.05), respectively. The same column values without letters indicate that there are no differences among the values.
Sustainability 14 11968 g001
Figure 2. Variation in the physicochemical indicators in the soils of L. principis-rupprechtii Mayr. of different ages. The black lines represent median values; the red lines represent mean values; and the black points represent outlier data points. The means and medians were calculated by grouping all the monthly samplings made for each larch stand of different ages. Letters indicate significant differences among L. principis-rupprechtii Mayr. of different ages (p < 0.05).
Sustainability 14 11968 g002
Figure 3. Contour plots, Ex and Em loadings of the four different fluorescent components identified via EEM-PARAFAC analysis. Ex: Excitation wavelength. Em: Emission wavelength.
Sustainability 14 11968 g003
Figure 4. Seasonal variation in the proportions of the different fluorescent components of the soil DOM from L. principis-rupprechtii Mayr. stands of different ages.
Sustainability 14 11968 g004
Figure 5. Changes in the Fmax of the different components identified via EEM-PARAFAC analysis. The black lines represent median values; the red lines represent mean values; and the black points represent outlier data points. Letters indicate significant differences among L. principis-rupprechtii Mayr. of different ages (p < 0.05).
Sustainability 14 11968 g005
Figure 6. Seasonal changes in the SUVA254 (A), SR (B), FI (C), HIX (D), β:α (E) and BIX (F) of the soil DOM of L. principis-rupprechtii Mayr. of different ages. Lowercase and capital letters indicate significant differences among different sampling months and larch stands of different ages (p < 0.05), respectively. The same column values without lowercase or capital letters indicate that no differences exist among the values.
Sustainability 14 11968 g006
Figure 7. Seasonal variations in the content of soil microbial phospholipid fatty acids in stands of different ages. Values are shown as the means (n = 3).
Sustainability 14 11968 g007
Figure 8. Seasonal variations in the content of different species of soil microbial PLFAs in stands of different ages. Lowercase and capital letters indicate significant differences among different sampling months and larch stands of different ages (p < 0.05), respectively. The same column values without lowercase or capital letters indicate that no differences exist among the values.
Sustainability 14 11968 g008
Figure 9. Redundancy analysis of soil physicochemical factors, soil DOM characteristics and soil microbial community composition in stands of different ages. Blue vectors represent the PLFA biomarkers of soil microbes, and red vectors represent the soil physicochemical factors. * and ** indicates significant correlations at p < 0.05 and p < 0.01, respectively.
Sustainability 14 11968 g009
Publisher’s Note: MDPI stays neutral with regard to jurisdictional claims in published maps and institutional affiliations.

