Article

Can Local Government’s Attention Allocated to Green Innovation Improve the Green Innovation Efficiency?—Evidence from China

1
School of Government, Beijing Normal University, Beijing 100875, China
2
School of Management and Economics, Chuxiong Normal University, Chuxiong 675000, China
3
School of Business Administration, The Open University of China, Beijing 100039, China
*
Author to whom correspondence should be addressed.
Sustainability 2022, 14(19), 12059; https://doi.org/10.3390/su141912059
Submission received: 19 August 2022 / Revised: 18 September 2022 / Accepted: 19 September 2022 / Published: 23 September 2022

Abstract

:
Green innovation is an important way to integrate China’s innovation-driven strategy with sustainable development strategy. Adopting the attention-based view in policy implementation analysis, this paper constructs an analytical framework of how the local government’s attention paid to green innovation (LGA-GI) affects green innovation efficiency (GIE). Using the panel data of 30 provincial administrative regions in China from 2009 to 2020, we describe the temporal and spatial characteristics of LGA-GI, empirically test the impact of LGA-GI on GIE through two-way fixed effects models, and then compare the effects in the three stages of green innovation. The major findings are as follows: (1) the LGA-GI in China from 2009 to 2020 shows an upward trend with mild fluctuations, and peaks three times in 2012, 2016, and 2018. The spatial distribution of LGA-GI has changed from a pattern of “low in the middle” (low LGA-GI in the central region) to “continuous highs with scattered lows”. (2) LGA-GI has a significant positive effect on the overall GIE, but the effect is concentrated in the stage of knowledge absorption and commercialization, rather than in the stage of knowledge innovation. The implication of these results is that local governments need to allocate more attention to green innovation and maintain its continuity, and governments at all levels should distribute policy implementation resources based on the characteristics of different green innovation stages.

1. Introduction

Green innovation based on innovative development and environmental governance is not only a path being explored worldwide, but also a starting point for China’s economic transition and high-quality development. Preventing pollution and building an innovative nation are dual challenges that China has been facing. In terms of pollution issues, taking the air pollution prevention for instance, although the annual average concentration of PM2.5 in China has decreased from 41.2 μg/m3 in 2018 to 32.6 μg/m3 in 2021, it is still much higher than the WHO guideline value (5 μg/m3), and the great pressure of environmental governance remains [1]. Meanwhile, China has been long facing the awkward situation of insufficient innovation resources and low innovation capacity [2,3]. Under the pressure to protect the environment and improve innovation capacity, China needs to advance green innovation as soon as possible. The dual externalities and long return cycles of green innovation also require governmental actions. As early as 2008, the China Council for International Cooperation on Environment and Development (CCICED) introduced the concept of “green innovation” for the first time in China, and provided a top-level vision of green innovation in China from the perspective of environmental investment and incentives [4]. In 2015, the concept of green innovation appeared in China’s Five-Year Plan for National Economic and Social Development (“Five-Year Plan”) for the first time. In 2019, China’s National Development and Reform Commission and Ministry of Science and Technology issued the Guidance on Building a Market-Oriented Green Technology Innovation System, which was the first set of systematic guidelines for green technology innovation in China. The latest “Five-Year Plan” approved by the National People’s Congress in March 2021 once again stated that China need to vigorously develop green technology innovation. With the central government’s increasing attention allocated to green innovation, how does the local government’s attention focused on green innovation (LGA-GI) change? Does LGA-GI have an impact on the green innovation efficiency (GIE)?
Green innovation aims to achieve ecological sustainability, emphasizes the introduction of environmental factors to technological innovation, and requires the creation of new value while significantly reducing resource consumption and environmental pollution [5,6]. The literature on green innovation from the attention perspective mainly focuses on enterprises and gradually extends to governments in recent years. (1) For research on enterprises, scholars include attention in the study of green innovation mechanisms and measure the attention of firms or their executives on green innovation through surveys or textual analysis [7,8,9,10,11]. (2) When the government is taken as the research subject, studies either take attention as a discourse symbol and examine, through textual analysis, the evolution of government attention to observed policy changes related to green innovation [12,13,14,15,16], or the relationship between government attention and public sector innovation [17]. However, scholars mainly focus on innovation or green development, and green innovation as a whole has not been fully examined. Existing literature provides a good reference for this paper regarding the measurement of LGA-GI, but there are further issues to be addressed: (1) Research on the impact of attention on green innovation is mostly at the enterprise level, and study at the regional level is insufficient. LGA-GI, which integrates individual behavior and collective will, is seldom included as an influencing factor of green innovation. Examining the impact of LGA-GI on GIE can help enrich green innovation theory from the perspective of local government’s behaviors. (2) Measurements of green innovation emphasize comprehensiveness and stages, and it is weak to characterize green innovation by a single indicator [18,19]. However, it is also insufficient to measure green innovation simply by dividing it into R&D and achievement transformation [20]. It is necessary to further subdivide it so that characteristics of different innovation stages can be portrayed in more detail.
Based on our analysis of the mechanism of LGA-GI affecting green innovation, this paper uses the panel data of 30 provincial administrative regions in China from 2009 to 2020 to measure LGA-GI and GIE, and empirically tests the impact of LGA-GI on GIE through two-way fixed effects models. The marginal contributions of this paper are as follows: (1) We construct an analytical framework of how LGA-GI affects green innovation, which enriches theoretical research on green innovation. (2) We depict the temporal and spatial characteristics of LGA-GI in China from 2009 to 2020. (3) We empirically test the impact of LGA-GI on GIE, and analyze the differences of impacts in the three stages of innovation.

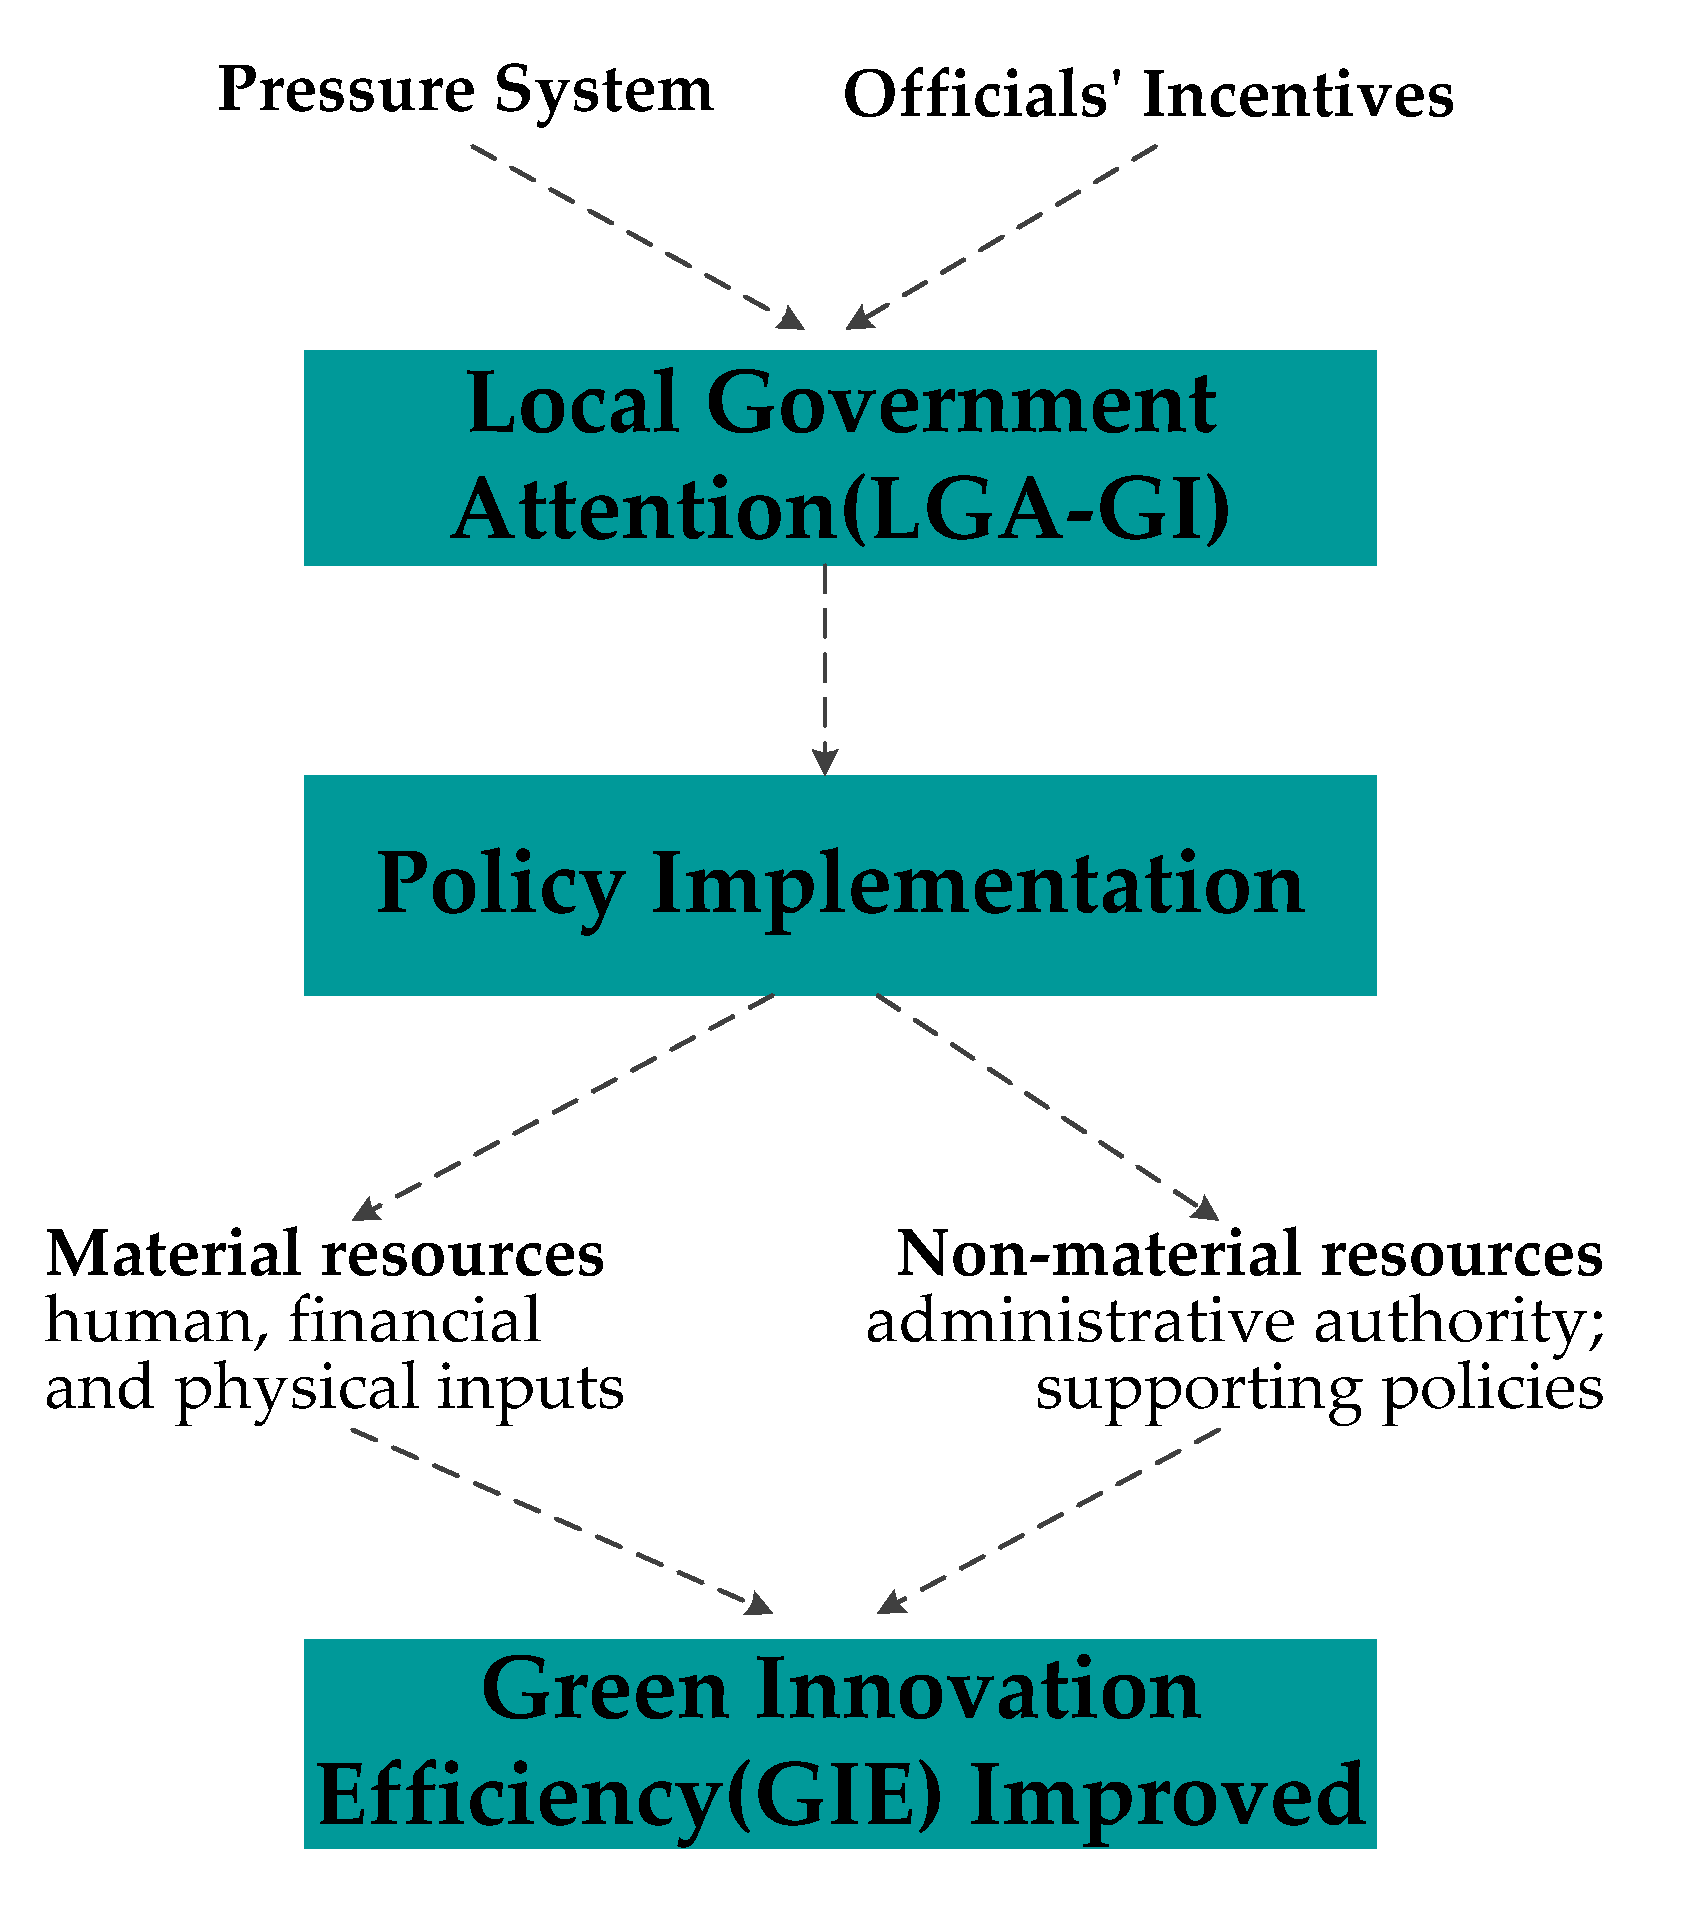
2. Theoretical Mechanisms and Hypotheses

The attention-based view discusses how organizations allocate resources to different topics in the context of limited rational cognition. Attention-related research initially focused on corporate behavior. Ocasio argues that corporate behavior is a result of the attention allocation of decision makers in organizations, and the focus, situation, and structure directly determine corporate attention allocation [21]. Bryan incorporates attention into public policy choices, and proposes a model of choice for public policy [22]. For government, attention paid to various issues and sectors not only reflects the distribution of political authority, but also directly drives policy choices [23]. The distribution and competition of limited attention is affected by the nature, importance, and severity of the issues [24,25,26]. After receiving and processing information, local governments make trade-offs and decisions about attention allocation, which are ultimately presented as government actions and policy outcomes. Attention theory provides a new perspective for understanding governmental decision-making.
Local government‘s attention is a competitive and scarce resource, and policy makers are unable to give public affairs the same level of attention. Local government’s attention allocation is not only a result of pressure from higher levels of government, competition from peer governments, and public scrutiny, but also a combination of individual behaviors of local officials and collective behaviors of government (such as fiscal policies). The reasons for the changes of LGA-GI in recent years in China can be explained in the context of China’s government institutions and bureaucratic incentives. From the perspective of the government institutions, LGA-GI stems from the “pressure system” in China which includes three types of pressure: firstly, the top-down vertical authoritarian pressure from the central government [27,28], such as the emphasis on green innovation in the “Five-Year Plan” developed by central government, the central environmental inspection (The central environmental inspection is the highest-ranking and strongest environmental monitoring measure in China. It was first launched in 2016 by the central government, and motivates local governments to prioritize all kinds of administrative resources into environmental protection through four approaches: expounding central policies, mobilizing local officials, admonishing local officials for serious environmental issues, and disciplining those who fail to reach environmental targets) [29], and the “one-vote veto” rule of environmental protection (the “one-vote veto” rule of environmental protection directly links environmental protection with the performance evaluation of local government officials, and may affect their political careers in the event of major failures in environmental protection) [30]; secondly, bottom-up public environmental oversight that resulted from increased awareness of green innovation [31,32], such as high-profile public events that prompt local governments to allocate more attention to green innovation; thirdly, the pressure of “voting with your feet”, i.e., competition among local governments to provide better environmental and technological public services [33]. Local governments face cross-prefecture competition to attract talents, capital, and technology, and a good environment for green innovation attracts a large influx of high-quality production factors into their region. In terms of bureaucratic incentives, local government officials’ allocation of their attention to green innovation is driven by promotion incentives, accountability pressure [34], or native complex (which is an informal constraining institution, meaning that officials serving in their native provinces may pay more attention to local green innovation out of a sense of locality and identity) [35]. Such pressure and incentives are transmitted to different levels of government across the whole policy process, from agenda-setting, policy formation, decision-making, policy implementation, to policy effectiveness evaluation.
The attention-based view holds that organizational decision making is a process of attention allocation which involves three steps, namely “attention—interpretation—action” [21,36]. The three-step process of corporate attention allocation provides inspiration for understanding the influence mechanism of LGA-GI. The allocation of government attention is an information processing procedure, which ultimately needs to be transformed into policy outcomes through policy implementation. Thus, the framework that we use is “attention allocation—policy implementation—policy outcomes” (Figure 1). Under “pressure system” and officials’ incentives in China, local governments continuously allocate their attention to green innovation issues, and devote administrative resources to green innovation. Meanwhile, knowledge innovation and environmental protection that produces strong positive externalities generates spillover effects and ultimately improves the GIE. Administrative resources are categorized into material resources which include human, financial, and physical inputs, and non-material resources which refer to administrative authority and supporting policies that are mandatory and scarce [37]. Based on the context in China, we examine the mechanism of LGA-GI’s impact on GIE from three aspects: material resources, administrative authority, and supporting policies.
Firstly, the increase of LGA-GI leads to continuous accumulation of material resources to improve GIE. Government is the most important actor responsible for promoting green innovation. On the one hand, the attention from the local government often means a top-down and high level of “political momentum” [38], and a large amount of resources will be invested in green innovation. On the other hand, the preferential attitude of local government towards green innovation sends policy signals to the society, which helps to strengthen public awareness and enterprise confidence, and provides a good social environment for green innovation.
Secondly, administrative authority becomes concentrated due to the higher-level governments’ focus of attention on green innovation, which guides the attention redistribution of lower-level governments from top to bottom, and promotes green innovation by improving the policy implementation capacity. Most public policy requires cross-sectoral coordination. However, the implementation of green innovation policy may be slow or even stagnant due to multiple, vague policy objectives, and the difficulty to quantify them. The focus of attention by the higher-level governments on green innovation may be an impetus for change. Under the pressure system in China, the higher-level governments often give instructions to lower-level governments through conventional official documents, and lower-level governments often set a higher target for their subordinates so as to successfully fulfill the tasks and pass their performance assessment [39]. Green innovation has been repeatedly emphasized in policy texts at all levels, from the central government to the local government. The reinforcement of green innovation attention by the higher-level governments leads to the increase of performance assessment pressure to strengthen green innovation. The policy documents and leaders’ instructions delivered from top to bottom drive the lower-level governments to redistribute attention. Then, local officials reach consensus among departments through working meetings and take measures actively to ensure the tasks are being accomplished, and consequently the GIE is improved.
Thirdly, the focus of attention generally requires policies to be introduced first to give directions for development and create a high-quality institutional environment so that GIE can be improved. Based on national laws and regulations in China, local governments introduce a series of policies to guide the development of green innovation from three aspects: green and low-carbon transformation of economic structure, technological innovation, and energy conservation and recycling. (1) Green innovation is comprehensively integrated into the green and low-carbon transformation of China’s economic structure. Since 2019, many provinces in China have introduced low-carbon policies, incorporating green innovation into all aspects and sectors of low-carbon economic development. (2) Technological innovation policies are committed to achieving maximum output with minimum resource consumption and environmental damage, which cover various aspects of green innovation, including technologies related to clean production, and energy utilization. For example, Beijing, Shanghai, Hubei, and several other provinces developed the 14th Five-Year Plan for Scientific and Technological Innovation and issued policies to support scientific and technological innovation, creating a favorable policy environment for green innovation. (3) Energy conservation and recycling policies promote GIE from the production and consumption sides, focusing on the economical utilization of energy, water and food, and the recycling of solid waste. For instance, Guangdong, Guizhou, Sichuan, and Zhejiang, among other provinces, issued the 14th Five-Year Plan for Energy Development, setting energy development targets and promoting energy consumption reduction from the source by building a new system of energy technology innovation and industrial chain development. Accordingly, we propose the following hypothesis:
Hypothesis 1.
LGA-GI has a significant positive effect on GIE.
Green innovation is a multi-stage gradual development process that has value chain transitivity and network nonlinearity [40]. According to the innovation value chain theory [41], green innovation is composed of green innovation idea generation, green innovation value conversion, and green innovation value diffusion, which corresponds to the three stages of innovation activities, namely knowledge innovation, absorption, and commercialization (Figure 2). The actors in the knowledge innovation stage are universities, scientific research institutions, and enterprises that produce scientific papers and patents. Scientific research institutions and enterprises are the main actors in the absorption stage, aiming to promote the transactions in technology market and improve social labor productivity. The commercialization stage is dominated by enterprises which launch new products to increase their market share and promote the application of green innovations in the market.
Compared with the absorption and commercialization stage, universities and scientific research institutions are more active in the knowledge innovation stage of green innovation by carrying out high-risk research activities with long-term effects. Although the funding sources of universities and research institutions is diversifying, the funding system in China remains highly dependent on the government due to path dependence [42]. As the government’s attention allocated to green innovation continues to increase, the government would encourage the improvement of GIE in the knowledge innovation stage by increasing the research funding for green innovation. Accordingly, we propose the following hypothesis:
Hypothesis 2.
The effect of LGA-GI on GIE is concentrated in the knowledge innovation stage.

3. Research Design

3.1. Model

This paper aims to identify the impact of LGA-GI on GIE. Considering the lack of data for Hong Kong, Macao, Taiwan, and Tibet, this paper takes 30 provincial administrative regions in China from 2009 to 2020 as the sample. The explanatory variable (i.e., GIE) is a continuous variable between 0 and 1, and to avoid omitted variables (e.g., cultural factors) that vary with time and regions due to heterogeneity across regions not being included in the impact analysis, this paper adopts two-way fixed effects models for regression. The model is set as follows:
G I E i t = α + β L G A i t + γ X i t + δ i + η t + ε i t
G I E 1 i t = α + β L G A i t + γ X i t + δ i + η t + ε i t
G I E 2 i t = α + β L G A i t + γ X i t + δ i + η t + ε i t
G I E 3 i t = α + β L G A i t + γ X i t + δ i + η t + ε i t
In Formula (1), G I E i t is the explained variable that represents provincial green innovation efficiency, L G A i t is the explanatory variable, i.e., the LGA-GI of province i in year t . G I E 1 i t is the provincial green innovation efficiency in the knowledge innovation stage (Formula (2)); G I E 2 i t is the provincial GIE in the absorption stage (Formula (3)); G I E 3 i t is the provincial GIE in the commercialization stage (Formula (4)). X i t is the set of control variables at the provincial level. η t and δ i are time fixed effects and individual fixed effects. ε i t is the error term. β is the core coefficient in this paper, which describes the impact of LGA-GI on GIE.

3.2. Data and Variables

3.2.1. Explained Variable

The explained variable in this paper is GIE. Green innovation is an integrated network system with multiple inputs and outputs in different stages. Compared with the traditional Data Envelopment Analysis (DEA) model, which does not consider the slack of input variables, the network SBM-DEA model with undesirable outputs can not only examine the efficiency changes in multiple stages, but also include the undesirable outputs [43]. Therefore, this paper chooses the network SBM-DEA model with undesirable outputs to measure the overall GIE and GIE in three stages using MaxDEA 9.0 software.
With reference to previous studies [44,45] and taking into account the practices in China, this paper divides the green innovation process into three stages, namely knowledge innovation, absorption, and commercialization, and the input and output indicators are as follows: (1) In the knowledge innovation stage, the input indicators include the full-time equivalent (FTE) of R&D personnel and the internal expenditure of R&D funds, and the expected output which includes the number of scientific papers and patents granted. (2) In the absorption stage, the input indicators are the output of the knowledge innovation stage (indirect variable) and new product development expenditure, and the expected output is technological market turnover and social labor productivity. (3) In the commercialization stage, the input indicators are the output in the absorption stage (indirect variable) and energy consumption per GDP, the expected output is the sales revenue of new products, and the unexpected output is the comprehensive index of environmental pollution, which is calculated using the entropy method based on the chemical oxygen demand per GDP, carbon dioxide emissions per GDP, smoke and dust emissions per GDP, and sulfur dioxide emissions per GDP (Table 1).

3.2.2. Explanatory Variable

The explanatory variable in this paper is LGA-GI (LGA in formulas and tables for simplicity). Text analysis of official documents and government work reports is an important approach to examine government’s attention [46,47,48,49]. As an embodiment of the government’s attention, the annual government work report published by Chinese government is not only a formal statement of the government’s policy intentions, but also a direct representation of what resources the government will devote and its commitment to the public [50]. It is feasible to analyze the changes in LGA-GI through the annual government work reports. The change of word frequency in the text is an important indicator of attention, and the frequency of keywords related to some topics in the text can reflect the focus of attention. With reference to previous studies which use the absolute value or percentage of keywords as a proxy variable for attention [51], this paper measures LGA-GI by the percentage of green innovation-related keywords in annual government work reports to analyze its changes.
The measurement of LGA-GI involved three steps. Firstly, the annual work reports of provincial governments were collected. Secondly, a series of words related to green innovation were initially identified based on the definition of green innovation [52,53], and “environmental protection, energy saving, emission reduction, pollution, green, innovation, technology, sustainability, environmental protection, ecology” were identified as green innovation-related keywords. The Holsti consistency was used to test the reliability of the selected keywords [54]. Finally, using Python 3.8 software, the percentages of green innovation-related keywords in annual government work reports were calculated to measure LGA-GI. The higher the proportion of keywords, the more attention local government allocates to green innovation.

3.2.3. Control Variables

In order to identify the impact of LGA-GI on GIE more accurately, the following six control variables were selected: (1) Economic development level, which is measured by the logarithm of GDP per capita (lnPGDP). The Kuznets curve shows an inverted U-shaped relationship between the level of economic development and environmental quality. Higher levels of economic development may put more pressure on the environment and resource consumption, but also may provide more factors to support the improvement of GIE [55]. (2) Population density, which is measured by the number of people per km2 at the end of the year, and the variable is processed by a natural logarithm (lnPD). With the increase of population density, the crowding effect may cause more pressure on the ecological environment, but it also improves GIE due to the increase of human capital [56]. (3) The level of expenditure on energy conservation and environmental protection (EE), measured by the proportion of EE in local fiscal expenditure (EEP). In the long run, higher spending on EE will better improve the environment and provide a sound ecological foundation for green innovation [57]. (4) The level of science and technology (S&T) expenditure, measured by the ratio of S&T expenditure to local fiscal expenditure (STP). The greater the government’s investment in science and technology innovation, the higher the level of knowledge innovation, which contributes to the improvement of GIE [58]. (5) The strength of support for technology services, measured by the proportion of the tertiary industry in GDP (IS). The technology service industry in the tertiary sector provides support for scientific research in areas such as funding applications, intellectual property protection, technology transfer, and commercial cooperation, to promote the industrialization and commercialization of scientific research. With the improvement of the technology service level, scientific research will be more closely bonded to market demands [59]. (6) The level of opening up, measured by the proportion of total exports and imports of goods by foreign-invested enterprises in total imports and exports of goods (OI). Foreign investment affects environmental quality through “the Porter effect” and “the pollution refuge effect” [60]. As China’s economic development enters a new stage, the polluting manufacturing industries of foreign investment are increasingly moving to South and Southeast Asia where labor is cheaper, and the technology spillover effect on China is more pronounced [61], contributing to the improvement of GIE.

3.3. Data

The data sources used in this paper are as follows. (1) Data to measure GIE were obtained from the China Statistical Yearbook 2010–2021, the China Science and Technology Statistical Yearbook 2010–2021, and the statistical yearbooks and statistical bulletins of each province from 2010 to 2021. (2) Data to measure LGA-GI were obtained from the government work reports from 2009 to 2020 published on the official websites of each province. (3) Data for control variables were obtained from the China Statistical Yearbook 2010–2021. Missing data were supplemented by linear interpolation (TREND function). All the monetary-type indicators involved take 1978 as the base year and are calculated at constant prices using the corresponding price index.

3.3.1. Descriptive Statistics

The descriptive statistics for all variables and 360 observations from 30 provincial administrative regions in China are reported in Table 2. GIE is the value of green innovation efficiency, with the maximum value of 1, the minimum value of 0.218, and the average value of 0.748, indicating that there is a large variation of GIE at the provincial level in China. Comparing the average GIE in the three stages of green innovation, the commercialization stage of innovation pulls down the average level, indicating that the development of green innovation in China has the problem of emphasizing R&D but neglecting commercialization. LGA is the level of local government attention allocated to green innovation, with the maximum value of 2.001, the minimum value of 0.542, and the average value of 1.214, indicating that the overall level of the LGA-GI in China is low and there are large differences.

3.3.2. Correlation Analysis

We analyzed the pairwise correlation between variables, and the Pearson correlation coefficients of each variable are shown in Table 3. All variables are significantly correlated, indicating the feasibility of using them to explain the changes of GIE. The complicated relationship between LGA-GI and GIE will be tested later. Furthermore, the variance inflation factor (VIF) of each variable was calculated, and the VIF value of each variable is less than 4, indicating that there is no multicollinearity among the variables [62].

4. Results

4.1. Temporal and Spatial Distribution of LGA-GI in China

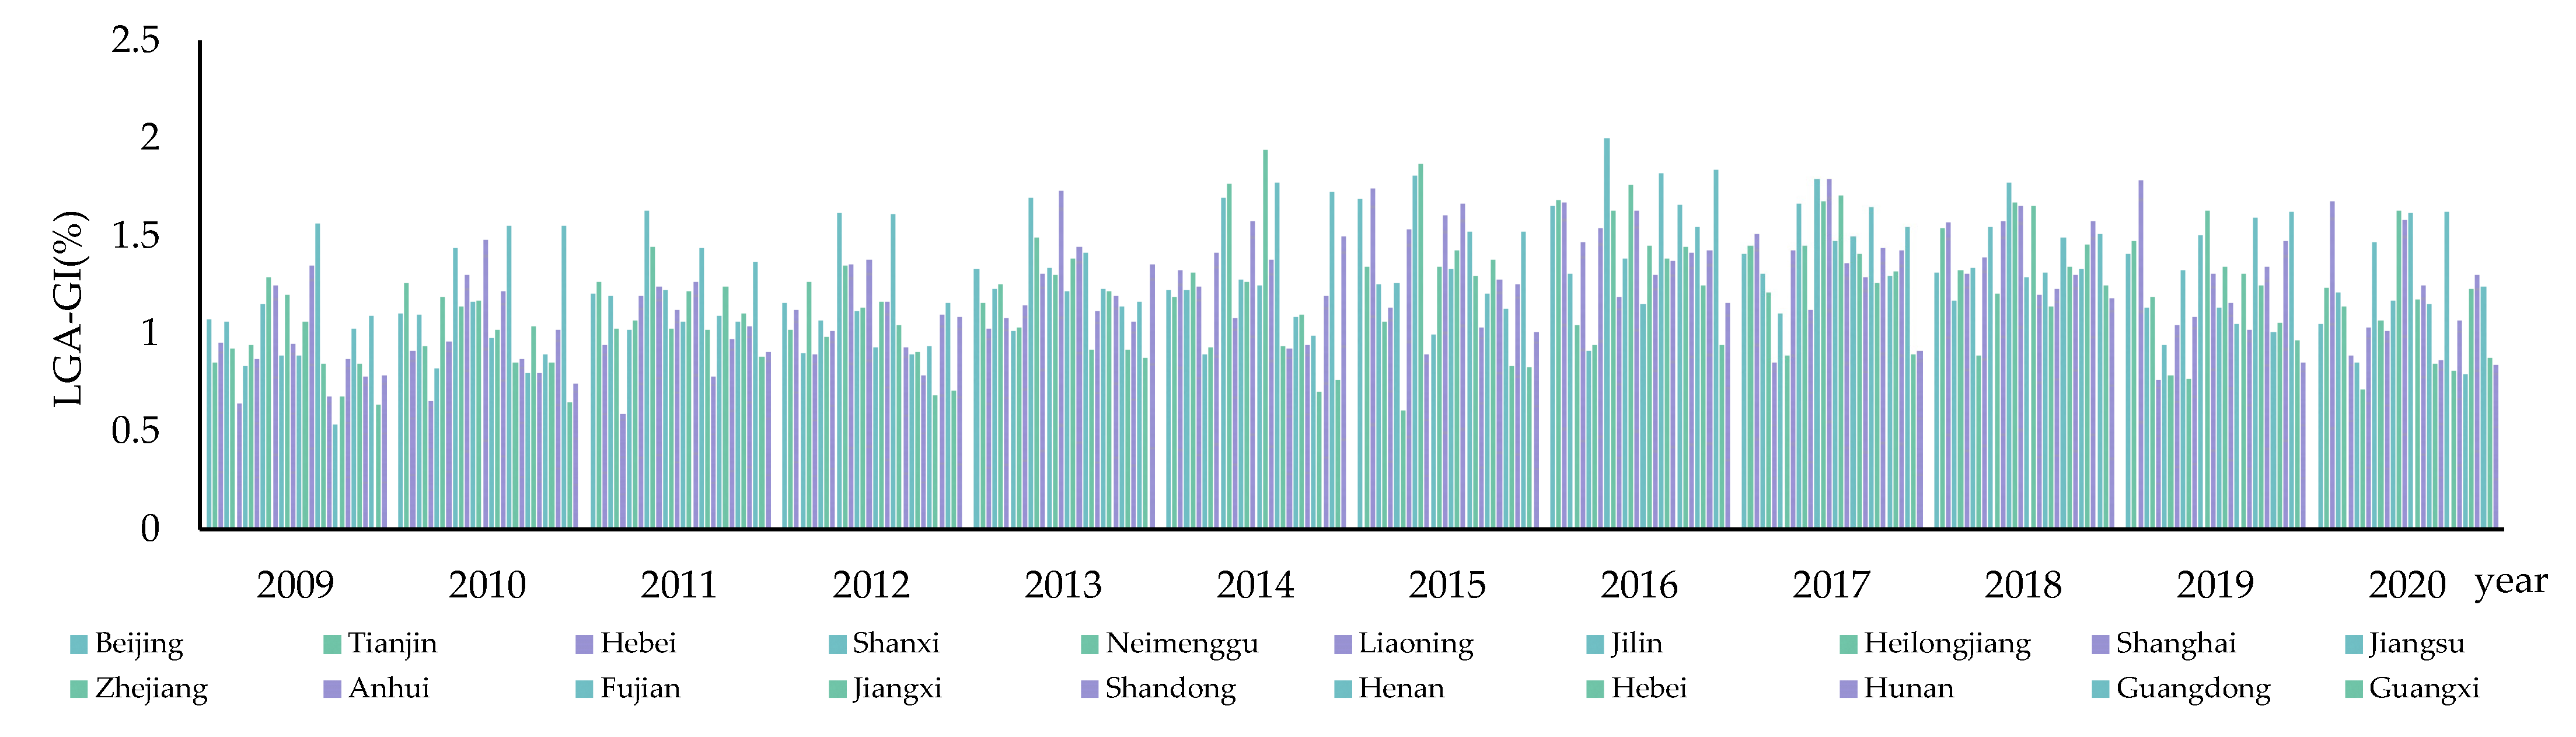
4.1.1. Temporal Evolution of LGA-GI in China

China’s LGA-GI shows an upward trend with some fluctuations from 2009 to 2020, and it reaches a peak three times in 2012, 2016, and 2018 (Figure 3). The year 2011 is the first year of China’s 12th Five-Year Plan, when the central government stated that “building a resource-conserving and environment-friendly society should be an important focus for accelerating the transformation of economic development mode”, which directly leads to the first peak of LGA-GI in 2012. The value of LGA-GI reaches 2.001% in 2016, the highest from 2009 to 2020, which may also be due to the policy signals sent by the central government in 2015. In September 2015, the Special Group on the Reform of the Central Economic Institutions and Ecological Civilization Institutions launched a number of key reform measures in the form of “1 + 6”. (In the “1 + 6”, “1” refers to “the Overall Program for the Reform of Ecological Civilization System”; “6” includes “Environmental Protection Inspector Program (Trial)”, “Program for the Construction of Ecological and Environmental Monitoring Network”, “Pilot Program for Conducting Leading Cadres’ Discharge Audit of Natural Resources Assets”, “Measures for Pursuing Responsibility for Ecological and Environmental Damage by Leading Party and Government Cadres (Trial)”, “Pilot program for the Preparation of Natural Resources Asset and Liability Statements”, and “Pilot Program for the Reform of the Ecological and Environmental Damage Compensation System”.) In November 2015, the Annual Central Economic Work Conference discussed the structural reform of the economy, and a series of policies introduced afterwards pushed the LGA-GI to reach the top in 2016. One year later, the Central Ecological and Environmental Protection Inspection (CEPI), which is one of the highest and strongest monitoring mechanisms in China, was conducted in all provincial administrative regions in China, contributing to the third peak of LGA-GI in 2018. Since then, LGA-GI continues to decline, which shows that despite strong stimulation by the central campaign-style governance, local governments are unable to maintain the level of attention allocated on green innovation without sustained and effective incentives.

4.1.2. Spatial Distribution of LGA-GI in China

To explore the spatial distribution pattern of LGA-GI in China, we divide the values of the variable LGA into four grades using the natural breakpoint tool in ArcGIS 10.8 software, and select two years (2009 and 2020) for visual illustration. In general, the LGA-GI in China from 2009 to 2020 is between 0.542 and 2.001, showing a positive development trend, and the distribution pattern has changed from “sunken middle” (low LGA-GI in the central region) to “continuous highs with scattered lows” (Figure 4).

4.2. Baseline Results

Table 4 reports the baseline regression results of two-way fixed effects models. As shown in Column (1), LGA-GI is significantly and positively correlated with GIE at a statistical level of 10% and GIE increased by 0.1956 for each unit increase in LGA-GI, thus Hypothesis 1 is accepted. Looking at the three stages of green innovation development, Columns (2)–(4) show the coefficients of GIE at three stages are all significantly positive at the 10% statistical level, and the coefficients of commercialization stage (0.1929), absorption stage (0.1410), and knowledge innovation stage (0.1289) are in descending order. We find that the effect of LGA-GI on GIE is not concentrated in the knowledge innovation stage. Therefore, Hypothesis 2 of this paper is not proved. The relatively low LGA-GI in the knowledge innovation stage could be explained by the features of Chinese local government institutions: on the one hand, under the GDP-oriented official performance assessment, knowledge absorption and commercialization of innovation results can bring the most direct GDP growth for local governments. Therefore, local government officials pay more attention to promoting GIE of enterprises through tax reduction and fiscal subsidy to increase GDP and gain promotion opportunities. On the other hand, most funding for knowledge innovation in China comes from the central government, through the National Natural Science Foundation of China, the Ministry of Science and Technology, or the Chinese Academy of Sciences, rather than from local governments [63,64]. In terms of the features of three stages of innovation, the long-term effect of LGA-GI on GIE in the knowledge innovation stage may have yet to be fully captured over the sample period.

4.3. Robustness Test

4.3.1. Adjustment of the Sample Period

Considering that the time selection of samples may cause errors, this paper excludes the data of the first and last two periods (2009 and 2020) of the original sample, and conducts a robustness test with samples from 2010 to 2019. The regression results are shown in Table 5. The results of main effects remain significantly positive (0.2179). The estimated coefficients of LGA-GI on GIE in different stages remain positive, and the coefficients in three stages show that for each unit increase in LGA-GI, GIE increases by 0.2217 in the commercialization stage, by 0.1405 in the knowledge innovation stage, and by 0.1341 in the absorption stage, which indicates that major influence of LGA-GI on GIE is in the commercialization stage, rather than the knowledge innovation stage, and the results are consistent with baseline results.

4.3.2. Eliminating Interference from Provincial-Level Municipalities

There are great differences in natural resource endowment and resource acquisition ability among Chinese provinces, especially the four provincial-level municipalities which directly report to the Central Government and enjoy a high autonomy of development. This paper excludes the data of the four provincial-level municipalities and uses the sample of 26 provincial administrative regions for robustness testing. The regression results are shown in Table 6, and LGA remains significantly correlated with GIE (0.1981). For the three stages of green innovation, the direction and significance level of the effect are consistent with Table 4, and show a trend similar to the baseline result in terms of the size of the effect (the third stage has the largest results followed by other two stages). The results prove that the conclusions in the baseline model are robust.

4.3.3. One Year Lagged Effects

Considering the possible time lag of the effect of LGA-GI on GIE, we set the sample period of the explanatory and control variables as 2009 to 2019, and the sample period of the explained variables lagged by one year (2010 to 2020) for robustness check. The results are shown in Table 7. The effect of LGA-GI on GIE for one lagged period (0.2100) remains significant and is slightly higher than the baseline regression results (0.1956), indicating that LGA-GI has a time lag effect on GIE. The coefficients of the three stages are positive with the commercialization stage having the highest value (0.2273) followed by the knowledge innovation stage (0.1168) and the absorption stage (0.0978). The results again show that the estimated results in Section 4.2 are robust.

4.3.4. Different Measurements of LGA-GI

The explanatory variable in this paper is LGA-GI, and we use the percentage of green innovation-related keywords count in annual government work reports to measure it. To test the robustness of the baseline regression results, the explanatory variable is replaced by the logarithm of the sum of absolute values of the green innovation-related keywords count in annual government work reports (lnALGA), and the regression results are shown in Table 8. After replacing the explanatory variable, the coefficients of lnALGA in the four models are reduced but still significantly positive, and the effect of LGA on GIE remains largely in absorption and commercialization stages.

5. Conclusions and Implications

5.1. Conclusions

Environmental protection and knowledge innovation have strong positive externalities and spillover effects. Green innovation has become an important breakthrough point for China to stop the economic downturn and environmental deterioration by promoting sustainable development with low energy consumption and low environmental damage through innovation. This paper embeds the attention-based view into policy implementation and constructs an analytical framework of how LGA-GI affects GIE. Using the panel data of 30 provincial administrative regions in China from 2009 to 2020, we depicted the temporal and spatial characteristics of LGA-GI, empirically tested the impact of LGA-GI on GIE by two-way fixed effects models, and then compared the effects on the three stages of green innovation. The findings are as follows: (1) The LGA-GI in China from 2009 to 2020 shows a positive development trend with some fluctuations, and spatial distribution has changed from a pattern of “sunken middle” (low LGA-GI in the central region) to “continuous highs with scattered lows”. (2) LGA-GI has a significant positive effect on the overall GIE, but there is heterogeneity in different stages of green innovation. Specifically, the promotion effect of LGA-GI is concentrated in the stage of knowledge absorption and commercialization, rather than in the stage of knowledge innovation. The explanations for the smaller effect in the knowledge innovation stage may be related to the GDP-oriented official performance assessment and centralized scientific research funding sources in China, and the long-term effects of knowledge innovation have yet to be fully captured.

5.2. Policy Implications

Based on the above theoretical analysis and empirical results, practical implications for improving GIE in China are as follows:
(1)
Local governments need to allocate more attention to green innovation and further maintain the continuity of their attention. Based on the empirical results that LGA-GI in China is significantly and positively correlated with GIE while the overall level of LGA-GI is low, we suggest that it is necessary for local governments to continuously optimize the allocation of attention and shift scarce government attention to green innovation. Furthermore, lower-level governments’ continuous attention allocation to green innovation can be prompted by strengthening the supervision and incentive mechanism. Specifically, the sustainability of LGA-GI should be maintained by combining the multi-level top-down inspection system, the bottom-up public oversight, and cross-regional competition between local governments, while making effective use of encouraging incentives such as “promotion tournament”, and discouraging incentives such as the “one-vote veto” rule, the co-responsibility policy of the Party and the government and the lifetime accountability policy for environmental damage in China.
(2)
For policy implementation, governments in China at all levels should allocate policy implementation resources based on the characteristics of green innovation stages. For instance, the central government should provide more support for basic research to promote the improvement of GIE in the knowledge innovation stage; local governments need to increase S&T expenditure for knowledge innovation and commercialization, and strengthen the attractions for foreign capitals through favorable policies so as to promote the innovation absorption and commercialization. In addition, guiding the development and growth of the technology services industry could support the commercialization of innovations.

5.3. Research Prospects

Future research is needed to address the following issues not fully discussed in this paper: (1) The measurement of local government attention can consider expanding the data sources and discussing the color of discourse. In terms of data sources, how to obtain micro investigation data could be further explored, such as questionnaires or interviews of local government officials, media staff, and social people. Then, the coverage of public documents could be expanded by taking into account leaders’ written instructions, interviews with officials, the newspaper articles of provincial party committee, CPPCC proposals, and government work circulars, and finally combining public documents and micro-survey data to measure LGA more comprehensively. In addition, the attention tendency of local government can be further accurately portrayed by examining the expressions of discourse emotion. (2) This paper examines the impact of LGA-GI on GIE, but does not empirically test the mechanism of the effect. The mediating role of different policy implementation resources can be differentiated to further study the influence mechanism. (3) The sample period of this paper is from 2009 to 2020, and considering that the impact effect of innovation may be more visible in a longer period, the impact of LGA-GI on GIE could be studied by extending the sample period in the future. (4) The areas we study in this paper are provinces in China, and whether the findings are applicable to other regions with different political institutions or at different stages of economic development could be further explored in future research.

Author Contributions

Conceptualization, M.X. and H.W.; data curation, M.X. and J.L.; formal analysis, M.X.; funding acquisition, Q.Z. and H.W.; methodology, M.X.; project administration, Q.Z.; software, M.X. and J.L.; supervision, H.W.; validation, Q.Z.; visualization, M.X. and J.L.; writing—original draft, M.X., Z.P. and T.L.; writing—review and editing, M.X., Z.P., J.L. and C.Z. All authors have read and agreed to the published version of the manuscript.

Funding

This research received no external funding.

Institutional Review Board Statement

Ethical review and approval was not required for the study as the research does not involve humans.

Informed Consent Statement

Not applicable.

Data Availability Statement

Data available on request.

Conflicts of Interest

The authors declare no conflict of interest.

References

  1. IQAir. World’s Most Polluted Countries & Regions (Historical Data 2018–2021). Available online: https://www.iqair.com/us/world-most-polluted-countries/ (accessed on 26 June 2022).
  2. Xie, X.M.; Zhu, W.Q. How Can Green Innovation Solve the Dilemmas of “Harmonious Coexistence”? J. Manag. World. 2021, 37, 128–149. [Google Scholar]
  3. Bai, X.J.; Li, Z.Y.; Zeng, J. Performance Evaluation of China’s Innovation during the Industry-University-Research Collaboration Process—an Analysis Basis on the Dynamic Network Slacks-Based Measurement Model. Technol. Soc. 2020, 62, 101310. [Google Scholar] [CrossRef]
  4. China Council for International Cooperation on Environment and Development (CICED). Harmonious Development though Innovation; China Environmental Science Press: Beijing, China, 2009. [Google Scholar]
  5. Karimi, T.S.; Sayyadi, T.H.; Shahabaldini, P.Z. Green Innovation: A Systematic Literature Review. J. Clean. Prod. 2021, 279, 122474. [Google Scholar] [CrossRef]
  6. Castellacci, F.; Lie, C.M. A taxonomy of green innovators: Empirical evidence from South Korea. J. Clean. Prod. 2017, 143, 1036–1047. [Google Scholar] [CrossRef]
  7. Ha, Y.J. Attention Green Aliens? Activities of Multinational Enterprises in Host Countries and Eco-Innovation Diffusion. J. Bus. Res. 2021, 123, 32–43. [Google Scholar] [CrossRef]
  8. Sun, Y.; Sun, H. Executives’ Environmental Awareness and Eco-Innovation: An Attention-Based View. Sustainability 2021, 13, 4421. [Google Scholar] [CrossRef]
  9. Yin, J.H.; Shuang, Q. CEO’s Academic Experience and Enterprise’s Green Innovation: The Dual Perspective Analysis of Environmental Attention Allocation and Industry University Research Cooperation Empowerment. Available online: http://kns.cnki.net/kcms/detail/42.1224.G3.20220526.0849.006.html (accessed on 7 June 2022).
  10. Yu, F.; Hu, C.P.; Liu, M.X. Network density, attention allocation of TM and firm green innovation: The moderating effect of institutional pressure. J. Ind. Eng. Eng. Manag. 2021, 35, 55–66. [Google Scholar] [CrossRef]
  11. He, L.; Huang, L.; Yang, G. Invest in Innovation or Not? How Managerial Cognition and Attention Allocation Shape Corporate Responses to Performance Shortfalls. Manag. Organ. Rev. 2021, 17, 815–850. [Google Scholar] [CrossRef]
  12. Zhang, Y.H. Research on Attention Allocation and Resource Layout of Local Government’s Science and Technology Innovation in the 14th Five-Year Plan Period—Based on the text analysis of the 14th Five-Year Plan of 30 provinces and cities and their long-term goals. Sci. Manag. Res. 2021, 39, 30–34. [Google Scholar] [CrossRef]
  13. Zhang, S.M. Attention allocation of local governments in promoting the transformation of scientific and technological achievements—NVivo analysis based on 15 provincial policy texts. J. Henan. Norm. Univ. 2022, 50, 104–112. [Google Scholar] [CrossRef]
  14. Chen, X.P.; Bi, L.N.; Wu, D.Y. A Measurement of Government’s Attention to Innovation and Entrepreneurship of Scientific and Technological Talents in China—A Text Analysis of the Central Government Work Report (1978–2017). Sci. Technol. Prog. Policy 2018, 35, 155–160. [Google Scholar]
  15. Niu, Q.; Liu, C. Research on Attention Allocation of Local Governments in Pursuing Regional Green Development:Based on the Text Analysis of the Work Reports of the Beijing Municipal Government, Tianjin Municipal Government and Hebei Provincial Government(2010–2019). J. Chin. Exec. Leadersh. Acad. Yan’an 2020, 06, 98–106. [Google Scholar] [CrossRef]
  16. Huang, S.; Ding, Y.; Failler, P. Does the Government’s Environmental Attention Affect Ambient Pollution? Empirical Research on Chinese Cities. Sustainability 2022, 14, 3242. [Google Scholar] [CrossRef]
  17. Fan, Z.; Christensen, T.; Ma, L. Policy Attention and the Adoption of Public Sector Innovation. Public Manag. Rev. 2022, 1–20. [Google Scholar] [CrossRef]
  18. Kneller, R.; Manderson, E. Environmental Regulations and Innovation Activity in UK Manufacturing Industries. Resour. Energy Econ. 2012, 34, 211–235. [Google Scholar] [CrossRef]
  19. Liao, Z.; Lu, J.; Yu, Y.; Zhang, Z.(J.). Can Attention Allocation Affect Firm’s Environmental Innovation: The Moderating Role of Past Performance. Technol. Anal. Strateg. Manag. 2021, 34, 1081–1094. [Google Scholar] [CrossRef]
  20. Zheng, Y.W.; Xue, W.X. The Path to Improve the Green Innovation Ability of Western National High-tech Zones Facing High-quality Development. J. Technol. Econ. 2022, 41, 1–11. [Google Scholar]
  21. Ocasio, W. Towards an attention-based view of the firm. Strateg. Manag. J. 1997, 18, 187–206. [Google Scholar] [CrossRef]
  22. Jones, B.D.; Baumgartner, F.R. A Model of Choice for Public Policy. J. Public Adm. Res. Theory 2004, 15, 325–351. [Google Scholar] [CrossRef]
  23. Jones, B.D. Reconceiving Decision-Making in Democratic Politics: Attention, Choice, and Public Policy; University of Chicago Press: Chicago, IL, USA, 2019. [Google Scholar]
  24. Baumgartner, F.R.; Breunig, C.; Green-Pedersen, C.; Jones, B.D.; Mortensen, P.B.; Nuytemans, M.; Walgrave, S. Punctuated Equilibrium in Comparative Perspective. Am. J. Polit. Sci. 2009, 53, 603–620. [Google Scholar] [CrossRef]
  25. Engström, R.; Nilsson, M.; Finnveden, G. Which Environmental Problems Get Policy Attention? Examining Energy and Agricultural Sector Policies in Sweden. Environ. Impact Assess. Rev. 2008, 28, 241–255. [Google Scholar] [CrossRef]
  26. Breeman, G.; Scholten, P.; Timmermans, A. Analysing Local Policy Agendas: How Dutch Municipal Executive Coalitions Allocate Attention. Local Gov. Stud. 2015, 41, 20–43. [Google Scholar] [CrossRef]
  27. Lam, W.F.; Chan, K.N. How Authoritarianism Intensifies Punctuated Equilibrium: The Dynamics of Policy Attention in Hong Kong: Policy Dynamics in Hong Kong. Governance 2015, 28, 549–570. [Google Scholar] [CrossRef]
  28. Huang, X.; Kim, S.E. When Top-down Meets Bottom-up: Local Adoption of Social Policy Reform in China. Governance 2020, 33, 343–364. [Google Scholar] [CrossRef]
  29. Li, R.; Zhou, Y.; Bi, J.; Liu, M.; Li, S. Does the Central Environmental Inspection Actually Work? J. Environ. Manag. 2020, 253, 109602. [Google Scholar] [CrossRef]
  30. Tang, P.; Jiang, Q.; Mi, L. One-Vote Veto: The Threshold Effect of Environmental Pollution in China’s Economic Promotion Tournament. Ecol. Econ. 2021, 185, 107069. [Google Scholar] [CrossRef]
  31. Wu, L.B.; Yang, M.M.; Sun, K. Impact of public environmental attention on environmental governance of enterprises and local governments. Chin. J. Popul. Resour. 2022, 02, 1–14. [Google Scholar]
  32. Li, X.; Hu, Z.; Cao, J.; Xu, X. The Impact of Environmental Accountability on Air Pollution: A Public Attention Perspective. Energy Policy 2022, 161, 112733. [Google Scholar] [CrossRef]
  33. Taylor, B.R. The Lack of Competition in Governance as an Impediment to Regional Development in Australia. Agenda 2017, 24, 21–30. [Google Scholar] [CrossRef]
  34. Zeng, R.X.; Zhu, L.P. Does Promotion Incentive Inhibit the Level of Environmental Attention Allocation of Local Leader? Pub. Adm. Policy. Rev. 2021, 10, 45–61. [Google Scholar]
  35. Wang, H.; Yin, J.Y. Environmental governance effects of local complex:an empirical study based on the perspective of official heterogeneity. J. Yunnan Univ. Financ. Econ. 2019, 35, 80–92. [Google Scholar] [CrossRef]
  36. Stevens, R.; Moray, N.; Bruneel, J.; Clarysse, B. Attention Allocation to Multiple Goals: The Case of for-Profit Social Enterprises: Attention Allocation to Multiple Goals. Strateg. Manag. J. 2015, 36, 1006–1016. [Google Scholar] [CrossRef]
  37. Jiang, Y.F. Administrative Resources and Development Trend of Public Administration. Trib. Stud. 2019, 6, 47–53. [Google Scholar] [CrossRef]
  38. He, D.H.; Kong, F.F. Political Potential Energy in the Implementation of Chinese Public Policy—An Analysis Based on the Forestry Reform Policy of the Last Two Decades. Soc. Sci. China. 2019, 4, 4–25. [Google Scholar]
  39. Ran, R. Political Incentives and Local Environmental Governance under a “Pressurized System”. Comp. Econ. Soc. Syst. 2013, 03, 111–118. [Google Scholar]
  40. Liu, S.F.; Du, D.F.; Qin, X.H.; Hou, C.G. Spatial-temporal Pattern and Influencing Factors of China’s Innovation Efficiency Based on Innovation Value Chain. Sci. Geogr. Sin. 2019, 39, 173–182. [Google Scholar] [CrossRef]
  41. Hansen, M.T.; Birkinshaw, J. The innovation value chain. Harv. Bus. Rev. 2007, 85, 121. [Google Scholar]
  42. Wang, Y.; Chen, Y.; Li, W.; Wang, T.; Guo, L.; Li-Ying, J.; Huang, J. Funding Research in Universities: Do Government Resources Act as a Complement or Substitute to Industry Funding? Econ. Res. Ekon. Istraživanja 2020, 33, 1377–1393. [Google Scholar] [CrossRef]
  43. Tone, K. A Slacks-Based Measure of Efficiency in Data Envelopment Analysis. Eur. J. Oper. Res. 2001, 12, 498–509. [Google Scholar] [CrossRef]
  44. Wu, M.Q.; Xiao, H.; Fan, X.H.; Li, C.H. Research on Three- stage Efficiency of Regional Green Innovation: An Analysis Based on NSBM. J. Shanxi Univ. 2016, 39, 79–86. [Google Scholar] [CrossRef]
  45. Sun, Z.; Yang, J. Media Usage, Political Interest and Citizens’ Issue Attention to Government Annual Report in China- Evidence from 19 Major Cities. J. Asian Public Policy 2021, 14, 353–374. [Google Scholar] [CrossRef]
  46. Quinn, K.M.; Monroe, B.L.; Colaresi, M.; Crespin, M.H.; Radev, D.R. How to Analyze Political Attention with Minimal Assumptions and Costs. Am. J. Polit. Sci. 2010, 54, 209–228. [Google Scholar] [CrossRef]
  47. Larsen-Price, H.A. The Right Tool for the Job: The Canalization of Presidential Policy Attention by Policy Instrument: Larsen-Price: The Right Tool for the Job. Policy Stud. J. 2012, 40, 147–168. [Google Scholar] [CrossRef]
  48. Shi, C.; Shi, Q.; Guo, F. Environmental Slogans and Action: The Rhetoric of Local Government Work Reports in China. J. Clean. Prod. 2019, 238, 117886. [Google Scholar] [CrossRef]
  49. Cheng, Q.; Kang, J.; Lin, M. Understanding the Evolution of Government Attention in Response to COVID-19 in China: A Topic Modeling Approach. Healthcare 2021, 9, 898. [Google Scholar] [CrossRef]
  50. Lu, J.C.; Shen, C.Y. Heterogeneity and evolutional features of green technological innovation efficiency of national central cities. Urban Probl. 2019, 2, 21–28. [Google Scholar] [CrossRef]
  51. Boydstun, A.E.; Bevan, S.; Thomas, H.F. The Importance of Attention Diversity and How to Measure It: Measuring Attention Diversity. Policy Stud. J. 2014, 42, 173–196. [Google Scholar] [CrossRef]
  52. Oduro, S.; Maccario, G.; De Nisco, A. Green Innovation: A Multidomain Systematic Review. Eur. J. Innov. Manag. 2022, 25, 567–591. [Google Scholar] [CrossRef]
  53. Hojnik, J.; Ruzzier, M. What Drives Eco-Innovation? A Review of an Emerging Literature. Environ. Innov. Soc. Transit. 2016, 19, 31–41. [Google Scholar] [CrossRef]
  54. Stemler, S. An Overview of Content Analysis. 2001. Available online: https://frankumstein.com/PDF/Psychology/Content%20Analysis.pdf. (accessed on 7 June 2022).
  55. Zhang, K.X. An Inverted U-Shaped Relationship between Environmental Attention and Local Government Policy Implementation. Chin. Pub. Adm. Rev. 2021, 3, 132–161. [Google Scholar]
  56. Esquivias, M.A.; Sugiharti, L.; Rohmawati, H.; Rojas, O.; Sethi, N. Nexus between Technological Innovation, Renewable Energy, and Human Capital on the Environmental Sustainability in Emerging Asian Economies: A Panel Quantile Regression Approach. Energies 2022, 15, 2451. [Google Scholar] [CrossRef]
  57. Li, Z.H.; Bai, T.T. Government environmental protection expenditure, green technology innovation and smog pollution. Sci. Res. Manag. 2021, 2, 52–63. [Google Scholar] [CrossRef]
  58. Sánchez-Sellero, P.; Bataineh, M.J. How R&D Cooperation, R&D Expenditures, Public Funds and R&D Intensity Affect Gree Innovation? Technol. Anal. Strateg. Manag. 2021, 34, 1095–1108. [Google Scholar] [CrossRef]
  59. Weerawardena, J.; Salunke, S.; Knight, G.; Mort, G.S.; Liesch, P.W. The Learning Subsystem Interplay in Service Innovation in Born Global Service Firm Internationalization. Ind. Mark. Manag. 2020, 89, 181–195. [Google Scholar] [CrossRef]
  60. Behera, P.; Sethi, N. Nexus between Environment Regulation, FDI, and Green Technology Innovation in OECD Countries. Environ. Sci. Pollut. Res. 2022, 29, 52940–52953. [Google Scholar] [CrossRef] [PubMed]
  61. Luo, Y.; Salman, M.; Lu, Z. Heterogeneous Impacts of Environmental Regulations and Foreign Direct Investment on Green Innovation across Different Regions in China. Sci. Total Environ. 2021, 759, 143744. [Google Scholar] [CrossRef]
  62. O’brien, R.M. A Caution Regarding Rules of Thumb for Variance Inflation Factors. Qual. Quant. 2007, 41, 673–690. [Google Scholar] [CrossRef]
  63. Sun, Y.; Cao, C. Demystifying Central Government R&D Spending in China. Science 2014, 345, 1006–1008. [Google Scholar] [CrossRef]
  64. Zhou, H.; Yang, X.; Liu, Q.; Pu, J.; Lei, R. Distribution of the Population and Health Projects of the Joint Fund in China between 2006 and 2019. Ann. Transl. Med. 2021, 9, 1388. [Google Scholar] [CrossRef]
Figure 1. Analytical framework of how local governments’ attention focused on green innovation (LGA-GI) affects green innovation efficiency (GIE).
Sustainability 14 12059 g001
Figure 2. Three-stage Green Innovation Value Chain Model.
Sustainability 14 12059 g002
Figure 3. Local governments’ attention allocated to green innovation (LGA-GI) in China from 2009 to 2020.
Sustainability 14 12059 g003
Figure 4. Spatial Distribution of LGA-GI in China in 2009 and 2020.
Sustainability 14 12059 g004
Table 1. Definition and measurement of variables.
TypesNameMeasure
Explained VariableGIEThree-stage MaxDEA measure
Knowledge Innovation inputsExpected outputsUnexpected outputs
FTE of R&D personnel;
internal expenditure on R&D funding
number of scientific papers;
number of patents
Absorptionnumber of scientific papers;
number of patents;
provision for new product development
technology market turnover;
social labor productivity
Commercializationtechnology market turnover;
social labor productivity;
energy consumption per GDP
sales revenue of new productscomprehensive index of environmental pollution
Explanatory VariableLGAgreen innovation-related keywords count/total word count in the text
Control variableslnPGDPlogarithm of GDP per capita (deflated)
lnPDlogarithm of (year-end population/administrative area)
EEPenergy conservation and environmental protection expenditure/local fiscal expenditure
STPS&T expenditure/local fiscal expenditure
ISthe tertiary industry GDP/GDP
OItotal exports and imports of goods by foreign-invested enterprises/total imports and exports of goods
Table 2. Descriptive statistics.
Variables.Obs.Std. Dev.AveMin.Max.
GIE3600.2530.7480.2181.000
GIE13600.2150.8490.1791.000
GIE23600.2060.8650.1501.000
GIE33600.2720.7390.1701.000
LGA3600.2881.2140.5422.001
lnPGDP3600.4534.3203.0155.480
lnPD3601.2885.4912.0468.364
EEP3600.9813.0471.1366.814
STP3601.4682.0550.3897.202
IS3609.85746.05128.60083.900
OI36022.21533.9000.46778.872
Table 3. Pairwise correlations between variables.
(1)(2)(3)(4)(5)(6)(7)(8)(9)(10)(11)
(1) GIE1
(2) GIE10.754 **1
(3) GIE20.703 **0.818 **1
(4) GIE30.963 **0.572 **0.510 **1
(5) LGA0.381 **0.309 **0.329 **0.346 **1
(6) lnPGDP0.549 **0.438 **0.474 **0.500 **0.376 **1
(7) lnPD0.461 **0.325 **0.260 **0.469 **0.216 **0.504 **1
(8) EEP−0.135 *−0.127 *−0.122 *−0.139 **0.003−0.127 *−0.268 **1
(9) STP0.532 **0.415 **0.353 **0.512 **0.272 **0.728 **0.699 **−0.189 **1
(10) IS0.339 **0.267 **0.350 **0.287 **0.206 **0.631 **0.414 **0.0190.613 **1
(11) OI0.493 **0.265 **0.285 **0.524 **0.125 *0.458 **0.668 **−0.199 **0.437 **0.257 **1
Note: * p < 0.05; ** p < 0.01; two-tailed test.
Table 4. Baseline results.
Overall LevelThree Stages
(1)(2)(3)(4)
LGA0.1956 ***0.1289 ***0.1410 ***0.1929 ***
(5.19)(3.45)(4.02)(4.70)
lnPGDP0.1020 ***0.1089 ***0.1334 ***0.0692 *
(2.73)(2.94)(3.84)(1.70)
lnPD−0.01260.0018−0.0167−0.0132
(−0.93)(0.14)(−1.33)(−0.90)
EEP−0.0042−0.0106−0.0185 *−0.0024
(−0.39)(−1.00)(−1.85)(−0.20)
STP0.0462 ***0.0280 **−0.00050.0560 ***
(3.66)(2.24)(−0.05)(4.08)
IS−0.0011−0.00100.0028 **−0.0023
(−0.76)(−0.75)(2.17)(−1.51)
OI0.0036 ***0.00050.0014 **0.0046 ***
(5.63)(0.78)(2.29)(6.63)
City FEcontrolcontrolcontrolcontrol
Time FEcontrolcontrolcontrolcontrol
Constant−0.01640.21750.09130.1214
(−0.11)(1.46)(0.65)(0.74)
Observations360360360360
Notes: T-statistics in parentheses, ***, **, and * denote statistical significance at the 1%, 5%, and 10% level, respectively.
Table 5. Robustness test: adjustment of the sample period.
Overall LevelThree Stages
(1)(2)(3)(4)
LGA0.2179 ***0.1405 ***0.1342 ***0.2217 ***
(5.11)(3.41)(3.67)(4.78)
lnPGDP0.0790 *0.0741 *0.0668 *0.0668
(1.84)(1.79)(1.81)(1.43)
lnPD−0.01180.0132−0.0017−0.0182
(−0.79)(0.91)(−0.14)(−1.12)
EEP0.0087−0.00460.00180.0098
(0.73)(−0.39)(0.18)(0.76)
STP0.0509 ***0.0268 *0.00440.0612 ***
(3.60)(1.96)(0.36)(3.98)
IS−0.0019−0.00130.0022 *−0.0033 **
(−1.25)(−0.85)(1.69)(−1.99)
OI0.0038 ***0.00040.0013 **0.0050 ***
(5.41)(0.57)(2.15)(6.46)
City FEcontrolcontrolcontrolcontrol
Time FEcontrolcontrolcontrolcontrol
Constant0.02900.2931 *0.2709 *0.1002
(0.17)(1.77)(1.84)(0.54)
Observations300300300300
Notes: T-statistics in parentheses, ***, **, and * denote statistical significance at the 1%, 5%, and 10% level, respectively.
Table 6. Robustness test: eliminating interference from municipalities.
Overall LevelThree Stages
(1)(2)(3)(4)
LGA0.1981 ***0.1272 ***0.1277 ***0.1986 ***
(4.65)(2.98)(3.22)(4.26)
lnPGDP0.0776 *0.0982 **0.1271 ***0.0432
(1.85)(2.33)(3.26)(0.94)
lnPD−0.0208−0.0024−0.0171−0.0228
(−1.40)(−0.16)(−1.24)(−1.40)
EEP−0.0096−0.0168−0.0159−0.0110
(−0.74)(−1.29)(−1.32)(−0.77)
STP0.0632 ***0.0397 ***0.00940.0730 ***
(4.26)(2.67)(0.68)(4.50)
IS0.00110.00040.0062 ***−0.0008
(0.57)(0.20)(3.55)(−0.41)
OI0.0036 ***0.00040.0015 **0.0046 ***
(5.11)(0.50)(2.35)(5.98)
City FEcontrolcontrolcontrolcontrol
Time FEcontrolcontrolcontrolcontrol
Constant0.01660.2248−0.03960.2025
(0.09)(1.25)(−0.24)(1.03)
Observations312312312312
Notes: T-statistics in parentheses, ***, **, and * denote statistical significance at the 1%, 5%, and 10% level, respectively.
Table 7. Robustness Test: Post Lagged One Period.
Overall LevelThree Stages
(1)(2)(3)(4)
LGA0.2100 ***0.1168 ***0.0978 ***0.2273 ***
(5.31)(3.04)(2.93)(5.29)
lnPGDP0.05440.0726 *0.0903 ***0.0266
(1.42)(1.94)(2.78)(0.64)
lnPD−0.01550.0099−0.0027−0.0220
(−1.11)(0.73)(−0.23)(−1.45)
EEP0.0034−0.0034−0.00540.0037
(0.30)(−0.32)(−0.57)(0.31)
STP0.0517 ***0.0273 **0.00150.0622 ***
(3.92)(2.12)(0.13)(4.33)
IS−0.0017−0.00160.0018−0.0027 *
(−1.18)(−1.09)(1.43)(−1.72)
OI0.0041 ***0.00070.0011 *0.0053 ***
(6.14)(1.06)(1.91)(7.27)
City FEcontrolcontrolcontrolcontrol
Time FEcontrolcontrolcontrolcontrol
Constant0.17440.3538 **0.2900 **0.2779 *
(1.13)(2.35)(2.22)(1.65)
Observations330330330330
Notes: T-statistics in parentheses, ***, **, and * denote statistical significance at the 1%, 5%, and 10% level, respectively.
Table 8. Robustness test: different measurement of LGA.
Overall LevelThree Stages
(1)(2)(3)(4)
lnALGA0.1509 ***0.1149 ***0.1390 ***0.1370 ***
(4.37)(3.40)(4.40)(3.65)
lnPGDP0.1452 ***0.1361 ***0.1620 ***0.1128 ***
(4.00)(3.83)(4.87)(2.85)
lnPD−0.01230.0013−0.0179−0.0124
(−0.89)(0.10)(−1.42)(−0.83)
EEP−0.0035−0.0105−0.0187 *−0.0015
(−0.32)(−0.99)(−1.88)(−0.12)
STP0.0424 ***0.0253 **−0.00370.0523 ***
(3.33)(2.02)(−0.32)(3.77)
IS−0.0017−0.00140.0023 *−0.0029 *
(−1.18)(−1.05)(1.82)(−1.88)
OI0.0034 ***0.00040.0013 **0.0044 ***
(5.33)(0.63)(2.15)(6.31)
City FEcontrolcontrolcontrolcontrol
Time FEcontrolcontrolcontrolcontrol
Constant−0.6240 ***−0.2430−0.4645 **−0.4321 *
(−3.08)(−1.22)(−2.50)(−1.95)
Observations360360360360
Notes: T-statistics in parentheses, ***, **, and * denote statistical significance at the 1%, 5%, and 10% level, respectively.
Publisher’s Note: MDPI stays neutral with regard to jurisdictional claims in published maps and institutional affiliations.

