Article

Advanced Bioethanol Production from Source-Separated Bio-waste in Pilot Scale

by
Panagiota Tsafara
,
Konstantinos Passadis
,
Diogenis Christianides
,
Emmanouil Chatziangelakis
,
Ioannis Bousoulas
,
Dimitris Malamis
,
Sofia Mai
,
Elli Maria Barampouti
and
Konstantinos Moustakas
*
Unit of Environmental Science & Technology, School of Chemical Engineering, Zographou Campus, National Technical University of Athens, 9 Iroon Polytechniou Str., 15780 Athens, Greece
*
Author to whom correspondence should be addressed.
Sustainability 2022, 14(19), 12127; https://doi.org/10.3390/su141912127
Submission received: 28 July 2022 / Revised: 20 September 2022 / Accepted: 21 September 2022 / Published: 25 September 2022

Abstract

:
The Sustainable Development Goals along with national policies pave the way to a sustainable, circular, and resource efficient development model. The environmental scenario could change with the promotion of biofuels such as bioethanol. Recent research on bioethanol aspires to reduce the costs production, via the optimization of process variables and the increase in ethanol yields. This study presented a stepwise upscaling of bioethanol production from dried source-separated municipal biowaste. Three different scales (250 mL, 4 L, 100 L) were examined applying advanced ethanol production via simultaneous saccharification and fermentation. The bioprocess runs at each of the three scales and produced very similar ethanol yields, indicating excellent scalability. The validated optimum conditions at the pilot scale were 25% solids loading, Spirizyme 40 μL/g starch, NS87014 175 μL/g cellulose, and 2% S. cerevisiae. The results from the pilot trials were very successful and repeatable. Τhe mean ethanol yield was 86.60 ± 4.91%, while the structural component such as starch and cellulose were efficiently hydrolysed. The produced ethanol was recovered and purified meeting the standards of absolute ethanol, rendering it suitable for industrial uses and for biofuel use as well. Energy consumption aspects were discussed as well. Conclusively, all the stages of the value chain for source-separated biowaste valorisation (collection, treatment, added value product recovery) were successfully showcased.

1. Introduction

Biowaste, with a share of 34% of municipal waste in the EU stands as a serious environmental, economic, and social problem. Given that food waste accounts for nearly 60 % of all biowaste, it is obvious that it is a key waste stream with a high potential in contributing to the transition to a circular economy. According to the latest statistical data (2019), it is estimated that the global food waste production is 931 × 106 tonnes, deriving from households (61%), food service (26%), and retail (13%). The evaluation of the problem set by this waste stream could be made if someone takes into consideration the fact that 33% of the global food production ends up as waste and that 8–10% of global greenhouse gas emissions (GHG) is attributed to food waste. Regarding Europe, the annual production of food waste is around 88 × 106 tonnes, which means 174 kg of food waste produced per person with a cost of 143 billion euros and GHG emissions up to 170 × 106 CO2-eq [1].
Taking into consideration the global hunger as well as the shortage of natural resources, it is evident that waste management could be considered as one of the most important challenges of the 21st century. The legislation framework of waste management at the national and international level sets waste minimization/prevention and valorization as first priorities for effective management, for food security, and for improvement of food industry sustainability.
In order to ensure that food waste may be utilized as a source of high-quality value-added products, it needs to be separately collected at source while keeping impurities as low as possible. Implementing a separate biowaste collection system is a complex process and needs a comprehensive and coordinated policy framework. Strategy schemes such as Targets or Pay-As-You-Throw are necessary, to create clear incentives to divert food waste from residual waste. In the food waste hierarchy (Figure 1), food waste prevention has the highest priority and disposal is the least desirable option. However, not all food waste could be prevented, so technologies valorizing it must be developed in order to promote, reuse, and recycle.
Biofuels production from food waste stands as a preferable and feasible option in the waste hierarchy promoting waste recycling into value-added products. Additionally, in view of facing fossil fuels dependance and their price volatility, of reversing the climate change, and of taking into account the need to phase out fossil fuels, biofuels have a key role as a solution for low carbon transport according to EU principles and goals.
Bioethanol, defined as ethanol produced from biomass, is the leading biofuel in the global transportation. Its annual world production was 27.3 billion gallons in 2021, which increased by 110% from 2007 [2]. Despite these efforts, USA (54.92%) and Brazil (27.46%) remain the producer countries. Currently, starchy and sugar feedstocks are used for bioethanol production which is referred to as first generation (1G) bioethanol. Although this process is quite simple, its main drawback is the high feedstocks’ price accounting for 40–70% of the total bioethanol cost. In view of low-cost feedstocks, lignocellulosic biomass was recognized as the most promising raw material for production of second-generation bioethanol (2G), given its high availability, low cost, and the absence of competence with food production as 1G feedstocks do. Nevertheless, the bioconversion of lignocellulosic feedstocks to bioethanol is more challenging than the respective process for 1G bioethanol. Due to the lignocellulosic biomass structure (40–65% cellulose, 20–45% hemicellulose, and 10–25% lignin), the 2G bioethanol production cost is too high to be competitive [3].
Even though 2G ethanol is a sustainable option, it is still in its infancy. Nevertheless, municipal and industrial biowastes could stand as promising feedstocks for bioethanol production given emission savings, the added value of the new waste management schemes, along with the circular economy strategy promotion [4,5].
Thus, several researchers work on the advanced bioethanol production from food waste given their high carbohydrate and free sugars contents (>50%). This perspective is very advantageous since it is a renewable and sustainable solution with low carbon footprint [6,7].
According to literature [6,8,9], there is a wide variety of 2G bioethanol production methodologies from household food waste, revealing that elevated efficiencies (>80%) are achievable if stages of pretreatment, saccharification, and fermentation are applied. It has been reported that enzymatic blends could be favourable for bioethanol yield. Nevertheless, it is pointed out that the energy demands and the enzyme cost could be considered as the major bottlenecks [9].
Within the proposed methodologies, simultaneous saccharification and fermentation (SSF) is an auspicious process mode for the bioconversion of food waste to ethanol. SSF is considered to present operational potential, since process integration results in reduced fermentation time and thus reduced production costs. The main advantages of SSF fermentation mode where the saccharification and fermentation processes take place simultaneously, instead of being subsequent steps, are the alleviation of the end-product’s inhibition during enzymatic hydrolysis, the lower energy needs, and the reduced costs. On the other hand, favorable operational conditions for both processes are sought and there are difficulties in the recycling of yeast and enzymatic formulations. In view of this, SSF usually takes places at 37 °C by applying reduced yeast concentration and elevated solids loading [10].
In this work, an optimization of the treatment train producing bioethanol from source-separated food waste and further upscaling from lab to pilot scale was performed. The main aim of this paper was to carry out a stepwise verification and upscaling process for ethanol production from source-separated food waste. Regarding the source—separated food waste—so far in literature, most of the research is based on synthetic food waste [11,12,13,14,15,16] or restaurants and cafeteria food waste [11,17,18,19,20,21,22,23,24,25,26,27] but, in this study, real household food waste produced by citizens was used as feedstock.

2. Materials and Methods

2.1. Materials

The raw material utilized within this paper was source separated biowaste that was compiled in the Vari-Voula-Vouliagmeni Municipality in Attika, Greece. It was delivered to the Unit of Environmental Science and Technology (UEST), School of Chemical Engineering, NTUA. Upon delivery, the biowaste was submitted to a simultaneous drying and milling process by a GAIA (GC-100) waste dryer since its high moisture content makes biowaste susceptible to microbial decomposition and thus renders it improper for long-term storage.
All chemicals used were of analytical grade. Spirizyme XL, which is an amylolytic formulation, and non-commercial NS87014, which is a cellulolytic enzyme, were provided by Novozymes (Bagsværd, Denmark). The activity of Spirizyme XL was measured equal to 2337 U/mL [28]. Similarly, the activity of NS87014 was measured equal to 333 FPU/ mL [29]. S. cerevisiae was utilized as fermentation yeast in the form of a commercial baker’s yeast. Zeolite 3A was purchased by ThermoFisher (Waltham, MA, USA) (CAS no 308080-99-1) with a particle size of 2–5 mm.

2.2. Analytical Methods

The NREL laboratory analytical procedure was followed for the determination of moisture, water soluble solids, lignin, cellulose, and hemicellulose in biowaste (raw and pretreated) [30,31,32]. The Total Starch (AA/AMG) test kit (e.g., Megazyme, Wicklow, Ireland) was utilized for total starch analysis according to the AACC Method 76-13.01. Fats and lipids were quantified by applying the Soxhlet standard method (5520E) [33]. Glucose, volatile fatty acids, and ethanol were determined in the liquid fraction photometrically (Spectroquant Pharo 300 Merck, Darmstadt, Germany) by using marketable kits. Glucose measurement was carried out through the Glucose oxidase-peroxidase method (GOD/PAP) (Biosis SA, Athens, Greece). Volatile Fatty Acids (VFA) were determined by the Spectroquant Volatile Organic Acids Test 1018909 by Merck KGaA Mellipore, Darmstadt, Germany. Ethanol concentration was estimated by an Ethanol Assay Kit (K-EtOHLQR, Megazymes). The recovered ethanol was analysed according to ISO 9001:20. All analyses took place in duplicate.

2.3. Experimental Methods

2.3.1. Lab-Scale

Within this study, simultaneous saccharification fermentation (SSF) was studied as the fermentation mode. Initially, a 23 factorial experiment was designed at lab scale aiming to evaluate the impact of the process variables (amylase, cellulase, and yeast dosages) on the ethanol yield. The ethanol yield was expressed according to Sofokleous et al. [34]. SSF at lab scale was conducted in 250 mL Erlenmeyer flasks at 35 °C in an Unitronic-Orbital, PSelecta water bath and 10% solid loading in a batch mode, based on preliminary experiments [35]. In Table 1, the controlling parameters of the factorial experiment along with its levels are given.
In this experimental design (23 factorial experiment), eight experiments were performed in triplicate. Five additional experiments in the centre of the design were performed for statistical reasons as well.

2.3.2. Bench-Scale

The first scale-up step was conducted from a lab scale reactor to a bioreactor of 4 L working volume. The optimum conditions for achieving the maximum ethanol yield from the lab scale factorial experiment were applied in this reactor. Apart from scaling up, the effect of solid loading was also evaluated, since high solid loading could increase the ethanol concentration, reducing the distillation cost and rendering bioethanol recovery easier. Consequently, elevated solid loadings could save capital and operational costs. Yet, there exists mass and heat transfer restraints and enzyme inhibition in viscous media. Thus, the application of elevated solid loadings could have a negative impact on ethanol production [36]. In this context, solid loading was set as an optimisation parameter. Different solid loadings were applied from 10% to 30% with a step of 5%. Bench scale experimentation was performed in a 4 L reactor with double walls for the control of temperature at 35 °C, which was also mechanically stirred at around 850 rpm.

2.3.3. Pilot-Scale

The experiments in the pilot scale were performed in a bioconversion pilot plant within the premises of UEST, which consists of two agitated horizontally rotating vessels (200 L each) made of stainless steel (Figure 2). These reactors may work independently under different operating conditions. Their temperature is controlled by water recirculation within their double walls. A distillation pilot unit is used to recover the produced ethanol at 70 °C with the aid of a low vacuum. The pilot plant operation is controlled via a Programmable Logic Controller.
A total of 14 pilot trials were performed under the optimum condition that had been derived from bench scale experiments in order to evaluate not only the efficiency, but also the repeatability of the process. During the saccharification and fermentation processes, with a view to better monitor the process, samples were collected at an hourly basis and were characterized in terms of ethanol and glucose. Ethanol yield (g/100 g theoretical ethanol) was set as the optimization parameter for the bioprocess. After 24 h of fermentation, distillation took place under a vacuum. The collected condensate was further processed for additional dehydration, while the stillage was fully characterised.

3. Results

3.1. Raw Material

In total, around 3 tonnes of source-separated food waste were collected in 23 different batches from the Vari-Voula-Vouliagmeni municipality. In Table 2, the physicochemical characteristics of all the different batches collected during this study are presented.
According to Table 2, the mean initial moisture of the feedstock was around 75.9 ± 2.2% (% w/w wet basis). The mean characteristics of the dried raw material were as follows (% w/w dry basis): ash 9.5 ± 2.5, starch 7.7 ± 3.4, cellulose 14.6 ± 3.6, hemicellulose 9.4 ± 4.9, fats and oils 11.2 ± 2.7, acid soluble lignin 1.8 ± 1.9, acid insoluble residue 12.5 ± 5.0, water soluble solids 33.0 ± 4.9, and free glucose 1.6 ± 1.1.
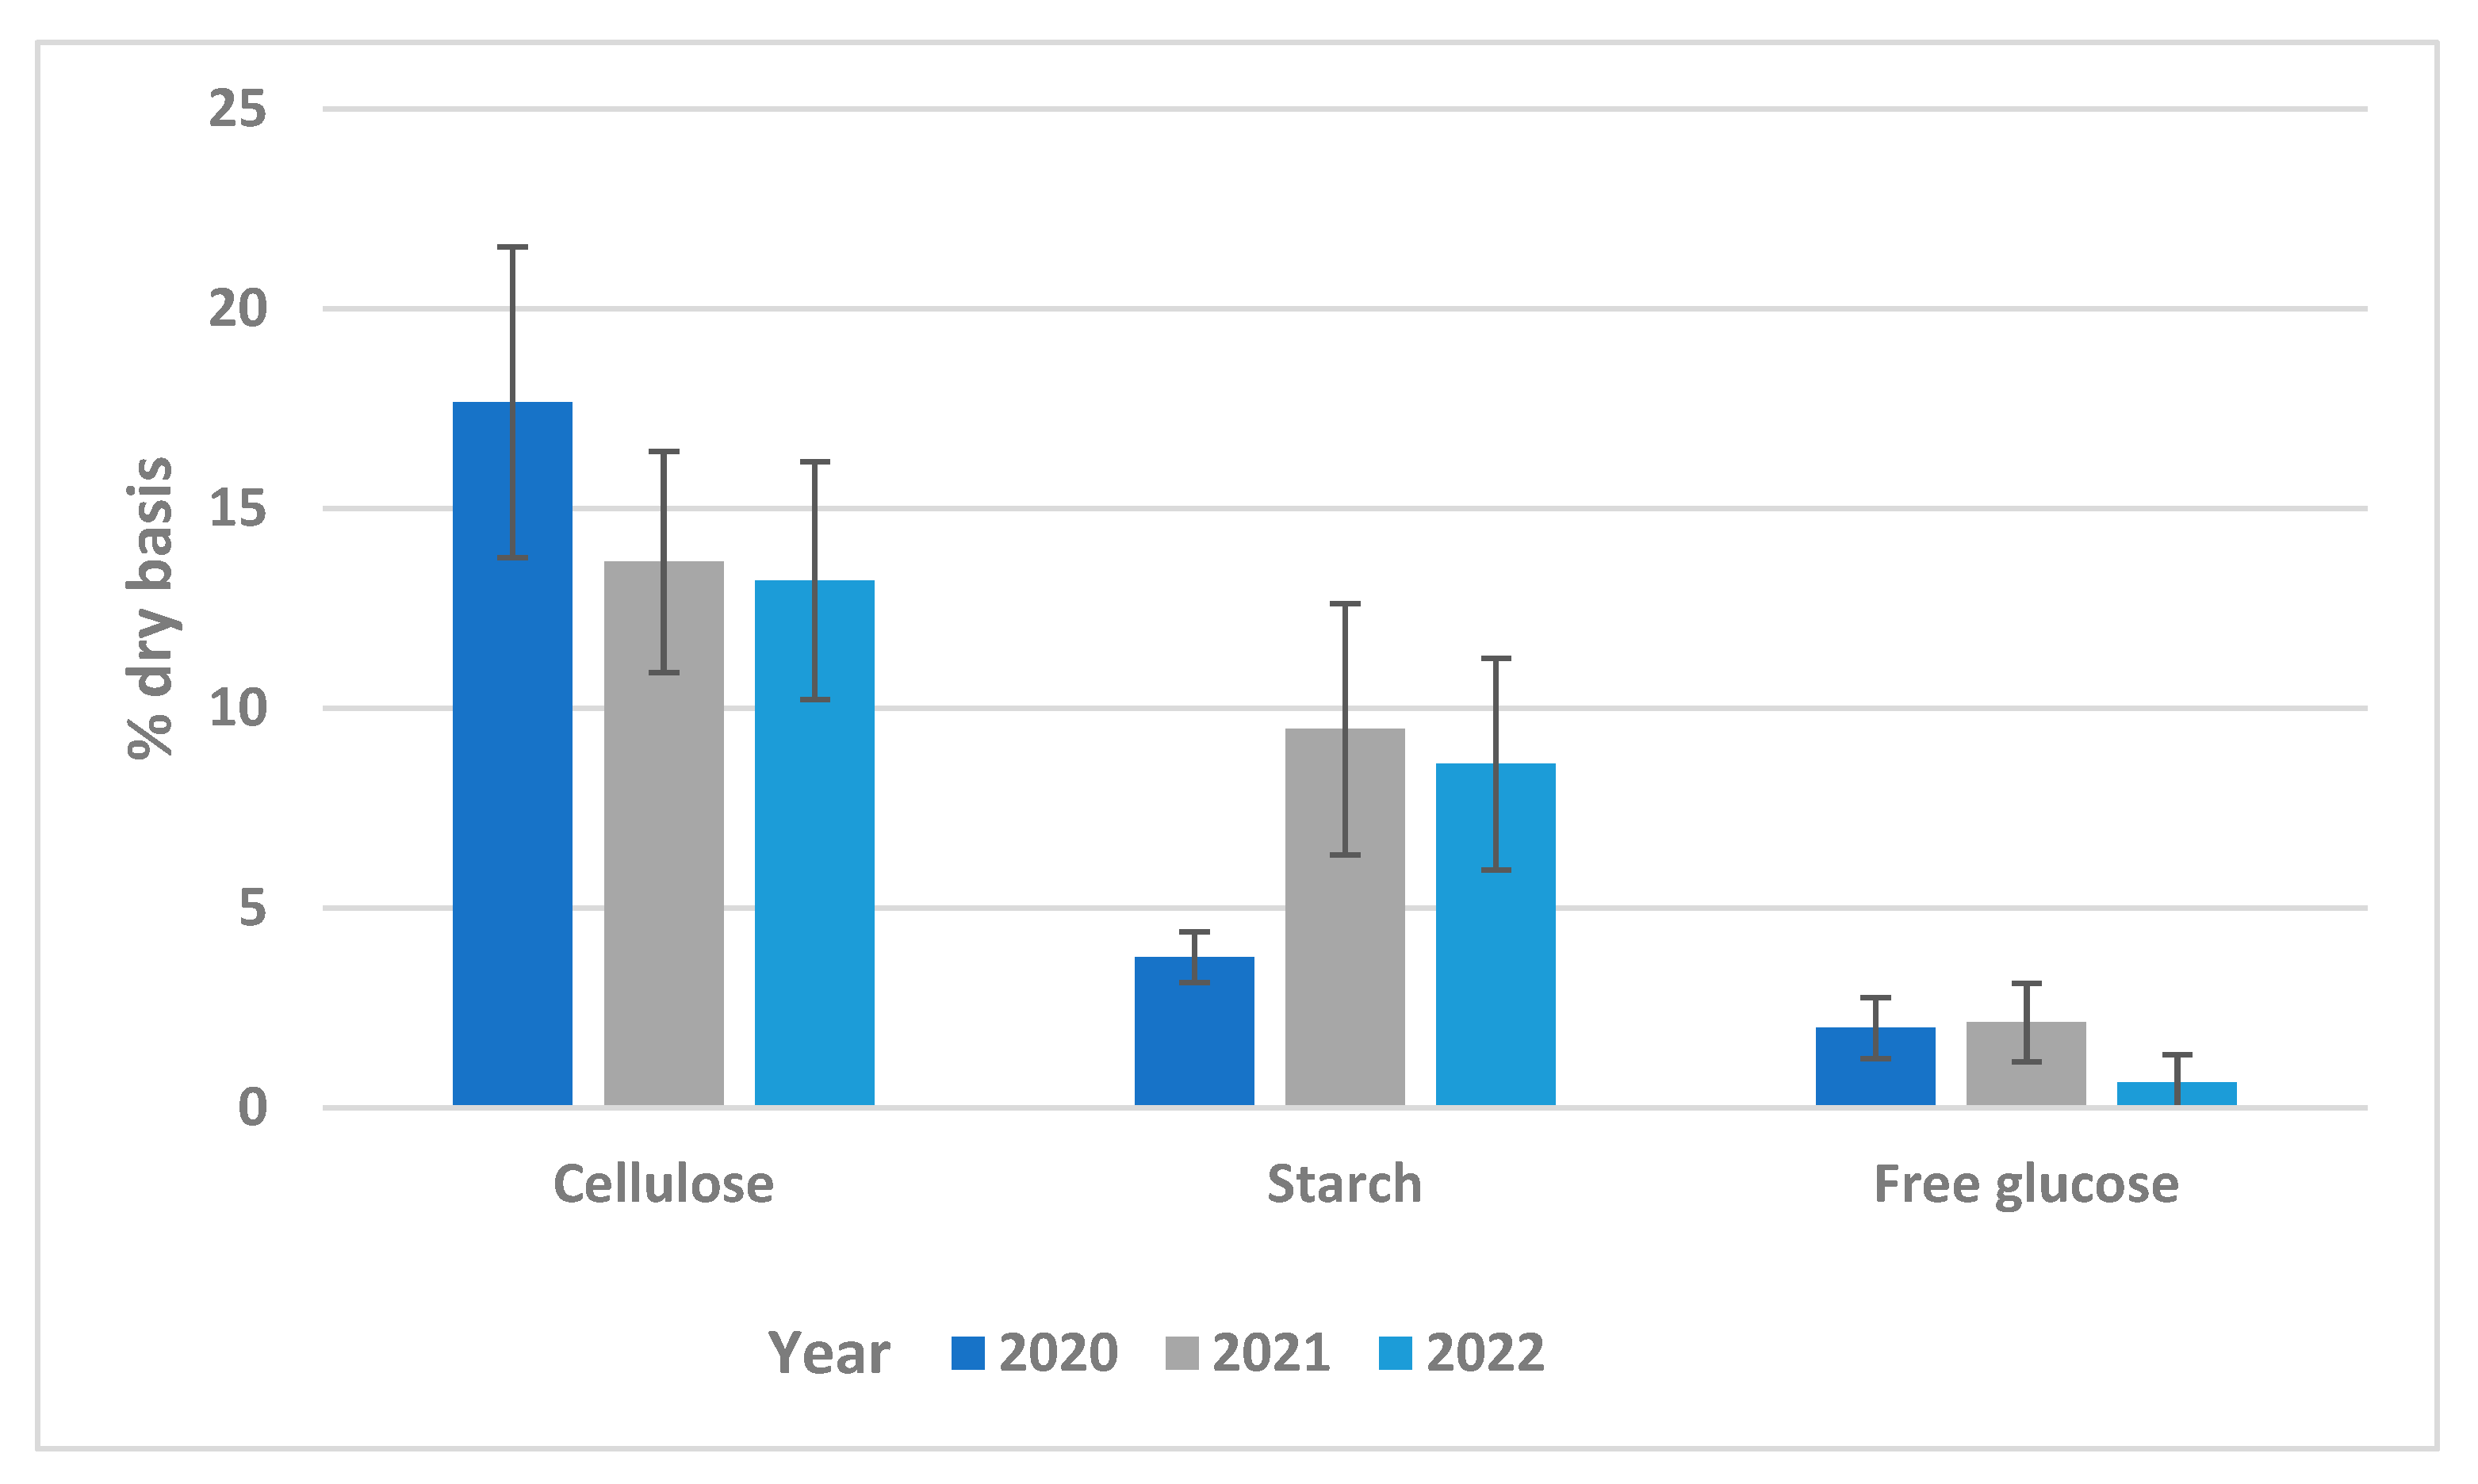
In view of bioethanol production from the source-separated biowaste, the components of high interest are cellulose starch and free glucose. In Figure 3, the annual mean content of these components is presented. From this figure, a gradual and intense decrease in cellulose content per year can be observed. Starch content presented a notable increase in 2021 but decreased after that, while free glucose remained at low levels. These changes may be attributed to the COVID-19 pandemic and the respective restrictions that had a strong impact on the eating habits of people.
In an effort to determine whether the differences in the structural components contents of source-separated food waste from year to year presented in Figure 3 were statistically important, a statistical analysis was carried out via GNU PSPP version 1.6.2 software. Τhe hypotheses tested were:
H0: 
Successive year (2020 to 2021, 2021 to 2022) does not affect the composition in terms of free glucose, cellulose, and starch of source-separated food waste.
H1: 
Successive year does affect the composition of source-separated food waste.
This hypothesis was tested using a two-sample t-test with equal variance to ascertain whether the different years influenced the food waste composition. This was judged by testing if the mean difference between solid waste parameters was statistically significant at a 95% confidence interval. The statistical analysis in Table 3 shows in which cases the null hypothesis, H0, can be accepted against the H1.
From Table 3, it can be assumed that cellulose and starch contents presented unsignificant variation between 2020–2022, whereas the variation of free glucose was notable in the case of 2021 to 2022. Free glucose is the component that is consumed first after biowaste collection. Thus, this statistically significant variation may be attributed to changes in the storing of biowaste from the citizens and its collection from the cleaning services of the municipality.
The impact of seasonality on the structural components of interest (i.e., cellulose, starch, and free glucose) of source-separated biowaste in the municipality of Vari-Voula-Vouliagmeni is presented in Figure 4.
In general, the seasonality does not seem to affect the composition of the source-separated biowaste in any specific way. Perhaps the higher cellulose content of biowaste during autumn and winter could be attributed to the consumption of legumes, nuts, peas, cabbage, and apple skins during that period in Greece. In order to assess in a more decisive way the impact of seasonality, statistical analysis was also performed. The hypotheses tested were:
H2: 
Successive seasonality (Winter to Spring, Spring to Summer, Summer to Autumn, Autumn to Winter) does not affect the composition in terms of free glucose, cellulose, and starch of source-separated food waste.
H3: 
Successive seasonality does affect the composition of source-separated food waste.
This hypothesis was tested as above by checking whether there are differences between their mean values at a 95% confidence interval for which the threshold probability for significance is p < 0.05. The statistical analysis in Table 4 shows in which cases the null hypothesis, H2, can be accepted against the H3.
Throughout the samplings performed, the seasonality seems to affect just free glucose content. This could be possibly due to the respective seasonality of fruits and vegetables largely consumed in Greece. During Summer, the concentration of free glucose is the lowest and this fact can be attributed to the high temperature observed during the summer period in Greece (18–33 °C) (https://www.worlddata.info/europe/greece/climate.php, accessed on 3 July 2022) that favours and accelerates the bioconversion of glucose. In conclusion, source-separated food waste presents fluctuations in annual and seasonal basis that, however, are not statistically important.
Similarly, Hansen et al. [37], who analyzed 40 samples of source-separated municipal solid waste gathered from five Danish cities during a whole year, did not observe any statistical important variations in structural components (protein, fiber, starch, sugars) apart from ash. Additionally, Thakali et al. [38] reported that there were limited differences in the chemical components among the different seasons in source-separated biowaste in Sweden, Norway, and Finland.

3.2. Lab-Scale

The results of the factorial experiment in terms of ethanol, remaining glucose, and TOC concentrations are presented in the following table (Table 5). The respective total solids degradation efficiencies and ethanol yields are also presented in this table (Table 5).
From this table (Table 5), it is obvious that the mean ethanol yield was equal to 80.3 ± 4.9%. Similar ethanol concentrations were achieved in all trials and the released sugars were successfully fermented to bioethanol since the remaining glucose contributes to total carbon by just 0.5 ± 0.2%, while ethanol by 32.0 ± 1.5%. Furthermore, almost 50% of the solid feedstock was hydrolysed for all cases.
Based on the results of the factorial design and according to literature [39,40] regarding the mathematical simulation of the process, it was proven that none of the controlling parameters or their interrelations were statistically important. This implies that the range selected was the optimum, given the absolute values of ethanol yield. Thus, the model that derived was Y = b0 = 80.0. Therefore, the center of the experimental design (Spirizyme 40 μL/g starch, NS87014 175 μL/g cellulose and 2% w/w S. cerevisiae) could be considered the optimum conditions for achieving the maximum ethanol yield. Hence, these conditions were applied in the first scale-up step in the 4 L bioreactor.
In line with the results of the present study, Passadis et al. [35] reported that SSF fermentation of source-separated household biowaste with 10% solid loading, 175 μL NS22177/g cellulose, 40 μL NS22109/g starch, and 2% w/w S. cerevisiae for 18 h at 35 °C presented an 80% ethanol yield and a final ethanol concentration equal to 13.3 ± 1.0g/L.
Moreover, Wang et al. [41] also observed similar ethanol yields (around 77%) after the application of SSF on kitchen waste with 11.5% solid loading. Koike et al. [22] also reported ethanol yields that ranged from 76 to 84% when applying SSF to canteen waste with 10% solids loading.

3.3. Bench-Scale

The results of the bench scale experiments are presented in Table 6.
It is obvious that the increase in solid loading up to 25% resulted in high ethanol yields over 80% in all cases and increasing ethanol concentrations, as expected. Further loading increase from 25 to 30% led to a sharp decrease in ethanol yield from 84.6% to 52.7%, implying that the high solids concentration inhibits the progress of the saccharification and fermentation processes. Similar ethanol yields (84.3%) were achieved when source-separated biowaste were subjected first to liquefaction (with a-amylase) and then to SSF with flocculating yeast S. cerevisiae KF-7 [22]. Similarly, aiming to further boost ethanol concentration over the 4% threshold, a fed batch mode with 25% solids loading was carried out by Edeh [42]. Although a final ethanol concentration of 30 g/L was achieved, the ethanol yield was lower (60%) in comparison to the present study. Lower ethanol yields (48–50%) were also observed by Alamanou et al. [43] who applied SSF on household food waste with 20% solids loading. The effect of solid loading on ethanol yield was also studied by Passadis et al. [35] at the range of 10 to 20% and reported that ethanol yields during SSF were slightly decreased from 80% to 78%.
Furthermore, the upscaling of the process at 10% solid loading by a factor of 25 provided similar ethanol and residual glucose concentrations, given that the positive impact of upscaling on the ethanol yield was just 2%. Thus, the transition from lab to bench scale is satisfactory since the productivity and end-product’s quantity remain comparable. Aruwajoyeet al. [44] also reported a positive effect on the upscaling SSF process of cassava peels from 1 L to 10 L, considering that this fact is related to the changes that occur in the hydrostatic pressure of the fermentation and in the shear stress.
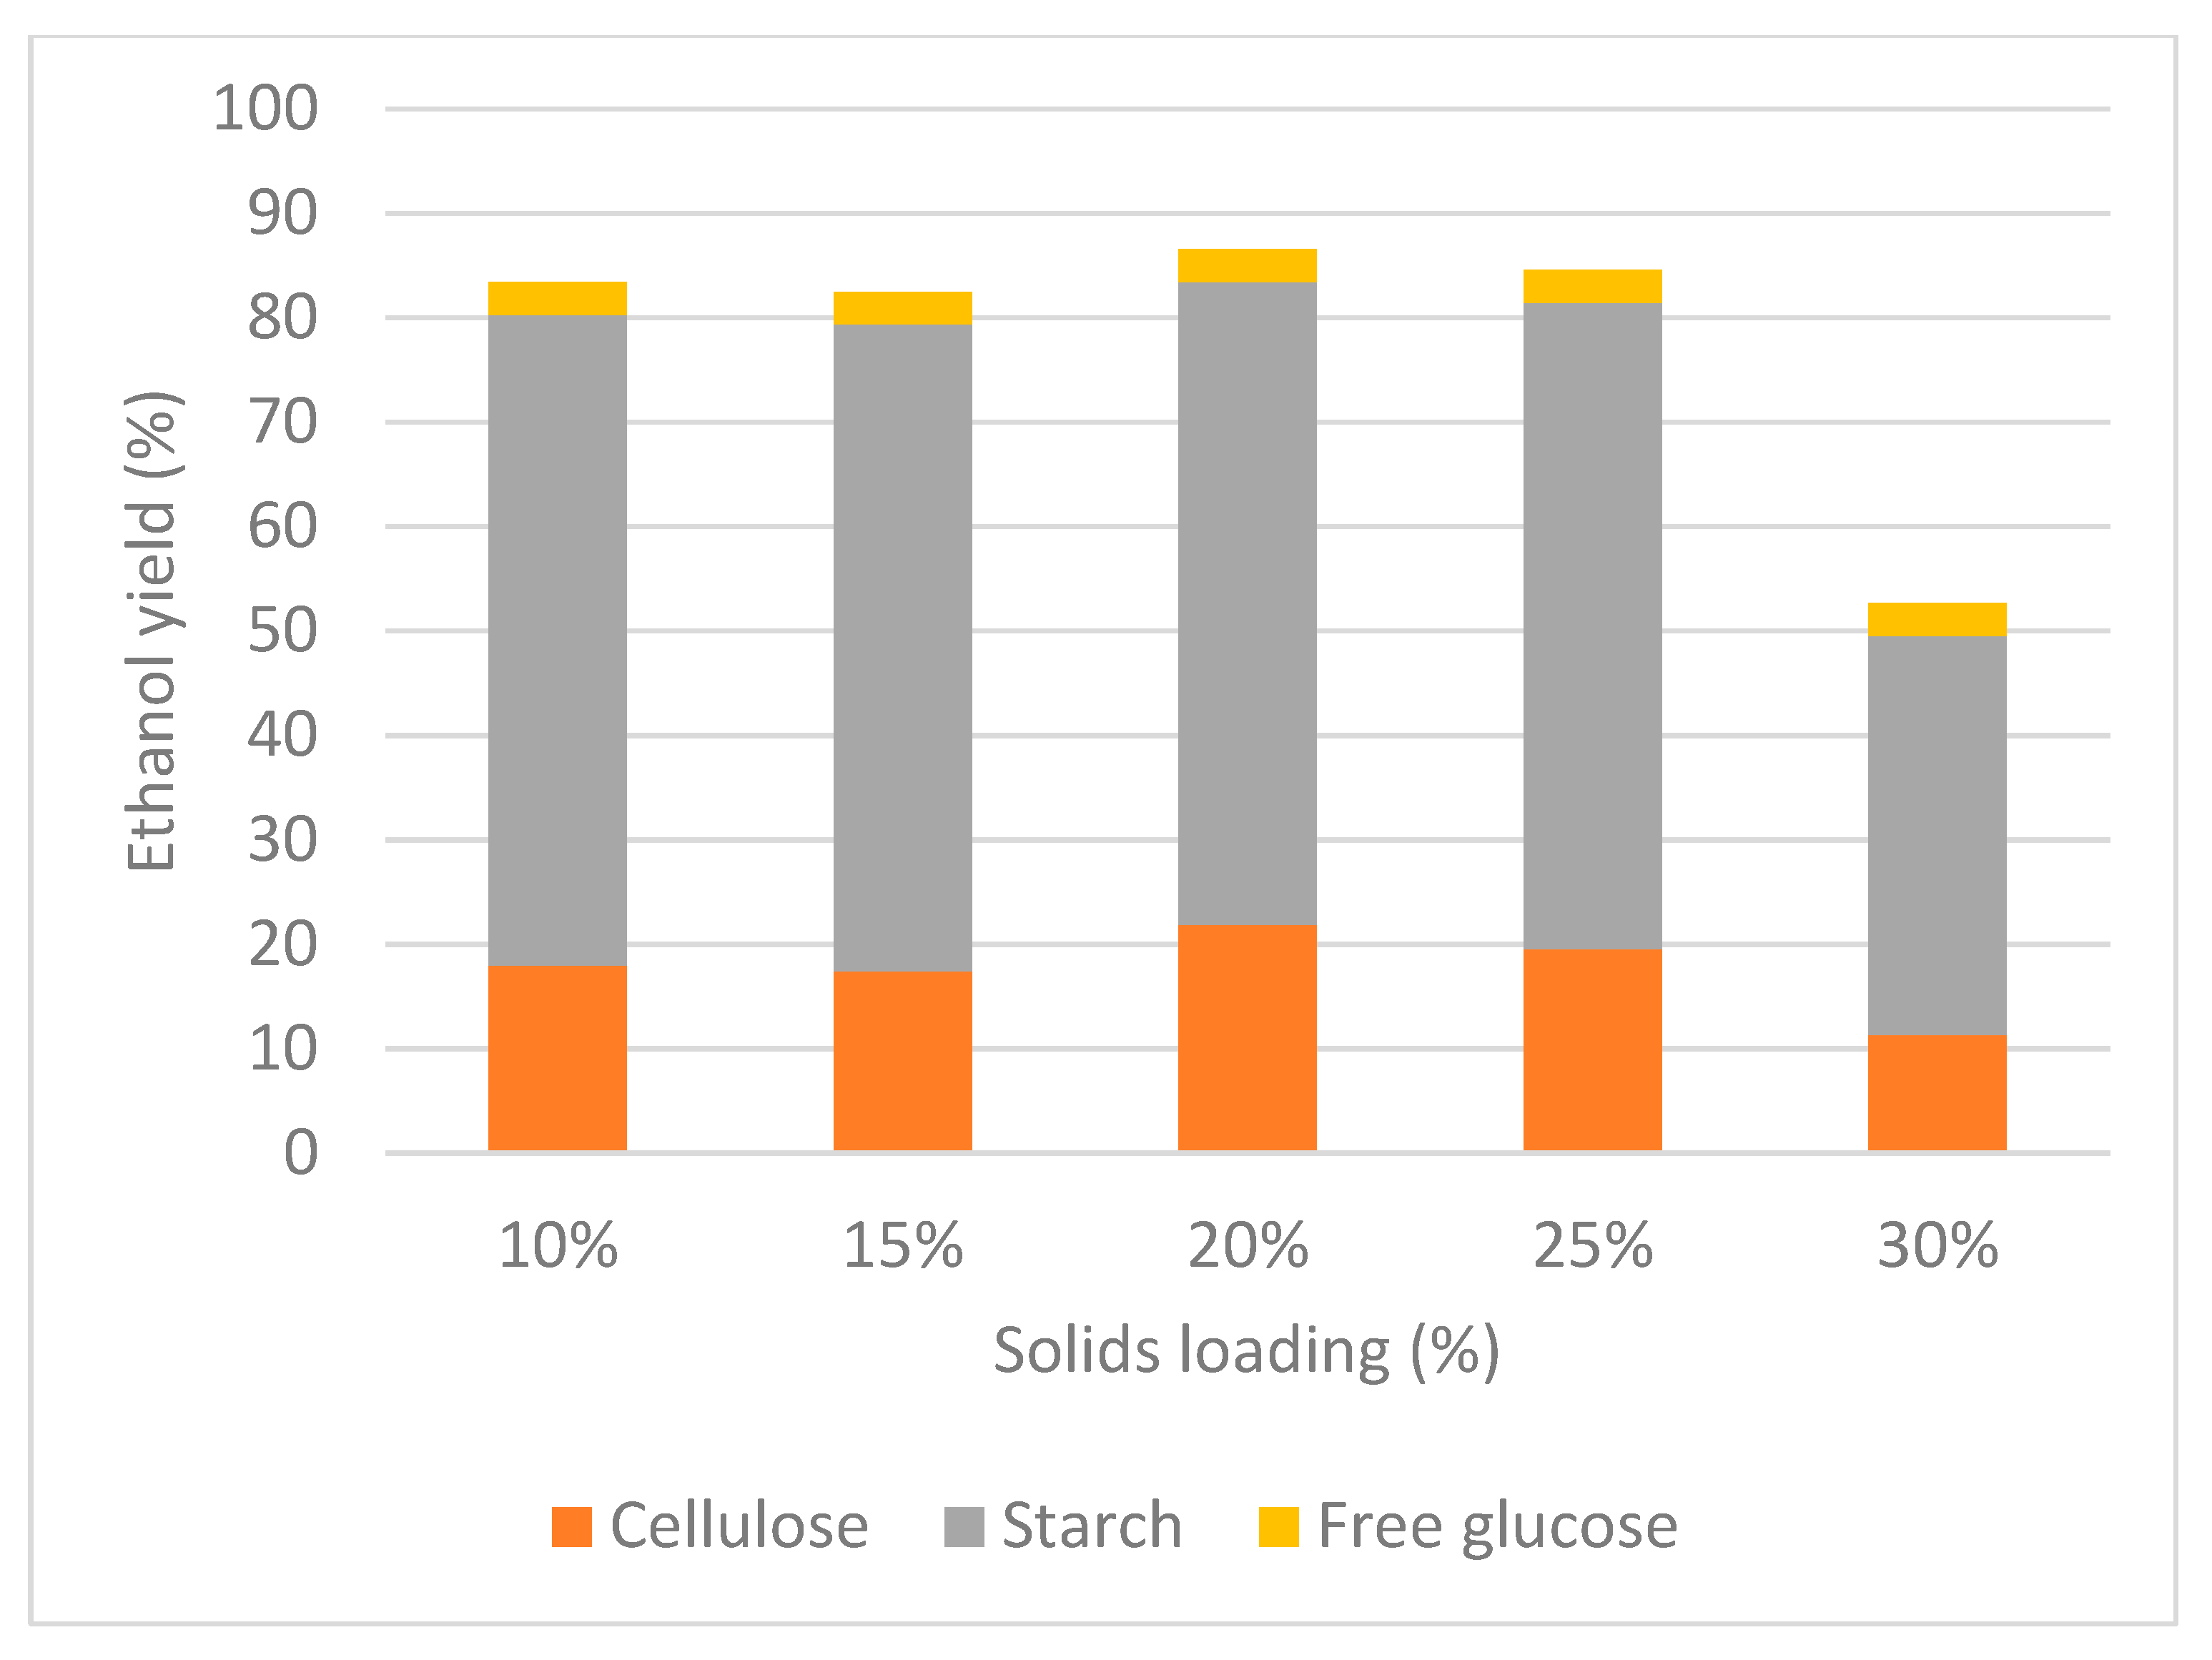
The total ethanol yield was fractionated in accordance with its origin, based on the achieved degradation of cellulose and starch and the consumption of free glucose (Figure 5). It is evident that the proportion of ethanol yield attributed to starch hydrolysis is nearly the same for all cases examined, given that in all cases starch degradation amounted to almost 97%. This also applies for free glucose. Higher but not notable fluctuations were observed for cellulose.
Salimi et al. [45] also reported high starch degradation (reaching up to 95%), whereas cellulose degradation was much lower from 33% to 50% for increasing cellulase dosages. Similarly, Cox et al. [46] reported a 91.7% starch degradation when Spririzyme was used for enzymatic hydrolysis of bread waste.
Given the similar ethanol yields achieved between trials 1 to 4, the increasing ethanol concentrations, and the economies of scale, it was decided that the pilot trials for the dried feedstock would be conducted under SSF fermentation mode, 25% solids loading, Spirizyme 40 μL/g starch, NS87014 175 μL/g cellulose, and 2% w/w S. cerevisiae.

3.4. Pilot Plant

3.4.1. Bioconversion Process

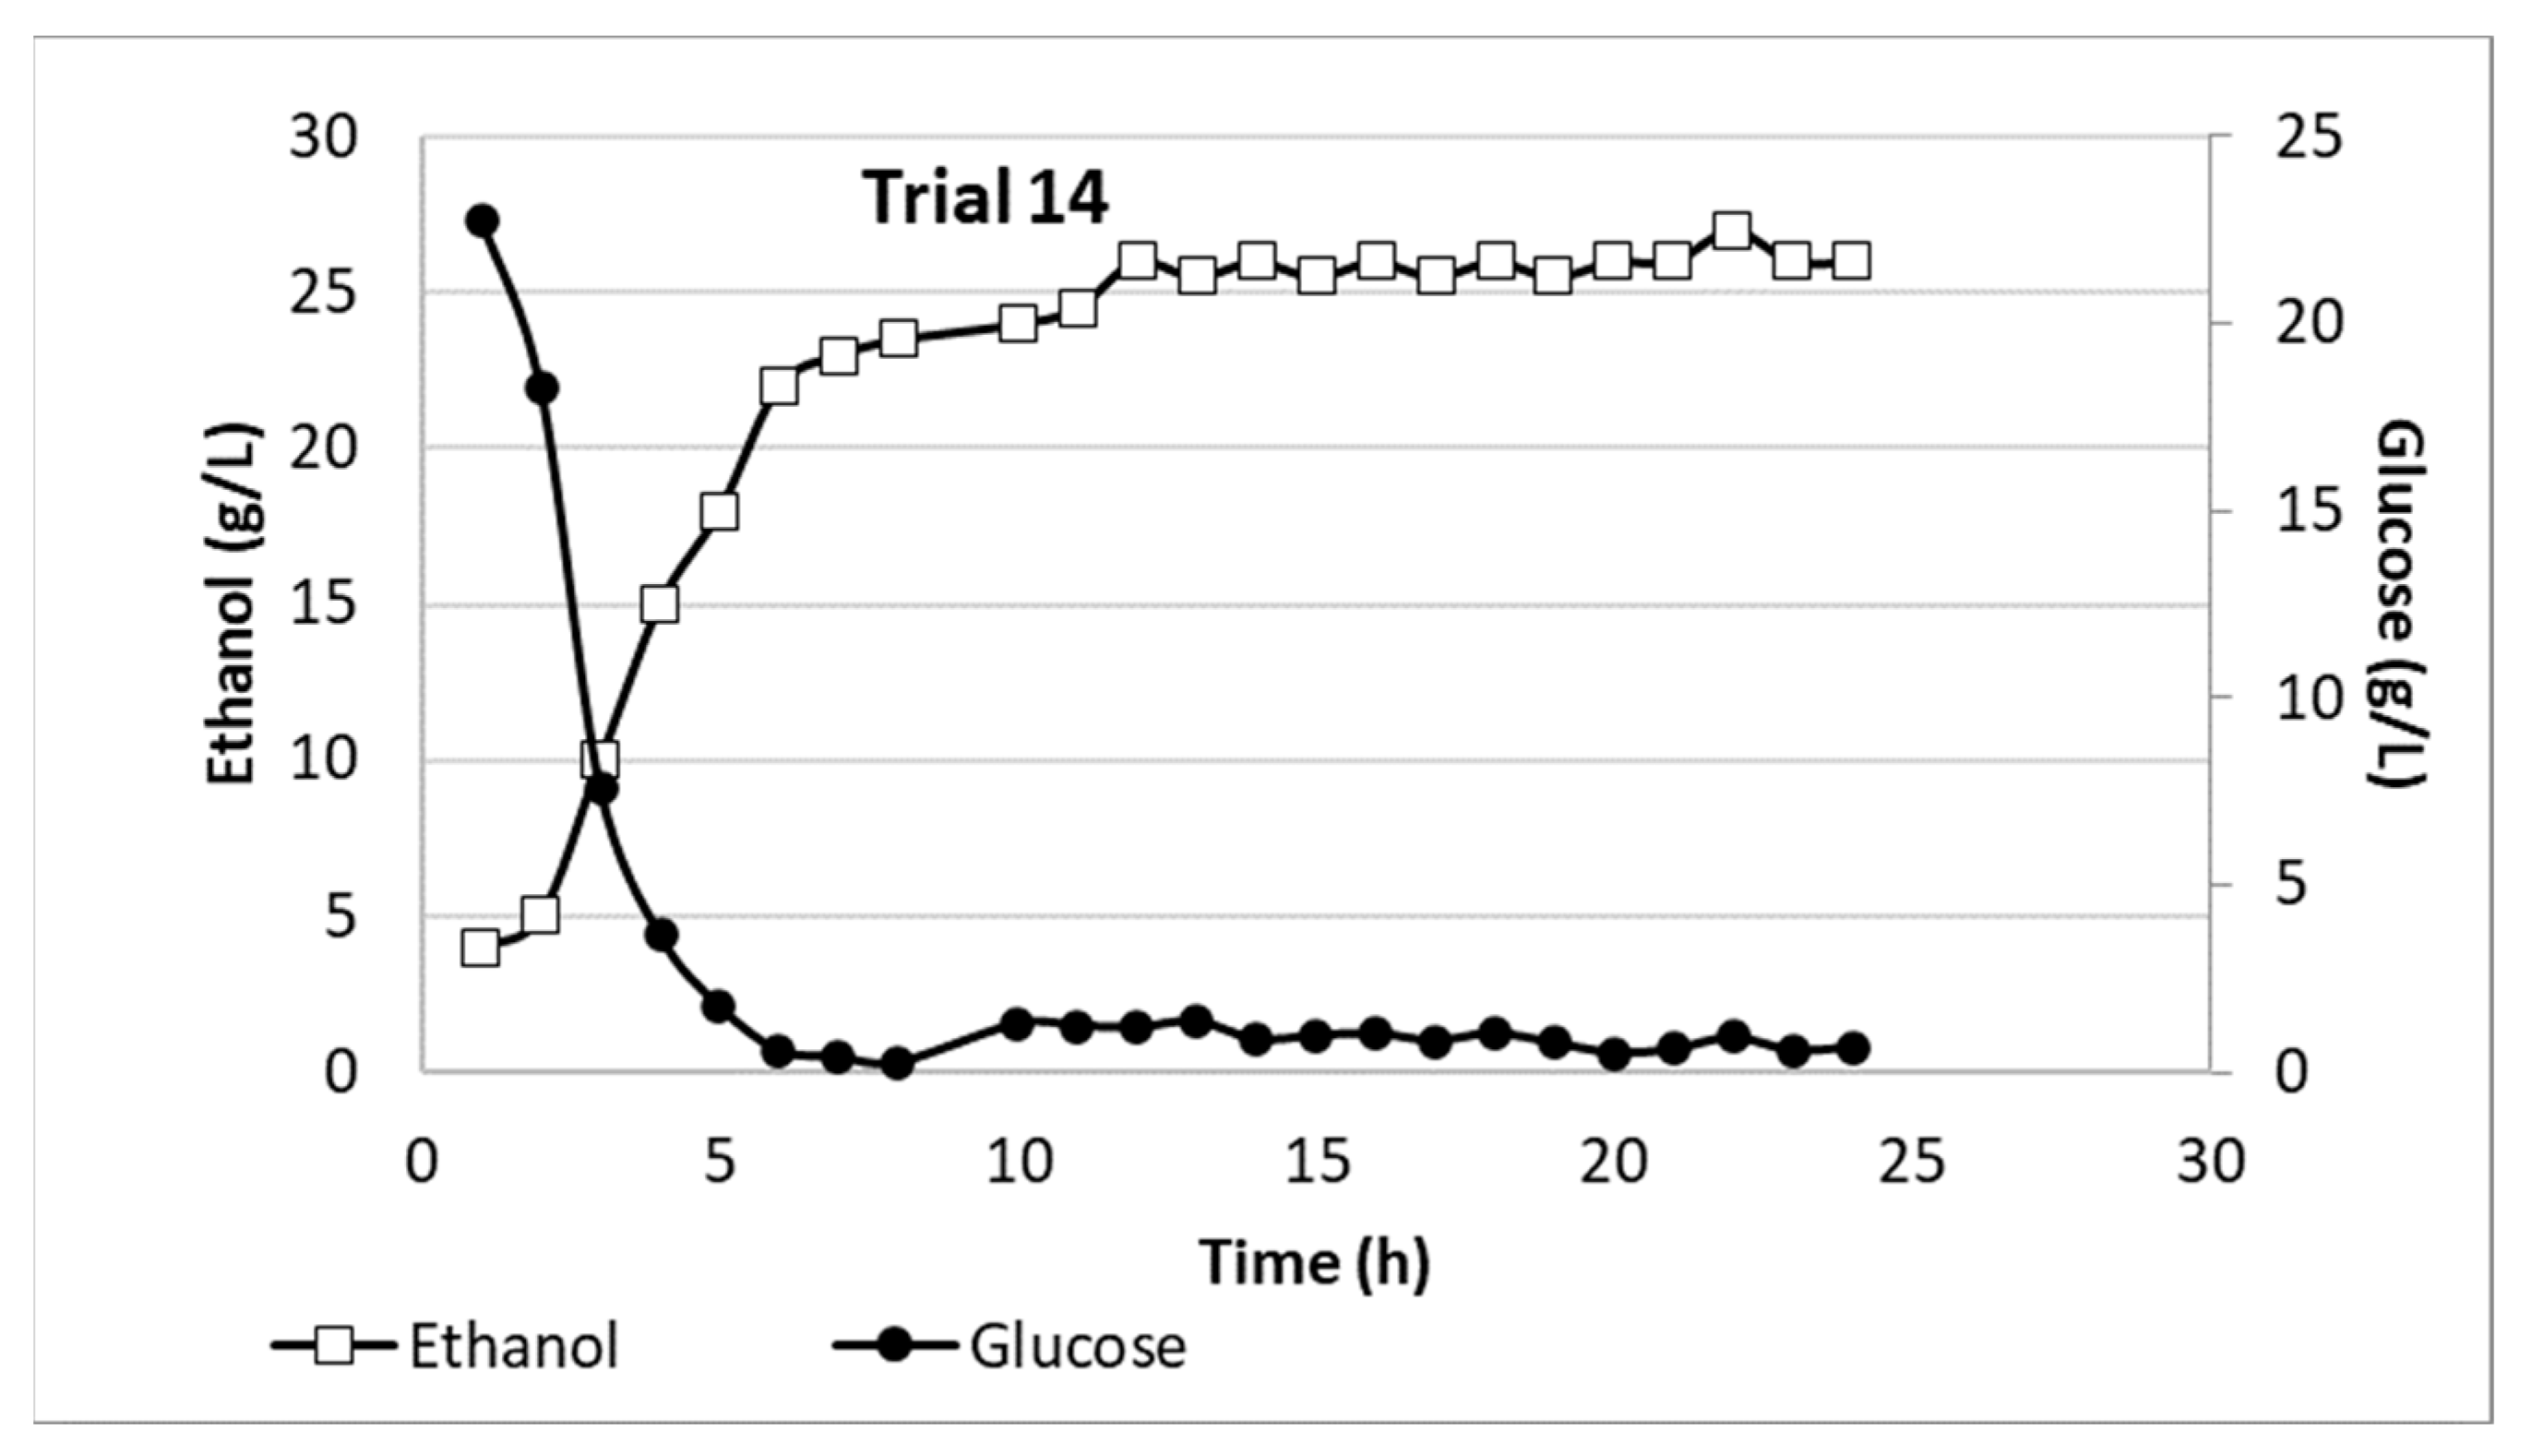
Figure 6 presents a typical diagram of the time evolution of ethanol and glucose concentrations of the pilot trials performed.
The maximum ethanol concentration for most trials was achieved after 8–12 h of fermentation (Figure 6) while after that, ethanol concentration remained nearly stable. The maximum ethanol concentration produced by food waste (37.8 ± 8.2 g/L) presents satisfactory values in comparison with the results of Kiran et al. [47], Konti et al. [48], Alamanou et al. [43], Matsakas et al. [49], and Kim et al. [27] that observed bioethanol concentrations as high as 58 g/L, 53.9 g/L, 23.12 g/L, 42.78 g/L, and 57.5 g/L, respectively. Of course, the final ethanol concentration is closely related to the feedstock characteristics and the solid loading.
Taking into consideration the characteristics of the feedstock used and the derived stillage, the degradation efficiencies of the main components of the feedstock were calculated and are presented in Table 7.
A statistical evaluation for the determination of the boundaries for outliers for the data of Table 7 was performed via the Grubbs test. The outliers detected (cellulose degradation in trial 2 and starch degradation in trial 8) were excluded from the mean values estimation. The mean degradation of starch was 94.6 ± 2.4% whereas the respective percentage of cellulose was 76.8 ± 5.2%, significantly higher than other researches [45,50].
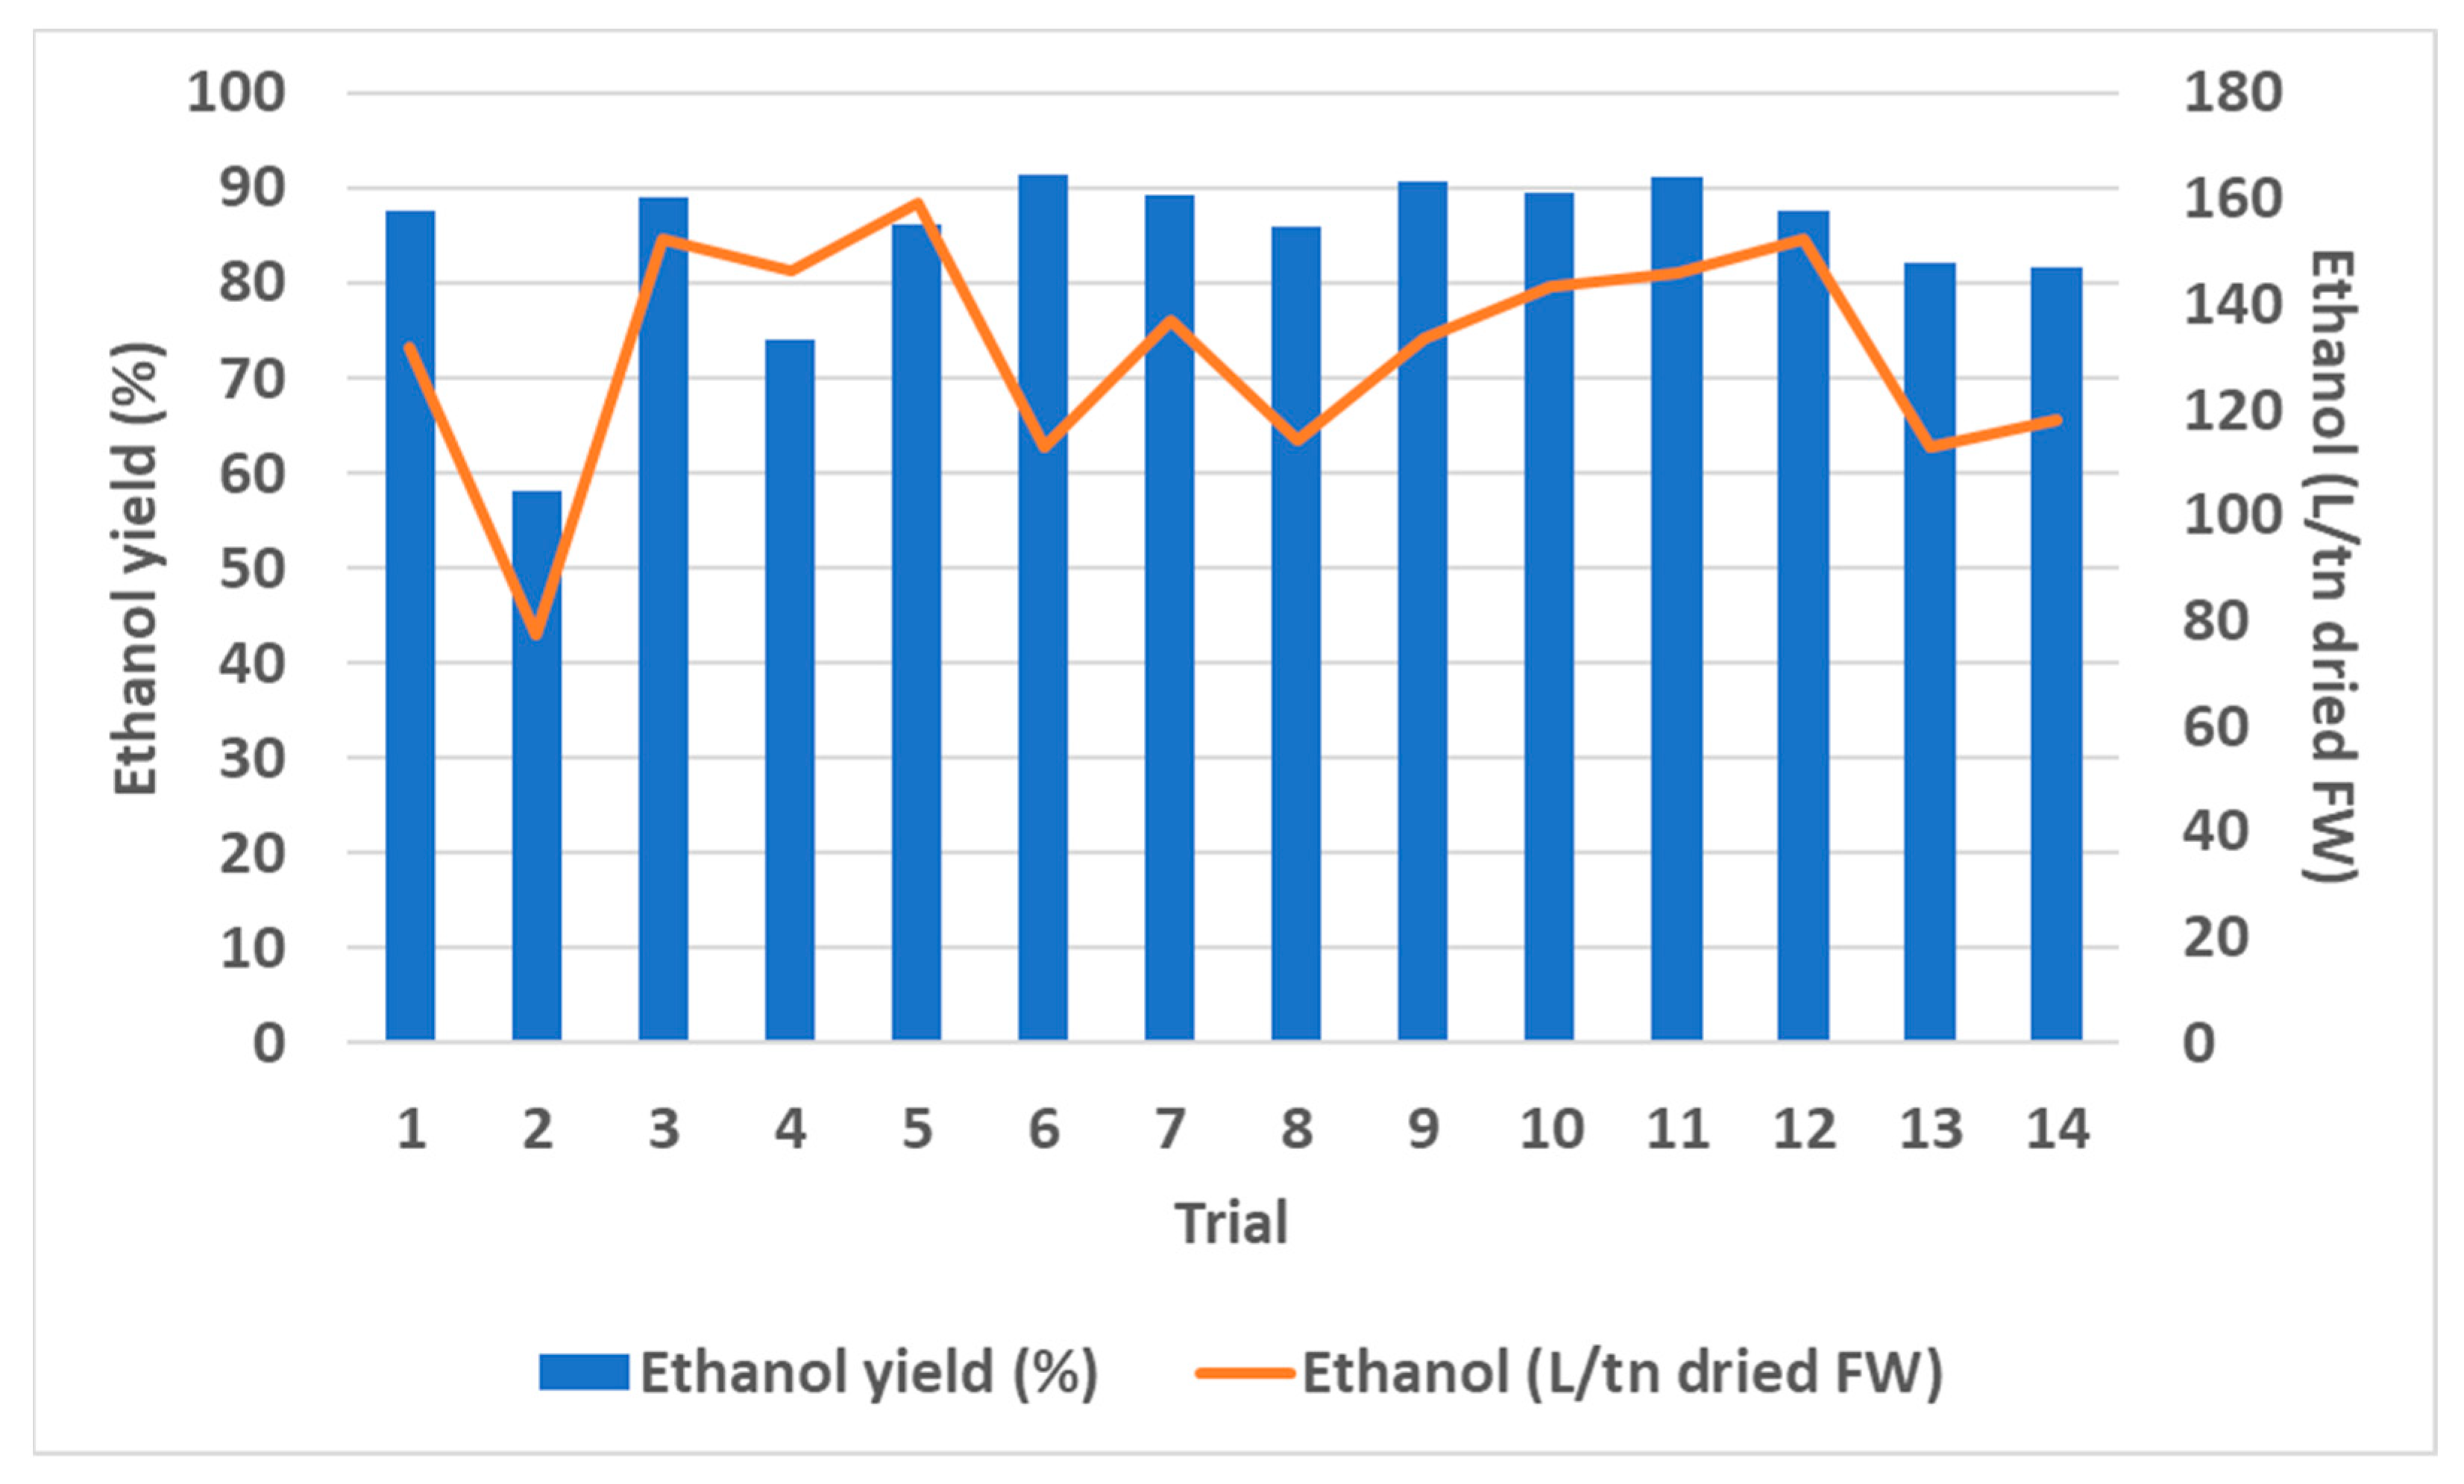
Figure 7 presents the ethanol yields for all trials performed, along with the ethanol produced per tn of dried feedstock.
The results were very successful and repeatable, and the mean ethanol yield was 86.6 ± 4.9% excluding outliers. It is noteworthy that ethanol yield results were verified by the polysaccharides’ degradation. The impact from further upscaling from bench to pilot scale by a factor of 25 was proved as minimal since the achieved efficiencies in terms of ethanol yield were within the same confidence interval.

3.4.2. Ethanol Recovery

At the end of the 24 h bioconversion period, the fermentation broth contained about 4.4 ± 0.8% v/v (34.8 ± 6.3 g/L) bioethanol. The latter can be considered low compared to first generation bioethanol, which can reach up to 12% v/v (95 g/L). Next, the fermentation mixture was distilled at 70 °C, with the aid of a spiral column and a vacuum pump. In 3 h, a distillate of 8.1 ± 0.8 L in volume with an ethanol content of 27.4 ± 1.8 % v/v (216.8 ± 14.2 g/L) was recovered.
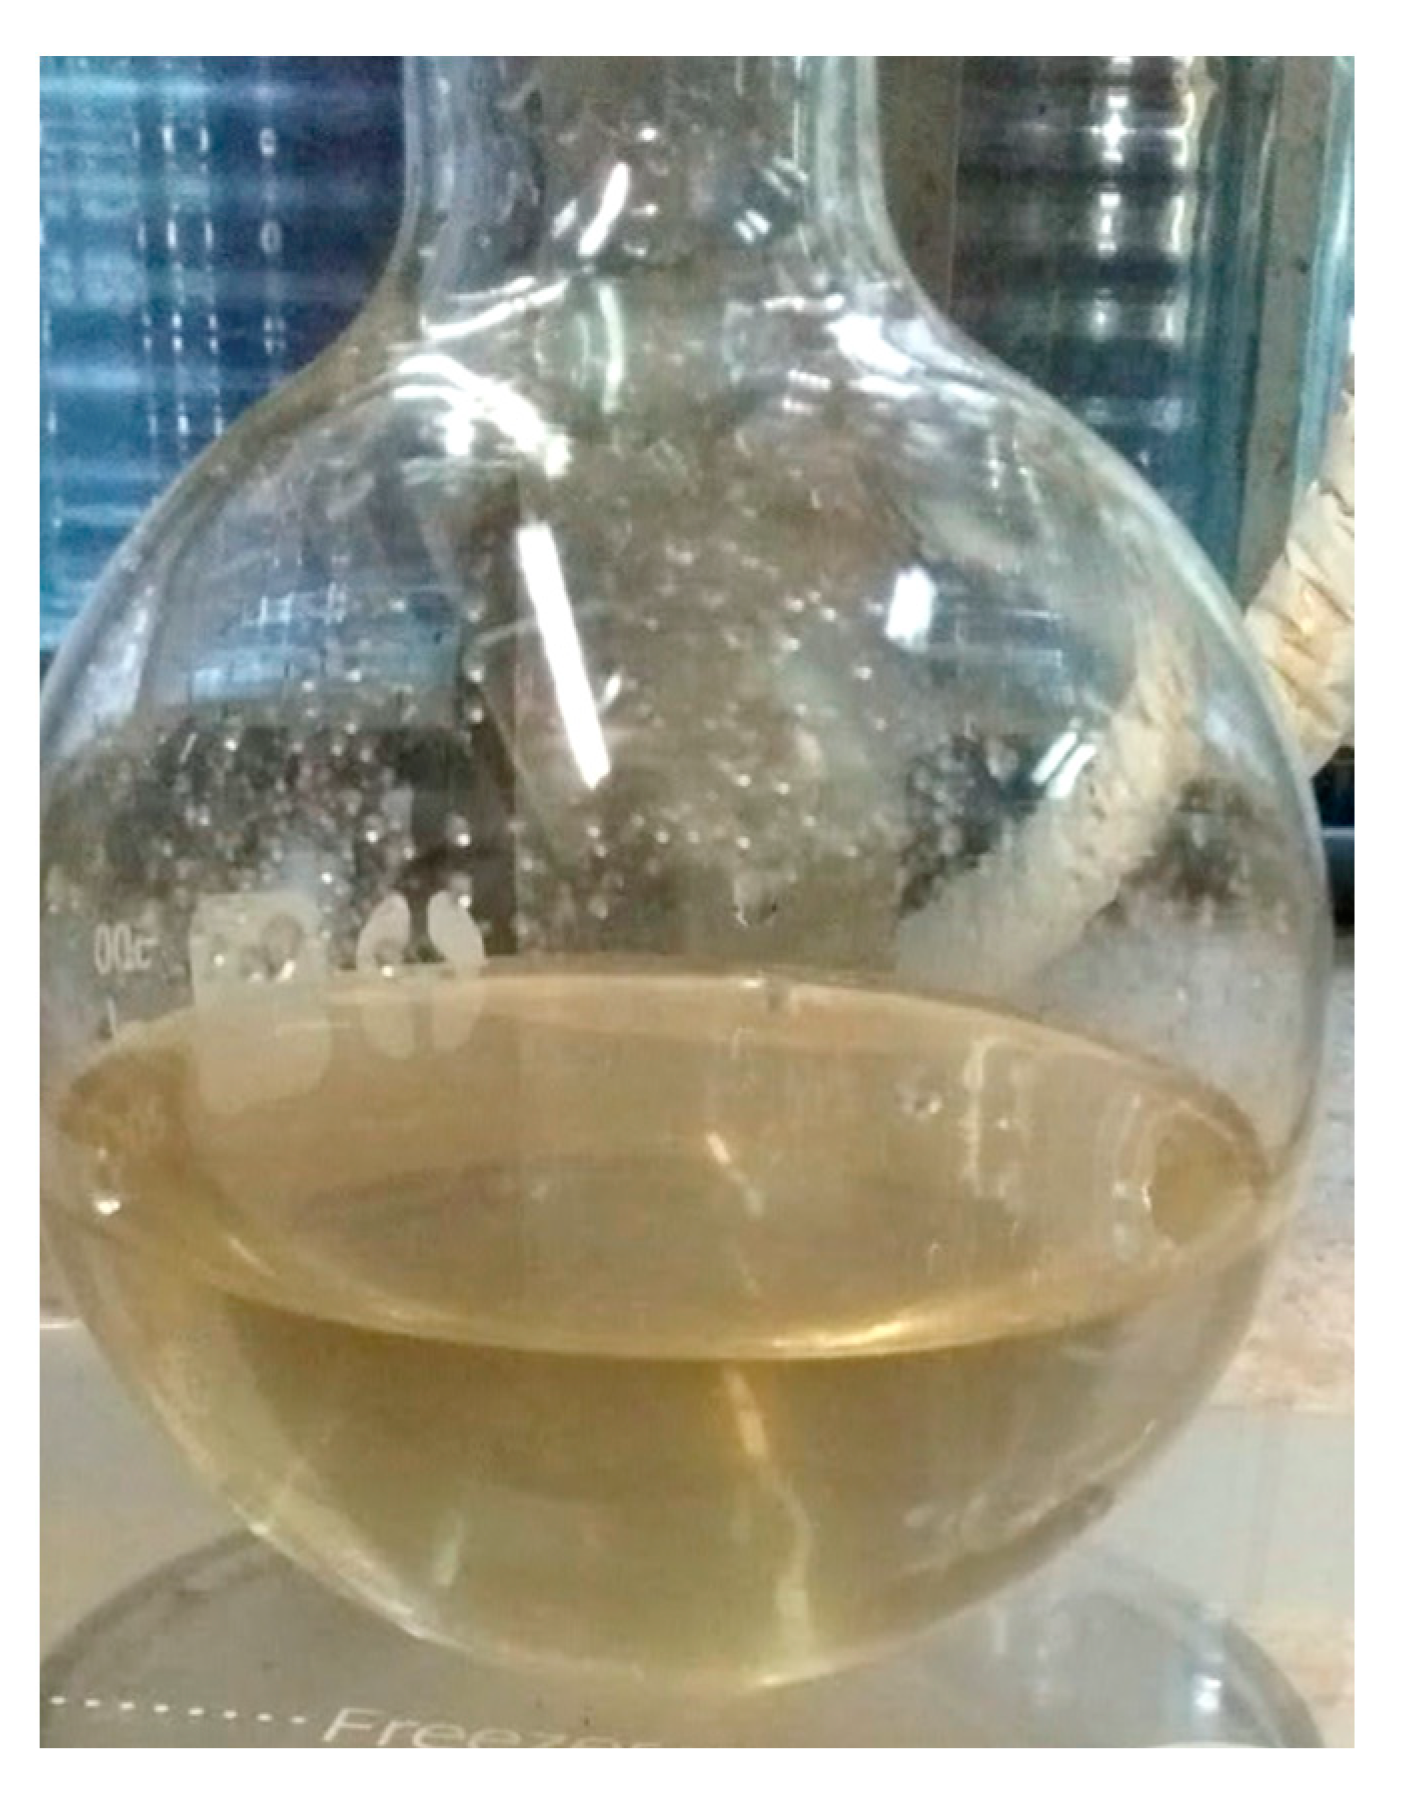
In each trial, the first two distillates collected in 15 min and 30 min were a little cloudy and yellowish in appearance (Figure 8). This fact could be due to the distillation of volatile components such as acetone, methanol, and various esters that present a lower boiling point than ethanol and to the hardness of process water.
The average distillation flow rate was equal to 42.8 ± 1.4 mL/min, while it is estimated that within the distillation time (180 min) 61.6 ± 5.6 % of ethanol produced was recovered.
Further purification of bioethanol was conducted in a lab-scale unit with two fractional columns (Vigreux columns) and a vacuum pump. In this case, the purity of the produced bio-solvent reached up to 94–95% v/v. This threshold cannot be exceeded due to the formation of a minimal azeotrope boiling at 78.15 °C and 1 atm. To use bioethanol’s full potential, it should be obtained as anhydrous bioethanol (>99.5% v/v). Thus, a zeolite 3A was used for the dehydration of produced bioethanol achieving 99.6% v/v (788.1 g/L) purity. The mean physicochemical characteristics of the recovered bioethanol are presented in Table 8.
In view of positioning bioethanol in the market, various applications are reported depending on its quality. To be more specific, there are four types of renewable ethanol based on the alcoholic strength. The denatured ethanol has the lowest alcoholic strength, 88–90% v/v, and can be used in a diverse applications except those including human consumption. Its most common applications are for chemicals in pesticides and home cleaning products. The next two categories are similar in use, the industrial and pure ethanol, with 96% v/v strength. Industrial ethanol is mainly used as a chemical and solvent, whereas pure ethanol is suitable for the pharmaceutical, food and beverage industries. Absolute ethanol with an alcohol strength of over 99.7%, is considered an alternative energy source due to its energy content and purity.
According to the data presented in Table 8, the ethanol produced within this study, meets the limits set for industrial uses and can be used in such applications as a solvent. More precisely, because of its structure, polar compounds such as water and non-polar such as hexane can be dissolved. It is worth noting, that the results are superior to the requirements for industrial uses and thus the dehydration step is not necessary. The same applies for denaturated ethanol.
Additionally, all characteristics are within the range, defined by the EEC Reg. 110/2008 and European Pharmacopoeia, for applications as pure ethanol. Just the total higher alcohol content (0.45 g/hL p.A.) is near but within the limit (0.5 g/hL p.A.). The main purpose of pure ethanol is to be used in the pharmaceutical industry and for the production of personal care products. As mentioned before, for this kind of application the dehydration process is not necessary as 95–96 % v/v purity can be achieved from distillation only. Finally, the results showed that the produced bioethanol is a high purity biofuel according to the EN 15376:2012, with a purity of 99.6% v/v, and suitable for the production of biofuel E10 (reference gasoline + 10% bioethanol), according to the EN 228:2012 for unleaded petrol 95 RON.
Regarding energy consumption, the analysis was conducted for the three main stages of the process: drying, simultaneous saccharification and fermentation process, and final recovery of produced ethanol via distillation.
As far as the drying process in the GAIA dryer GC-100 is concerned, the energy consumption per kg of wet feedstock as received is 0.66 kWh/kg, whereas the respective consumption per kg of dried feedstock amounts to 2.46 kWh/kg.
During bioconversion process, energy is consumed for the heating and mixing purposes. The conditions applied during the SSF pilot trials are presented in Table 9.
The time intervals of 0–8 h and 9–24 h are defined based on the fact that in most cases at the 8th hour of the experiment, the maximum ethanol concentration is observed (Figure 6). Thus, the energy consumption is broken down into 0.24 kWh/kg dried feedstock for the time interval 0–8 h and 0.44 kWh/kg dried feedstock for 9–24 h. The total energy consumption for the bioconversion process of each trial was measured equal to 14.89 ± 4.66 kWh.
Regarding distillation, the energy consumption could be attributed mainly to the heating (~70 °C), stirring (40 min/h, 40% stirring rate), and vacuum pump operation (0.2 kW). The mean energy consumption for the distillation was 26.71 ± 4.67 kWh for the trials conducted or 12.74 ± 2.23 kWh/L ethanol. The derived ethanol solution is further dehydrated by additional distillation steps and zeolite purification as described above, but these processes were performed on lab scale devices and thus energy consumption is not included in the total distillation energy consumption.
To sum up, the mean total energy consumption of the optimized process treating source-separated biowaste is 4.26 ± 0.26 kWh per kg of dried feedstock, or around 0.85 kWh per kg of wet feedstock as received or 31.41 ± 4.06 kWh per L of ethanol produced. This consumption could be fractionated as presented in Figure 9. It should be noted that the high contribution of drying in the total energy consumption is due to the electrical energy consumed by GAIA dryer. In a larger scale, a rotary drum dryer could be incorporated in the treatment scheme with a biomass burner that would need to consume around 120 kg biomass per tn of wet feedstock.

4. Conclusions

Testing real source-separated biowaste at the pilot scale is a critical phase in the development of a waste management technology that promotes renewable liquid fuels production for commercial applications. At the pilot scale, it is possible that operational issues may arise that are associated with the energy and mass transfer and momentum. The analysis and characterization of more than 3 tonnes of biowaste for almost 3 years verified its potential for bioethanol production given its carbohydrate content (20–44%). According to statistical analysis, it was proven that the fluctuations in the biowaste components were not statistically important. The 2-step upscaling of bioethanol production at pilot scale by applying SSF was efficiently achieved since:
  • the yield of ethanol production was 86.6 ± 4.9%;
  • the degradation of starch was very high equal to 94.6 ± 2.4%; and
  • the degradation of cellulose was measured equal to 76.8 ± 5.2%.
The results achieved are very promising for the viability of the process. At the end of SSF, a distillation unit was used to recover the produced ethanol. The first distillate was 27.4 ± 1.8 % v/v. Then, a lab scale distillation was used so the ethanol content would be nearly 94–95% and finally, with the aid of specific molecular sieves, 99.6% ethanol purity was achieved. Even though the process is technically validated, there are still many challenges to be addressed. Processing to a commercial-size application from laboratory and pilot-plant units often poses considerable issues since the transfer of an innovation to the socio-economic environment is by nature risky. It is also crucial to ensure a market maturity to “de-risk” the market penetration of the innovation.

Author Contributions

Conceptualization, S.M. and E.M.B.; methodology, S.M. and E.M.B.; formal analysis, S.M. and E.M.B.; investigation, P.T., K.P., D.C., E.C. and I.B.; resources, D.M. and K.M.; writing—original draft preparation, S.M. and E.M.B.; writing—review and editing, S.M. and E.M.B.; visualization, S.M. and E.M.B.; supervision, S.M. and E.M.B.; project administration, D.M. and K.M. All authors have read and agreed to the published version of the manuscript.

Funding

This project has received funding from the European Union’s Horizon 2020 research and innovation programme under grant agreement No 818308 (WaysTUP!).

Institutional Review Board Statement

Not applicable.

Informed Consent Statement

Not applicable.

Data Availability Statement

Not applicable.

Conflicts of Interest

The authors declare no conflict of interest.

References

  1. The European Food Information Council (EUFIC). Food Waste in Europe: Statistics and Facts about the Problem. 2021, pp. 1–7. Available online: https://www.eufic.org/en/food-safety/article/food-waste-in-europe-statistics-and-facts-about-the-problem (accessed on 5 July 2022).
  2. Sönnichsen, N. Fuel Ethanol Production Worldwide in 2021, by Country. Available online: https://www.statista.com/statistics/281606/ethanol-production-in-selected-countries/ (accessed on 5 July 2022).
  3. Rosales-Calderon, O.; Arantes, V. A Review on Commercial-Scale High-Value Products That Can Be Produced alongside Cellulosic Ethanol. Biotechnol. Biofuels 2019, 12, 240. [Google Scholar] [CrossRef] [PubMed]
  4. Hirschnitz-Garbers, M.; Gosens, J. Producing Bio-Ethanol from Residues and Wastes—A Technology with Enormous Potential in Need of Further Research and Development. Policy Brief 2015, 5, 1–5. [Google Scholar]
  5. Barampouti, E.M.; Mai, S.; Moustakas, K.; Malamis, D.; Loizidou, M.; Passadis, K.; Stoumpou, V. Chapter 3—Advanced Bioethanol Production from Biowaste Streams. In Recent Advances in Renewable Energy Technologies; Jeguirim, M., Ed.; Academic Press: Cambridge, MA, USA, 2022; Volume 2, pp. 77–154. ISBN 9780128235324. [Google Scholar]
  6. Haldar, D.; Shabbirahmed, A.M.; Singhania, R.R.; Chen, C.W.; Di Dong, C.; Ponnusamy, V.K.; Patel, A.K. Understanding the Management of Household Food Waste and Its Engineering for Sustainable Valorization- A State-of-the-Art Review. Bioresour. Technol. 2022, 358, 127390. [Google Scholar] [CrossRef]
  7. Zeng, J.; Zeng, H.; Wang, Z. Review on Technology of Making Biofuel from Food Waste. Int. J. Energy Res. 2022, 46, 10301–10319. [Google Scholar] [CrossRef]
  8. Sharma, B.; Larroche, C.; Dussap, C.G. Comprehensive Assessment of 2G Bioethanol Production. Bioresour. Technol. 2020, 313, 123630. [Google Scholar] [CrossRef] [PubMed]
  9. Barampouti, E.M.; Mai, S.; Malamis, D.; Moustakas, K.; Loizidou, M. Liquid Biofuels from the Organic Fraction of Municipal Solid Waste: A Review. Renew. Sustain. Energy Rev. 2019, 110, 298–314. [Google Scholar] [CrossRef]
  10. Devos, R.J.B.; Colla, L.M. Simultaneous Saccharification and Fermentation to Obtain Bioethanol: A Bibliometric and Systematic Study. Bioresour. Technol. Rep. 2022, 17, 100924. [Google Scholar]
  11. Alibardi, L.; Cossu, R. Composition Variability of the Organic Fraction of Municipal Solid Waste and Effects on Hydrogen and Methane Production Potentials. Waste Manag. 2015, 36, 147–155. [Google Scholar] [CrossRef]
  12. Ntaikou, I.; Menis, N.; Alexandropoulou, M.; Antonopoulou, G.; Lyberatos, G. Valorization of Kitchen Biowaste for Ethanol Production via Simultaneous Saccharification and Fermentation Using Co-Cultures of the Yeasts Saccharomyces Cerevisiae and Pichia Stipitis. Bioresour. Technol. 2018, 263, 75–83. [Google Scholar] [CrossRef]
  13. Ren, H.Y.; Kong, F.; Cui, Z.; Zhao, L.; Ma, J.; Ren, N.Q.; Liu, B.F. Cogeneration of Hydrogen and Lipid from Stimulated Food Waste in an Integrated Dark Fermentative and Microalgal Bioreactor. Bioresour. Technol. 2019, 287, 121468. [Google Scholar] [CrossRef]
  14. Xu, S.Y.; Lam, H.P.; Karthikeyan, O.P.; Wong, J.W.C. Optimization of Food Waste Hydrolysis in Leach Bed Coupled with Methanogenic Reactor: Effect of PH and Bulking Agent. Bioresour. Technol. 2011, 102, 3702–3708. [Google Scholar] [CrossRef] [PubMed]
  15. Junoh, H.; Yip, C.H.; Kumaran, P. Effect on Ca(OH)2 Pretreatment to Enhance Biogas Production of Organic Food Waste. IOP Conf. Ser. Earth Environ. Sci. 2016, 32, 012013. [Google Scholar] [CrossRef]
  16. Hafid, H.S.; Abdul Rahman, N.; Md Shah, U.K.; Samsu Baharudin, A.; Zakaria, R. Direct Utilization of Kitchen Waste for Bioethanol Production by Separate Hydrolysis and Fermentation (SHF) Using Locally Isolated Yeast. Int. J. Green Energy 2016, 13, 248–259. [Google Scholar] [CrossRef]
  17. Vavouraki, A.I.; Angelis, E.M.; Kornaros, M. Optimization of Thermo-Chemical Hydrolysis of Kitchen Wastes. Waste Manag. 2013, 33, 740–745. [Google Scholar] [CrossRef] [PubMed]
  18. Cekmecelioglu, D.; Uncu, O.N. Kinetic Modeling of Enzymatic Hydrolysis of Pretreated Kitchen Wastes for Enhancing Bioethanol Production. Waste Manag. 2013, 33, 735–739. [Google Scholar] [CrossRef]
  19. Salimi, E.; Taheri, M.E.; Passadis, K.; Novacovic, J.; Barampouti, E.M.; Mai, S.; Moustakas, K.; Malamis, D.; Loizidou, M. Valorisation of Restaurant Food Waste under the Concept of a Biorefinery. Biomass Convers. Biorefinery 2020, 11, 661–671. [Google Scholar] [CrossRef]
  20. Uncu, O.N.; Cekmecelioglu, D. Cost-Effective Approach to Ethanol Production and Optimization by Response Surface Methodology. Waste Manag. 2011, 31, 636–643. [Google Scholar] [CrossRef]
  21. Yunqing, Z.; Han, X.; Hui, J.; Weihua, Q. Enhance the Ethanol Fermentation Performance of Kitchen Waste Using Microwave Pretreatment. Biomass Convers. Biorefinery 2022. [Google Scholar] [CrossRef]
  22. Koike, Y.; An, M.Z.; Tang, Y.Q.; Syo, T.; Osaka, N.; Morimura, S.; Kida, K. Production of Fuel Ethanol and Methane from Garbage by High-Efficiency Two-Stage Fermentation Process. J. Biosci. Bioeng. 2009, 108, 508–512. [Google Scholar] [CrossRef]
  23. Yan, S.; Wang, P.; Zhai, Z.; Yao, J. Fuel Ethanol Production from Concentrated Food Waste Hydrolysates in Immobilized Cell Reactors by Saccharomyces Cerevisiae H058. J. Chem. Technol. Biotechnol. 2011, 86, 731–738. [Google Scholar] [CrossRef]
  24. Kim, J.H.; Lee, J.C.; Pak, D. Feasibility of Producing Ethanol from Food Waste. Waste Manag. 2011, 31, 2121–2125. [Google Scholar] [CrossRef] [PubMed]
  25. Moon, H.C.; Song, I.S.; Kim, J.C.; Shirai, Y.; Lee, D.H.; Kim, J.K.; Chung, S.O.; Kim, D.H.; Oh, K.K.; Cho, Y.S. Enzymatic Hydrolysis of Food Waste and Ethanol Fermentation. Int. J. Energy Res. 2009, 33, 164–172. [Google Scholar] [CrossRef]
  26. Hafid, H.S.; Nor ‘Aini, A.R.; Mokhtar, M.N.; Talib, A.T.; Baharuddin, A.S.; Umi Kalsom, M.S. Over Production of Fermentable Sugar for Bioethanol Production from Carbohydrate-Rich Malaysian Food Waste via Sequential Acid-Enzymatic Hydrolysis Pretreatment. Waste Manag. 2017, 67, 95–105. [Google Scholar] [CrossRef]
  27. Kim, J.K.; Oh, B.R.; Shin, H.J.; Eom, C.Y.; Kim, S.W. Statistical Optimization of Enzymatic Saccharification and Ethanol Fermentation Using Food Waste. Process Biochem. 2008, 43, 1308–1312. [Google Scholar] [CrossRef]
  28. Xiao, Z.; Storms, R.; Tsang, A. A Quantitative Starch-Iodine Method for Measuring Alpha-Amylase and Glucoamylase Activities. Anal. Biochem. 2006, 351, 146–148. [Google Scholar] [CrossRef] [PubMed]
  29. Ghose, T.K. Measurement of Cellulose Activities. Pure Appl. Chem. 1987, 59, 257–268. [Google Scholar] [CrossRef]
  30. Sluiter, A.; Hames, B.; Ruiz, R.; Scarlata, C.; Sluiter, J.; Templeton, D.; Crocker, D. Determination of Structural Carbohydrates and Lignin in Biomass: Laboratory Analytical Procedure (LAP); NREL/TP-510-42618; National Renewable Energy Laboratory: Golden, CO, USA, 2012; pp. 1–17. [Google Scholar]
  31. Sluiter, A.; Hames, B.; Hyman, D.; Payne, C.; Ruiz, R.; Scarlata, C.; Sluiter, J.; Templeton, D.; Nrel, J.W. Determination of Total Solids in Biomass and Total Dissolved Solids in Liquid Process Samples; NREL/TP-510-42621; National Renewable Energy Laboratory: Golden, CO, USA, 2008; pp. 3–5. [Google Scholar]
  32. Sluiter, A.; Ruiz, R.; Scarlata, C.; Sluiter, J.; Templeton, D. Determination of Extractives in Biomass. Natl. Renew. Energy Lab. 2005, 12, 838–852. [Google Scholar] [CrossRef]
  33. APHA. Standard Methods for the Examination of Water and Wastewater, 21st ed.; American Public Health Association: Washington, DC, USA, 2005; 874p. [Google Scholar]
  34. Sofokleous, M.; Christofi, A.; Malamis, D.; Mai, S.; Barampouti, E.M. Bioethanol and Biogas Production: An Alternative Valorisation Pathway for Green Waste. Chemosphere 2022, 296, 133970. [Google Scholar] [CrossRef]
  35. Passadis, K.; Christianides, D.; Malamis, D.; Barampouti, E.M.; Mai, S. Valorisation of Source-Separated Food Waste to Bioethanol: Pilot-Scale Demonstration. Biomass Convers. Biorefinery 2022, 12, 4599–4609. [Google Scholar] [CrossRef]
  36. Agrawal, R.; Bhadana, B.; Chauhan, P.S.; Adsul, M.; Kumar, R.; Gupta, R.P.; Satlewal, A. Understanding the Effects of Low Enzyme Dosage and High Solid Loading on the Enzyme Inhibition and Strategies to Improve Hydrolysis Yields of Pilot Scale Pretreated Rice Straw. SSRN Electron. J. 2022, 327, 125114. [Google Scholar] [CrossRef]
  37. Hansen, T.L.; Jansen, J.L.C.; Davidsson, Å.; Christensen, T.H. Effects of Pre-Treatment Technologies on Quantity and Quality of Source-Sorted Municipal Organic Waste for Biogas Recovery. Waste Manag. 2007, 27, 398–405. [Google Scholar] [CrossRef] [PubMed]
  38. Thakali, A.; MacRae, J.D.; Isenhour, C.; Blackmer, T. Composition and Contamination of Source Separated Food Waste from Different Sources and Regulatory Environments. J. Environ. Manag. 2022, 314, 115043. [Google Scholar] [CrossRef] [PubMed]
  39. Alder, P.; Markova, E.V.; Granovsky, V. The Design of Experiments to Find Optimal Conditions a Programmed Introduction to the Design of Experiments; Mir Publishers: Moscow, Russia, 1975. [Google Scholar]
  40. Cochran, W.G.; Cox, G.M. Experimental Designs, 2nd ed.; Sons, J.W., Ed.; John WIley & Sons: New York, NY, USA, 1957; ISBN 978-0471545675. [Google Scholar]
  41. Wang, J.; Gao, M.; Wang, Q.; Zhang, W.; Shirai, Y. Pilot-Scale Open Fermentation of Food Waste to Produce Lactic Acid without Inoculum Addition. RSC Adv. 2016, 6, 104354–104358. [Google Scholar] [CrossRef]
  42. Wingren, A.; Galbe, M.; Zacchi, G. Techno-Economic Evaluation of Producing Ethanol from Softwood: Comparison of SSF and SHF and Identification of Bottlenecks. Biotechnol. Prog. 2003, 19, 1109–1117. [Google Scholar] [CrossRef] [PubMed]
  43. Alamanou, D.G.; Malamis, D.; Mamma, D.; Kekos, D. Bioethanol from Dried Household Food Waste Applying Non-Isothermal Simultaneous Saccharification and Fermentation at High Substrate Concentration. Waste Biomass Valorization 2015, 6, 353–361. [Google Scholar] [CrossRef]
  44. Aruwajoye, G.S.; Sewsynker-Sukai, Y.; Kana, E.B.G. Valorisation of Cassava Peels through Simultaneous Saccharification and Ethanol Production: Effect of Prehydrolysis Time, Kinetic Assessment and Preliminary Scale Up. Fuel 2020, 278, 118351. [Google Scholar] [CrossRef]
  45. Salimi, E.; Saragas, K.; Taheri, M.E.M.E.; Novakovic, J.; Barampouti, E.M.; Mai, S.; Moustakas, K.; Malamis, D.; Loizidou, M. The Role of Enzyme Loading on Starch and Cellulose Hydrolysis of Food Waste. Waste Biomass Valorization 2019, 10, 3753–3762. [Google Scholar] [CrossRef]
  46. Cox, R.; Narisetty, V.; Nagarajan, S.; Agrawal, D.; Ranade, V.V.; Salonitis, K.; Venus, J.; Kumar, V. High-Level Fermentative Production of Lactic Acid from Bread Waste under Non-Sterile Conditions with a Circular Biorefining Approach and Zero Waste Discharge. Fuel 2022, 313, 122976. [Google Scholar] [CrossRef]
  47. Uçkun Kiran, E.; Liu, Y. Bioethanol Production from Mixed Food Waste by an Effective Enzymatic Pretreatment. Fuel 2015, 159, 463–469. [Google Scholar] [CrossRef]
  48. Konti, A.; Papagiannakopoulou, P.; Mamma, D.; Kekos, D.; Damigos, D. Ethanol Production from Food Waste in West Attica: Evaluation of Investment Plans under Uncertainty. Biofuels 2020, 11, 533–542. [Google Scholar] [CrossRef]
  49. Matsakas, L.; Kekos, D.; Loizidou, M.; Christakopoulos, P. Utilization of Household Food Waste for the Production of Ethanol at High Dry Material Content. Biotechnol. Biofuels 2014, 7, 4. [Google Scholar] [CrossRef] [PubMed]
  50. Taheri, M.E.; Salimi, E.; Saragas, K.; Novakovic, J.; Barampouti, E.M.; Mai, S.; Malamis, D.; Moustakas, K.; Loizidou, M. Effect of Pretreatment Techniques on Enzymatic Hydrolysis of Food Waste. Biomass Convers. Biorefinery 2021, 11, 219–226. [Google Scholar] [CrossRef]
Figure 1. Food waste hierarchy.
Sustainability 14 12127 g001
Figure 2. Bioconversion pilot plant.
Sustainability 14 12127 g002
Figure 3. Cellulose, starch, and free glucose content (% d.b.) per year of source-separated food waste in the municipality of Vari-Voula-Vouliagmeni.
Sustainability 14 12127 g003
Figure 4. Seasonality of source-separated biowaste in the municipality of Vari-Voula-Vouliagmeni in terms of cellulose, starch and free glucose content (% d.b.).
Sustainability 14 12127 g004
Figure 5. Ethanol yield fractionation according to origin (starch, cellulose degradation, and free glucose consumption).
Sustainability 14 12127 g005
Figure 6. Typical diagram of glucose and ethanol concentration during the pilot trials.
Sustainability 14 12127 g006
Figure 7. Ethanol yields for all trials performed, along with the ethanol produced per tn of dried feedstock.
Sustainability 14 12127 g007
Figure 8. The first portion of distillate (350 mL) of trial 7, 35 % v/v bioethanol, from the distillation pilot unit with the use of a vacuum pump.
Sustainability 14 12127 g008
Figure 9. Fractionation of energy consumption in the 3 process steps: drying, bioconversion, and distillation.
Sustainability 14 12127 g009
Table 1. Lab-scale factorial experiment set-up.
ParameterLow Level
(−)
High Level
(+)
Center
SpirizymeXL (μL/g starch)206040
NS87014 (μL/g cellulose)100250175
S. cerevisiae (% w/w)132
Table 2. Physicochemical characteristics of source-separated food waste collected from the Vari-Voula-Vouliagmeni municipality.
% Dry Basis (%)
BatchDate of DeliveryMoistureFats and OilWater Soluble SolidsAshVolatile SolidsCelluloseHemicelluloseStarchAcid Soluble LigninAcid Insoluble ResidueFree Glucose
115/9/202075.7 ± 1.111.0 ± 0.837.7 ± 0.511.7 ± 0.488.3 ± 0.413.6 ± 1.833.8 ± 1.13.6 ± 0.51.2 ± 0.19.2 ± 1.21.6 ± 0.5
229/9/202078.0 ± 0.913.0 ± 0.632.1 ± 2.613.3 ± 1.786.8 ± 1.719.7 ± 5.36.8 ± 1.52.9 ± 0.91.4 ± 0.210.3 ± 1.21.6 ± 0.3
313/10/202076.2 ± 0.813.2 ± 0.335.2 ± 4.211.6 ± 0.588.4 ± 0.518.7 ± 3.83.9 ± 0.34.5 ± 1.61.4 ± 0.19.5 ± 1.42.6 ± 0.2
427/10/202076.8 ± 0.911.8 ± 0.535.0 ± 1.012.3 ± 0.287.7 ± 0.223.8 ± 1.54.4 ± 3.13.8 ± 0.81.2 ± 0.19.5 ± 0.30.8 ± 0.0
524/11/202076.0 ± 0.78.8 ± 1.034.1 ± 0.812.6 ± 0.287.4 ± 0.216.2 ± 1.74.2 ± 1.14.5 ± 0.91.0 ± 0.016.1 ± 0.52.8 ± 1.1
61/12/202075.1 ± 0.613.7 ± 1.937.7 ± 0.713.4 ± 0.486.6 ± 0.413.9 ± 0.93.9 ± 1.53.4 ± 2.41.0 ± 0.06.6 ± 0.92.5 ± 1.1
726/1/202173.2 ± 0.713.6 ± 1.433.6 ± 1.07.4 ± 0.492.6 ± 0.415.4 ± 1.88.7 ± 1.87.4 ± 0.71.0 ± 0.08.9 ± 0.43.9 ± 0.1
89/2/202172.6 ± 0.911.2 ± 2.125.5 ± 1.310.0 ± 2.490.0 ± 2.418.4 ± 2.48.7 ± 1.29.7 ± 2.73.0 ± 0.413.2 ± 2.42.4 ± 0.2
920/4/202173.9 ± 0.814.6 ± 1.627.7 ± 0.77.5 ± 0.592.5 ± 0.516.0 ± 3.88.5 ± 0.710.4 ± 1.71.4 ± 0.117.9 ± 0.23.0 ± 1.2
1025/5/202171.5 ± 1.014.2 ± 1.026.8 ± 1.37.2 ± 2.692.8 ± 2.611.8 ± 2.74.7 ± 1.217.0 ± 2.32.2 ± 0.115.1 ± 1.01.7 ± 0.1
118/6/202176.7 ± 1.08.9 ± 1.137.4 ± 1.39.7 ± 0.290.4 ± 0.210.1 ± 2.013.0 ± 0.38.9 ± 0.210.1 ± 0.01.2 ± 1.30.3 ± 0.1
1212/10/202179.2 ± 0.616.1 ± 1.429.5 ± 1.110.5 ± 0.289.5 ± 0.210.1 ± 1.88.3 ± 0.97.3 ± 0.41.6 ± 0.112.7 ± 1.22.2 ± 0.3
132/11/202179.1 ± 0.510.9 ± 1.536.5 ± 1.26.0 ± 0.394.0 ± 0.314.1 ± 1.69.5 ± 1.27.3 ± 0.91.4 ± 0.111.7 ± 0.72.2 ± 0.2
1423/11/202176.0 ± 0.613.4 ± 0.229.4 ± 1.19.1 ± 2.290.9 ± 2.214.4 ± 2.72.3 ± 0.910.3 ± 0.90.9 ± 0.119.4 ± 0.71.5 ± 0.3
157/12/202178.4 ± 0.312.0 ± 1.330.8 ± 2.511.5 ± 0.388.5 ± 0.312.7 ± 5.89.3 ± 1.77.1 ± 0.11.8 ± 0.212.4 ± 0.32.1 ± 0.1
1622/02/202276.1 ± 0.45.6 ± 2.036.0 ± 1.79.6 ± 0.990.4 ± 0.913.6 ± 1.519.3 ± 2.411.1 ± 1.01.8 ± 0.111.2 ± 1.82.1 ± 0.1
178/3/202277.3 ± 0.38.9 ± 0.838.6 ± 3.08.8 ± 0.791.2 ± 0.79.2 ± 2.512.9 ± 4.47.8 ± 1.01.0 ± 0.210.0 ± 1.21.0 ± 0.0
1822/03/202272.3 ± 0.410.0 ± 1.142.4 ± 0.59.6 ± 0.290.4 ± 0.212.7 ± 1.015.0 ± 1.58.0 ± 0.81.1 ± 0.09.0 ± 0.51.0 ± 0.0
195/4/202277.1 ± 0.46.9 ± 1.338.2 ± 1.08.4 ± 0.691.6 ± 0.69.8 ± 0.615.6 ± 0.111.9 ± 0.61.2 ± 0.110.7 ± 0.20.6 ± 2.6
203/5/202274.7 ± 0.112.1 ± 2.532.2 ± 1.99.7 ± 0.490.3 ± 0.311.5 ± 5.010.3 ± 6.110.2 ± 1.01.9 ± 0.110.5 ± 1.00.1 ± 0.5
2118/05/202274.5 ± 0.28.1 ± 0.729.5 ± 2.04.6 ± 0.695.4 ± 0.615.5 ± 0.39.9 ± 1.95.6 ± 0.51.7 ± 0.117.8 ± 2.70.1 ± 0.6
221/6/202279.0 ± 0.28.9 ± 1.022.9 ± 0.98.9 ± 0.391.1 ± 0.315.2 ± 2.120.2 ± 1.09.8 ± 1.11.2 ± 0.122.8 ± 1.20.1 ± 1.5
2321/06/202275.8 ± 0.39.9 ± 1.429.3 ± 2.54.6 ± 1.595.4 ± 1.517.9 ± 0.18.1 ± 2.34.4 ± 0.91.2 ± 0.121.4 ± 1.40.1 ± 0.6
Table 3. Tabular results of the statistical analysis assessing the impact of year-to-year composition.
Successive
Seasons
CelluloseStarchFree
Glucose
Degrees of
Freedom
t0.05
2020–20210.7181.7420.327132.160
ResultNot significantNot significantNot significant
2021–20220.1180.2124.166152.131
ResultNot significantNot significantSignificant
Table 4. Tabular results of the statistical analysis assessing the impact of seasonality.
Successive SeasonsCelluloseStarchFree
Glucose
Degrees of Freedomt0.05
Winter–Spring0.1220.0700.661132.160
ResultNot significantNot significantNot significant
Spring–Summer0.0800.1311.56082.306
ResultNot significantNot significantNot significant
Summer–Autumn0.0610.1417.41362.447
ResultNot significantNot significantSignificant
Autumn–Winter0.2770.5082.212112.201
ResultNot significantNot significantSignificant
Table 5. Liquid phase composition, solids degradation, and ethanol yields of the factorial experimental trials.
ExperimentsSpirizyme
(μL/g Starch)
NS87014
(μL/g Cell.)
S.cerevisiae (% w/w)Ethanol
(g/L)
Glucose
(g/L)
TOC
(g/L)
Solids
Degradation
(%)
Ethanol Yield
(%)
1201001%13.0 ± 0.000.4 ± 0.016.1 ± 0.349.6 ± 0.278.4 ± 0.4
2202501%14.0 ± 0.000.3 ± 0.016.3 ± 0.450.6 ± 1.284.6 ± 0.1
3601001%13.0 ± 0.000.3 ± 0.016.3 ± 0.549.6 ± 0.578.2 ± 0.7
4602501%14.5 ± 0.710.1 ± 0.017.0 ± 0.351.7 ± 0.987.7 ± 4.3
5201003%12.0 ± 0.000.1 ± 0.016.1 ± 0.445.5 ± 1.372.6 ± 0.0
6202503%13.0 ± 0.000.1 ± 0.016.8 ± 0.144.7 ± 3.278.7 ± 0.0
7601003%13.0 ± 0.000.2 ± 0.016.8 ± 0.246.1 ± 0.978.2 ± 0.0
8602503%13.5 ± 0.000.2 ± 0.017.2 ± 0.246.8 ± 0.681.6 ± 0.6
9401752%13.5 ± 1.000.2 ± 0.016.9 ± 0.747.4 ± 1.781.7 ± 6.1
Table 6. Ethanol concentrations and respective ethanol yields of SSF experiments on the optimum conditions (Spirizyme 40 μL/g starch, NS87014 175 μL/g cellulose and 2% w/w S. cerevisiae) in a 4-L bioreactor after 24 h.
TrialSolid Loading (%)Ethanol (g/L)Glucose
(g/L)
Ethanol Yield (%)Cellulose
Degradation (%)
Starch
Degradation (%)
11012.3 ± 0.20.2 ± 0.083.4 ± 0.456.2 ± 1.297.8 ± 1.1
21519.3 ± 1.10.2 ± 0.082.5 ± 0.354.5 ± 1.197.1 ± 0.9
32028.8 ± 1.22.4 ± 0.186.5 ± 0.364.1 ± 1.096.5 ± 0.8
42537.5 ± 2.00.6 ± 0.084.6 ± 0.371.4 ± 1.497.1 ± 0.2
53030.0 ± 2.20.6 ± 0.052.7 ± 0.863.1 ± 1.196.6 ± 0.4
Table 7. Degradation efficiencies of structural components of source separated biowaste.
Degradation
Efficiency (%)
Trial
1234567891011121314Mean Value
Total Solids46.346.463.970.268.064.368.565.767.768.865.565.368.164.563.8 ± 7.6
Starch89.595.492.495.295.795.990.883.296.493.496.196.495.896.993.8 ± 3.8
Cellulose73.638.874.388.378.872.582.371.168.975.676.077.580.381.774.3 ± 11.4
Oils 62.856.157.470.274.69.270.784.937.042.924.876.564.168.557.1 ± 21.4
WS52.653.568.070.268.064.368.565.778.878.374.369.679.273.368.9 ± 8.2
Hemicellulose12.222.979.362.637.177.167.345.055.768.870.064.146.654.454.5 ± 19.9
ASL27.31.239.283.042.127.644.755.867.451.334.90.824.964.140.3 ± 23.5
AIR28.30.215.257.262.029.646.457.142.35.242.766.444.733.938.0 ± 20.5
Table 8. Physicochemical characterization of bioethanol and comparison with specifications with EN15376:2012.
PropertyMeasurement
Unit
MethodLimitResults
Density at 15 °Cg/mLEN ISO 12185 0.7951
Methanol% w/wEN 15721<1.00.01
Propan-1-ol% w/wEN 15721 0.15
Butan-1-ol% w/wEN 15721 0.01
Butan-2-ol% w/wEN 15721 0.27
2-Methylpropan-1-ol% w/wEN 15721 0.00
2-Methylbutan-1-ol% w/wEN 15721 0.15
3-Methylbutan-1-ol% w/wEN 15721 0.00
Higher saturated (C3–C5) mono alcohol% w/wEN 15721<2.00.57
Ethanol and higher saturated alcohol% w/wEN 15721>98.799.91
Water% w/wEN 15489<0.30.450
Total acidity (expressed as acetic acid)% w/wEN 15491<0.0070.001
Electrical Conductivity at 25 °CuS/cmEN 15938<2.50.20
Appearance-EN 15769ClearClear
Color-EN 15769ColorlessColorless
Inorganic chloridemg/kgEN 15484<6.00.1
Sulfatemg/kgEN 15492<4.01.0
Involatile materialmg/100 mLEN 15691<101
Total Sulphurppm-wASTM D-5453<10.02.1
Table 9. Heating and mixing conditions applied during SSF pilot trials.
Time (h)Conditions
Temperature
(°C)
Stirring Rate
(%)
Stirring Time
(min/h)
0–8353540
9–24352025
Publisher’s Note: MDPI stays neutral with regard to jurisdictional claims in published maps and institutional affiliations.