Article

A New Feature Based Deep Attention Sales Forecasting Model for Enterprise Sustainable Development

1
College of Business and Trade, Hunan Industry Polytechnic, Changsha 410208, China
2
College of Mechanical and Vehicle Engineering, Taiyuan University of Technology, Taiyuan 030024, China
3
Institute of Computing Technology, Chinese Academy of Sciences, Beijing 100190, China
*
Author to whom correspondence should be addressed.
Sustainability 2022, 14(19), 12224; https://doi.org/10.3390/su141912224
Submission received: 2 September 2022 / Revised: 21 September 2022 / Accepted: 22 September 2022 / Published: 27 September 2022

Abstract

:
In recent years, with the rise of the Internet, e-commerce has become an important field of commodity sales. However, e-commerce is affected by many factors, and the wrong judgment of supply and marketing relationships will bring huge losses to operators. Therefore, it is of great significance to establish a model that can effectively achieve high precision sales prediction for ensuring the sustainable development of e-commerce enterprises. In this paper, we propose an e-commerce sales forecasting model that considers the features of many aspects of correlation. In the first layer of the model, the temporal convolutional network (TCN) is used to extract the deep temporal characteristics of univariate sales historical data, which ensures the integrity of temporal information of sales characteristics. In the second layer, the feature selection method based on reinforcement learning is used to filter the effective correlation feature set and combine it with the temporal feature after processing, which not only improves the amount of effective information input by the model, but also avoids the high feature dimension. The third layer of the reformer model learns all the features and pays different attention to the features with different degrees of importance, ensuring the stability of the sales forecast. In the experimental part, we compare the proposed model with the current advanced sales forecasting model, and we can find that the proposed model has higher stability and accuracy.

1. Introduction

With the development of information technology and the popularization of the Internet, the rapid development of digital technology and e-commerce based on the virtual economy in the world is playing a significant role as an infrastructure platform [1]. Many brands and products have developed online businesses, and e-commerce sales have covered all walks of life in a short period, gradually becoming an important indicator to measure a country or region’s economic competitiveness and degree of modernization [2,3]. Sales forecasting is based on the sales situation over the years, using the forecasting methods to estimate the future sales market through the insight of e-commerce data and a large number of multi-dimensional operations, which aim at improving value evaluation in sales and reducing costs [4]. During the current global coronavirus epidemic (COVID-19) period, the impact of the epidemic on online commerce forms of business also cannot be ignored [5]. Therefore, sales forecasting is a key link to enhancing the core competitiveness of the e-commerce industry market. Through the modeling results, the advanced layout could help to achieve sales goals in terms of marketing promotions and types of activities [6].
In the process of economic construction and informatization, the retail market has entered a period of high innovation and technical application [7]. The purpose of sales prediction is to survive in the market competition by the improvement of productivity, quantity, and service capacity [8,9]. Due to the complex and changeable sales situation of e-commerce platforms, which are restricted by many factors, e-commerce products must provide timely feedback and constantly adapt to changing market demands, and gain a leading competitive advantage for more market share [10]. Therefore, the accuracy of e-commerce sales forecasting is crucial.

1.1. Related Works

To enhance the core competitiveness of e-commerce enterprises and make them adapt to new changes in the market, scholars have paid great attention to the research on e-commerce sales forecasting. The research methods are mainly divided into qualitative and quantitative forecasting methods [11]. Qualitative forecasting research refers to all kinds of information obtained through market research and years of knowledge and experience, and to subjectively estimate the development trend of market conditions [12]. The commonly used qualitative forecasting methods mainly include the comprehensive opinion method, expert meeting method, subjective probability method, salesperson forecasting method, and market research method [13]. Qualitative forecasting methods can provide a general judgment in a certain direction. However, the accuracy of e-commerce sales forecasts is related to enterprise strategy-making and future planning. Data-driven quantitative prediction technology can effectively mine the deep correlation between historical data, relevant characteristic data, and sales forecast data, which fully improves the accuracy and adequacy of modeling [14]. Therefore, scholars constantly put forward sales forecasting models based on data drive.
The mainstream quantitative sales forecasting models are divided into three categories: statistical methods, neural network methods, and mixed model methods [15]. Over the years, researchers have proposed many statistical analysis methods. The more frequently used methods include exponential smoothing, regression analysis, and autoregressive integrated moving average model (ARIMA). However, statistical methods are relatively limited in solving nonlinear problems, and it is also arduous to accurately predict irregular data or highly variable data [16]. Methods such as neural networks are utilized by many researchers in sales forecasting, which have the advantages of fast calculation speed and strong stability. These methods also present good adaptability to nonlinear, seasonal, and periodic problems and can be applied to short-term or dynamic forecasting [17]. In contrast, the forecasting process is still time-consuming with low generality. Therefore, various combination models are continuously tried by scholars to optimize the prediction results.
Lu and Kao firstly applied the K-means algorithm to divide the training set of historical sales into different clusters, and then used an extreme learning machine to build a sales forecast model for each cluster, and conduct the forecasting for the number of computer servers [18]. Qiu et al. aimed to predict the user’s purchasing behavior. The goal can be achieved through two steps. Firstly, the correlation of the collection of goods purchased by consumers is obtained, and the inner connection of the goods could be discovered, which can form the collection of the consumer’s preferred goods. Whether the commodities in the set have the characteristics that consumers like could be determined by a hierarchical Bayesian discrete selection and support vector regression model [19]. Sılahtaroğlu and Dönertaşli analyzed the commodities that consumers have added to their shopping carts and used neural network and decision tree technology to forecast consumers’ purchasing behavior by analyzing consumers’ characteristic data and past behavior data [20]. Panagiotelis et al. applied the duration of continuous access to the website and the number of page visits, purchase conversion rate, and online retailer sales as important factors. Based on that, they developed a multivariate stochastic framework in e-commerce sales forecasting [21]. Ponce et al. utilized a recursive feature selection structure to handle 12 datasets to obtain a new input feature per month, for which an artificial neural network could be applied in the forecasting [22]. Zhang et al. proposed five market-related economic indicators, which can be used for a vector autoregressive model (VAR model) in the electric vehicle sales prediction [23]. Jiménez et al. utilized a multi-objective evolutionary algorithm with a random forest algorithm to forecast e-commerce sales [24]. Lu analyzed the weekly sales of computer products, in which the most important factors were selected. The support vector regression (SVR) algorithm is employed to establish a sales forecast model for the sales of computer products [25]. Ren et al. studied the connection between sales and price and then used the particle filter model to predict the sales of fashion products [26]. Hou et al. used the number of reviews and input the value of reviews into a neural network to forecast the sales volume of products sold online by brick-and-mortar enterprises [27].
However, most current studies have not considered the role of correlation features in processing sales forecasts. Moreover, the mining of depth time series feature information is insufficient, and different attention cannot be paid to features of different importance [28]. In order to solve the above problems, researchers proposed several feature engineering methods and attentional mechanism-based modeling methods. Gandhi et al. proposed long short-term memory (LSTM) and temporal convolutional network (TCN) on the basis of graph neural networks (GNN) to extract time series features in e-commerce and predict future demand [29]. The results show that the prediction accuracy has been significantly improved. Ye et al. combined the LSTM with the attention mechanism to extract the temporal, spatial, and weather features for better forecasting results [30]. The hybrid structure outperformed other benchmark models, e.g., gradient boosting decision tree (GBDT), back propagation neural network (BPNN), recurrent neural network (RNN), and LSTM. Cui et al. applied an improved Q-learning algorithm in e-commerce product marketing [31]. The effectiveness of the proposed method could help to improve the efficiency of marketing analysis and the company’s decision-making ability. The Reformer structure could also integrate the modeling ability of a Transformer with long sequences like time series and complete computing tasks efficiently [32]. To sum up, we adopted TCN, Q-learning, and Reformer algorithms in this study to construct the hybrid forecasting model.

1.2. Novelty of the Study

In this paper, a TCN-Q-Reformer method combining TCN and Reformer model and embedding related features is proposed to realize the e-commerce sales prediction, which provides effective technical support for the sustainable development of e-commerce enterprises. TCN is used to mine the deep time-series features of historical sales data. TCN has a better advantage in processing time-series data. Correlated features are adopted in the paper and a reinforcement learning method is utilized to select the features. On the one hand, the addition of correlation features further increases the effective information. On the other hand, feature selection based on reinforcement learning avoids high feature dimensions and information redundancy. As the final layer, Reformer can give different attention to temporal features and correlation features, which can further improve the accuracy of the model. This makes the correlation characteristics well integrated into the whole training process. Finally, the comparative experiments show that the proposed model performs well in sales forecasting.

2. Methodology

2.1. Problem Analysis of Sales Prediction

2.1.1. Problem Analysis

The sales forecast is of great significance to the strategic layout of e-commerce. Referring to the sales forecast results of e-commerce, enterprises can optimize the feedback of each link and maximize the benefits [33]. It can reflect the information of each sales link, e.g., whether consumers have demand, whether the purchase intention is strong, how big the purchase ability is, whether the company’s logistics inventory is sufficient, whether the supply is convenient, whether the delivery is smooth, and how similar and equivalent goods affect the situation [34]. A sales forecast can contribute to the formulation and optimization of sales plans.
Different from the general time series forecasting problem, the sales influence factors are complex and the forecasting is difficult, especially e-commerce sales forecasting. The general e-commerce sales forecast is subjectively affected by online store type, size, cost, sales strategy, customer preference, price sensitivity, purchase evaluation feedback, etc. [35]. Objectively, it is restricted by factors, such as seasonal and holiday cycles, national subsidy policies, similar business activities and promotions, optimized industrial allocation, and international and domestic economic development cycles [36]. In addition, the sales forecast is used to guide the sales layout of enterprises, so the accuracy of the forecast is higher [37]. Compared with the subjective judgment of experienced practitioners, e-commerce sales forecasts must be more accurate to have the value of existence [38]. In addition, sales data represent a large amount of data, of various types, and with high dimensions. In the feature learning process, we should not only consider the comprehensiveness of the information contained in features, but also consider the prominence of key influencing factors, which is very challenging for sales forecasting.

2.1.2. Hypotheses and Issue Transformation

E-commerce sales forecasting is a typical multi-variable time series forecasting issue. For one aspect, the sales data itself has seasonal variation and change, thus temporal analysis is in need. For the other aspect, e-commerce sales can be influenced by many economic features and usually has a strong relationship with feature values of the most recent period. Therefore, the sales relevant features and sales temporal features are analyzed separately and then combined in the proposed model. Besides, in the proposed method, we assume that there is a political effect on e-commerce sales, and the data from Olist company are valid and analyzable.

2.2. Model Framework

To solve the above problems, this paper proposes a new e-commerce sales forecasting model. As shown in Figure 1, at the time series feature extraction layer, the temporal convolutional network (TCN) was used to extract the time series depth features of total sales. The network only analyzes the historical time series data of total sales and excavates the depth characteristics. In addition, in the layer of association feature selection, the reinforcement learning method is used to select the best combination of features, such as distance between buyer and seller and sales of different goods. By selecting the correlation features, the model can effectively obtain the information contained in the correlation features, which not only takes into account the complexity of the influencing factors of sales volume, but also realizes the dimension reduction of data. To further improve the prediction accuracy, the selected correlation features are spliced with the time-series depth features extracted by TCN. Finally, the Reformer model was used to achieve the final e-commerce sales forecast. The Reformer model is a kind of attention network that can focus the learning on the characteristics that have a big impact on the forecast during training, which amplifies the effect of the factors that have a big impact on sales. The sales forecast model proposed in this paper not only considers the comprehensiveness of the information contained by features, but also highlights the contribution of key influencing factors, which effectively solves the difficulties in the sales forecast mentioned above and further improves the accuracy and stability of sales forecast. The TCN layer, feature splice layer, and Reformer layer participated in the learning and training as a whole, except for the independent training of the association feature selection part to determine the association feature set. The specific algorithm principle is described below.

2.3. Deep Temporal Features Extraction

The main purpose of the TCN layer is to extract the corresponding time series depth features and mine the time-series information of historical data by analyzing the historical time series of total sales. TCN is essentially a special structured convolutional neural network (CNN), which introduces extended causal convolution and residual networks based on CNN [39]. In addition, dilated causal convolution contains two convolution structures: dilated convolution and causal convolution. Causal convolution can ensure that future information will not be leaked, which will affect the prediction performance of the model. Extended convolution effectively expands the field of view of time series with fewer network layers, and effectively solves the problem of limited perception range of one-dimensional CNN.
For sales forecasting, the input sequence of TCN is only sales time series S = (s0, s1, …, st). The extended convolution operation H(t) of TCN can be defined as follows [40]:
H ( t ) = i = 0 n 1 f ( i ) s t d + i
where f is a filter function, n is the size of f, and d represents the inflation factor.
Different from traditional convolution, extended convolution allows the input of convolution to have interval sampling, which is controlled by the expansion factor d. As shown in Figure 2, the lowest layer d = 1 means that every point is sampled during input, and the middle layer d = 2 means that every two points are sampled as input. Therefore, the unique structure of extended convolution makes the size of the effective window grow exponentially with the number of layers. Extended convolution can obtain a wider range of feelings in the case of fewer layers, which is helpful for global information learning.
As shown in Figure 1, since TCN is only used as a sequential information extractor, its output takes part in the entire training and prediction process as part of the input of the Reformer model.

2.4. Sales-Related Features Selection

The related factors of e-commerce sales are complex and diverse and are influenced by people, policies, and markets. Therefore, the analysis of sales-related factors is essential. As shown in Table 1, the correlation features selected in this paper include transaction features, such as average shopping price, average freight, and the average weight of goods, as well as sales characteristics of 74 commodity categories. However, the high-dimensional complex correlation features contain more redundant information, which is not conducive to accurate prediction.
In this paper, reinforcement learning is used to select the above features. The feature selection part is an independent module. Based on the prediction effect of SVR, it adopts a reinforcement learning algorithm to select the optimal feature combination. Reinforcement learning is a kind of decision-making and trial-and-error learning algorithm whose basic idea is to learn from the feedback of the environment [41]. In the learning process, the agent constantly tries to select, adjusts the evaluation value of the action according to the feedback of the environment, and finally selects the strategy with the maximum return as the optimal strategy. Compared with general meta-heuristic optimization methods, reinforcement learning applied to sales feature selection can select the best feature combination more efficiently [42]. As shown in Figure 3, the specific application steps are illustrated as follows:
Step 1. Initialize the action matrix A and state matrix X. Each element in A represents the addition or removal of each feature, and each element in X represents whether the corresponding feature is used.
X = [ x 1 , x 2 , , x m ]
A = [ Δ x 1 , Δ x 2 , , Δ x m ]
The ԑ-greedy strategy is used as the action selection method:
A n = { A c t i o n   b a s e d   o n   m a x Q ( X , A ) ( p r o b a b i l i t y   o f   1 - ε ) R a n d o m   a c t i o n ( p r o b a b i l i t y   o f   ε )
where ε ( 0 , 1 ) is exploration probability.
Step 2. Build the reward system R. The reward mechanism is the basis for the agent to make a correct choice. In this paper, the prediction accuracy of SVR is used as the return to construct an evaluation function Q.
Step 3. The Agent performs actions based on state variables and the environment.
Step 4. Calculate the evaluation function Q and update the Q table. The Agent gets rewards from the environment and updates the state matrix X and the Q table by adjusting the behavior of the selected combination of features. The calculation formula of the Q value is expressed as follows:
Q l + 1 ( X l , A l ) = Q l ( X l , A l ) + α l ( r ( X l , A l ) + λ max Q l ( X l + 1 , A l + 1 ) Q l ( X l , A l ) )
where α represents learning speed and λ represents discount coefficient.
Step 5. Repeat steps 2 through 4 until iteration stops. The final state matrix X is the optimal feature selection result.
As shown in Figure 3, the best features are selected by RL and timing depth features are spliced together as the input values of Reformer. However, since the temporal depth features correspond to the historical data of a period, the corresponding historical correlation features need to be averaged in the time dimension and then feature splicing.

2.5. Reformer

The Reformer is a variant of the Transformer model, developed by Nikita Kitae et al. [32]. It is a kind of efficient Transformer, to solve the Transformer occupy large memory, slow training speed shortcomings. As shown in Figure 4, the structure of the Reformer is similar to that of Transformer in that it uses the encoder-decoder structure of the attention mechanism. The encoder consists of a LSH-attention layer, a Chunking feed-forward layer, and two RevNet-&-Norm layers and the decoder additionally contains a masked LSH-attention layer and a RevNet-&-Norm layer. However, it has made improvements in three details, namely employing locality-sensitive hashing attention (LSH attention), replacing standard residers with reversible residers, and adopting a segment-feedforward network.

2.5.1. LSH Attention

The traditional Transformer model mainly adopts the scale and contraction dot product attention mechanism, and its expression can be expressed as follows [32]:
A t t e n t i o n ( u ) = s o f t m a x ( u u T d k ) u
where u is the feature vector, u is usually used to replace Q, V, and K in the text Transformer when it comes to timing problems.
Different from the general attention mechanism, the main idea of LSH Attention is to use the hash function to calculate any two points in high-dimensional space. In Reformer, the random projection method is used to calculate the similarity based on the included angle of vectors as the hash algorithm. After the introduction of a locally sensitive hash algorithm, the workflow of the attention mechanism is clarified as follows:
Step 1. Process the input sequence and use the hash function to divide u into two different hash buckets.
Step 2. Reorder the sequence based on different hash buckets to the original position in the same hash bucket.
Step 3. Block according to the new sequence.
Step 4. Parallelize the segmented sequence and train the network with an attention mechanism.

2.5.2. Reversible Residual Network

A reversible residual network is proposed to solve the problem of the large memory footprint. In the Transformer model, each attention layer and feed-forward layer is packaged in the form of a residual block. Therefore, during model training, the input of each layer activation function needs to be stored to calculate the gradient during backpropagation, resulting in a large amount of memory consumption. To reduce the memory footprint, the reversible residual network is used in the Reformer model to recalculate the input of the activation function in backpropagation.
Taking the encoder as an example, in forward propagation,
y 1 = x 1 + a t t e n t i o n ( x 2 ) y 2 = x 2 + F F N ( x 1 )
where FFN represents the feedforward network function, x and y are the input and output of each layer. In backpropagation,
x 1 = y 1 a t t e n t i o n ( x 2 ) x 2 = y 2 F F N ( x 1 )
It can be found that the training process of the inverse residual network only needs to be activated once in the first-layer encoder or decoder storage, which saves the memory occupation.

2.5.3. The Segmented Forward Network

The Reformer blocks the input and computes one module at a time, which greatly reduces the memory footprint caused by large hidden layers. The calculation formula is as follows:
y 2 = [ y 2 ( 1 ) ; y 2 ( 2 ) ; ; y 2 ( M ) ] y 2 ( j ) = x 2 ( j ) + F F N ( y 1 ( j ) )
where j represents the j-th block.

3. The Results of the Research

3.1. Sales Dataset

The Olist dataset contains information on 100,000 orders placed by the company in various markets in Brazil between 2016 and 2018. The data set contains data, such as order status, goods size, price, payment, merchant location, customer location, and last comments written by customers. Based on the above data, we extracted 10 transaction characteristics as described in Section 2.4 and 74 sales characteristics by category. Besides, the data are preprocessed into time series by day and there are a total of 500 pieces of data. Among them, the first 80% of time series data is used for the training model, and the last 20% of data is used as the test set. The performance of the proposed model is proven by constructing different comparative experiments.

3.2. Performance Evaluation Indexes

Multiple regression evaluation indexes are the key to evaluating the results and performance of the sales forecasting model. Three classic indexes, which include the MAE (mean absolute error), the MAPE (mean absolute percentage error), and the RMSE (root mean square error), are used to comprehensively evaluate the modeling effectiveness of the proposed model and all benchmark models. These multiple regression analysis indexes are defined based on the following formula [43]:
{ M A E = ( T = 1 n | Y ( T ) Y ( T ) | ) / n M A P E = ( T = 1 n | ( Y ( T ) Y ( T ) ) / y ( T ) | ) / n R M S E = ( T = 1 n [ Y ( T ) Y ( T ) ] 2 ) / n
where Y (T) represents actual sales data. Y ( T ) represents the sales data got by the sales forecasting model. N represents the number of samples.
In addition, it is necessary to visually compare the performance differences between different models. To fully and directly evaluate the performance between the two models, the Promoting percentages of the MAE (PMAE), the Promoting percentages of the MAPE (PMAPE), and the Promoting percentages of the RMSE (PRMSE) are applied. These evaluation indexes can be calculated by the following formula [44]:
{ P M A E = ( M A E a M A E b ) M A E a P M A P E = ( M A P E a M A P E b ) M A P E a P R M SE = ( R M S E a R M S E b ) R M S E a

3.3. Experimental Results and Comparative Analysis with Benchmark Algorithms

3.3.1. Comparative Experimental Results of Different Predictors

To effectively verify that the Reformer algorithm can achieve good prediction results in the field of sales forecasting, this study compares Reformer with multiple deep learning models and shallow neural networks. Table 2 shows multiple regression evaluation indexes of all single predictors. Figure 5 shows the visualization of prediction results of the different predictors.
From Table 2 and Figure 5, the following conclusions can be drawn:
(1)
Compared with traditional neural network models, other deep learning models can achieve even better prediction results. Therefore, a deep learning model can achieve excellent results in the field of sales forecasting. A possible reason for this is that deep learning uses a multi-layer network framework to effectively mine the depth mapping of feature data, which effectively improves the adaptability and accuracy of the model.
(2)
Based on Table 2 and Figure 5, it can be found that the Reformer can achieve the best prediction results of all neural network frameworks. Compared with other deep learning models, Reformer uses an attention mechanism to effectively improve the data mining capability of the model. Therefore, the multiple sales prediction model based on Reformer can dig into the correlation between prediction tags and input features more deeply, which effectively ensures the prediction effect of the model.

3.3.2. Comparative Experimental Results of Different Feature Engineering Methods

In this section, to prove that the TCN-Q-Reformer model is an excellent sales forecasting model, the following comparative experiments will be constructed to fully prove the performance of the TCN-Q-Reformer.
Part I: To prove that feature engineering can effectively optimize the effect of the predictor, this section compares the feature engineering algorithm with the original Reformer model to evaluate the importance of feature engineering.
Part II: To verify that the TCN algorithm has excellent time series feature mining ability, this section compares LSTM and SAE with TCN.
Part III: To prove the practicability and advance of a reinforcement learning algorithm in the field of feature selection, this section compares reinforcement learning with the traditional meta-heuristic algorithm.
Table 3 shows the multiple regression evaluation indexes of several forecasting models. Table 4, Table 5 and Table 6 intuitively show the accuracy advantage of TCN-Q-Reformer over other prediction algorithms. Figure 6 shows the visualization of the prediction results of the different models.
From Table 3, Table 4, Table 5 and Table 6 and Figure 6, the following conclusions can be drawn:
(1)
Based on Table 4, it can be found that compared with Reformer, feature selection and feature extraction algorithms can effectively improve the prediction accuracy of the model, which proves the effectiveness of feature engineering. A possible reason for this is that feature engineering can effectively mine the key information of the original feature data, optimize the input of the predictor and obtain satisfactory results.
(2)
Based on Table 5, it can be found that compared with other time-series feature extraction methods, the TCN method can obtain better feature extraction results. This proves that the TCN network has excellent ability for time series modeling and data feature extraction. Compared with traditional LSTM and SAE, TCN effectively combines CNN and RNN to ensure the training effect and timing modeling ability of the network.
(3)
Based on Table 6 and Figure 6, it can be found that compared with the traditional meta-heuristic algorithm, the reinforcement learning method can obtain better feature selection results. This fully proves that reinforcement learning is advanced and effective in the field of feature selection. A possible reason for this is that reinforcement learning effectively optimizes the intelligence of the model and achieves optimal results by training agents.

3.4. Comparing Analysis with Existing Algorithms

To verify that the proposed TCN-Q-Reformer model has excellent pioneering properties in the field of sales forecasting, this section reproduces four existing models and constructs comparative experiments. The four existing models include the classical multivariate statistical model (MLR), the traditional machine learning frameworks (SVM), and two advanced models (Li’s model [45] and Dong’s model [46]). Figure 7, Figure 8 and Figure 9 give the MAE, MAPE, and RMSE values of all existing frameworks and proposed models. Figure 10 shows the predicted results of the TCN-Q-Reformer model and different baseline models.
Based on Figure 7, Figure 8, Figure 9 and Figure 10, the following conclusions can be drawn:
(1)
Compared with traditional MLR and SVM models, advanced hybrid models can achieve better results. This proves that the hybrid model has excellent adaptability and sales forecasting modeling ability. A possible reason for this is that, compared with a single predictor, feature engineering can effectively mine the optimal feature information and obtain satisfactory prediction results.
(2)
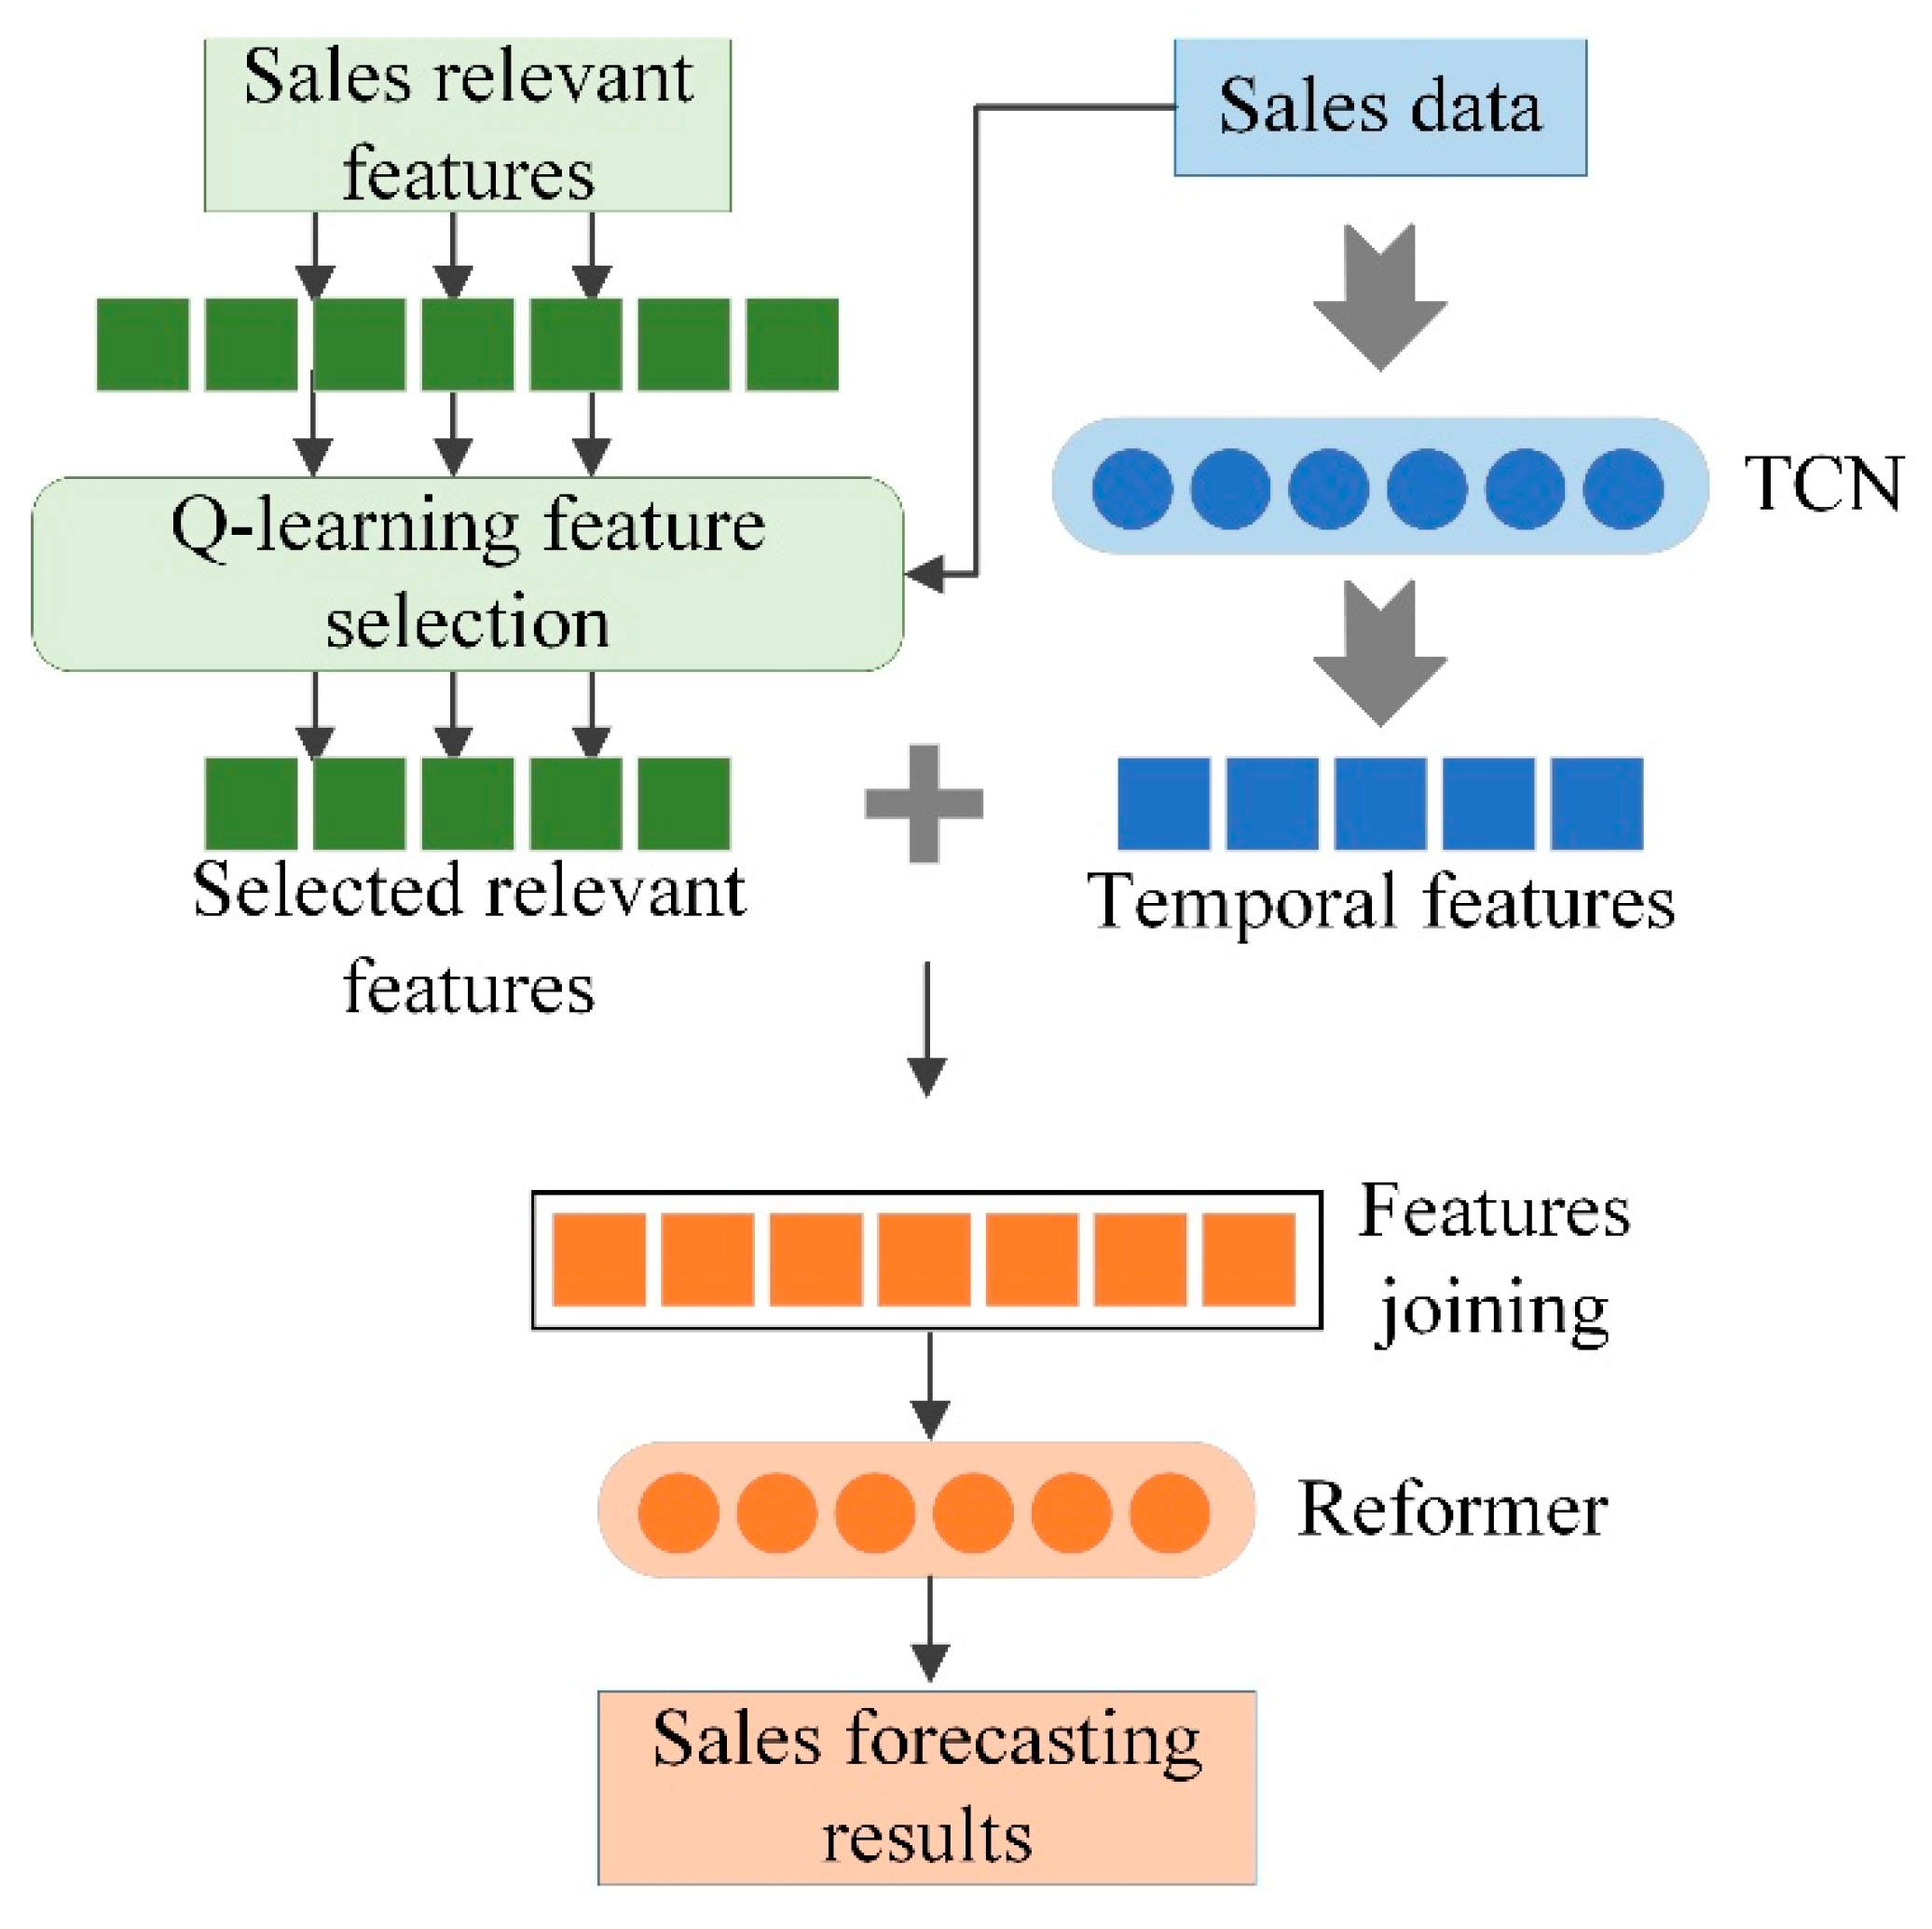
The TCN-Q-Reformer model proposed in this paper can obtain optimal experimental results in all case analyses. First of all, the TCN model can effectively mine the time-series features of sales data and obtain excellent quality time-series features. Secondly, the q-learning model can fully analyze the correlation between other feature data and sales data and select the optimal feature. Finally, the Reformer based on the attention mechanism can fully and efficiently mine the correlation between features and tags and obtain the optimal prediction results. To sum up, the TCN-Q-Reformer framework proposed in this paper is a sales forecasting framework with excellent research value.

4. Conclusions and Future Work

It is of great significance to establish a model that can effectively achieve high precision sales prediction for ensuring the sustainable development of e-commerce enterprises. This paper proposes a sales forecasting framework based on feature engineering and Reformer. The main contributions and conclusions of this paper mainly include the following aspects:
(1)
Different from the traditional deep learning model, this paper adopts Reformer based on the attention mechanism as the main predictor to build the sales forecasting model. Experimental results show that the Reformer can achieve better prediction results than the traditional neural network framework.
(2)
The feature extraction method based on TCN and feature selection method based on Q-learning proposed in this paper can effectively optimize the input feature quality of Reformer, which effectively improves the prediction accuracy of the sales forecasting model.
(3)
The TCN-Q-Reformer proposed in this paper is a stable framework that can achieve excellent results in the field of sales forecasting. Compared with 15 alternative models and four existing models, the sales forecasting model proposed in this paper can obtain the best results.
(4)
The sales forecast model proposed in this paper can provide certain technical support for enterprise policy making and the sustainable development of the e-commerce industry. It is of great significance to realize the combination of forecasting models and policymaking to guarantee the sustainable development of enterprises.
Sales forecasting technology provides effective technical support for the sustainable development of enterprises. In the future, the model proposed in this paper can be optimized from the following aspects:
(1)
A single predictor usually has a disadvantage in adapting to complex and variable data sets. To comprehensively improve the stability of the model, the ensemble learning model will be adopted in the future.
(2)
Sales forecast results can provide technical support for the future strategic development of enterprises. In the future, based on the forecast results, enterprises can develop relevant strategies to effectively formulate key policies.
(3)
In general, competition between enterprises, social policies, regional economic development, and other factors also affect the change in sales. In the future, more factors can be comprehensively considered to achieve more perfect modeling.

Author Contributions

Conceptualization, Q.C. and C.Y.; Data curation, J.H., Q.C. and C.Y.; Formal analysis, Q.C. and C.Y.; Funding acquisition, J.H.; Investigation, J.H.; Methodology, Q.C. and C.Y.; Project administration, J.H. and C.Y.; Resources, J.H.; Software, Q.C. and C.Y.; Supervision, J.H.; Validation, C.Y.; Visualization, Q.C. and C.Y.; Writing—review & editing, J.H., Q.C. and C.Y. All authors have read and agreed to the published version of the manuscript.

Funding

This research received no external funding.

Institutional Review Board Statement

Not applicable.

Informed Consent Statement

Not applicable.

Data Availability Statement

Not applicable.

Conflicts of Interest

The authors declare no conflict of interest.

Abbreviations

ARIMAAutoregressive Integrated Moving Average
BPNNBack Propagation Neural Network
CNNConvolutional Neural Network
ELMExtreme Learning Machine
GBDTGradient Boosting Decision Tree
GNNGraph Neural Networks
GRUGate Recurrent Unit
LSTMLong Short-Term Memory
MAEMean Averaging Error
MAPEMean Average Percentage Error
MLRMultivariate Regression
RBFRadial Basis Function
RMSERoot Mean Square Error
RNNRecurrent Neural Network
SVMSupport Vector Machine
SVRSupport Vector Regression
TCNTemporal Convolutional Network
VARVector Autoregressive

References

  1. Babenko, V.; Kulczyk, Z.; Perevosova, I.; Syniavska, O.; Davydova, O. Factors of the development of international e-commerce under the conditions of globalization. SHS Web Conf. 2019, 65, 4016. [Google Scholar] [CrossRef]
  2. Elia, S.; Giuffrida, M.; Mariani, M.M.; Bresciani, S. Resources and digital export: An RBV perspective on the role of digital technologies and capabilities in cross-border e-commerce. J. Bus. Res. 2021, 132, 158–169. [Google Scholar] [CrossRef]
  3. Soava, G.; Mehedintu, A.; Sterpu, M. Analysis and Forecast of the Use of E-Commerce in Enterprises of the European Union States. Sustainability 2022, 14, 8943. [Google Scholar] [CrossRef]
  4. Wu, C.; Li, H.; Ren, J.; Marimuthu, K.; Kumar, P.M. Artificial neural network based high dimensional data visualization technique for interactive data exploration in E-commerce. Ann. Oper. Res. 2021, 1–19. [Google Scholar] [CrossRef]
  5. Akram, U.; Fülöp, M.T.; Tiron-Tudor, A.; Topor, D.I.; Căpușneanu, S. Impact of digitalization on customers’ well-being in the pandemic period: Challenges and opportunities for the retail industry. Int. J. Environ. Res. Public Health 2021, 18, 7533. [Google Scholar] [CrossRef]
  6. Pang, L.; Yu, J.; Xu, X. Synthetic Evaluation Methods of E-Commerce Product Quality Based on Multi-Dimensional Information Fusion. In Proceedings of the 4th International Conference on Electronic Information Technology and Computer Engineering, Xiamen, China, 6–8 November 2020; pp. 829–834. [Google Scholar]
  7. Chaveesuk, S.; Khalid, B.; Chaiyasoonthorn, W. Digital payment system innovations: A marketing perspective on intention and actual use in the retail sector. Innov. Mark. 2021, 17, 109. [Google Scholar] [CrossRef]
  8. Lyu, F.; Choi, J. The forecasting sales volume and satisfaction of organic products through text mining on web customer reviews. Sustainability 2020, 12, 4383. [Google Scholar] [CrossRef]
  9. Kacmary, P.; Rosova, A.; Sofranko, M.; Bindzar, P.; Saderova, J.; Kovac, J. Creation of annual order forecast for the production of beverage cans—The case study. Sustainability 2021, 13, 8524. [Google Scholar] [CrossRef]
  10. Gyenge, B.; Máté, Z.; Vida, I.; Bilan, Y.; Vasa, L. A new strategic marketing management model for the specificities of E-commerce in the supply chain. J. Theor. Appl. Electron. Commer. Res. 2021, 16, 1136–1149. [Google Scholar] [CrossRef]
  11. Cai, W.; Song, Y.; Wei, Z. Multimodal data guided spatial feature fusion and grouping strategy for E-commerce commodity demand forecasting. Mob. Inf. Syst. 2021, 2021, 5568208. [Google Scholar]
  12. Gupta, S.; Justy, T.; Kamboj, S.; Kumar, A.; Kristoffersen, E. Big data and firm marketing performance: Findings from knowledge-based view. Technol. Forecast. Soc. Change 2021, 171, 120986. [Google Scholar] [CrossRef]
  13. Naseem, M.H.; Yang, J.; Xiang, Z. Prioritizing the solutions to reverse logistics barriers for the e-commerce industry in Pakistan based on a fuzzy ahp-topsis approach. Sustainability 2021, 13, 12743. [Google Scholar] [CrossRef]
  14. Zhang, X. Prediction of Purchase Volume of Cross-Border e-Commerce Platform Based on BP Neural Network. Comput. Intell. Neurosci. 2022, 2022, 3821642. [Google Scholar] [CrossRef]
  15. Huang, J.; Wang, X. User Experience Evaluation of B2C E-Commerce Websites Based on Fuzzy Information. Wirel. Commun. Mob. Comput. 2022, 2022, 6767960. [Google Scholar] [CrossRef]
  16. Peng, X.; Li, X.; Yang, X. Analysis of circular economy of E-commerce market based on grey model under the background of big data. J. Enterp. Inf. Manag. 2021, 35, 1148–1167. [Google Scholar] [CrossRef]
  17. Zhang, B.; Tan, R.; Lin, C.-J. Forecasting of e-commerce transaction volume using a hybrid of extreme learning machine and improved moth-flame optimization algorithm. Appl. Intell. 2021, 51, 952–965. [Google Scholar] [CrossRef]
  18. Lu, C.; Kao, L. A clustering-based sales forecasting scheme by using extreme learning machine and ensembling linkage methods with applications to computer server. Eng. Appl. Artif. Intell. 2016, 55, 231–238. [Google Scholar] [CrossRef]
  19. Qiu, J.; Lin, Z.; Li, Y. Predicting customer purchase behavior in the e-commerce context. Electron. Commer. Res. 2015, 15, 427–452. [Google Scholar] [CrossRef]
  20. Sılahtaroğlu, G.; Dönertaşli, H. Analysis and prediction of Ε-customers’ behavior by mining clickstream data. In Proceedings of the 2015 IEEE International Conference on Big Data (Big Data), Santa Clara, CA, USA, 29 October–1 November 2015; IEEE: Piscataway, NJ, USA, 2015; pp. 1466–1472. [Google Scholar]
  21. Panagiotelis, A.; Smith, M.S.; Danaher, P.J. From Amazon to Apple: Modeling online retail sales, purchase incidence and visit behavior. J. Bus. Econ. Stat. 2014, 32, 14–29. [Google Scholar] [CrossRef]
  22. Ponce, H.; Miralles-Pechúan, L.; Lourdes Martínez-Villaseñor, M.d. Artificial hydrocarbon networks for online sales prediction. In Proceedings of the Mexican International Conference on Artificial Intelligence, Cuernavaca, Mexico, 25–31 October 2015; Springer: Cham, Switzerland, 2015; pp. 498–508. [Google Scholar]
  23. Zhang, Y.; Zhong, M.; Geng, N.; Jiang, Y. Forecasting electric vehicles sales with univariate and multivariate time series models: The case of China. PLoS ONE 2017, 12, e0176729. [Google Scholar] [CrossRef]
  24. Jiménez, F.; Sánchez, G.; García, J.M.; Sciavicco, G.; Miralles, L. Multi-objective evolutionary feature selection for online sales forecasting. Neurocomputing 2017, 234, 75–92. [Google Scholar] [CrossRef]
  25. Lu, C. Sales forecasting of computer products based on variable selection scheme and support vector regression. Neurocomputing 2014, 128, 491–499. [Google Scholar] [CrossRef]
  26. Ren, S.; Choi, T.-M.; Liu, N. Fashion sales forecasting with a panel data-based particle-filter model. IEEE Trans. Syst. Man Cybern. Syst. 2014, 45, 411–421. [Google Scholar] [CrossRef]
  27. Hou, F.; Li, B.; Chong, A.Y.-L.; Yannopoulou, N.; Liu, M.J. Understanding and predicting what influence online product sales? A neural network approach. Prod. Plan. Control. 2017, 28, 964–975. [Google Scholar] [CrossRef]
  28. Wu, M.; Chen, W. Forecast of electric vehicle sales in the world and China based on PCA-GRNN. Sustainability 2022, 14, 2206. [Google Scholar] [CrossRef]
  29. Gandhi, A.; Kaveri, S.; Chaoji, V. Spatio-Temporal Multi-Graph Networks for Demand Forecasting in Online Marketplaces. In Proceedings of the Joint European Conference on Machine Learning and Knowledge Discovery in Databases, Bilbao, Spain, 13–17 September 2021; Springer: Cham, Switzerland, 2021; pp. 187–203. [Google Scholar]
  30. Ye, X.; Ye, Q.; Yan, X.; Wang, T.; Chen, J.; Li, S. Demand Forecasting of Online Car-Hailing with Combining LSTM + Attention Approaches. Electronics 2021, 10, 2480. [Google Scholar] [CrossRef]
  31. Cui, F.; Hu, H.; Xie, Y. An intelligent optimization method of E-commerce product marketing. Neural Comput. Appl. 2021, 33, 4097–4110. [Google Scholar] [CrossRef]
  32. Kitaev, N.; Kaiser, Ł.; Levskaya, A. Reformer: The efficient transformer. arXiv 2020, arXiv:2001.04451. [Google Scholar]
  33. Haselbeck, F.; Killinger, J.; Menrad, K.; Hannus, T.; Grimm, D.G. Machine Learning Outperforms Classical Forecasting on Horticultural Sales Predictions. Mach. Learn. Appl. 2022, 7, 100239. [Google Scholar] [CrossRef]
  34. Li, D.; Lin, K.; Li, X.; Liao, J.; Du, R.; Chen, D.; Madden, A. Improved sales time series predictions using deep neural networks with spatiotemporal dynamic pattern acquisition mechanism. Inf. Process. Manag. 2022, 59, 102987. [Google Scholar] [CrossRef]
  35. Pan, S.; Liao, Q.; Liang, Y. Multivariable sales prediction for filling stations via GA improved BiLSTM. Pet. Sci. 2022; in press. [Google Scholar] [CrossRef]
  36. Bohanec, M.; Kljajić Borštnar, M.; Robnik-Šikonja, M. Explaining machine learning models in sales predictions. Expert Syst. Appl. 2017, 71, 416–428. [Google Scholar] [CrossRef]
  37. Feng, Y.; Yin, Y.; Wang, D.; Dhamotharan, L. A dynamic ensemble selection method for bank telemarketing sales prediction. J. Bus. Res. 2022, 139, 368–382. [Google Scholar] [CrossRef]
  38. Ribeiro, A.; Seruca, I.; Durão, N. Improving organizational decision support: Detection of outliers and sales prediction for a pharmaceutical distribution company. Proc. Comput. Sci. 2017, 121, 282–290. [Google Scholar] [CrossRef]
  39. Huo, F.; Chen, Y.; Ren, W.; Dong, H.; Yu, T.; Zhang, J. Prediction of reservoir key parameters in ‘sweet spot’ on the basis of particle swarm optimization to TCN-LSTM network. J. Pet. Sci. Eng. 2022, 214, 110544. [Google Scholar] [CrossRef]
  40. Sadique, F.; Sengupta, S. Modeling and analyzing attacker behavior in IoT botnet using temporal convolution network (TCN). Comput. Secur. 2022, 117, 102714. [Google Scholar] [CrossRef]
  41. Huynh, T.N.; Do, D.T.T.; Lee, J. Q-Learning-based parameter control in differential evolution for structural optimization. Appl. Soft Comput. 2021, 107, 107464. [Google Scholar] [CrossRef]
  42. Lopes Silva, M.A.; de Souza, S.R.; Freitas Souza, M.J.; Bazzan, A.L.C. A reinforcement learning-based multi-agent framework applied for solving routing and scheduling problems. Expert Syst. Appl. 2019, 131, 148–171. [Google Scholar] [CrossRef]
  43. Shang, P.; Liu, X.; Yu, C.; Yan, G.; Xiang, Q.; Mi, X. A new ensemble deep graph reinforcement learning network for spatio-temporal traffic volume forecasting in a freeway network. Digit. Signal Process. 2022, 123, 103419. [Google Scholar] [CrossRef]
  44. Liu, X.; Qin, M.; He, Y.; Mi, X.; Yu, C. A new multi-data-driven spatiotemporal PM2.5 forecasting model based on an ensemble graph reinforcement learning convolutional network. Atmos. Pollut. Res. 2021, 12, 101197. [Google Scholar] [CrossRef]
  45. Li, Q.; Yan, G.; Yu, C. A Novel Multi-Factor Three-Step Feature Selection and Deep Learning Framework for Regional GDP Prediction: Evidence from China. Sustainability 2022, 14, 4408. [Google Scholar] [CrossRef]
  46. Dong, S.; Yu, C.; Yan, G.; Zhu, J.; Hu, H. A Novel Ensemble Reinforcement Learning Gated Recursive Network for Traffic Speed Forecasting. In Proceedings of the 2021 Workshop on Algorithm and Big Data, Fuzhou, China, 12–14 March 2021; pp. 55–60. [Google Scholar]
Figure 1. The framework of the proposed method.
Sustainability 14 12224 g001
Figure 2. Simplified structure of TCN.
Sustainability 14 12224 g002
Figure 3. Flowchart of Q-learning for feature selection.
Sustainability 14 12224 g003
Figure 4. The structure of the Reformer.
Sustainability 14 12224 g004
Figure 5. Prediction results of multiple models.
Sustainability 14 12224 g005
Figure 6. Prediction results of different hybrid models.
Sustainability 14 12224 g006
Figure 7. MAE values of all existing frameworks and proposed models.
Sustainability 14 12224 g007
Figure 8. MAPE values of all existing frameworks and proposed models.
Sustainability 14 12224 g008
Figure 9. RMSE values of all existing frameworks and proposed models.
Sustainability 14 12224 g009
Figure 10. Prediction results of the proposed TCN-Q-Reformer model and different baseline models.
Sustainability 14 12224 g010
Table 1. Related features of sales.
NumberTrading FeaturesNumberPart of Categories of Goods
1Mean price36electronics
2Sales amount37housewares
3Average freight38food
4Total freight39small_appliances
5Average weight of goods40costruction_tools_garden
6Total weight of goods41party_supplies
7Average volume of goods42fashion_bags_accessories
8Average service feedback43home_appliances_2
9Average distance between customers and sellers 44furniture_bedroom
10The total distance between customers and sellers45fashion_shoes
Table 2. The regression analysis indexes of several predictors.
SeriesForecasting ModelsMAE
(Billion Yuan)
MAPE (%)RMSE
(Billion Yuan)
#1TCN25.2155 5.2263 34.0967
GRU26.3096 5.4412 34.9834
LSTM26.6932 5.4694 34.9907
RNN27.1426 5.5086 35.0814
ELM27.7391 5.6319 36.0643
RBF27.6943 5.6393 35.8998
#2TCN21.2653 3.9465 28.4004
GRU22.3954 4.0541 29.6895
LSTM22.5898 4.1824 29.9655
RNN23.2437 4.2517 30.4454
ELM25.7957 5.1268 33.1268
RBF25.3667 5.1499 32.6133
#3TCN33.9287 3.7871 50.4280
GRU34.7236 3.9526 50.6098
LSTM34.1358 3.9577 51.6374
RNN35.5990 3.9983 52.2030
ELM36.0811 4.0071 52.6383
RBF35.8042 4.0245 52.8738
Table 3. The multiple regression evaluation indexes of several forecasting models.
Forecasting ModelsMAE (R$)MAPE (%)RMSE (R$)
TCN-Q-Reformer802.06645.34951137.9800
TCN-PSO-Reformer1036.12736.00821463.5839
TCN-GA-Reformer1141.03506.59801601.1118
Q-Reformer1409.73957.01321856.6236
TCN-Reformer1882.15748.30272500.2135
LSTM-Reformer1925.13348.71142620.8150
SAE-Reformer1975.57138.80202689.1411
Table 4. The promoting percentages of TCN-Q-Reformer by single models.
MethodIndexesResults
TCN-Q-Reformer vs.
Q-Reformer
PMAPE (%)43.1053
PMAE (%)23.7224
PRMSE (%)38.7070
TCN-Q-Reformer vs.
TCN-Reformer
PMAPE (%)57.3858
PMAE (%)35.5692
PRMSE (%)54.4847
TCN-Q-Reformer vs.
Reformer
PMAPE (%)61.1702
PMAE (%)40.7730
PRMSE (%)58.8079
Table 5. The promoting percentages of the TCN by other feature extraction methods.
MethodIndexesResults
TCN-Reformer vs.
LSTM-Reformer
PMAPE (%)2.2324
PMAE (%)4.6916
PRMSE (%)4.6017
TCN-Reformer vs.
SAE-Reformer
PMAPE (%)4.7284
PMAE (%)5.6726
PRMSE (%)7.0256
Table 6. The promoting percentages of the Q-learning by heuristic algorithms.
MethodIndexesResults
TCN-Q-Reformer vs.
TCN-PSO-Reformer
PMAPE (%)22.5900
PMAE (%)10.9634
PRMSE (%)22.2470
TCN-Q-Reformer vs.
TCN-GA-Reformer
PMAPE (%)29.7071
PMAE (%)18.9224
PRMSE (%)28.9256
Publisher’s Note: MDPI stays neutral with regard to jurisdictional claims in published maps and institutional affiliations.

