Article

Development of High-Performance Fiber Cement: A Case Study in the Integration of Circular Economy in Product Design

by
Parinya Chakartnarodom
1,
Sarunya Wanpen
1,
Wichit Prakaypan
2,
Edward A. Laitila
3 and
Nuntaporn Kongkajun
4,*
1
Department of Materials Engineering, Faculty of Engineering, Kasetsart University, Chatuchak, Bangkok 10900, Thailand
2
UAC Global Public Company Limited, Chatuchak, Bangkok 10900, Thailand
3
Department of Materials Science and Engineering, Michigan Technological University, Houghton, MI 49931, USA
4
Department of Materials and Textile Technology, Faculty of Science and Technology, Thammasat University, Klong Luang, Pathumthani 12121, Thailand
*
Author to whom correspondence should be addressed.
Sustainability 2022, 14(19), 12263; https://doi.org/10.3390/su141912263
Submission received: 23 August 2022 / Revised: 20 September 2022 / Accepted: 23 September 2022 / Published: 27 September 2022

Abstract

:
A new fiber cement (FC) is designed with the integration of circular economy (CE) concepts, in particular a product that is recyclable yet maintains performance. The FC samples were prepared from the mixtures of ordinary Portland cement (OPC), sand, and cellulose fibers, and required an inclusion compound (IC) and water. From the heat of hydration tests, the most effective IC, IC1, was prepared from lithium silicate, sodium thiocyanate, alkylbenzene sulfonate, and hydrochloric acid. The FC samples were recycled by crushing and grinding, then used as sand replacement in varying amounts to produce new FC samples. The results from the mechanical tests showed that the 50%replacement of the sand provided FC samples with the highest modulus of rupture (MOR) of 10.64 MPa and a modulus of elasticity (MOE) of 7706.40 MPa. The samples with/without the recycled product passed both the freeze–thaw resistance test and flammability test for durability. Most importantly, results showed that the mechanical properties of the produced FC samples remained the same over 5 to 50 recycles.

Graphical Abstract

1. Introduction

The construction industry plays a vital role in urbanization and economic growth. According to the Office of National Economic and Social Development Council (NESDC) of Thailand, from 2009 to 2019, the contribution to gross domestic product (GDP) from the construction industry was around 8.1% [1]. Of course, this causes a large strain on natural resources, such as limestone, soil, and sand, as these are consumed in the production of construction materials. In India, the demands on aggregate and sand for the construction industry are about 600–700 tons a year for each material [2].
Construction and demolition waste (CDW) is generated from the rejected products from the manufacturing process of construction materials, as well as from construction activities. CDW generation can replace natural resources and reduce energy used in construction-material manufacturing. Approximately 30 to 40% of the total global solid waste is CDW [3]. In the European Union (EU), about 850 million tons of CDW is generated annually. In 2018, around 600 million tons of CDW were generated in the United States [4]. In China, the average generation of CDW just from Shenzhen city, from 2010 to 2015, was 14 million tons a year [5]. In India, 400–500 tons of CDW is generated each year. The CDW is commonly disposed by landfill, but while the landfill is the simplest method to dispose of CDW, landfill space is becoming limited [6]. In addition, CDW in landfills can also have a negative impact on the soil, water resources, and air quality nearby the landfill site [7,8,9,10,11,12].
The circular economy (CE) is an approach promoting natural resource conservation and waste elimination by maintaining the recyclability of the items or materials as far as possible through the manufacturing process in terms of repairing, reusing, redistributing, refurbishing, remanufacturing, and recycling [13,14]. According to the Ellen MacArthur Foundation [13,14], CE is a means to counter the environmental problems from climate change and reduce the environmental footprint of the construction industry.
Kongkajun et al. [15] used clay-brick waste and soft sludge from a fiber-cement factory as the partial replacement of raw materials used to produce soil-cement bricks. These results showed that using clay-brick waste and soft sludge reduced the bulk density of the soil-cement bricks while maintaining the strength of the bricks. Due to the reduction in brick weight, both cost and CO2 emission generated from transportation would be reduced because of the reduction in fuel consumption.
Fiber cement (FC), or more specifically fiber-reinforced cement composites, can be substituted for a variety of materials in home and building construction. They have a wide range of applications, such as in ceilings, walls, roof tiles, and floors. Commonly, FC is prepared from Portland cement, sand, cellulose fiber, filler, and admixtures. Liang et al. [16] studied FC incorporated with CDW powder. The CDW powders were prepared from cement-paste waste, mortar waste, concrete waste, or brick waste; this was also used as a cement and fly-ash replacement in their control samples. Even though it was economically feasible to use CDW powder as a substitute in FC, the mechanical strength of composites was reduced when the CDW powder was added.
Generally, recycled CDW is inferior to natural materials such as typical aggregate [17,18]. Research has shown that combining chemical admixtures will improve the properties of cement-based construction materials [19,20,21]. From our previous work [22,23], it was feasible to use recycled fiber cement (RFC), added as a raw material, to produce FC. The combined chemical admixtures were used as a surface-modification agent for the RFC. The results showed that fiber-cement samples incorporated with a surface-modified RFC had properties comparable to the samples produced from typical raw materials. Due to the energy reduction for tobermorite formation, using those surface-modified RFC mixtures reduced the energy consumed in the autoclave-curing process of FC production, leading to a reduction in the carbon footprint.
Usually, the research work on CE is often focused on waste recycling. Even though recycling is a part of the CE, and considered a more favorable practice over landfilling, generally, recycling is regarded as an end-of-life solution for waste that has already occurred. Moreover, most research on waste recycling does not focus on the number of times that the products can be recycled. Another important focus of the CE is the prevention or minimization of waste at the product design level [13,24,25,26]. Designing for recycling and product optimization for longevity are research themes that support the CE model as well. A new high-performance FC is developed with the integration of CE strategies, including designing for the longevity and recyclability of the product. These samples were then recycled and used as a raw material to produce new FC, while comparing its properties. Finally, for recyclability, the number of times that samples can be recycled while maintaining the properties required by the industry is determined.

2. Materials and Methods

2.1. Materials

The raw materials used were ordinary Portland cement (OPC), sand, cellulose fibers, gypsum, an inclusion compound (IC), and recycled fiber cement (RFC). The sand was sea sand. Gypsum is generally used to facilitate the forming of fiber-cement products in the manufacturing process. The chemical compositions of the Portland cement, sand, and RFC were determined by X-ray fluorescence spectrometry (XRF, Panalytical, Minipal 4) which is shown in Table 1, based on stoichiometric oxides. The particle size of RFC and sand were determined by a laser particle-size analyzer (Sympatec-HELOS/BR-multirange with QUIXEL dispersing unit), which is shown in Figure 1b. The RFC powder, Figure 1a, was prepared by grinding the SR0 formula samples, with the composition given in a later section. The ground SR0 samples were sieved with a 100-mesh sieve (0.149-mm opening size) and dried at 100 °C for 24 h. After drying, the RFC was further ground to a size less than 200 μm, the common size of fine sand, by ball milling.
The IC is the blended chemical admixture used to enhance the properties of the fiber-cement samples. Two inclusion compounds (IC1 and IC2) were used. Inclusion compound IC1 was prepared from a mixture of lithium silicate, sodium thiocyanate, alkylbenzene sulfonate, and hydrochloric acid. Inclusion compound IC2 was prepared from a mixture of triethanolamine, sodium lignosulfonate, and calcium formate. Both inclusion compounds were produced under the licensing of the Shera Public Company Limited.
Lithium silicate is a chemical admixture that can improve freeze–thaw cycle resistance [27]. Sodium thiocyanate can improve the early rate of the hydration reaction in Portland cement [28]. Alkylbenzene sulfonate is the bio-degradable surfactant normally used in cleansing products and the air-entraining agent for cement-based composite materials [29,30]. Although hydrochloric acid can attack cement-based materials by reacting with calcium hydroxide [31,32,33], it was found that hydrochloric acid could be used to improve the pozzolanic reactivity of the waste such as agricultural waste [34].
Triethanolamine can enhance the chemical reaction between calcium sulfate and tricalcium aluminate (C3A) in Portland cement, and accelerate the setting of Portland cement [35]. Sodium lignosulfonate is a chemical admixture that can retard the setting of Portland cement, and reduce the amount of water required for mixing with Portland cement in concrete [36]. Calcium formate is an accelerating agent for Portland cement in concrete. According to Gebler [37], this chemical admixture can be used to increase the compressive strength of concrete.

2.2. Heat of Hydration Test

The cement pastes were prepared by mixing the raw materials based on the formula listed in Table 2 using a Hobart mixer for about 2 min. They were then put in the closed containers shown in Figure 2. The effect of IC1 and IC2 on the hydration reaction of OPC with/without the addition of RFC was studied by observing the temperature change in the containers due to the heat released from the hydration reaction of OPC with water. The amount of IC added to the cement pastes was 0.5, 1, 1.5, and 3% by weight of Portland cement. The formula Ref represents the cement paste without the addition of an IC. The temperature inside the container in Figure 2 was recorded every 30 s for 24 h by a temperature-data logger. This experiment was carried out based on the ASTM standard C186-98 [38].
The average rate of the temperature change from the initial to the maximum temperature was calculated by [19]:
R = T max T initial / t
where R is the average rate of temperature change, Tinitial and Tmax are the initial and maximum temperature inside the container, and t is the time used for the temperature change from Tinitial to Tmax.
After 24 h, the samples of the hardened cement paste were ground using a ball mill, sieved using a 200-mesh sieve, immersed in acetone for 7 days to stop the hydration reaction, and vacuum dried at 50 °C for 48 h. To identify the phases within the samples, the dried samples were characterized by techniques including X-ray diffraction (XRD, Bruker D8 Advance) and thermogravimetric analysis (TGA)/differential Scanning Calorimetry (DSC) (Mettler Toledo, TGA/DSC3+). For XRD, the scan was conducted using continuous scan mode, 0.02° 2θ step size, and a time per step of 96 s. For TGA/DSC, the heating rate was 10 °C/min.

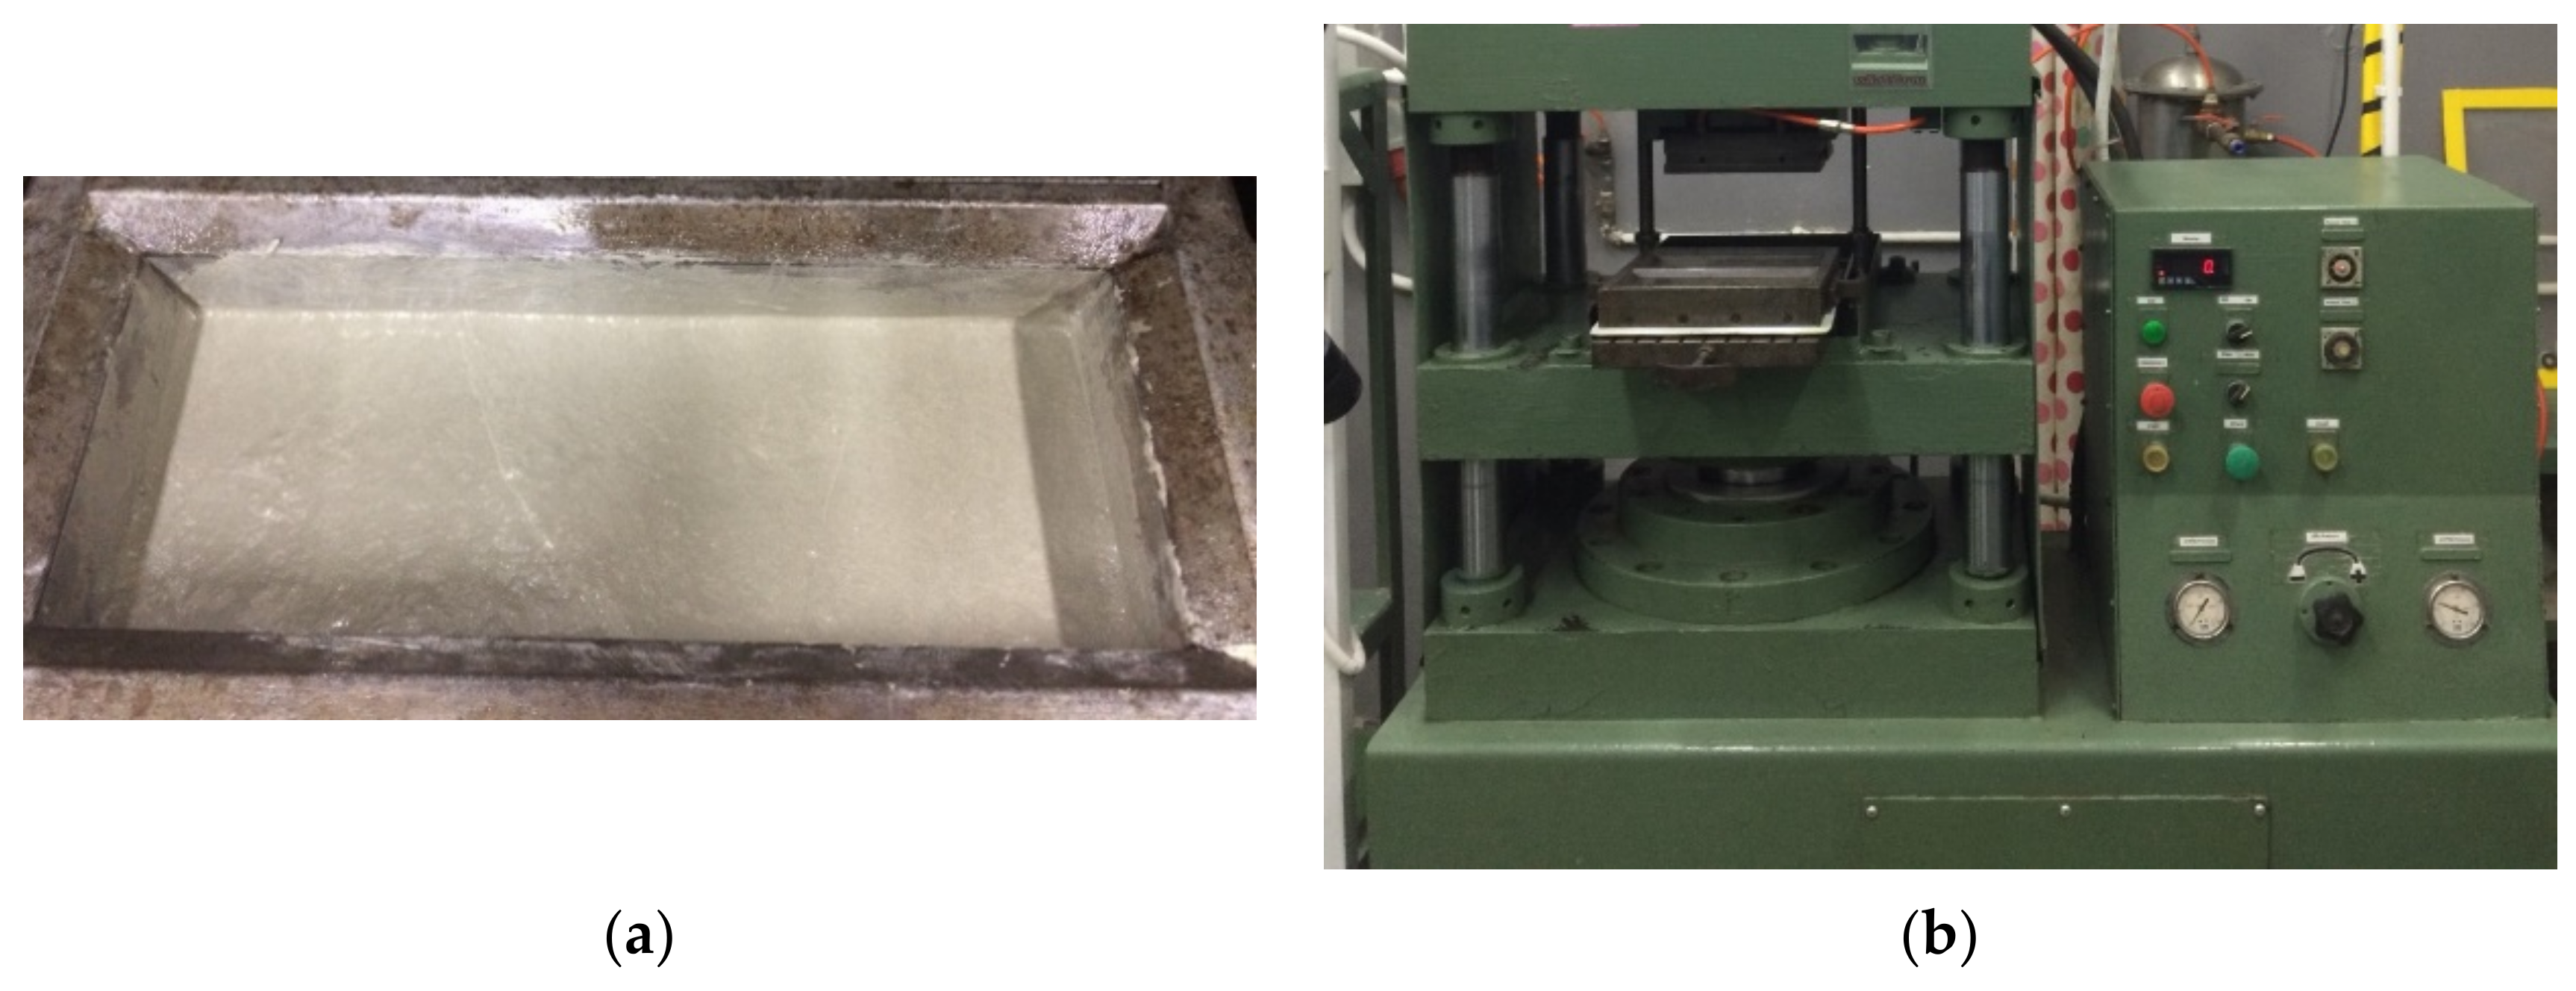
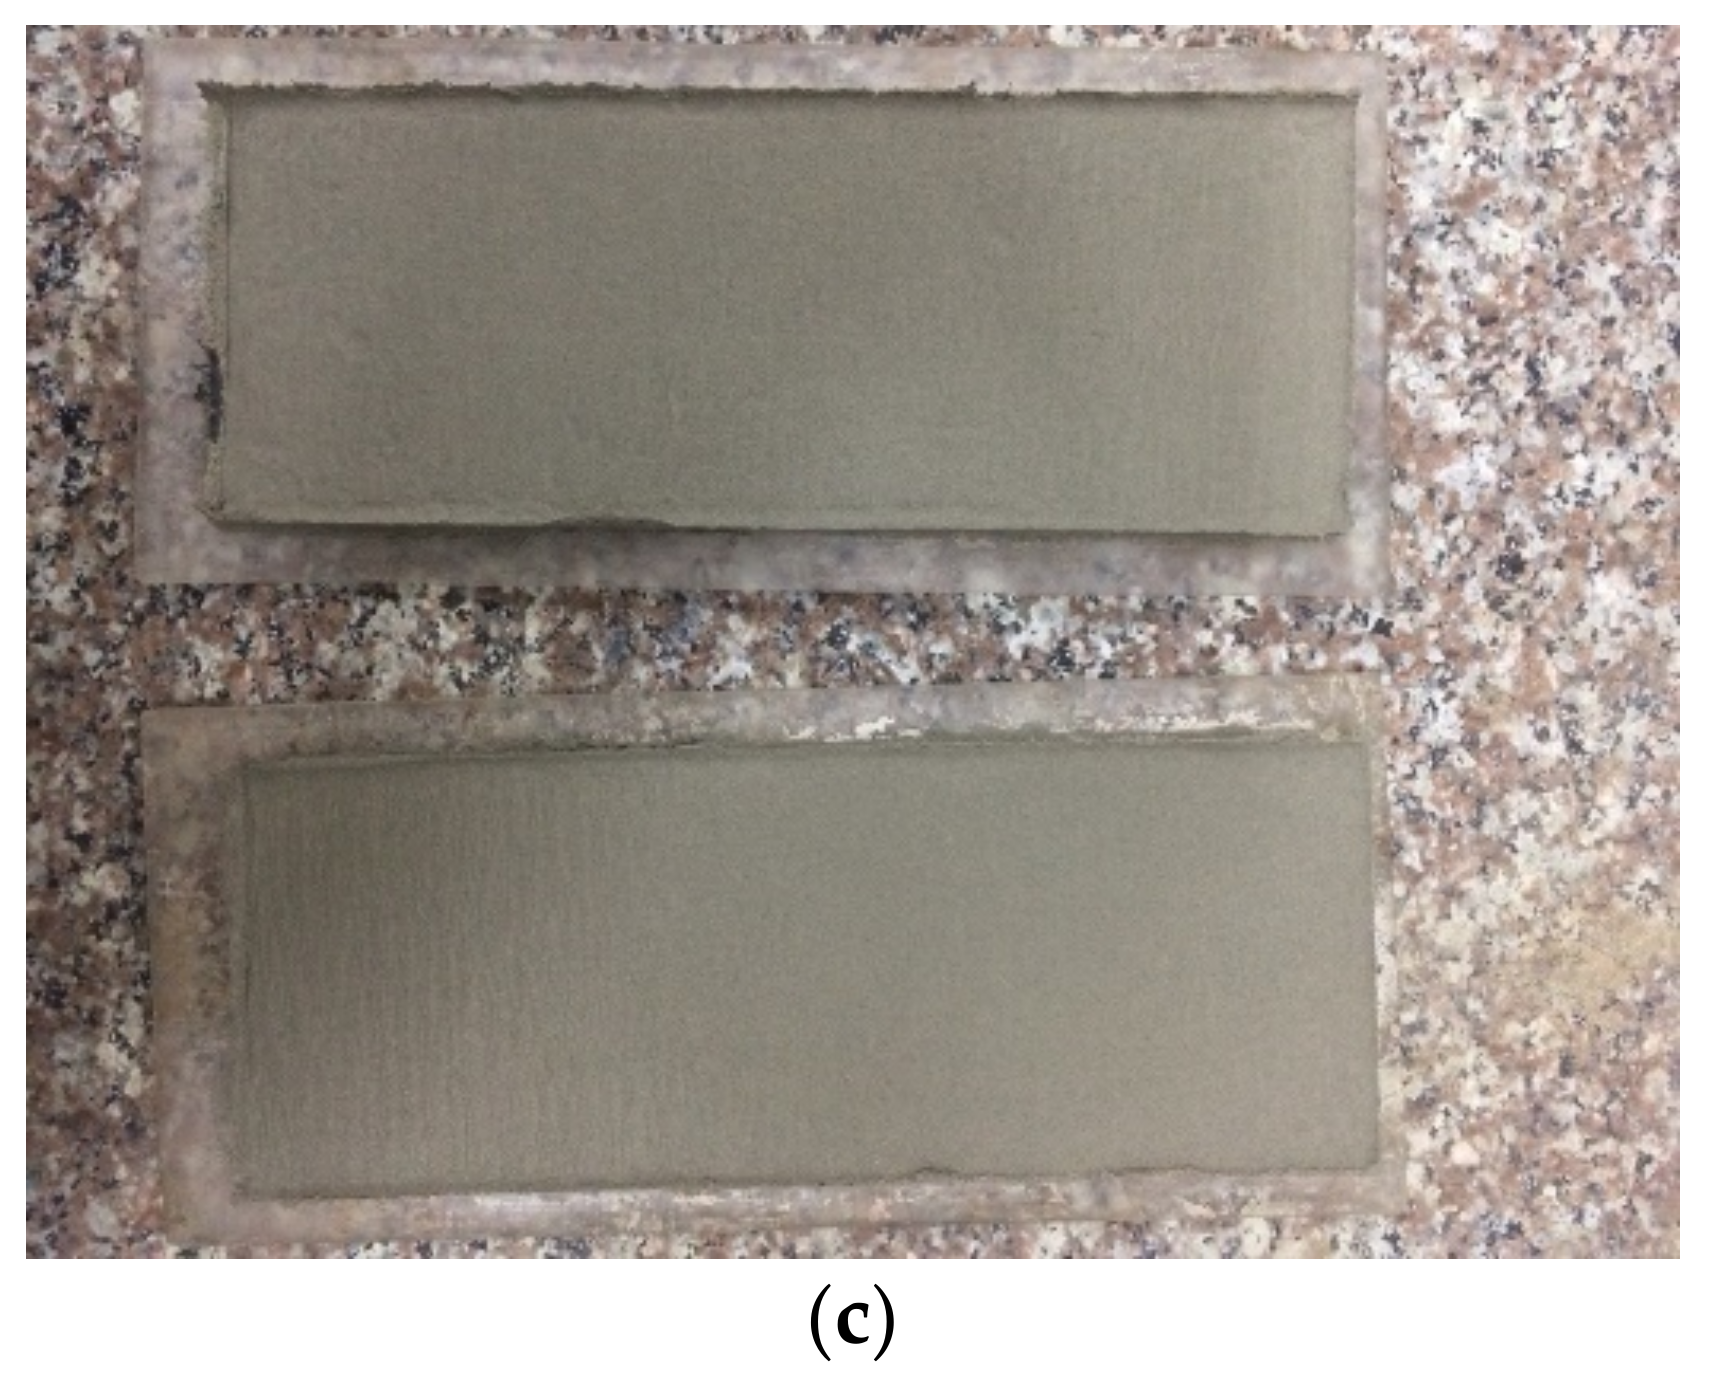
2.3. FC Sample Preparation

The mix design for preparing the FC samples is given in Table 3. Formula SR0 is the formula of the FC sample without the RFC. The RFC powder was added to replace the sand in formula SR0 by 25, 50, 75, and 100%. In all cases, the water-to-cement ratio was 0.35, and the IC 1 was added to be 1% of OPC weight in the dry mixture, determined from the heat of hydration test (Section 2.2).
Initially, cellulose fibers and water were mixed using the Hobart mixer for 5 min. Subsequently, the sand and/or RFC and IC were added, respectively, and the mixing continued for another 5 min. After that, OPC was added and mixed with other raw materials for another 5 min until the mixture became homogeneous. The mixture was then transferred to the mold as shown in Figure 3a. The FC samples were formed by the filter-pressing method using the instrument shown Figure 3b. The applied pressure for sample forming was 1 MPa. The green sample size, shown in Figure 3c, is 7.5 cm × 20 cm × 0.7 cm. The green samples were air cured for 1 day and then cured in an autoclave at 180 °C and 10 atm for 16 h.

2.4. Characterization of the FC Samples

2.4.1. Mechanical Testing and Density Measurement

The mechanical test and bulk-density measurements were conducted based on ASTM standard C1185 [39] and BS EN standard 12,467 [40]. After curing, the FC samples were characterized for their modulus of rupture (MOR), modulus of elasticity (MOE), and toughness by the three-point bending test using a universal testing machine (UTM, Instron 3300 series) using a sample deflection rate of 20 mm/min. The impact resistance of the samples was measured by a pendulum impact test. The amount of the energy absorbed was determined from the change in height of the pendulum after hitting the sample. Five FC samples were used for each test. The mechanical test was done on the samples in a wet condition. Therefore, the FC samples were soaked in water for a period of 1 day at room temperature prior to the test.
Bulk density measurement was conducted using the Archimedes method. Five FC samples from each formula were used for the test. Initially, the FC samples were dried at 100 °C for a period of 4 h and then weighed. Next, the FC samples were autoclaved at 180 °C and 4 atm for 2 h until the samples were saturated with water. After being taken out of the autoclave, the samples were weighed again. The samples were then suspended underwater and weighed once again. Equation (2) is the equation used to calculate the bulk density.
D = w d / w s w su
where D is bulk density (g/cm3), wd is the weight of the dry FC sample, wsu is the weight of the FC sample suspended in the water, and ws is the weight of the FC sample saturated with water by autoclaving.

2.4.2. Durability and Recyclability Test

After the mechanical tests described in Section 2.4.1, the FC samples SR25 to SR100, those with the most suitable mechanical properties, were further tested for durability and recyclability.

Freeze–Thaw Test, Heat Conductivity Test, and Flammability Test

A freeze–thaw test was conducted based on the process described in ASTM standard C1185 [39]. The freezing temperature was −20 ± 2 °C and the thawing temperature was 20 ± 2 °C. A freeze–thaw cycle took about 4 h. After 50 cycles, the mechanical testing was conducted on the samples. Five samples were used for the test.
Heat conductivity (K-value) was measured based on the method described in ASTM standard C177 [41]. Three samples were used for the test. The test temperatures were 50 °C and 20 °C for the hot plate and cold plate, respectively. During the test, the room temperature was 23 ± 2 °C, and the relative humidity was 50 ± 5%RH.
The process for flammability test was based on ISO standard 11925-2 [42]. Three flame angles were used, 45°, 90°, and 180°. The sample ignition was observed after exposure to the flame for 15 and 30 s.

Recyclability

The FC samples were recycled as RFC up to 50 times and used as a raw material for making new FC samples. After 5, 10, 15, 20, 25, 30, 40, and 50 iterations of recycling, the MOR, MOE, toughness, impact resistance, and bulk density of the FC samples were characterized based on ASTM standard C1185 [39] and BS EN standard 12,467 [40]. Variation in these properties was observed.

3. Results and Discussion

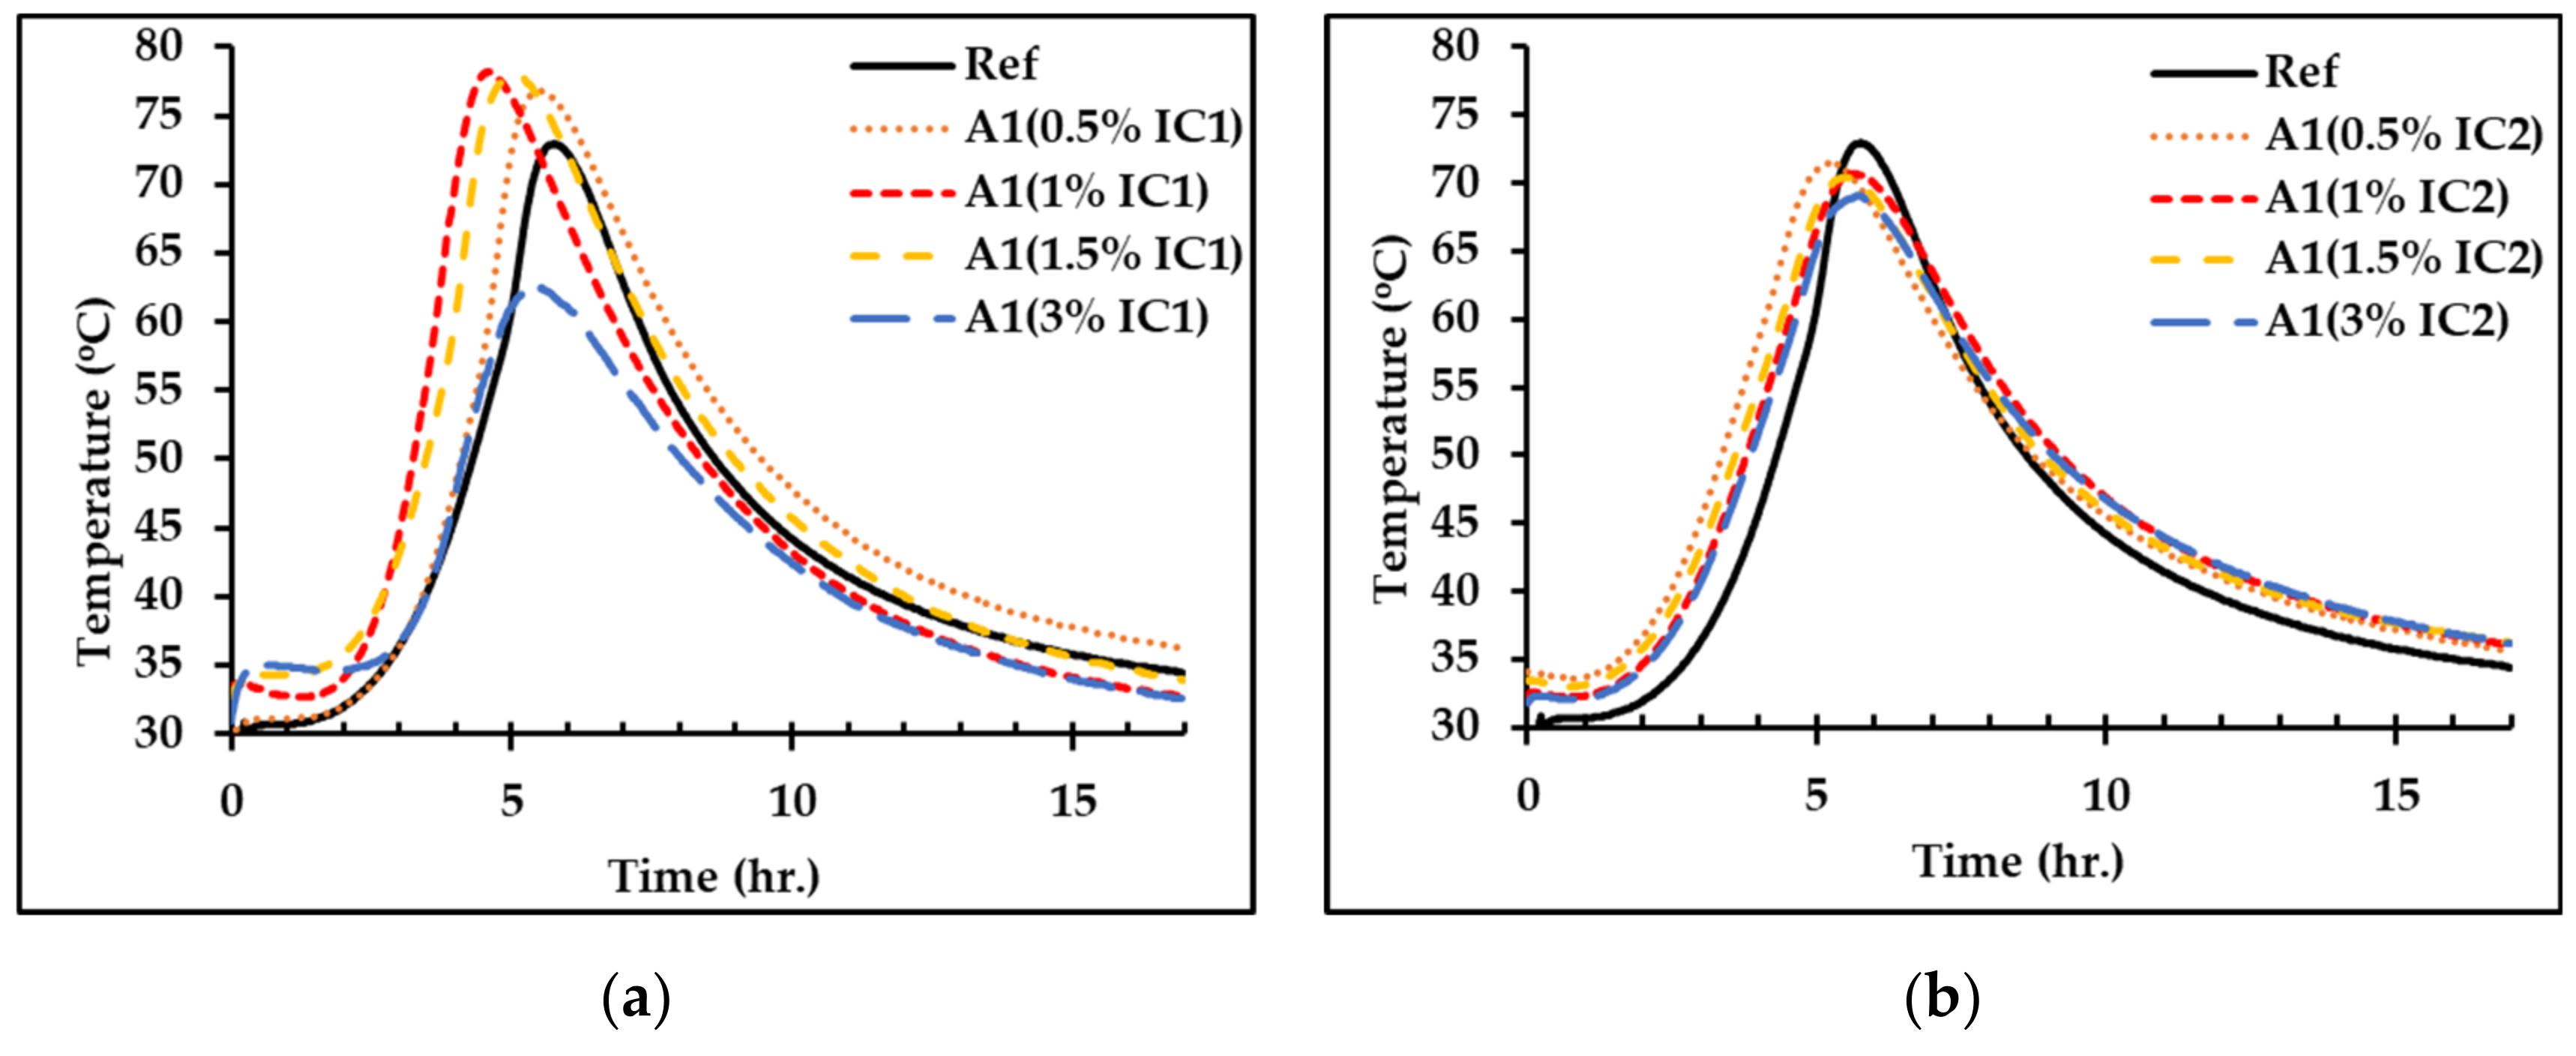
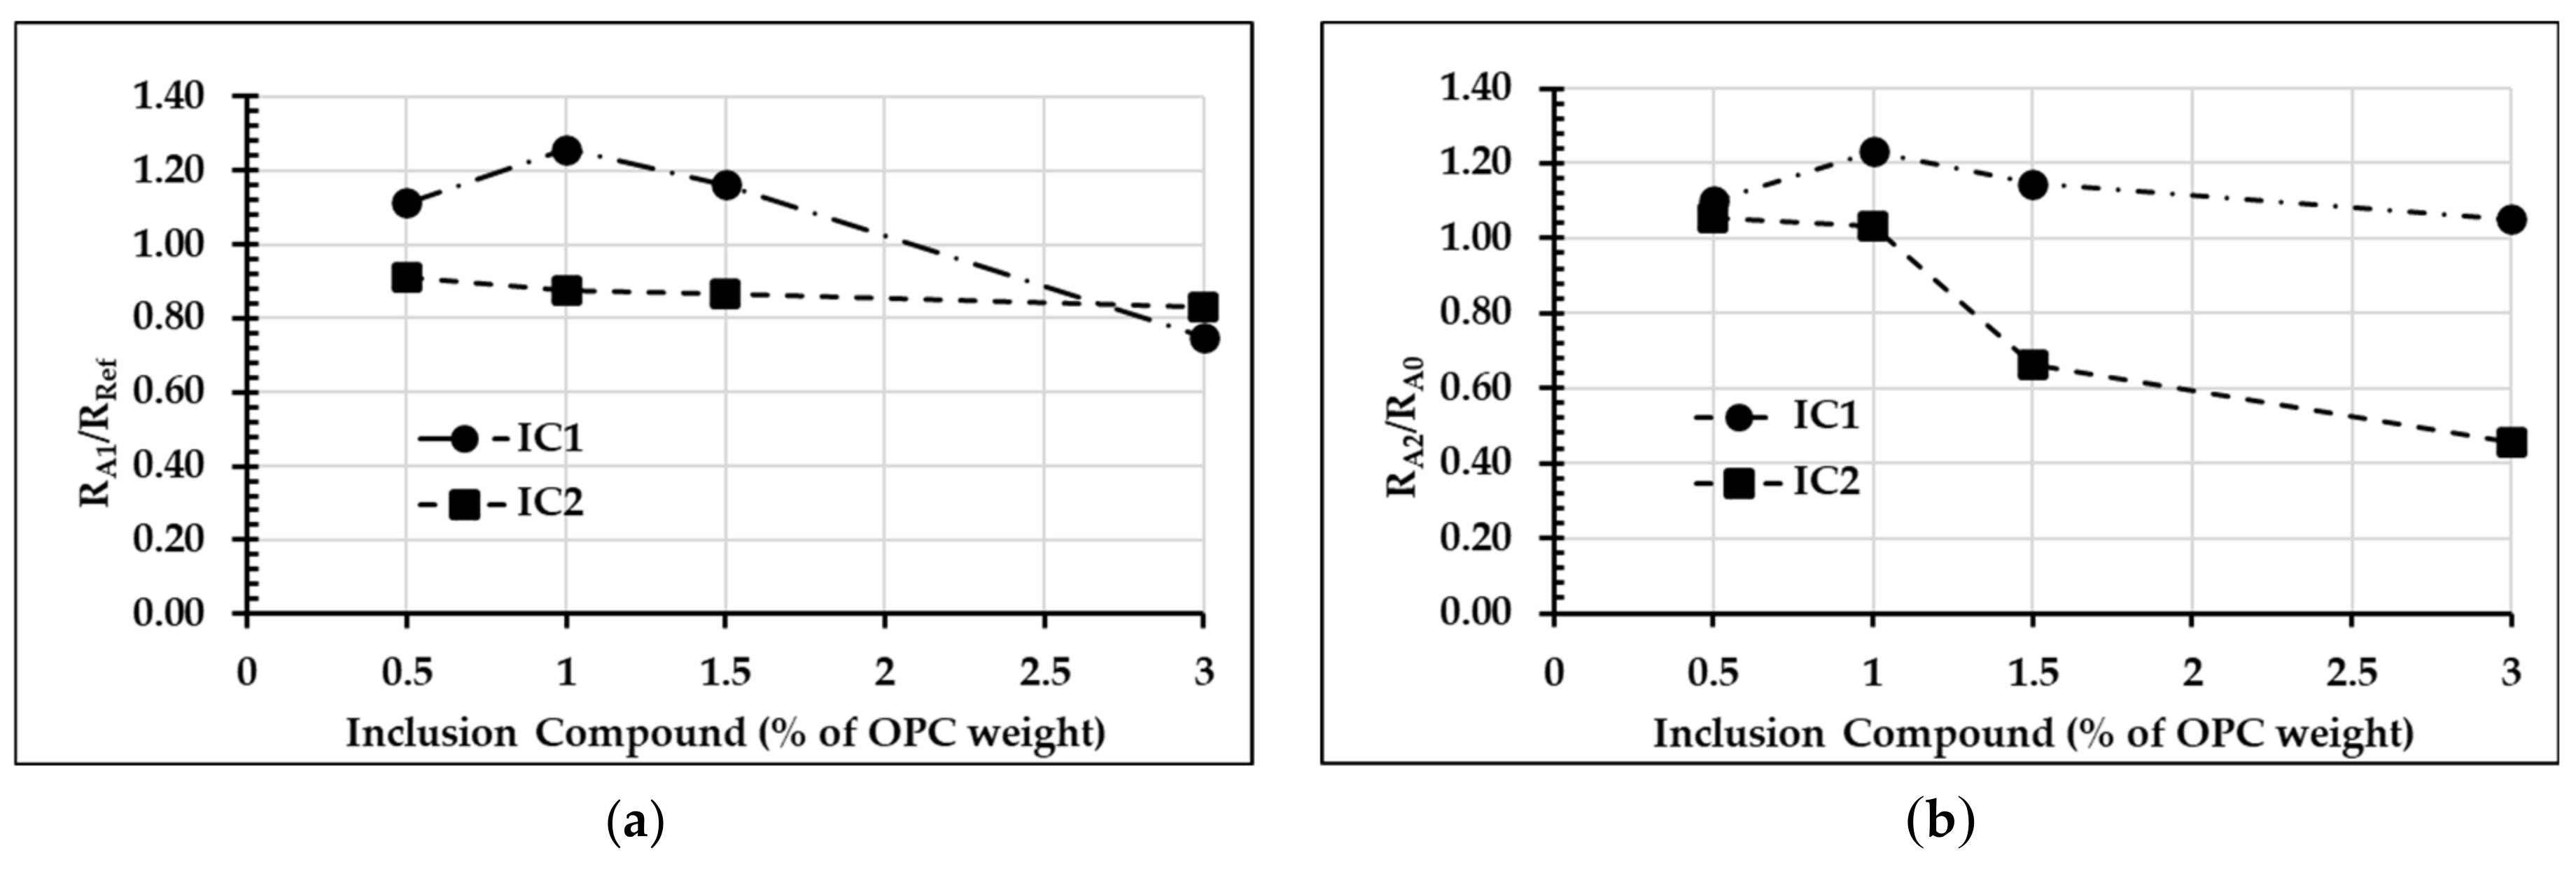
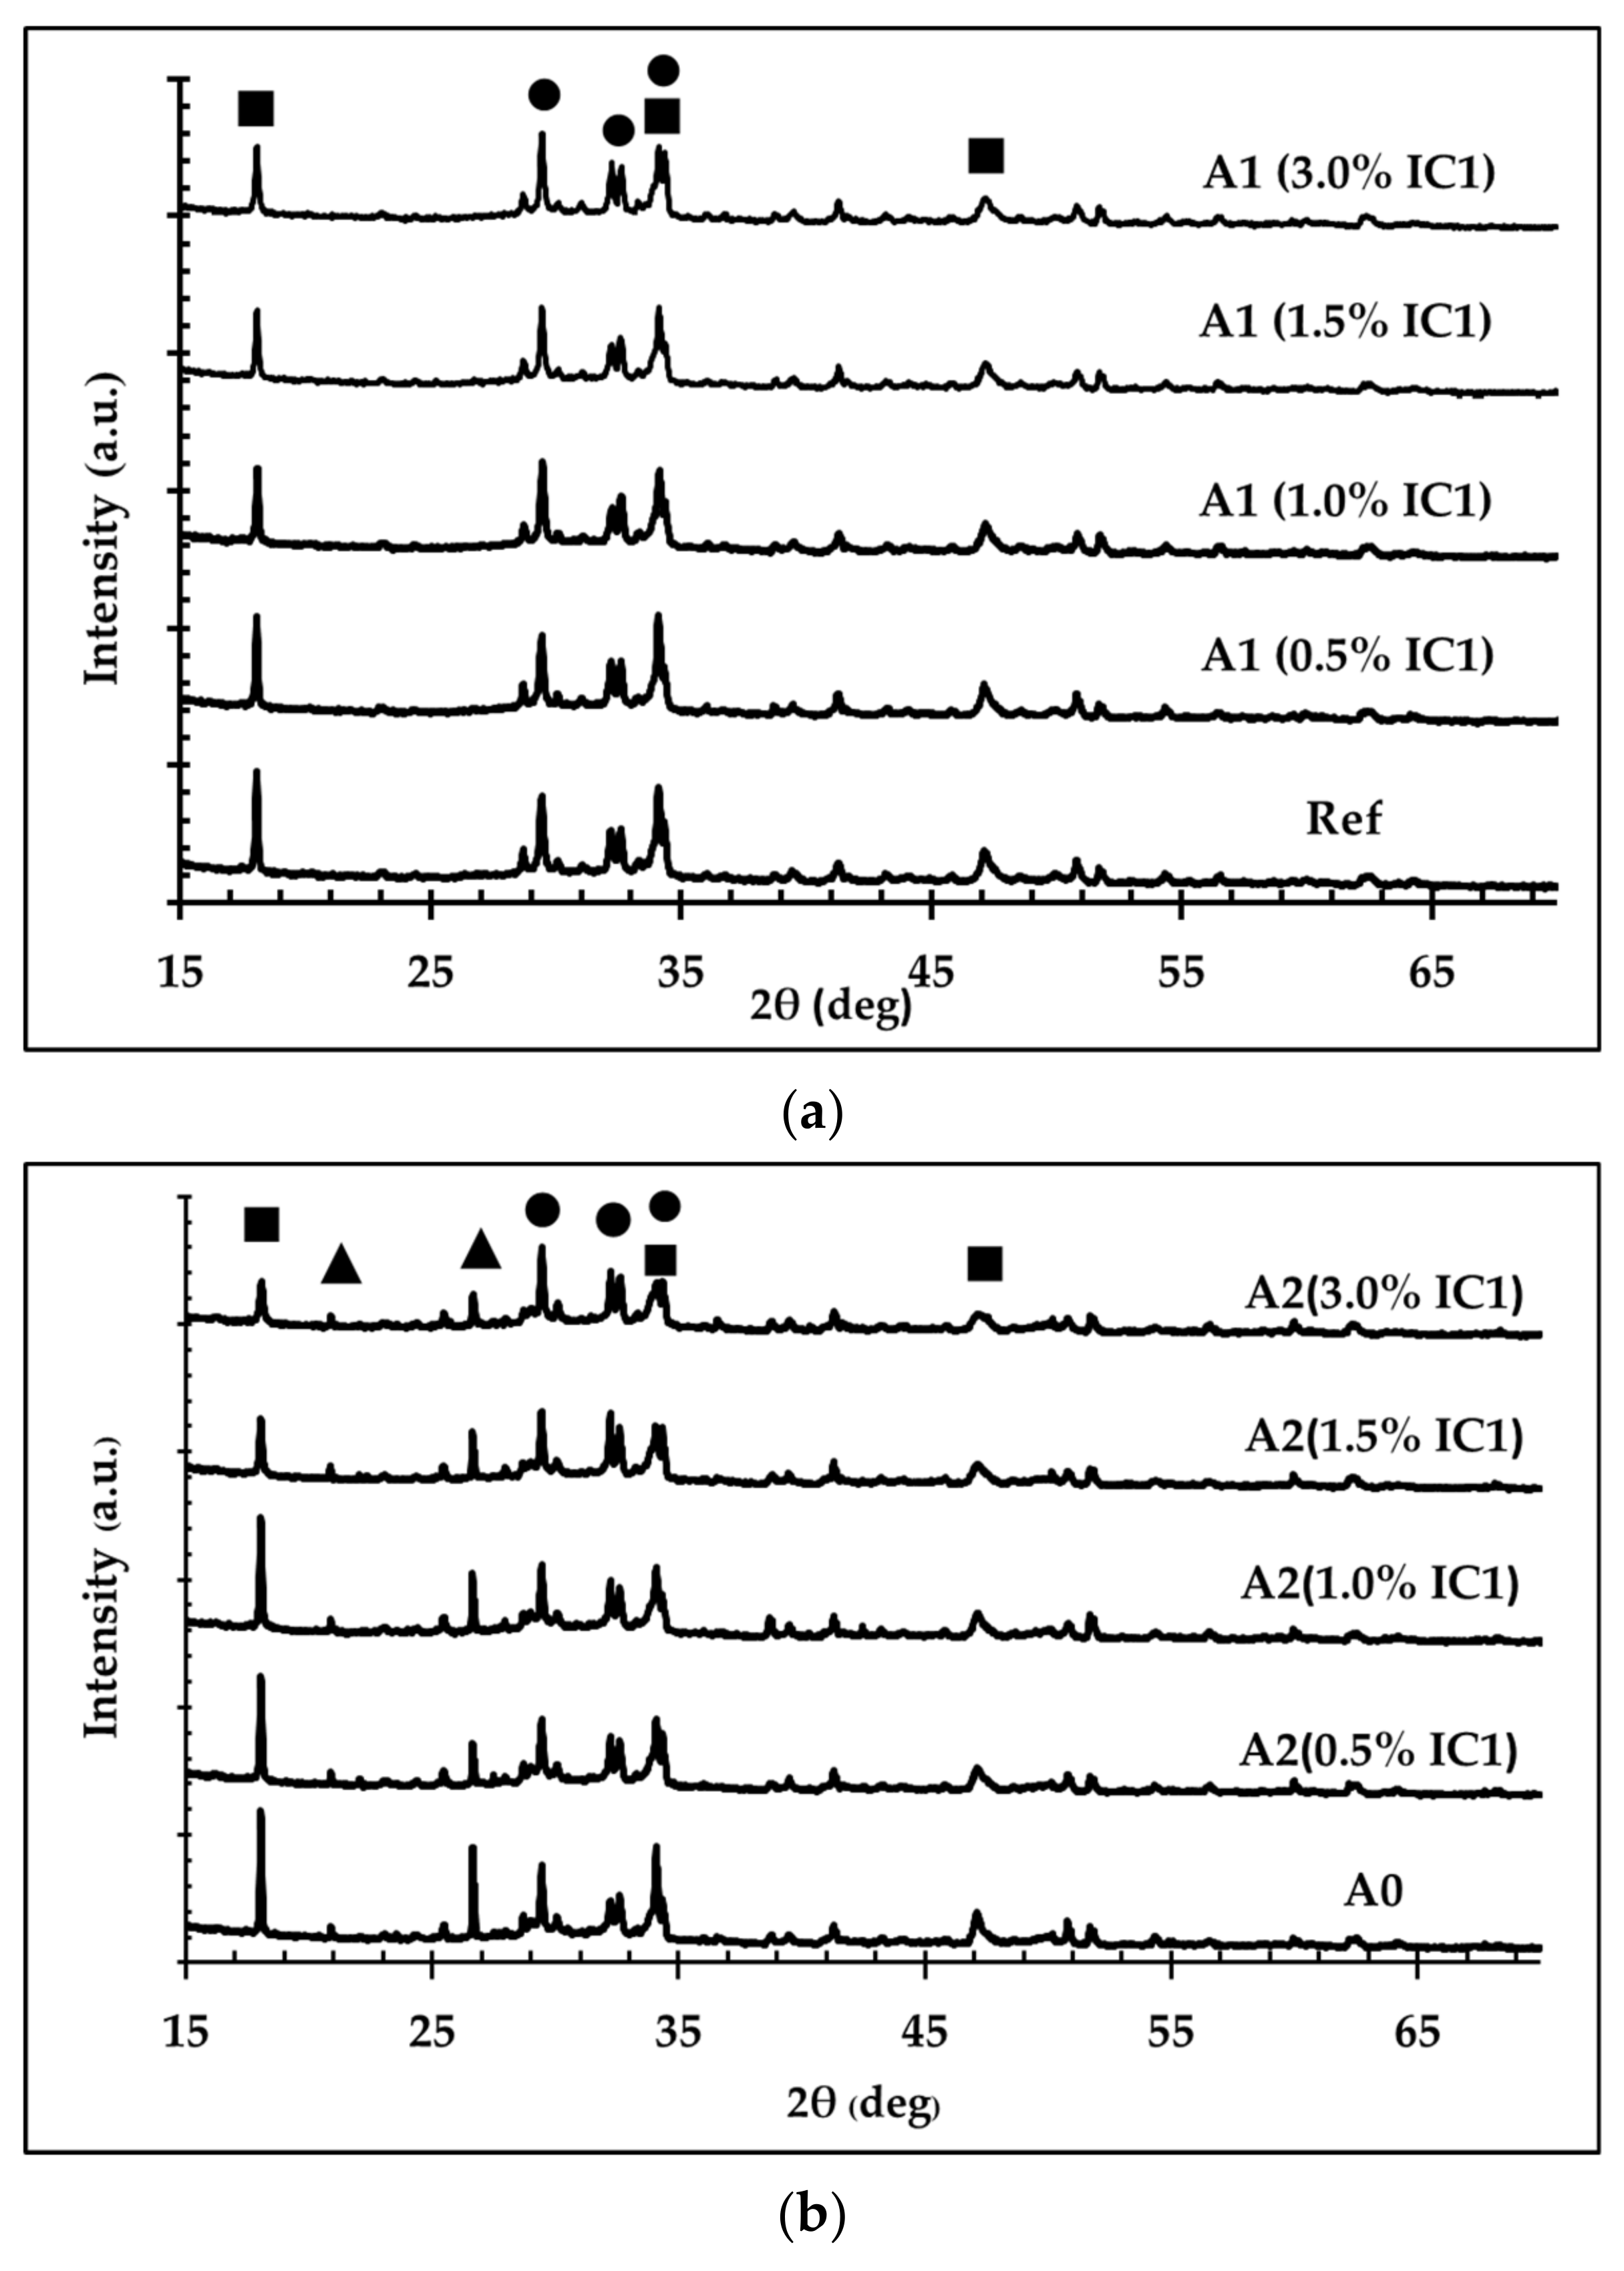
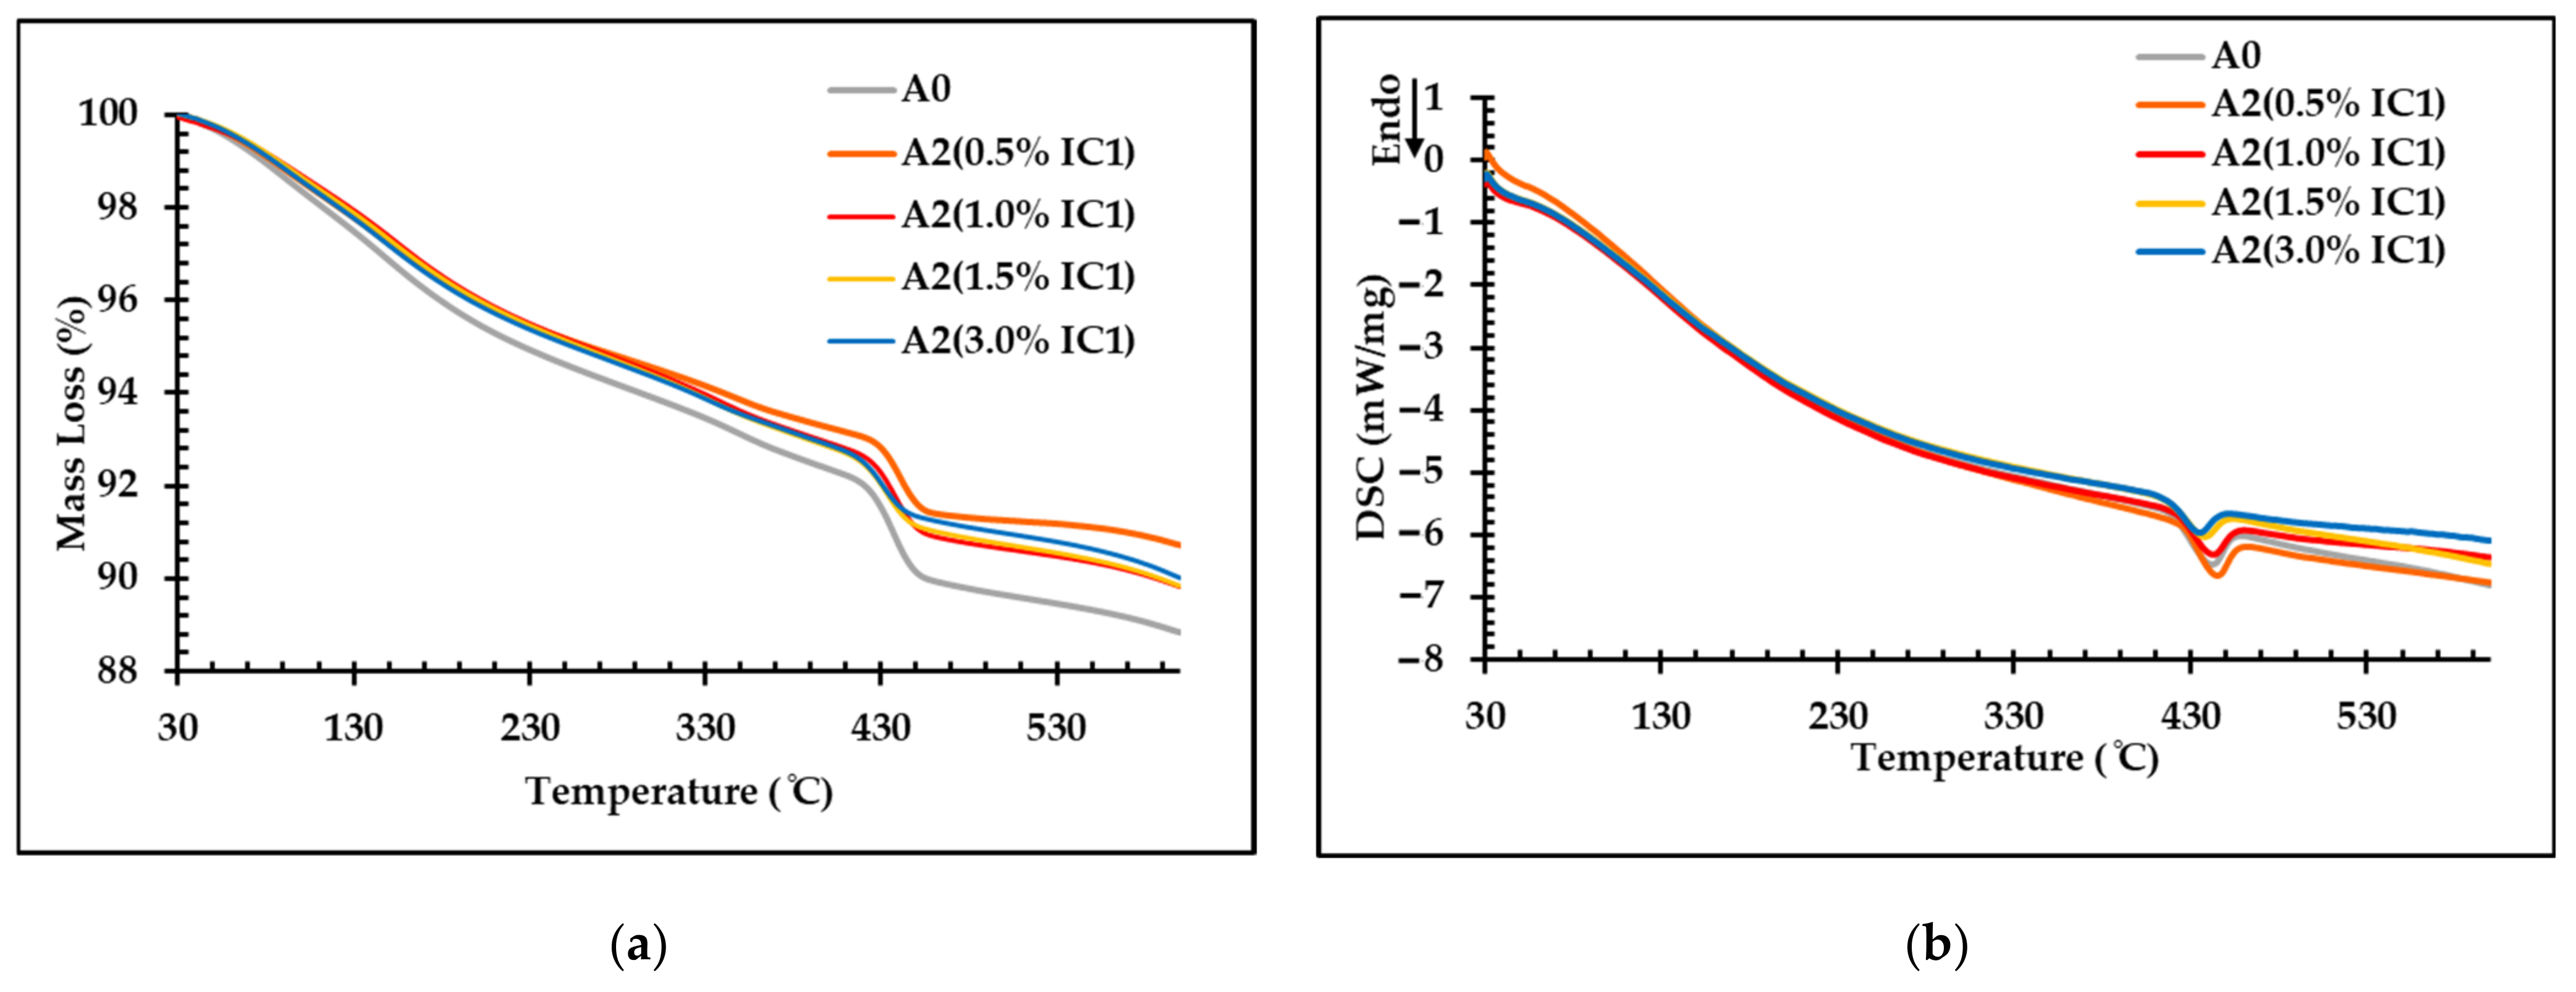
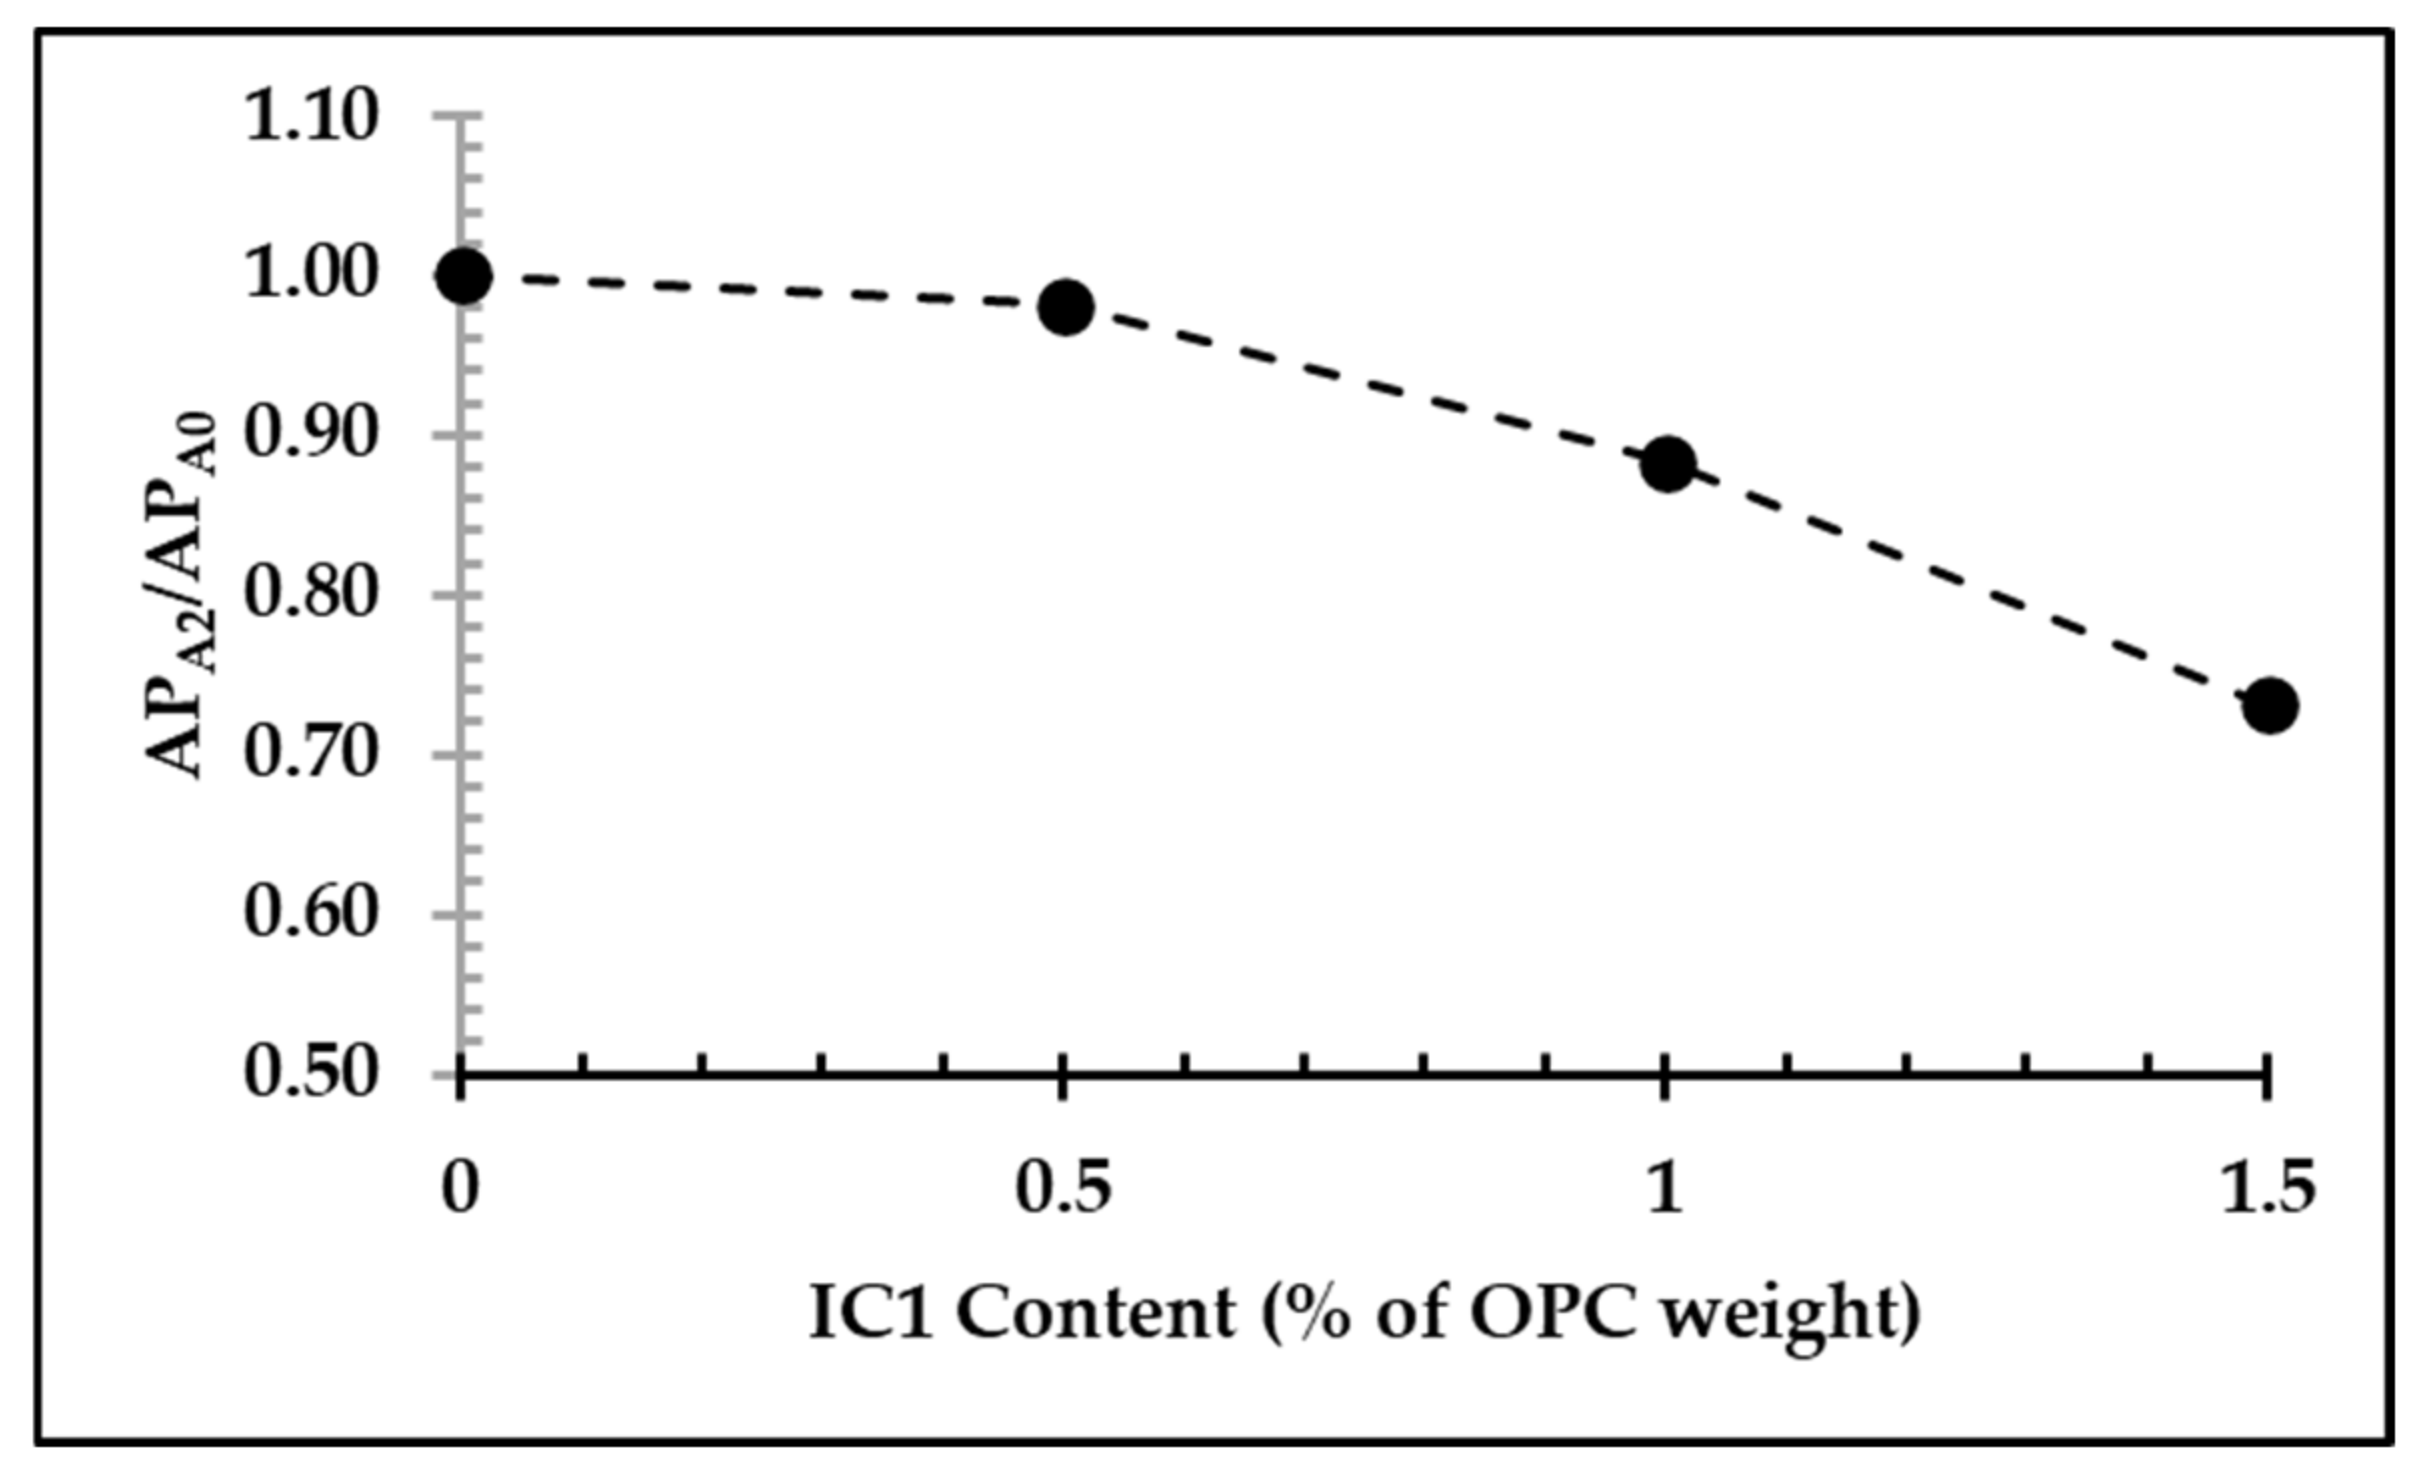
3.1. Effect of Inclusion Compounds on the Hydration Reaction of OPC

The results from the heat of hydration test are given in Figure 4. The initial and maximum temperature and the time to reach the maximum temperature are listed in Table 4. The average rate of the temperature change RRef, RA0, RA1, and RA2 are calculated by Equation (1) and provided in Figure 5 as the RA1/RRef and RA2/RA0 ratios. RRef, RA0, RA1, and RA2 are the average rate of temperature change of formulas Ref, A0, A1, and A2, respectively. Obviously, when IC1 was added at 1% of OPC weight, those ratios reach the maximum. For IC2, both RA1/RRef1 and RA2/RA0 ratios are lower than IC1. Moreover, when the percentage of IC2 is greater than 0.5% of OPC weight, both the RA1/RRef1 and RA2/RA0 decrease.
The increasing temperature during the heat of hydration test is mainly from the hydration reaction of tricalcium silicate ( 3 CaO · SiO 2 , referred to as C3S), with water, shown by Equation (3), which produces calcium silicate hydrate (3CaO·2SiO2·3H2O, referred to as C-S-H) and calcium hydroxide (Ca(OH)2, referred to as CH) [43,44].
2 3 CaO · SiO 2 + 6 H 2 O 3 CaO · 2 SiO 2 · 3 H 2 O   +   3 Ca OH 2
Based on the XRD results of the samples after the heat of hydration tests, the CH (PDF no. 01-081-2040) and C3S (PDF no. 01-070-8632) phases are identified in both Figure 6a,b. The CH phase is from the hydration reaction and the C3S unreacted phase remain in the OPC. Additionally, the quartz (SiO2, PDF no. 01-085-0795) phase is identified in the A2 formula, Figure 6b. This phase should be from the RFC added to produce A0 and A2 samples. Because the C-S-H phase is amorphous, no crystalline pattern is observed from this phase, but it does show a diffuse background increase between 25–40° 2θ in the patterns in Figure 6 [45,46]. The peak-to-background ratios of the CH peak from Figure 6 at about 18.04° appear to decrease with increasing IC1 content, Figure 7. Hence, when IC1 in the dry mixture is increased, there is less CH left after the heat of hydration test.
Results from the DSC/TGA analysis of the samples after the heat of hydration test are shown in Figure 8. From the TGA results in Figure 8a, there is continuous mass loss between 80 and 420 °C due to the dehydration of C-S-H and other products from the hydration reaction. Moreover, between 400 and 460 °C, the instantaneous mass loss from the dehydroxylation of CH is identified and causes the endothermic peaks on DSC results in Figure 8b [27,47,48,49,50].
The area under the endothermic peaks (AP) in Figure 8b are calculated using the numerical method and shown in Figure 9 as the relative values APA2/APA0. The area under the endothermic peaks APA0 and APA2 are from the samples A0 and A2, respectively. As the amount of IC1 increases, relative area APA2/APA0 decreases. Therefore, supporting the XRD results, the DSC/TGA results also indicate that there is less CH in the A2 samples when the percentage of IC1 increased.
As mentioned in Section 2.1, IC1 was prepared from various additives. The lithium silicate Li2O·nH2O (LS) [27] in the IC1 mixture can react with CH and produce C-S-H as shown by Equation (4) and accelerate the cement-setting time.
Li 2 O · nSiO 2 + mH 2 O + nCa OH 2 nCaO · SiO 2 · m + n 1 H 2 O + 2 LiOH
Thus, when IC1 was added, CH was consumed at a higher rate due to LS causing a reduction in the CH phase in both the A1 and A2 samples, Figure 7, and APA2/APA0 ratios in Figure 9 for the A2 samples.
During the hydration reaction, the heterogeneous nucleation of C-S-H can occur over the surface of cement particles. Moreover, RFC can also provide an additional nucleation surface for C-S-H in the A0 and A2 samples [51]. According to our previous work, the hydrochloric acid in IC1 could dissolve the surface of the RFC powder, making RFC more active for C-S-H nucleation [22].
The factors such as the inward diffusion of water through C-S-H layers and particle impingement affect the hydration rate [52,53]. Represented by the average rate of the temperature change (R), LS in IC1 could accelerate the hydration reaction, Figure 5. When IC1 is over 1% of OPC weight, a reduction in the hydration reaction rate occurs, Figure 5. This reduction should be from the lower diffusion rate of water through the C-S-H layer due to a thicker layer of C-S-H over the cement particles, and the reduced interfacial area between the C-S-H layer and water due to particle impingement, Figure 10. Because it achieved the highest hydration rate, IC1 was selected to be added to the mixtures for making FC samples (Section 2.3) at 1% of OPC weight.

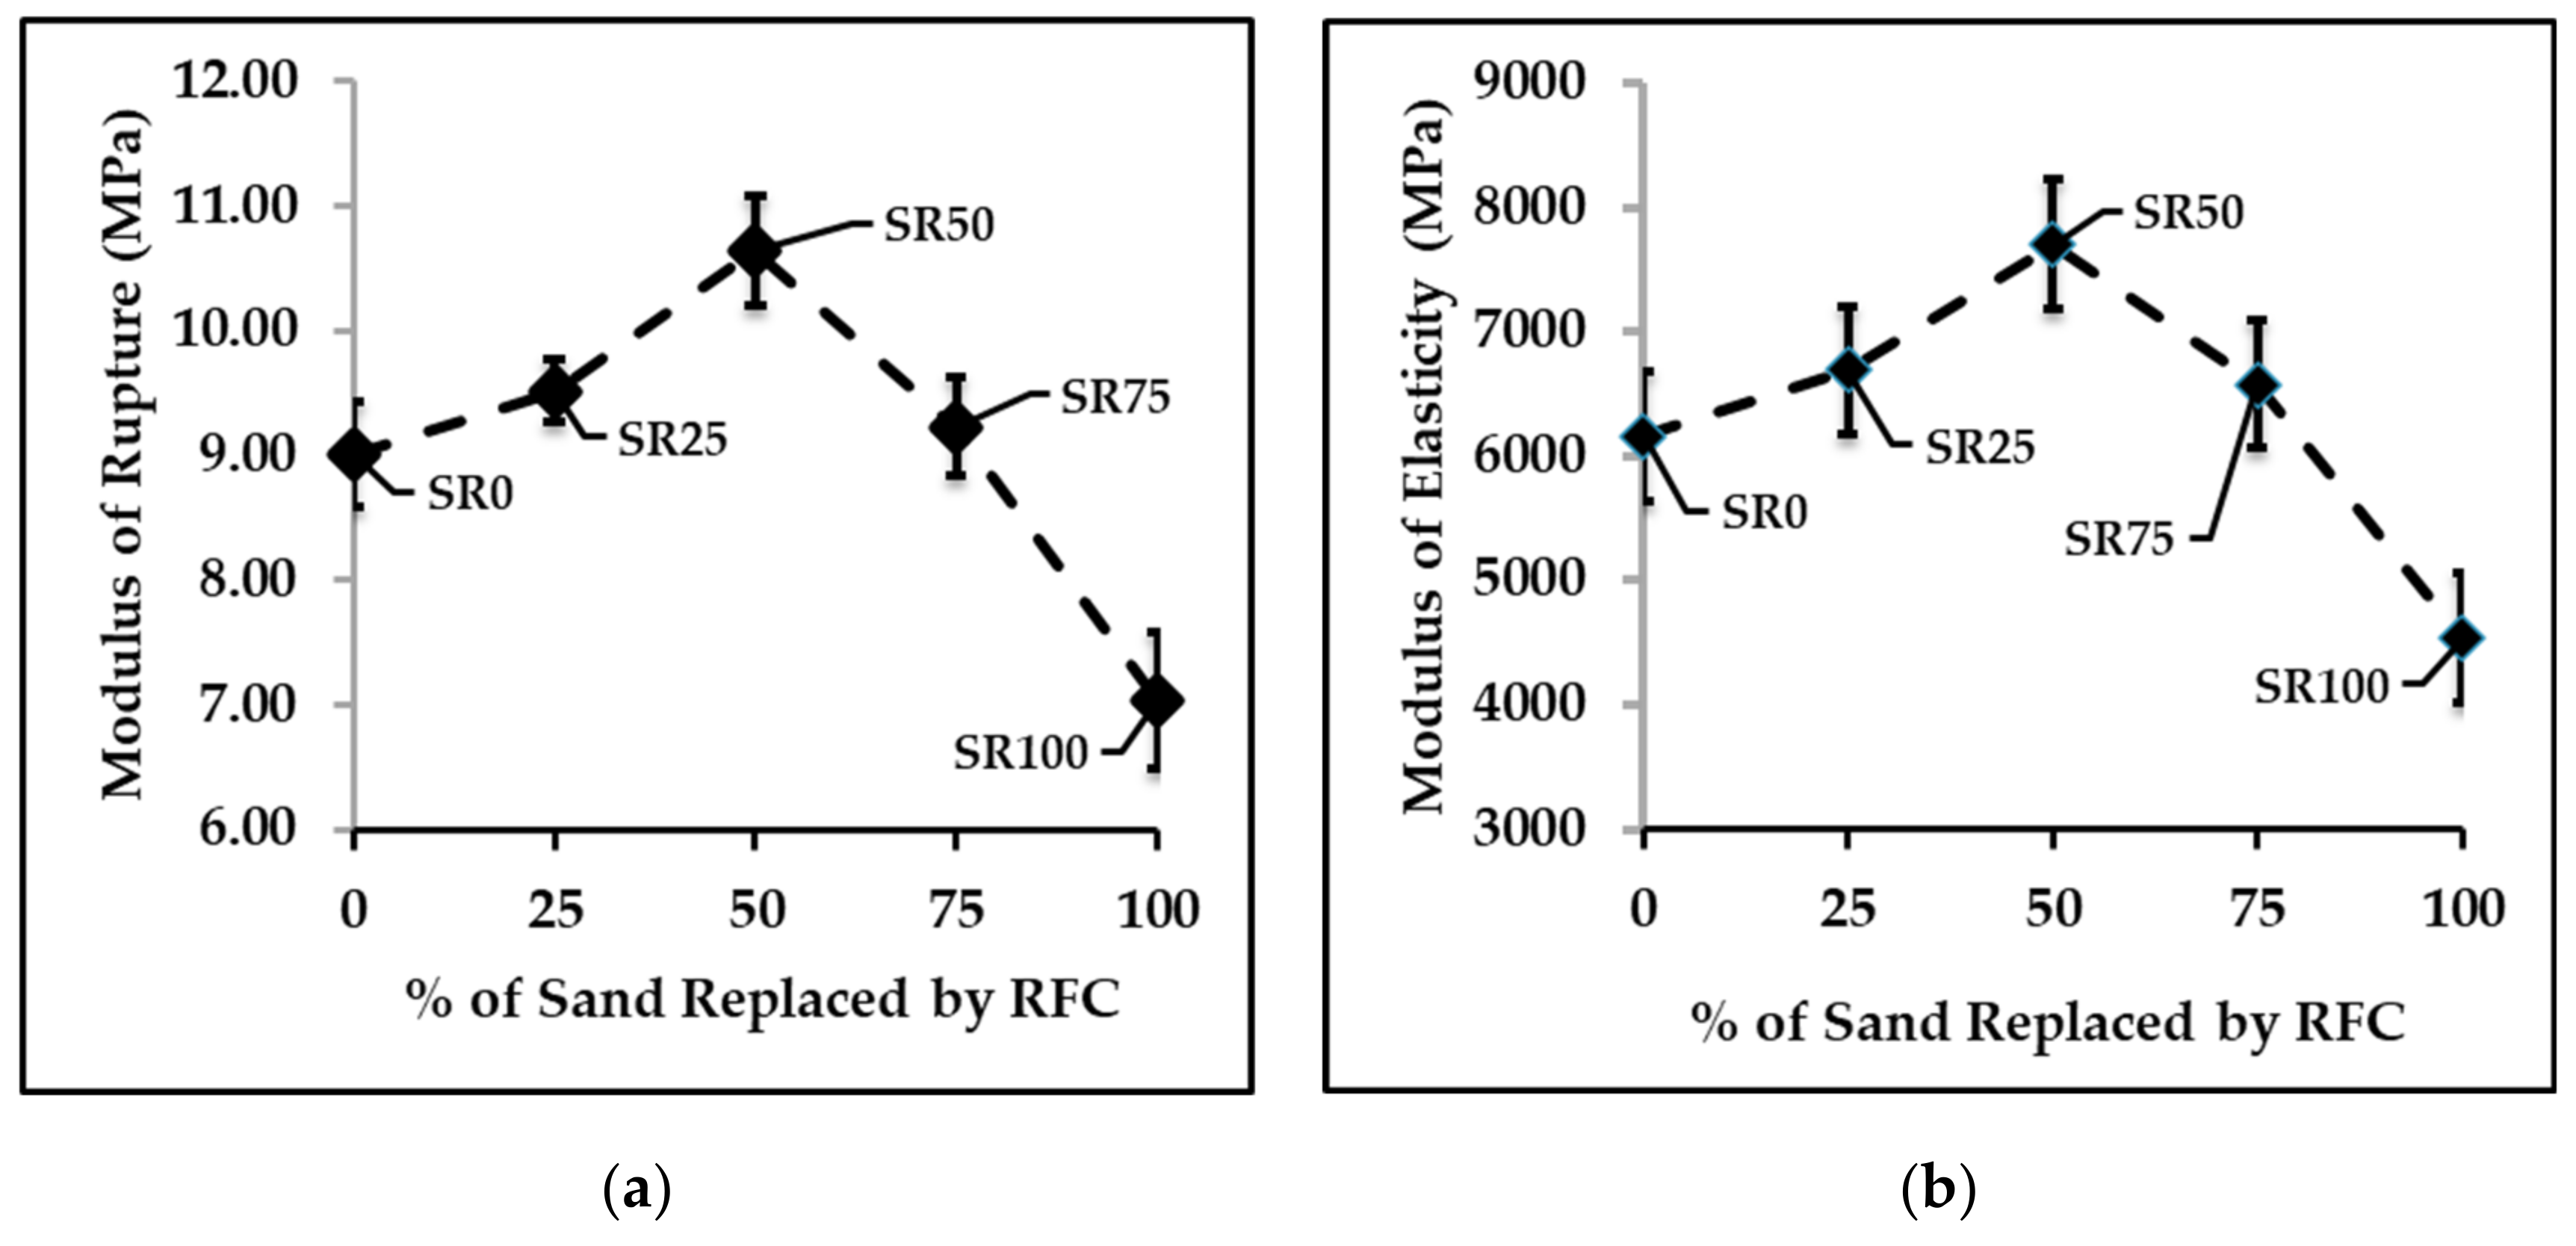
3.2. Mechanical and Physical Properties of FC Samples

Various properties of the FC samples are shown in Figure 11. Based on the experimental results from Section 3.1, IC1 was used as the chemical admixture in all of these measurements. In general, FC products in the market adhere to ASTM standard C1186 [54] and TIS standard 1427 [55] specifications, namely, that the MOR of the FC products must be at least 4 MPa and the bulk density must be between 1.3 and 1.4 g/cm3. The average MOR and density of SR0 to SR75 passed the requirements of both industrial standards; the SR100 did not. Among the qualified samples, the average MOR, MOE, toughness, impact strength, and bulk density of SR50 samples were highest.
The SEM micrographs of FC samples consisted of the plate-shape phase called tobermorite, the crystalline form of C-S-H [56], Figure 12. Plate-shape tobermorite is normally obtained from a heterogenous nucleation mechanism [57]. In this work, the amount of IC1 and the autoclave-curing condition were the same in all formulas. However, there was variation in the percentage of sand replacement by RFC. These RFC particles are heterogeneous nucleation sites for tobermorite. The microstructure of SR0, SR25, and SR50 samples contains both small and large plate-shape tobermorite, while the microstructure of SR75 and SR100 samples primarily contains large plate-shape tobermorite.
From Table 3, the fraction of the reinforcement phase (cellulose fibers) in all formulas is the same. Therefore, the change in properties of the FC samples was from the cement-matrix phase. As discussed in our previous work [58], the mechanical and physical properties of FC samples are affected by tobermorite. Wongkeo et al. [59] studied the properties of autoclaved concrete blocks (referred to as AAC) and found that the presence of tobermorite reduces the porosity of AAC. Generally, the mechanical properties of ceramics are related to the void size [60]. When the porosity becomes lower, bulk density, MOR, and MOE become higher [59,61]. The fracture energy of materials can be represented by the toughness and impact strength. According to Loan and Mariana [62], porosity lessens the cross-sectional area to be fractured. Therefore, fracture energy increases with the reduction in porosity.
For our results, at 25% and 50% sand replacement (SR25 and SR50 samples) the presence of tobermorite with size variation should reduce the porosity of FC samples leading to the increasing of bulk density, MOR, MOE, toughness, and impact strength. With the large plate-shape tobermorite as the primary phase for SR75 and SR100 samples (75% and 100% sand replacement), the packing efficiency of tobermorite phase is inferior, causing a reduction in all properties including bulk density, MOR, MOE, toughness, and impact strength. Based on these results, SR50 samples are the most suitable for further study.

3.3. Freeze–Thaw Resistance of FC Samples

The properties of the SR0 and SR50 samples after the freeze–thaw resistance test are provided in Figure 13. Although there are significant reductions in the MOR after the test, the MOR of both formulas still passed the industrial standards, ASTM standard C1186 [54] and TIS standard 1427 [55]. For other mechanical properties, toughness and impact strength remain unchanged while the reduction in the MOE of each formula was about 15 to 18%, which is still within an acceptable range of the industry standards.
This enhanced freeze–thaw resistance of the FC samples is from LS, alkylbenzene sulfonate (ABS), and sodium thiocyanate (NaSCN) in IC1. The LS enhances the freeze–thaw resistance by forming micro and mesopores which prevent the freezing of water within these pores due to the limited space [27]. The ABS is an air-entraining agent for the forming of microscopic pores that can improve the freeze–thaw resistance of cement-based composite materials [30]. In addition, according to Wise et al. [28], besides being an accelerator for the hydration reaction at low temperatures, the addition of NaSCN into the cement-based material could prevent the freezing of water within the microstructure as well.

3.4. Thermal Conductivity and Flammability of FC Samples

In construction materials, thermal conductivity, k, represents the rate that heat is transferred through the material due to the temperature gradient between two sides of a material, such as the outdoor and indoor temperature. If thermal conductivity of the wall panel or the roof is lower, there is a lower heating or cooling expense, and thus a reduction in the greenhouse gas emission, due to a lower energy consumption.
The general thermal conductivities of various construction materials are listed in Table 5 and shown on Figure 14 as the dashed lines. Obviously, from Figure 14, the average thermal conductivities of SR0 and SR50 samples are similar and are significantly lower than that of the construction materials listed.
Flammability represents how easy the construction material is ignited by a flame [63]. The flammability test results of SR0 and SR50 samples are shown in Table 6. Obviously, both samples passed the test. According to Kim [64], the matrix phase of a composite should determine the flammability of that material. In our case, cement is the matrix phase for SR0 and SR50 samples; however, the cellulose fibers are flammable. There are reports showing that LS and NaSCN can be used as a flame retardant for organic materials [65,66]. Therefore, the LS and NaSCN in the IC1 should improve the flame resistance of both SR0 and SR50 samples as well.

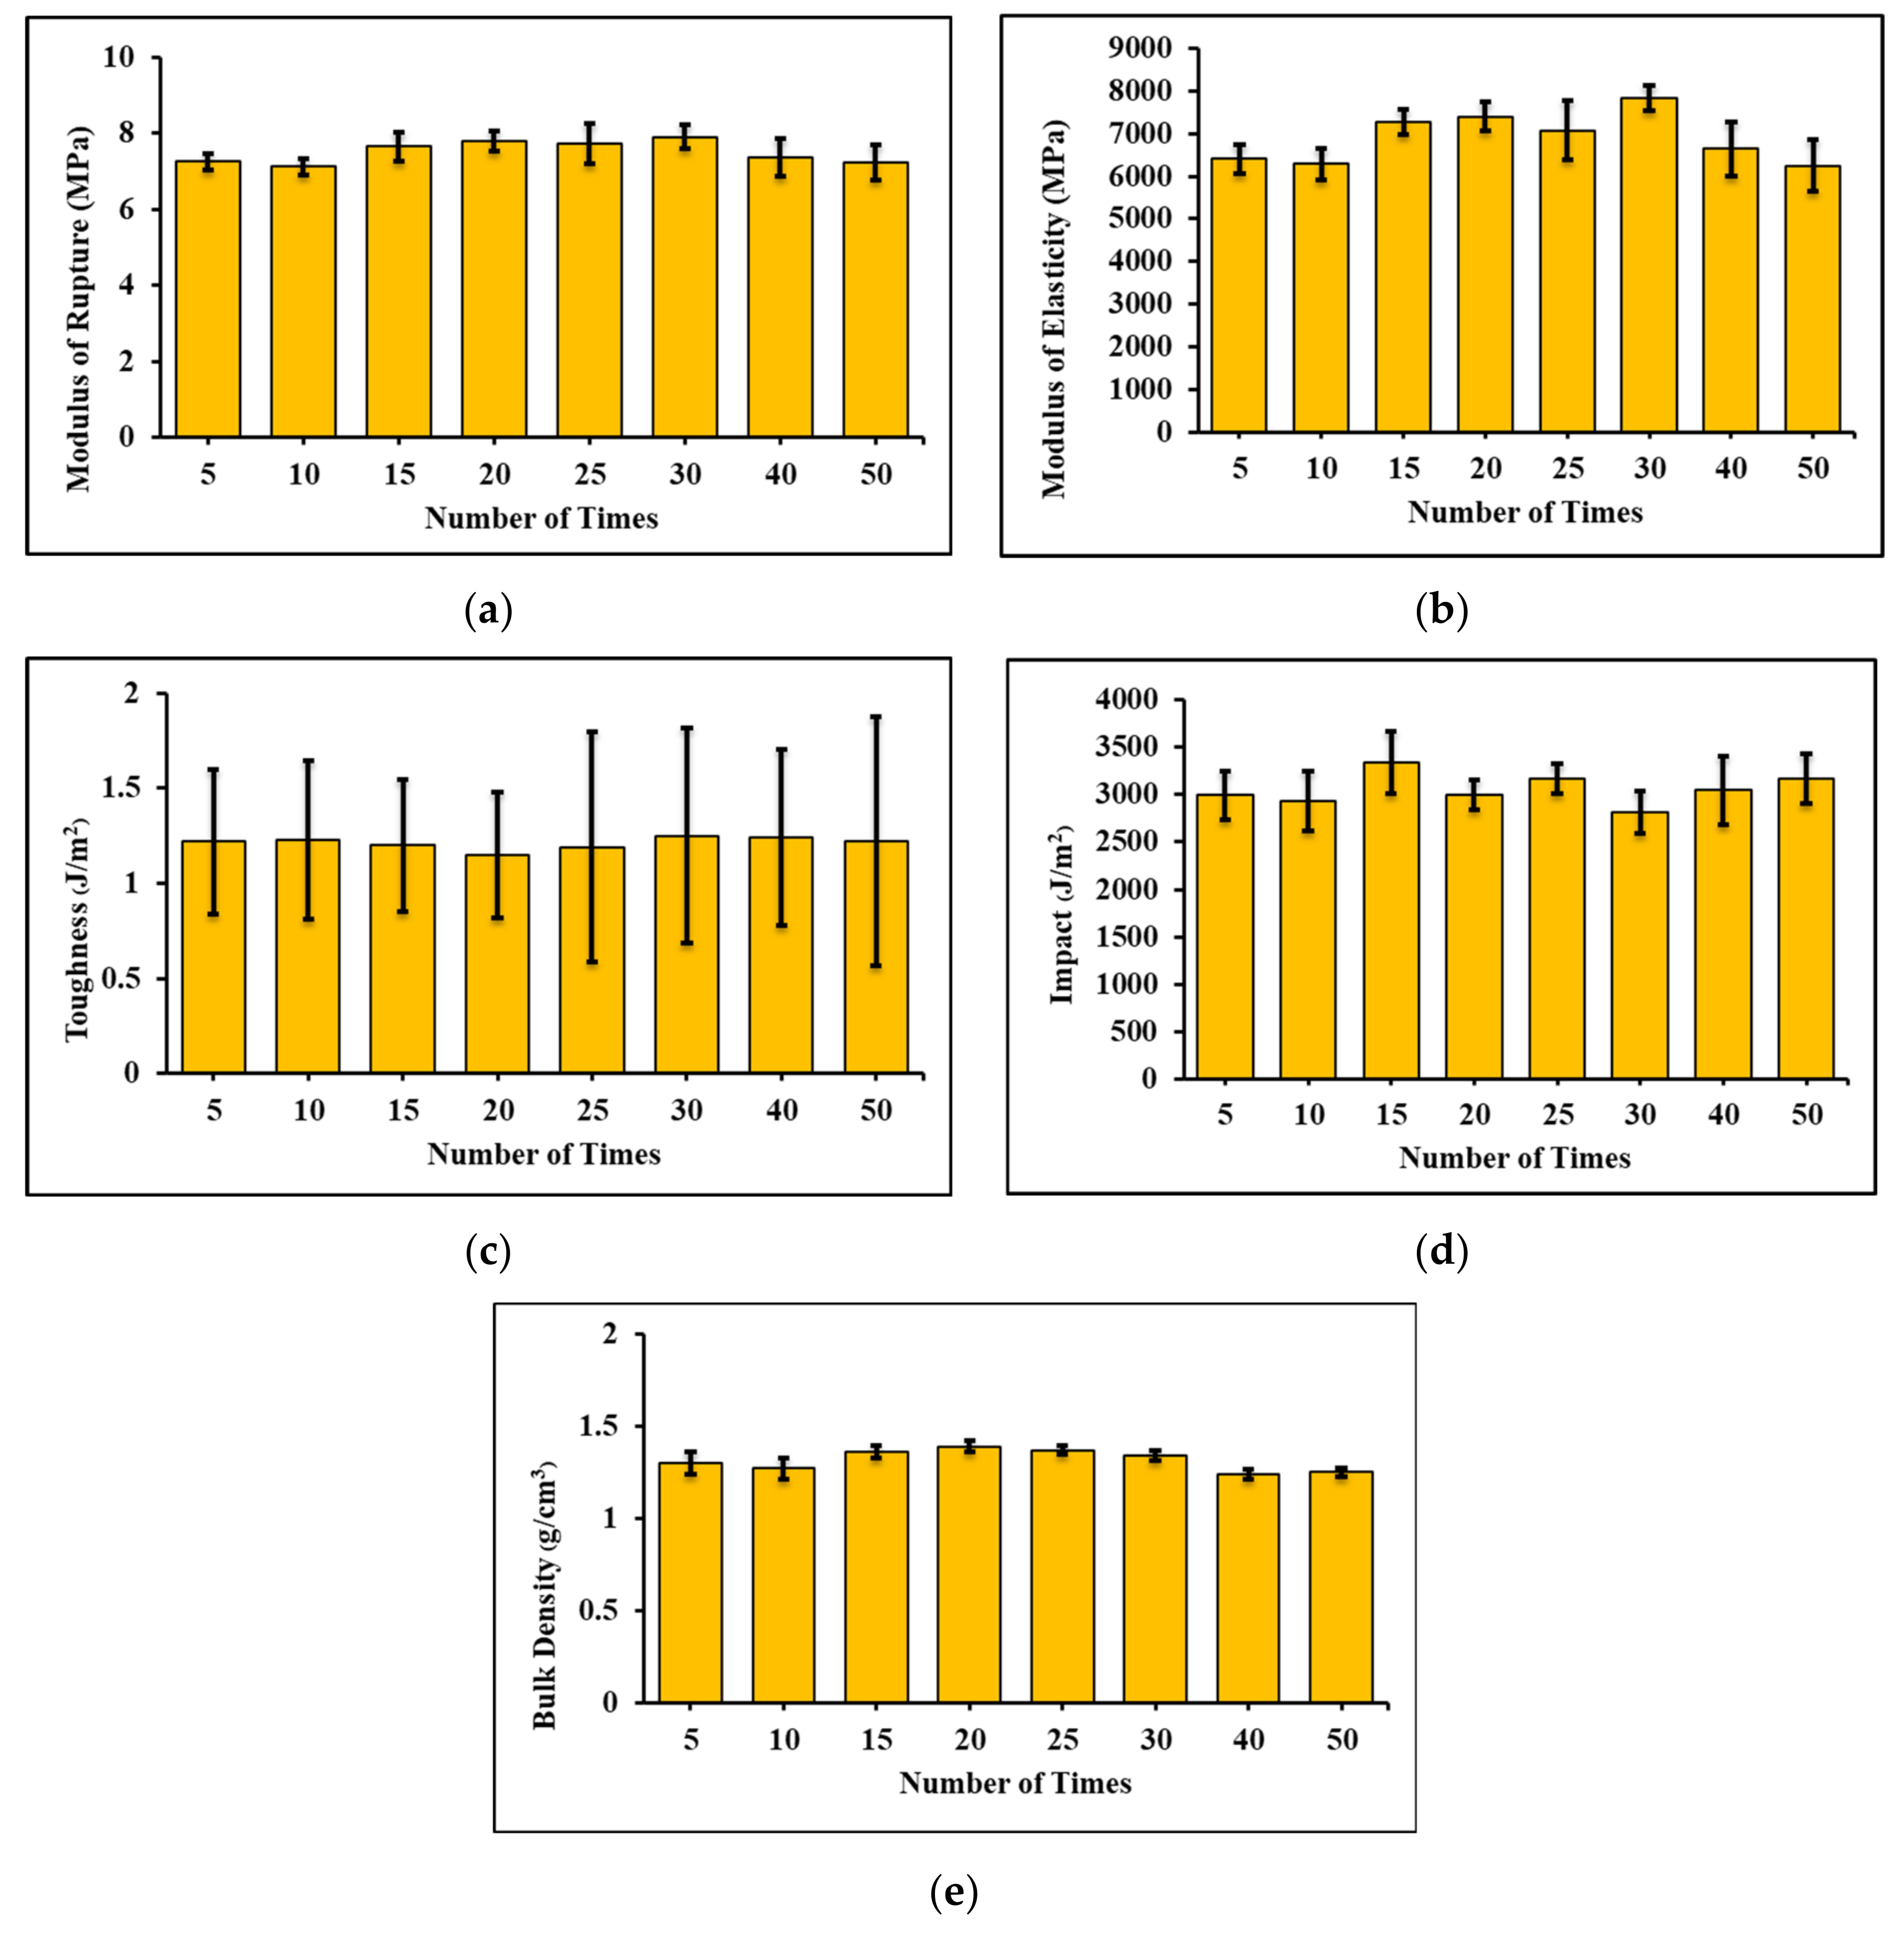
3.5. Recyclability of FC Samples and Their Environmental Impacts

To conform with the circular economy (CE) model, the recyclability of a product is very important. Given the exceptional properties of the SR50 samples, this was investigated by samples created after recycling at the various times specified. The mechanical properties and microstructure are provided in Figure 15 and Figure 16; the properties of the samples remain relatively similar even after 5 to 50 iterations of recycling.
An FC floorboard 15 cm × 300 cm × 2.5 cm was produced from the SR50 formula on an industrial scale at the factory of Shera Public Company Limited, shown in Figure 17. Each month, an FC factory can consume up to 9000 tons of sand. Sand is a non-renewable natural resource. For an FC factory, substituting sand with RFC by 50% could reduce the demand for sand by up to 4500 tons/month. According to results from the SimaPro software [68], using RFC as a sand replacement at a 50% level could reduce greenhouse gas emissions by up to 1,719,000 kg of CO2e/month at each FC factory. In addition, the possible negative environmental impacts from the CDW disposal are also eliminated.

4. Conclusions

  • The circular economy (CE) model was employed for the creation of new high-performance FC, a fiber-reinforced construction material. Two inclusion compounds were investigated, with IC1 determined to be the most beneficial: a mixture of lithium silicate, sodium thiocyanate, alkylbenzene sulfonate, and hydrochloric acid. According to the heat of hydration test, using IC1 at 1 wt% in a mixture of ordinary Portland cement (OPC), the hydration reaction rate was highest, represented by the highest heat-generation rate. The improved hydration-reaction rate was from the reaction between lithium silicate in IC1 and calcium hydroxide, the product from the hydration reaction between tricalcium silicate and water.
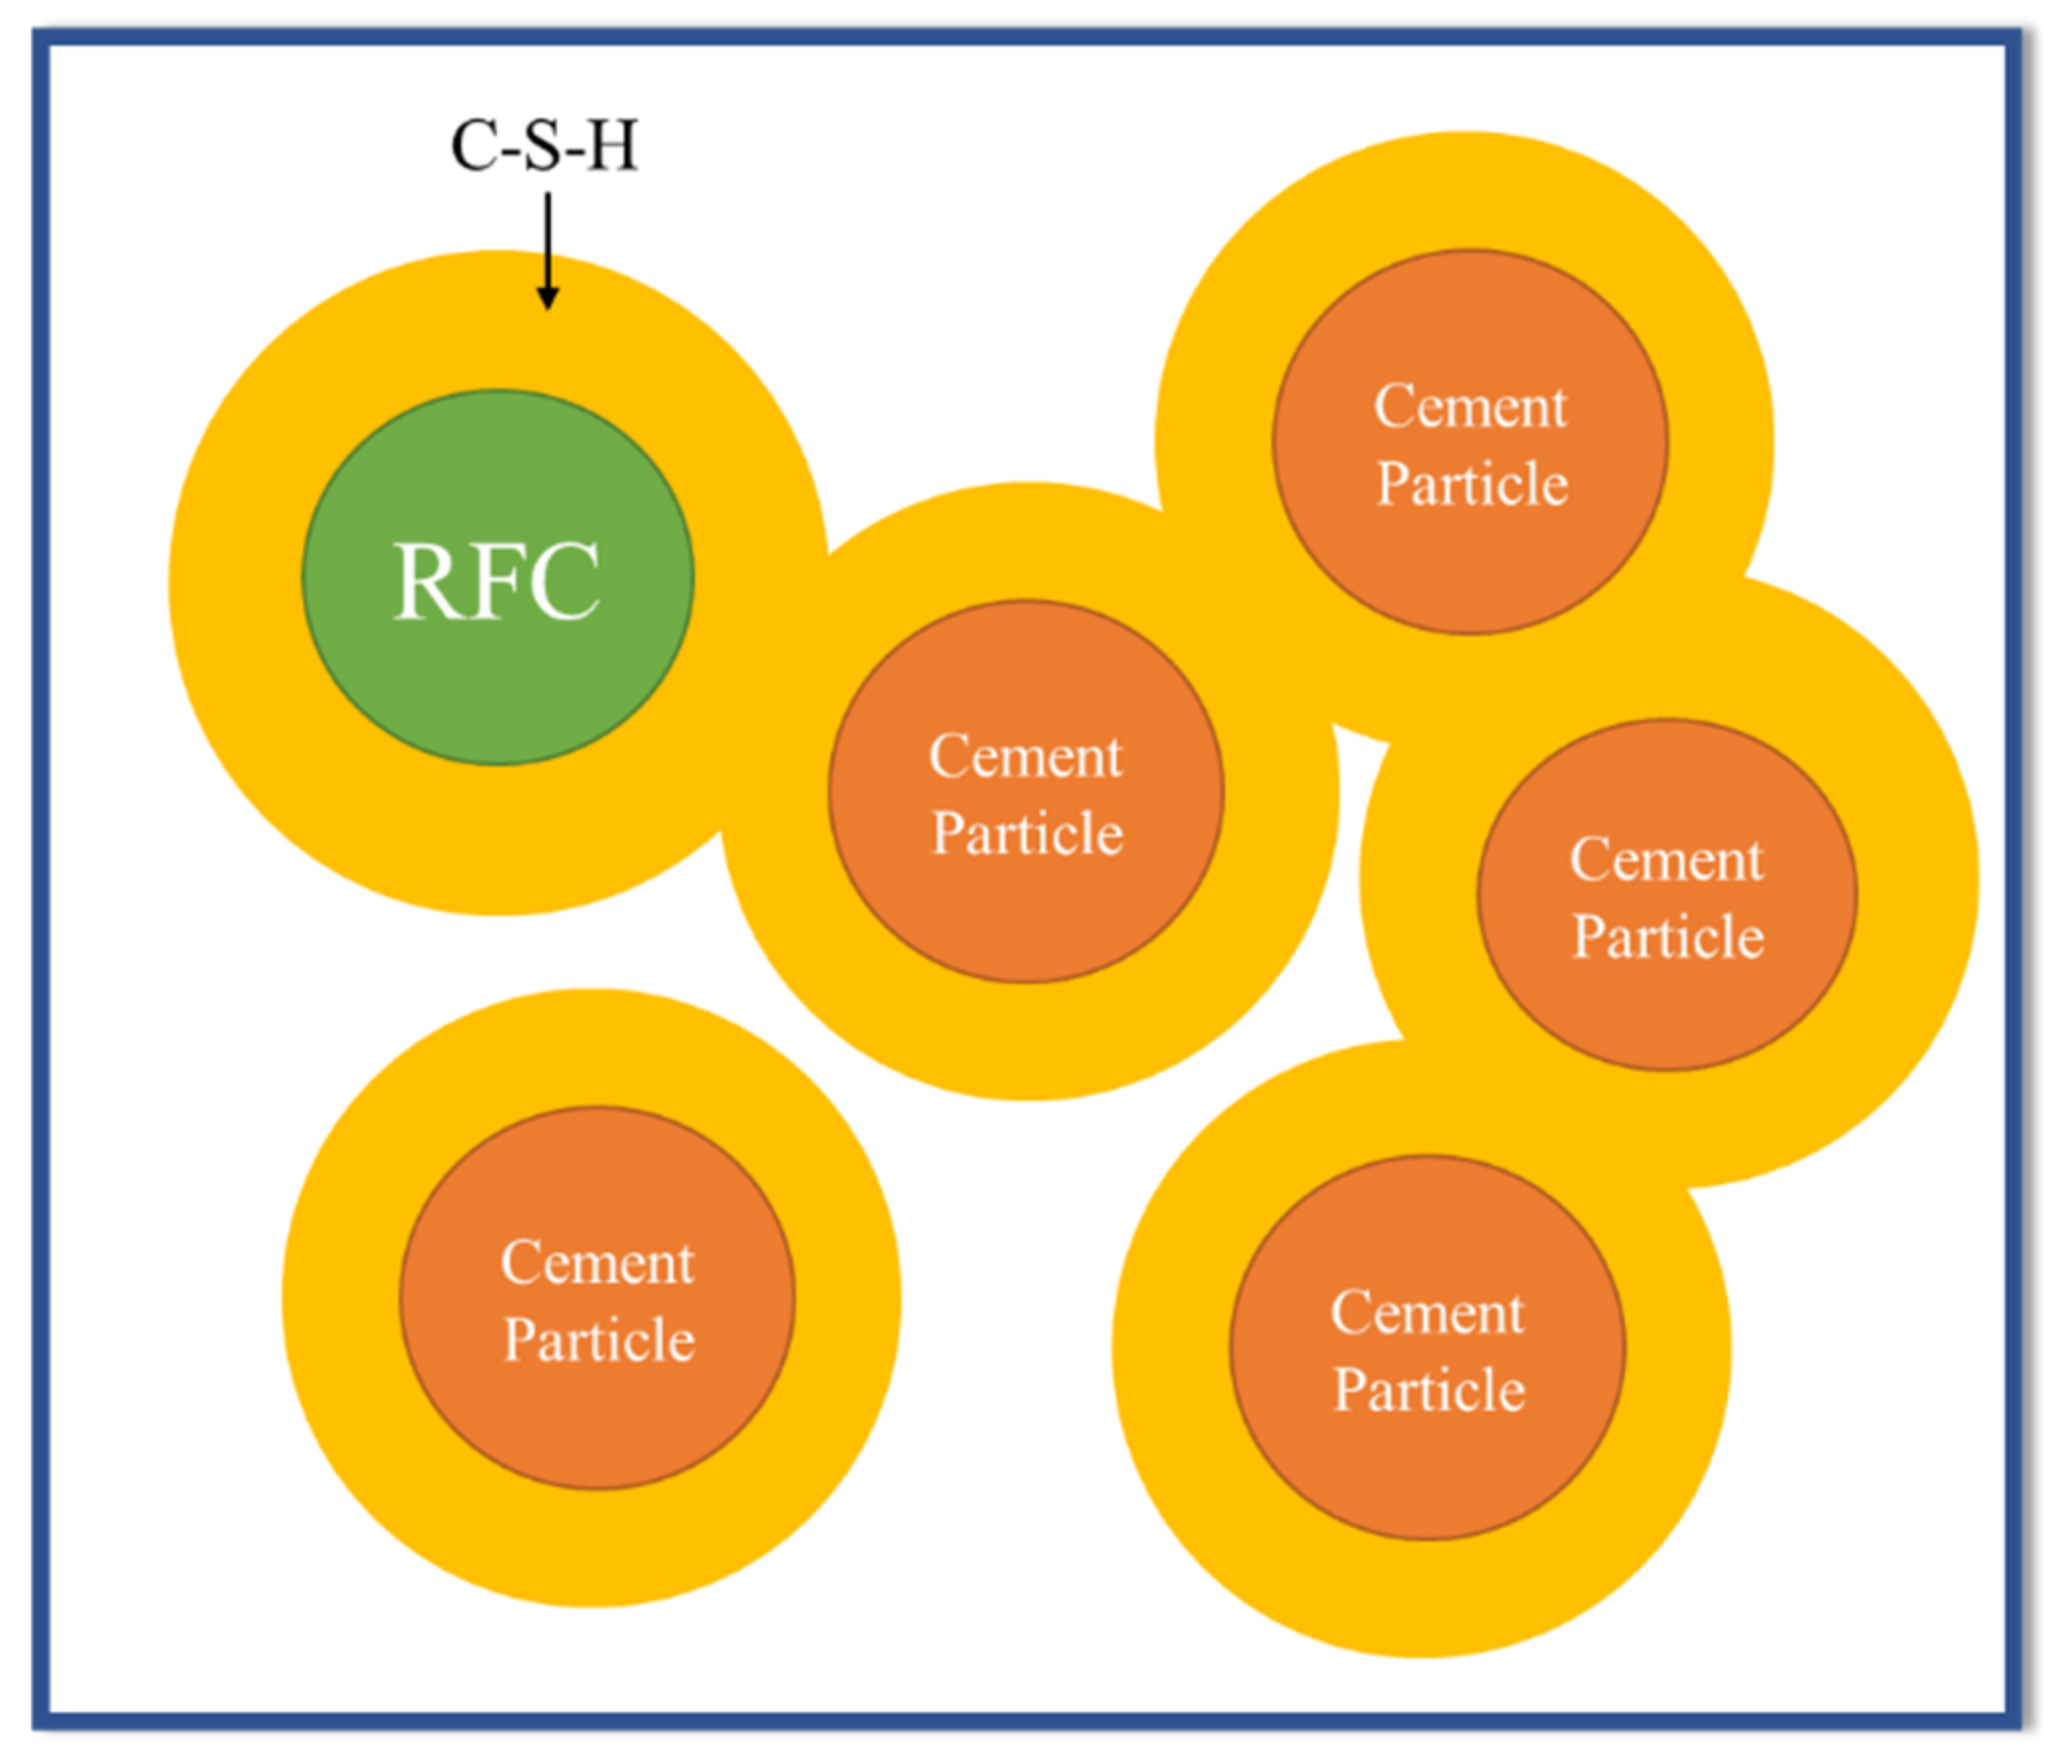
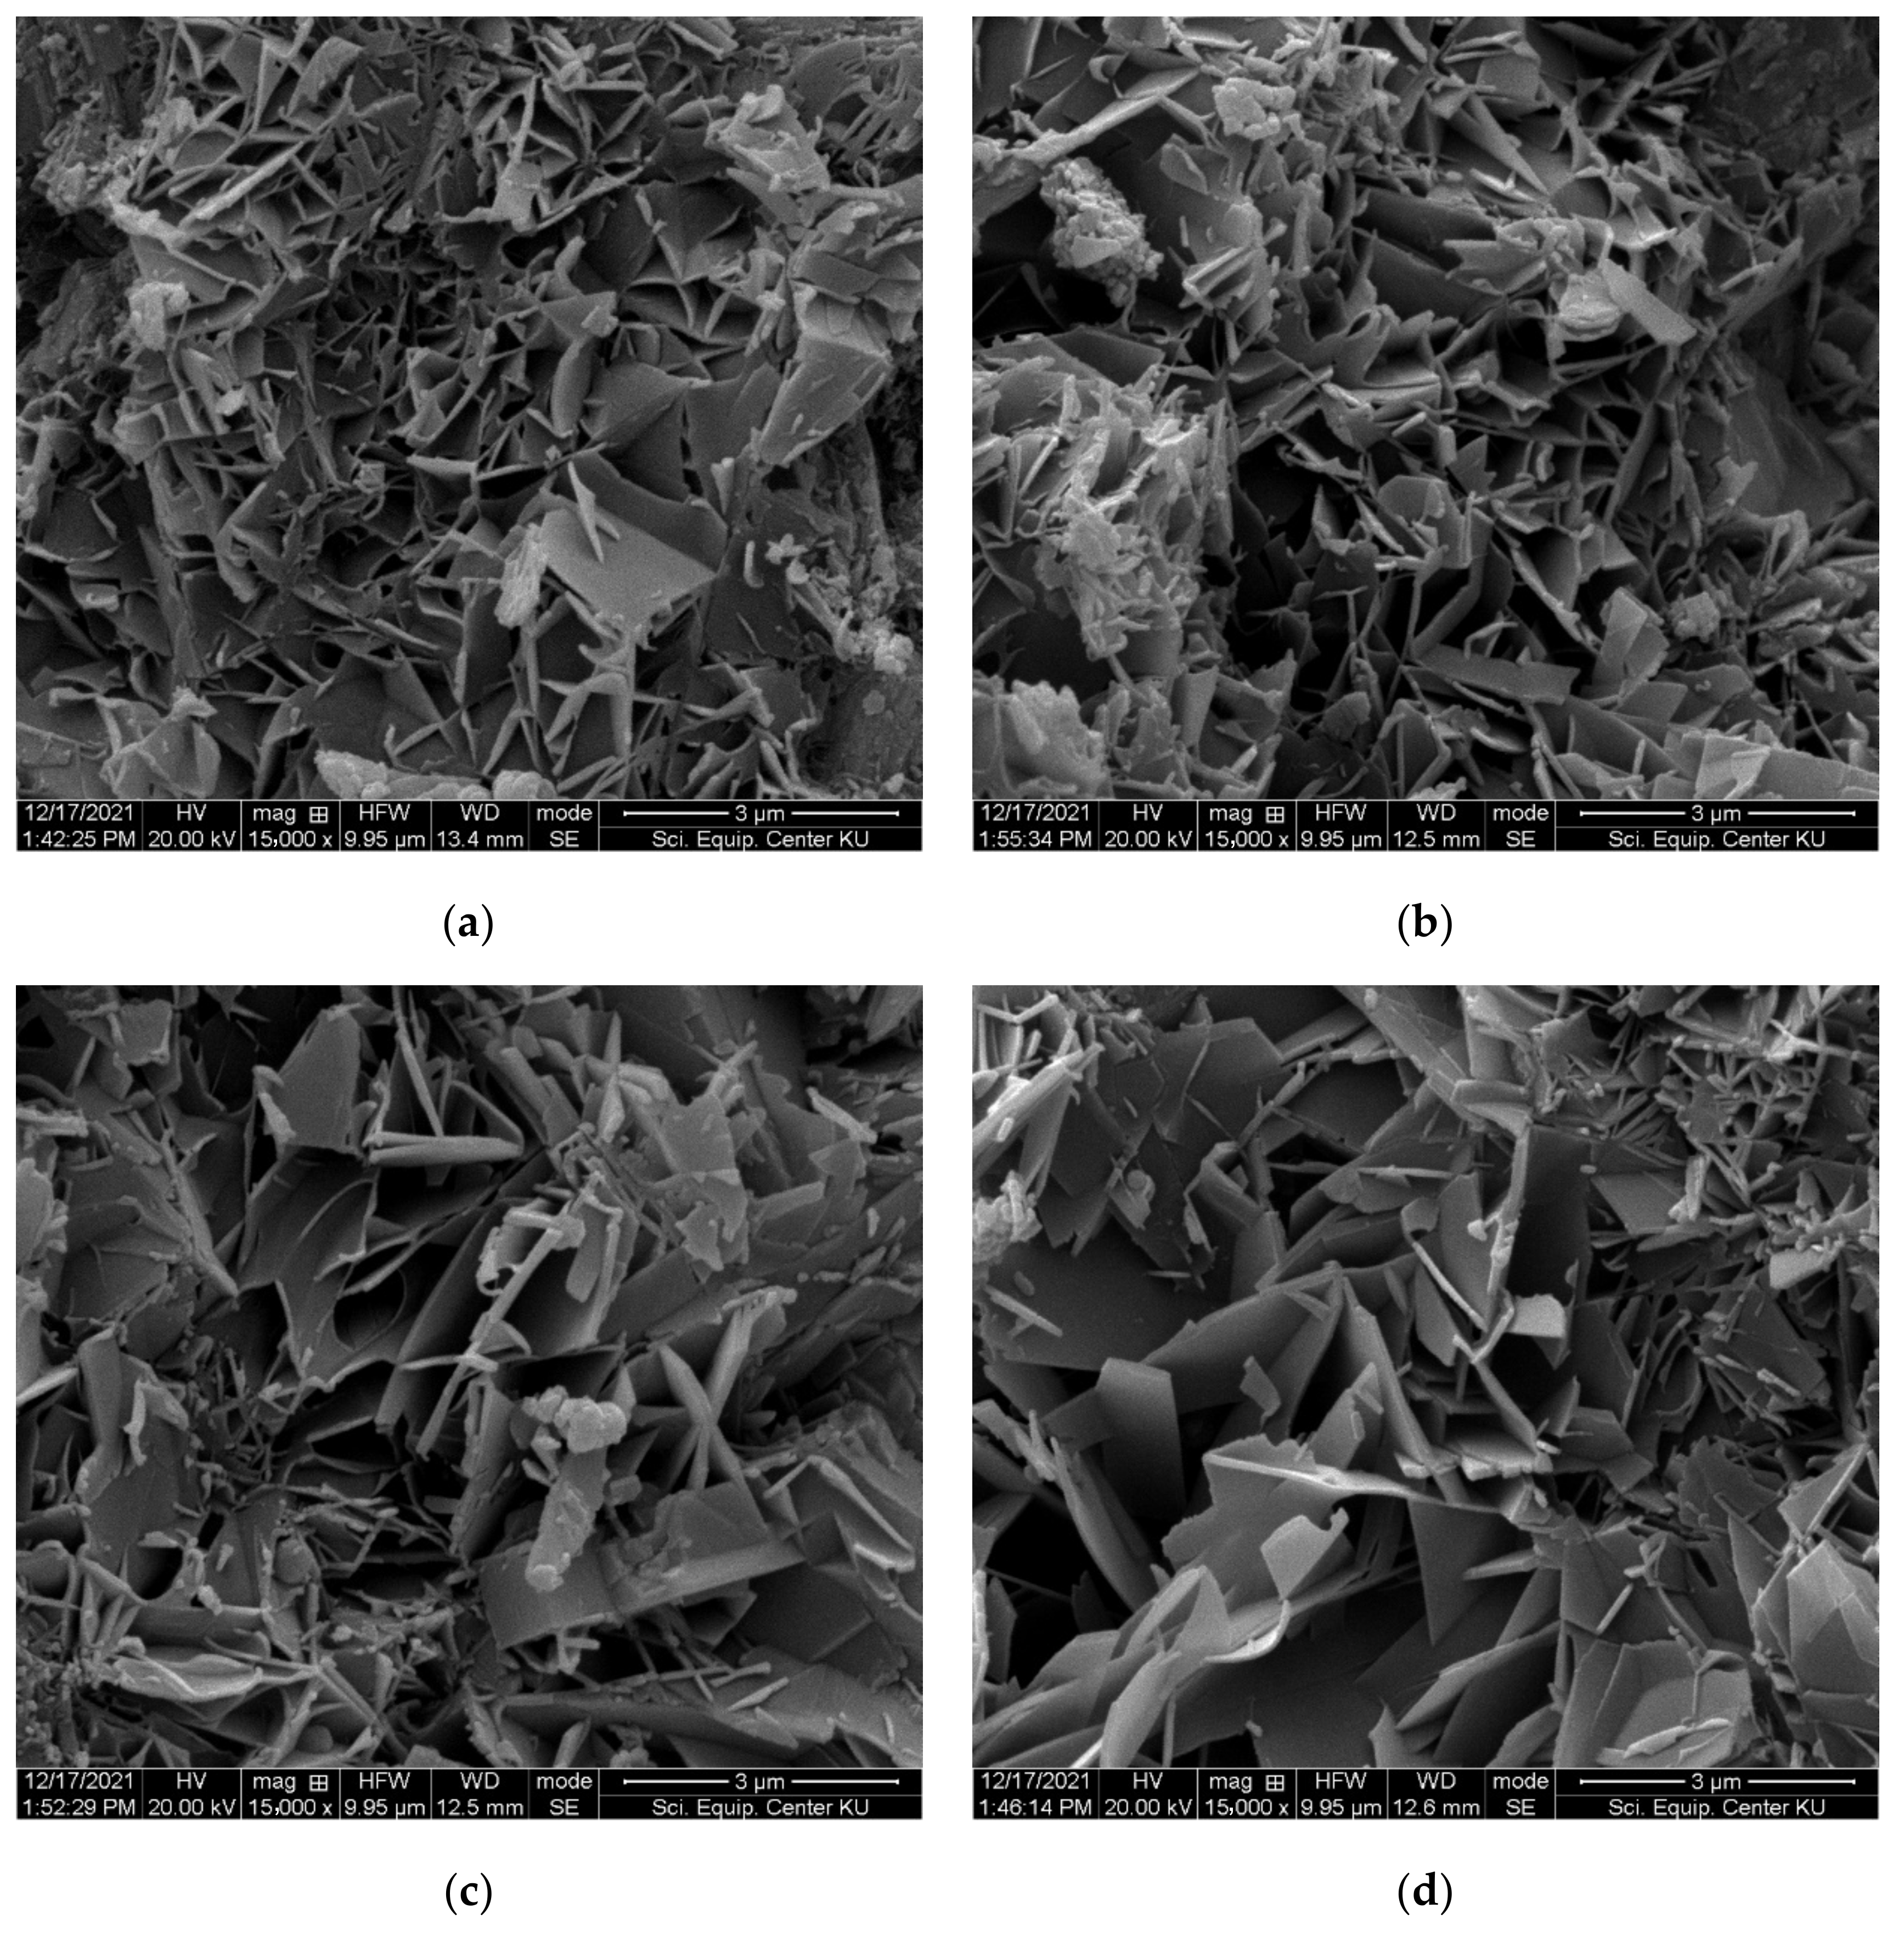
  • The results from mechanical and physical property testing showed that the FC samples produced with IC1 as the chemical admixture and the partial replacement of sand by recycled fiber cement (RFC) had the properties required by the industrial requirements. Up to 50% of the sand can be replaced with RFC, and the samples passed the durability test including the freeze-and-thaw and flammability tests. At 50% sand replacement, the variation in tobermorite size, the crystalline phase of calcium silicate hydrate (C-S-H), improves properties including the modulus of rupture (MOR), modulus of elasticity (MOE), toughness, and bulk density of FC samples.
  • The FC samples have good recyclability because the properties of the samples remain the same after recycling 5 to 50 times. Based on these properties, the possible applications of this recycled FC are in floor boards, wall boards, and roof tiles. Each month, an FC factory can consume up to 9000 tons of sand. Sand is a non-renewable natural resource. For an FC factory, substituting sand with RFC by 50% could reduce the demand for sand by up to 4500 tons/month. According to results from the SimaPro software, using RFC as the sand replacement at a 50% level could reduce greenhouse gas emissions by up to 1,719,000 kg of CO2e/month at each FC factory. In addition, the possible negative environmental impacts from the CDW disposal are also eliminated.

Author Contributions

Conceptualization, P.C. and W.P.; Methodology, P.C., W.P., N.K. and S.W.; Validation, P.C., W.P., N.K., E.A.L. and S.W.; Formal Analysis, P.C. and S.W.; Investigation, P.C. and S.W.; Resources, W.P.; Data Curation, P.C.; Writing—Original Draft Preparation, S.W.; Writing—Review and Editing, P.C., N.K. and E.A.L.; Visualization, P.C. and S.W.; Supervision, P.C.; Project Administration, P.C.; Funding Acquisition, P.C. All authors have read and agreed to the published version of the manuscript.

Funding

This research was funded by Faculty of Engineering, Kasetsart University, grant number 62/17/MATERIAL/Innovation, and Shera Public Company Limited.

Institutional Review Board Statement

Not applicable.

Informed Consent Statement

Not applicable.

Data Availability Statement

Not applicable.

Conflicts of Interest

The authors declare no conflict of interest.

References

  1. Taned Mahattanalai. Construction Contractor. Available online: https://www.krungsri.com/getmedia/61eb4685-3b57-442a-9a9a-d7a8bb9f6cf7/IO_Construction_Contractor_210205_EN_EX.pdf.aspx (accessed on 1 December 2021).
  2. Jain, S.; Singhal, S.; Pandey, S. Environmental life cycle assessment of construction and demolition waste recycling: A case of urban India. Resour. Conserv. Recycl. 2020, 155, 104642. [Google Scholar] [CrossRef]
  3. Jin, R.; Yuan, H.; Chen, Q. Science mapping approach to assisting the review of construction and demolition waste management research published between 2009 and 2018. Resour. Conserv. Recycl. 2019, 140, 175–188. [Google Scholar] [CrossRef]
  4. United States Environmental Protection Agency. Sustainable Management of Construction and Demolition Materials; EPA: Washington, DC, USA, 2018. [Google Scholar]
  5. Wu, H.; Duan, H.; Zheng, L.; Wang, J.; Niu, Y.; Zhang, G. Demolition waste generation and recycling potentials in a rapidly developing flagship megacity of South China: Prospective scenarios and implications. Constr. Build. Mater. 2016, 113, 1007–1016. [Google Scholar] [CrossRef]
  6. Luangcharoenrat, C.; Intrachooto, S.; Peansupap, V.; Sutthinarakorn, W. Factors Influencing Construction Waste Generation in Building Construction: Thailand’s Perspective. Sustainability 2019, 11, 3638. [Google Scholar] [CrossRef]
  7. Cherubini, F.; Bargigli, S.; Ulgiati, S. Life cycle assessment (LCA) of waste management strategies: Landfilling, sorting plant and incineration. Energy 2009, 34, 2116–2123. [Google Scholar] [CrossRef]
  8. Li, J.; Xia, R.; Li, J.; Chen, G. Environmental Impact Assessment of Construction and Demolition Waste Recycling in Shenzhen. In Proceedings of the 20th International Symposium on Advancement of Construction Management and Real Estate; Springer: Singapore, 2017; pp. 1101–1110. [Google Scholar]
  9. Wang, J.; Wu, H.; Tam, V.W.Y.; Zuo, J. Considering life-cycle environmental impacts and society’s willingness for optimizing construction and demolition waste management fee: An empirical study of China. J. Clean. Prod. 2019, 206, 1004–1014. [Google Scholar] [CrossRef]
  10. Thongkamsuk, P.; Sudasna, K.; Tondee, T. Waste generated in high-rise buildings construction: A current situation in Thailand. Energy Procedia 2017, 138, 411–416. [Google Scholar] [CrossRef]
  11. Zheng, L.; Wu, H.; Zhang, H.; Duan, H.; Wang, J.; Jiang, W.; Dong, B.; Liu, G.; Zuo, J.; Song, Q. Characterizing the generation and flows of construction and demolition waste in China. Constr. Build. Mater. 2017, 136, 405–413. [Google Scholar] [CrossRef]
  12. Li, R.Y.M.; Du, H. Sustainable Construction Waste Management in Australia: A Motivation Perspective. In Construction Safety and Waste Management: An Economic Analysis; Li, R.Y.M., Ed.; Springer International Publishing: Cham, Switzerland, 2015; pp. 1–30. [Google Scholar]
  13. Ellen MacArthur Foundation. What Is a Circular Economy? Available online: https://ellenmacarthurfoundation.org/topics/circular-economy-introduction/overview (accessed on 1 September 2021).
  14. Akhimien, N.G.; Latif, E.; Hou, S.S. Application of circular economy principles in buildings: A systematic review. J. Build. Eng. 2021, 38, 102041. [Google Scholar] [CrossRef]
  15. Kongkajun, N.; Laitila, E.A.; Ineure, P.; Prakaypan, W.; Cherdhirunkorn, B.; Chakartnarodom, P. Soil-cement bricks produced from local clay brick waste and soft sludge from fiber cement production. Case Stud. Constr. Mater. 2020, 13, e00448. [Google Scholar] [CrossRef]
  16. Liang, C.; Zhang, Y.; Wu, R.; Yang, D.; Ma, Z. The utilization of active recycled powder from various construction wastes in preparing ductile fiber-reinforced cementitious composites: A case study. Case Stud. Constr. Mater. 2021, 15, e00650. [Google Scholar] [CrossRef]
  17. Mistri, A.; Bhattacharyya, S.K.; Dhami, N.; Mukherjee, A.; Barai, S.V. A review on different treatment methods for enhancing the properties of recycled aggregates for sustainable construction materials. Constr. Build. Mater. 2020, 233, 117894. [Google Scholar] [CrossRef]
  18. Kazmi, S.M.S.; Munir, M.J.; Wu, Y.-F.; Patnaikuni, I.; Zhou, Y.; Xing, F. Influence of different treatment methods on the mechanical behavior of recycled aggregate concrete: A comparative study. Cem. Concr. Compos. 2019, 104, 103398. [Google Scholar] [CrossRef]
  19. Sonprasarn, P.; Chakartnarodom, P.; Ineure, P.; Prakaypan, W. Effects of the chemical treatment on coal-fired bottom ash for the utilization in fiber-reinforced cement. J. Met. Mater. Miner. 2019, 29, 55–60. [Google Scholar] [CrossRef]
  20. Sonprasarn, P.; Chakartnarodom, P.; Kongkajun, N.; Prakaypan, W. Microstructure and mechanical performance of fiber-reinforced cement composites made with nucleating-agent activated coal-fired power plant bottom ash. Solid State Phenom. 2020, 302, 85–92. [Google Scholar] [CrossRef]
  21. Ren, G.; Tian, Z.; Wu, J.; Gao, X. Effects of combined accelerating admixtures on mechanical strength and microstructure of cement mortar. Constr. Build. Mater. 2021, 304, 124642. [Google Scholar] [CrossRef]
  22. Pahuswanno, P.; Chakartnarodom, P.; Ineure, P.; Prakaypan, W. The influences of chemical treatment on recycled rejected fiber cement used as fillers in the fiber cement products. J. Met. Mater. Miner. 2019, 29, 66–70. [Google Scholar] [CrossRef]
  23. Pahuswanno, P.; Chakartnarodom, P.; Kongkajun, N.; Prakaypan, W. Feasibility study of using modified recycled fiber-cement for the production of high performance fiber-cement composites. Solid State Phenom. 2020, 302, 93–99. [Google Scholar] [CrossRef]
  24. Ram, V.G.; Kishore, K.C.; Kalidindi, S.N. Environmental benefits of construction and demolition debris recycling: Evidence from an Indian case study using life cycle assessment. J. Clean. Prod. 2020, 255, 120258. [Google Scholar] [CrossRef]
  25. Dokter, G.; Thuvander, L.; Rahe, U. How circular is current design practice? Investigating perspectives across industrial design and architecture in the transition towards a circular economy. Sustain. Prod. Consum. 2021, 26, 692–708. [Google Scholar] [CrossRef]
  26. European Commission. Sustainable Product Policy. Available online: https://joint-research-centre.ec.europa.eu/scientific-activities-z/sustainable-product-policy_en (accessed on 22 September 2022).
  27. Song, Z.; Lu, Z.; Lai, Z. The effect of lithium silicate impregnation on the compressive strength and pore structure of foam concrete. Constr. Build. Mater. 2021, 277, 122316. [Google Scholar] [CrossRef]
  28. Wise, T.; Ramachandran, V.S.; Polomark, G.M. The effect of thiocyanates on the hydration of portland cement at low temperatures. Thermochim. Acta 1995, 264, 157–171. [Google Scholar] [CrossRef]
  29. Costa, M.F.; de Oliveira, A.M.; Oliveira Junior, E.N.d. Biodegradation of linear alkylbenzene sulfonate (LAS) by Penicillium chrysogenum. Bioresour. Technol. Rep. 2020, 9, 100363. [Google Scholar] [CrossRef]
  30. Carvalho, J.M.F.; Oliveira, M.B.; Moreira, L.P.S.H.; Mendes, J.C.; Pereira, C.A. Use of Alkylbenzene Sulfonate (LAS) and Polycarboxylate-Ether (PCE) as Reagents in Iron Ore Flotation. Holos 2017, 6, 116–125. [Google Scholar] [CrossRef]
  31. Mohit, M.; Ranjbar, A.; Sharifi, Y. Mechanical and microstructural properties of mortars incorporating ceramic waste powder exposed to the hydrochloric acid solution. Constr. Build. Mater. 2021, 271, 121565. [Google Scholar] [CrossRef]
  32. Allahverdi, A.; Škvára, F. Acidic corrosion of hydrated cement based materials. Part 1. Mechanism of the phenomenon. Ceram.-Silik. 2000, 44, 114–120. [Google Scholar]
  33. Chandra, S. Hydrochloric acid attack on cement mortar—An analytical study. Cem. Concr. Res. 1988, 18, 193–203. [Google Scholar] [CrossRef]
  34. Ismail, A.H.; Kusbiantoro, A.; Chin, S.C.; Muthusamy, K.; Islam, M.; Tee, K.F. Pozzolanic reactivity and strength activity index of mortar containing palm oil clinker pretreated with hydrochloric acid. J. Clean. Prod. 2020, 242, 118565. [Google Scholar] [CrossRef]
  35. Han, J.; Wang, K.; Shi, J.; Wang, Y. Mechanism of triethanolamine on Portland cement hydration process and microstructure characteristics. Constr. Build. Mater. 2015, 93, 457–462. [Google Scholar] [CrossRef]
  36. Flatt, R.; Schober, I. 7—Superplasticizers and the rheology of concrete. In Understanding the Rheology of Concrete; Roussel, N., Ed.; Woodhead Publishing: Sawston, UK, 2012; pp. 144–208. [Google Scholar]
  37. Steven, G. Evaluation of Calcium Formate and Sodium Formate as Accelerating Admixtures for Portland Cement Concrete. ACI J. Proc. 1983, 80, 439–444. [Google Scholar] [CrossRef]
  38. ASTM C186-98; Standard Test Method for Heat of Hydration of Hydraulic Cement. ASTM International: West Conshohocken, PA, USA, 1998.
  39. ASTM C1185; Standard Test Methods for Sampling and Testing Non-Asbestos Fiber-Cement Flat Sheet, Roofing and Siding Shingles, and Clapboards. ASTM International: West Conshohocken, PA, USA, 2016.
  40. BS EN 12467; Fiber-Cement Flat Sheets—Product Specification and Test Methods. The British Standard Institution: London, UK, 2012.
  41. ASTM C177; Standard Test Method for Steady-State Heat Flux Measurements and Thermal Transmission Properties by Means of the Guarded-Hot-Plate Apparatus. ASTM International: West Conshohocken, PA, USA, 2017.
  42. ISO 11925-2; Reaction to fire tests—Ignitability of products subjected to direct impingement of flame—Part 2: Single-Flame Source Test. International Organization for Standardization: London, UK, 2020.
  43. Dwivedi, V.; Das, S.; Singh, N.; Rai, S.; Gajbhiye, N. Portland cement hydration in the presence of admixtures—Black gram pulse and superplasticizer. Mater. Res. 2008, 11, 427–431. [Google Scholar] [CrossRef]
  44. Chakartnarodom, P.; Prakaypan, W.; Ineure, P.; Kongkajun, N.; Chuankrerkkul, N. Feasibility Study of Using Basalt Fibers as the Reinforcement Phase in Fiber-Cement Products. Key Eng. Mater. 2018, 766, 252–257. [Google Scholar] [CrossRef]
  45. Maljaee, H.; Paiva, H.; Madadi, R.; Tarelho, L.A.C.; Morais, M.; Ferreira, V.M. Effect of cement partial substitution by waste-based biochar in mortars properties. Constr. Build. Mater. 2021, 301, 124074. [Google Scholar] [CrossRef]
  46. Harrisson, A.M. 4—Constitution and Specification of Portland Cement. In Lea’s Chemistry of Cement and Concrete, 5th ed.; Hewlett, P.C., Liska, M., Eds.; Butterworth-Heinemann: Oxford, UK, 2019; pp. 87–155. [Google Scholar]
  47. Chaipanich, A.; Nochaiya, T. Thermal analysis and microstructure of Portland cement-fly ash-silica fume pastes. J. Therm. Anal. Calorim. 2009, 99, 487–493. [Google Scholar] [CrossRef]
  48. Nochaiya, T.; Wongkeo, W.; Pimraksa, K.; Chaipanich, A. Microstructural, physical, and thermal analyses of Portland cement–fly ash–calcium hydroxide blended pastes. J. Therm. Anal. Calorim. 2009, 100, 101–108. [Google Scholar] [CrossRef]
  49. Alarcon-Ruiz, L.; Platret, G.; Massieu, E.; Ehrlacher, A. The use of thermal analysis in assessing the effect of temperature on a cement paste. Cem. Concr. Res. 2005, 35, 609–613. [Google Scholar] [CrossRef]
  50. Sha, W.; O’Neill, E.A.; Guo, Z. Differential scanning calorimetry study of ordinary Portland cement. Cem. Concr. Res. 1999, 29, 1487–1489. [Google Scholar] [CrossRef]
  51. Marchon, D.; Flatt, R.J. 8—Mechanisms of cement hydration. In Science and Technology of Concrete Admixtures; Aïtcin, P.-C., Flatt, R.J., Eds.; Woodhead Publishing: Sawston, UK, 2016; pp. 129–145. [Google Scholar]
  52. Zhou, W.; Duan, L.; Tang, S.; Chen, E.; Hanif, A. Modeling the evolved microstructure of cement pastes governed by diffusion through barrier shells of C–S–H. J. Mater. Sci. 2019, 54, 4680–4700. [Google Scholar] [CrossRef]
  53. Rahimi-Aghdam, S.; Bažant, Z.P.; Abdolhosseini Qomi, M.J. Cement hydration from hours to centuries controlled by diffusion through barrier shells of C-S-H. J. Mech. Phys. Solids 2017, 99, 211–224. [Google Scholar] [CrossRef]
  54. ASTM C1186; Standard Specification for Flat Fiber-Cement Sheets. ASTM International: West Conshohocken, PA, USA, 2016.
  55. TIS 1427; Fibre-Cement Sheets: Flat Sheets. Thai Industrial Standard Institute: Bangkok, Thailand, 2018.
  56. Wu, Y.; Pan, X.; Li, Q.; Yu, H. Crystallization and phase transition of tobermorite synthesized by hydrothermal reaction from dicalcium silicate. Int. J. Appl. Ceram. Technol. 2020, 17, 1213–1223. [Google Scholar] [CrossRef]
  57. Bell, N.S.; Venigalla, S.; Gill, P.M.; Adair, J.H. Morphological Forms of Tobermorite in Hydrothermally Treated Calcium Silicate Hydrate Gels. J. Am. Ceram. Soc. 1996, 79, 2175–2178. [Google Scholar] [CrossRef]
  58. Chakartnarodom, P.; Kongkajun, N.; Chuankrerkkul, N.; Ineure, P.; Prakaypan, A.W. Reducing water absorption of fiber-cement composites for exterior applications by crystal modification method. J. Met. Mater. Miner. 2019, 29, 90–98. [Google Scholar] [CrossRef]
  59. Wongkeo, W.; Thongsanitgarn, P.; Pimraksa, K.; Chaipanich, A. Compressive strength, flexural strength and thermal conductivity of autoclaved concrete block made using bottom ash as cement replacement materials. Mater. Des. 2012, 35, 434–439. [Google Scholar] [CrossRef]
  60. Askeland, D.R.; Fulay, P.P.; Wrigh, W.J. The Science and Engineering of Materials, 6th ed.; Cengage Learning: Stamford, CT, USA, 2011. [Google Scholar]
  61. Jelitto, H.; Schneider, G. Fracture Toughness of Porous Materials—Experimental Methods and Data. Data Brief 2019, 23, 103709. [Google Scholar] [CrossRef]
  62. Marinescu, I.D.; Pruteanu, M. Chapter 2—Deformation and Fracture of Ceramic Materials. In Handbook of Ceramics Grinding and Polishing; Marinescu, I.D., Doi, T.K., Uhlmann, E., Eds.; William Andrew Publishing: Boston, MA, USA, 2015; pp. 50–66. [Google Scholar]
  63. Lautenberger, C.; Torero, J.; Fernandez-Pello, C. 1—Understanding materials flammability. In Flammability Testing of Materials Used in Construction, Transport and Mining; Apte, V.B., Ed.; Woodhead Publishing: Sawston, UK, 2006; pp. 1–21. [Google Scholar]
  64. Kim, Y.K. 8—Natural fibre composites (NFCs) for construction and automotive industries. In Handbook of Natural Fibres; Kozłowski, R.M., Ed.; Woodhead Publishing: Sawston, UK, 2012; Volume 2, pp. 254–279. [Google Scholar]
  65. Canosa, G.; Alfieri, P.V.; Giydice, C.A. Nano lithium silicates as flame-retardant impregnants for Pinus radiata. J. Fire Sci. 2011, 29, 431–441. [Google Scholar] [CrossRef]
  66. McCarter, R.J.; Gaithersburg, M. Flame Retarding Cellulosic Materials Withsodium or Potassium Thiocyanate. Available online: https://patentimages.storage.googleapis.com/29/58/8b/f99358cb0b36de/US4302345.pdf (accessed on 1 June 2022).
  67. The Thai Ministry of Energy. Notification of the Ministry of Energy: Criteria and Method of Calculation for Building Energy Efficiency Standard. Available online: https://download.asa.or.th/03media/04law/eca/ma64-02.pdf (accessed on 1 June 2022).
  68. Chakartnarodom, P.; Prakaypan, W.; Kongkajun, N. Recycling of the Roof Tile Waste as a Raw Material for Roof Tile Manufacturing Process. In Proceedings of the Thailand Research Expo: Symposium 2018, Bangkok, Thailand, 9–13 August 2018. [Google Scholar]
Figure 1. (a) The RFC powder as prepared (b) size distribution of RFC and sand particles.
Sustainability 14 12263 g001
Figure 2. The instrument used to study the heat released by hydration reaction of the Portland cement; (a) is the temperature data logger, and (b) are the containers used to store the cement paste.
Sustainability 14 12263 g002
Figure 3. Image (a) filled mold for sample preparation, (b) sample-forming machine, (c) green samples.
Sustainability 14 12263 g003aSustainability 14 12263 g003b
Figure 4. Results from the heat of hydration test (a) IC1-added cement paste (b) IC2-added cement paste (c) IC1-added cement paste with RFC (d) IC2-added cement paste with RFC.
Sustainability 14 12263 g004aSustainability 14 12263 g004b
Figure 5. The relative rate of temperature change of A1 with Ref in (a), and A1 with A0 in (b).
Sustainability 14 12263 g005
Figure 6. Comparison of XRD patterns with IC1 content (a) A1 samples with Ref, and (b) A2 samples with A0 (■ = Calcium hydroxide (Ca(OH)2, PDF no. 01-081-2040), ▲ = quartz (SiO2, PDF no. 01-085-0795), and ● = tricalcium silicate (C3S, PDF no. 01-070-8632)).
Sustainability 14 12263 g006
Figure 7. Peak-to-background ratio of a CH peak from Figure 6 at about 18.04° 2θ (a) A1 samples with Ref, and (b) A2 samples with A0.
Sustainability 14 12263 g007
Figure 8. (a) TGA and (b) DSC curves of the samples.
Sustainability 14 12263 g008
Figure 9. The relative area of the endothermic peak in Figure 8b.
Sustainability 14 12263 g009
Figure 10. Schematic image of cement particles and the RFC with a layer of C-S-H over their surface.
Sustainability 14 12263 g010
Figure 11. Properties of the FC samples (a) MOR (b) MOE (c) toughness (d) impact resistance and (e) bulk density.
Sustainability 14 12263 g011aSustainability 14 12263 g011b
Figure 12. SEM micrographs of the microstructure of (a) SR0, (b) SR25, (c) SR50, (d) SR75, and (e) SR100.
Sustainability 14 12263 g012aSustainability 14 12263 g012b
Figure 13. Properties of the FC samples, SR0 and SR50, before and after freeze-and-thaw test (a) MOR (b) MOE (c) toughness and (d) impact resistance.
Sustainability 14 12263 g013
Figure 14. Thermal conductivity of FC samples, SR0 and SR50, and some products from Table 5.
Sustainability 14 12263 g014
Figure 15. The average properties of the SR50 samples produced using RFC produced from FC samples recycled 5 to 50 times (a) MOR (b) MOE (c) toughness (d) impact strength (e) bulk density.
Sustainability 14 12263 g015
Figure 16. SEM micrographs of the SR50 samples formed using RFC produced from FC samples recycled 5 to 50 times: (a) 20 times, (b) 30 times, (c) 40 times, and (d) 50 times of recycling.
Sustainability 14 12263 g016
Figure 17. An SR50 FC floorboard produced on the industrial scale.
Sustainability 14 12263 g017
Table 1. Chemical composition based on XRF results of raw materials.
OxideComposition (wt.%)
Portland CementSandGypsumRFC
MgO1.210.010.190.62
Al2O35.981.100.182.90
SiO219.895.460.1440.41
K2O0.340.270.050.43
CaO64.450.2423.9238.31
Fe2O33.180.260.131.76
SO32.730.0072.7415.28
TiO20.250.050.010.15
Other2.062.612.640.14
Table 2. Formula for preparing samples for heat of hydration test.
FormulaRaw Material (g)
OPCRFCWaterIC (IC1 or IC2)
Ref650-200-
A0487.50162.50200-
A1650-2003.25, 6.50, 9.75, 19.50
(0.5, 1, 1.5, and 3% of OPC weight)
A2487.50162.502003.25, 6.50, 9.75, 19.50
(0.5, 1, 1.5, and 3% of OPC weight)
Table 3. Formula of the mixtures used to prepare the samples.
Formula% of Sand ReplacementMaterial (wt.%)IC1
(% of OPC Weight)
Water
(Water-to-Cement Ratio)
OPCSandRFCGypsumCellulose Fibers
SR0034.7534.750.0025.005.5010.35
SR252534.7526.068.6925.005.5010.35
SR505034.7517.3817.3825.005.5010.35
SR757534.758.6926.0625.005.5010.35
SR10010034.750.0034.7525.005.5010.35
Table 4. The numerical results from the heat of hydration tests.
FormulaInclusion Compound (IC)Tinitial (°C)Tmax (°C)t (h:min)R (°C/min)
Type% OPC Weight
RefNone0.027.773.005:450.131
A0None0.025.962.306:260.094
A1IC10.529.376.805:250.146
1.033.378.204:320.165
1.532.777.904:560.153
3.030.962.705:230.098
A1IC20.534.171.505:120.120
1.032.370.705:340.115
1.533.570.405:250.114
3.031.869.105:410.109
A2IC10.529.765.505:450.104
1.030.068.105:280.116
1.533.267.005:130.108
3.032.563.605:140.099
A2IC20.532.164.805:290.099
1.028.259.305:200.097
1.531.349.404:490.063
3.034.647.805:060.043
Table 5. Thermal conductivity of various construction materials [67].
MaterialThermal Conductivity (W/m-K)
Concrete roof tile0.993
Brick wall0.473–1.102
Hollow concrete block wall0.546
Concrete-slab wall1.442
Asbestos-reinforced FC (wall)0.397
Asbestos-reinforced FC (corrugated roof tile)0.384–0.441
Table 6. Results from flammability test of SR0 and SR50 samples.
Flame TypeSample
SR0SR50
45°
Surface ignition
No ignitionNo ignition
90°
Vertical edge
No ignitionNo ignition
180°
Bottom edge
No ignitionNo ignition
Publisher’s Note: MDPI stays neutral with regard to jurisdictional claims in published maps and institutional affiliations.

