Article

The Economy–Environment Nexus: Sustainable Development Goals Interlinkages in Austria

Institute for Managing Sustainability, Vienna University of Economics and Business, 1020 Vienna, Austria
*
Author to whom correspondence should be addressed.
Sustainability 2022, 14(19), 12281; https://doi.org/10.3390/su141912281
Submission received: 29 July 2022 / Revised: 20 September 2022 / Accepted: 21 September 2022 / Published: 27 September 2022

Abstract

:
As an “integrated” agenda, the Sustainable Development Goals (SDGs) acknowledge the interwoven nature of social and ecological systems. However, trade-offs between socio-economic activities and environmental preservation put the implementation of the SDGs at risk. The purpose of the present study is to uncover such trade-offs, by analysing interlinkages between economic and environmental SDGs in the Austrian context. We applied a mixed-methods approach, combining Spearman’s correlation analysis with expert judgement. Our results reveal that increasing gross domestic product (GDP) per capita (SDG 8) in Austria is accompanied by rising material consumption (SDG 12) and environmental pressures from agricultural production (SDG 2), which in turn has an impact on land ecosystems (SDG 15). We also detect synergies within the economy–environment nexus, such as of protected areas (SDG 15) and organic farming (SDG 2) with water quality (SDG 6). We conclude that in the face of climate change and ecological degradation, decision-makers need to take into account interlinkages between economic and environmental SDGs. When economic aspirations are in contrast with the preservation of the ecological foundations our societies depend upon, it is crucial that environmental goals receive more attention than they previously have.

1. Introduction

As the world is facing increasingly complex challenges, such as climate change [1], ecological degradation [2] and biodiversity loss [3], human (socio-economic) development potentially threatens the ecological foundation upon which it depends [4,5]. Increasing material and energy use and the corresponding generation of waste and emissions have led to numerous environmental pressures, resource scarcity and global environmental change [6]. Calling for urgent policy action to counter these issues, several researchers have emphasised the need for sustainable human development to operate within a safe and just space [7] without transgressing biophysical planetary boundaries [8,9,10]. The 2030 Agenda with its 17 Sustainable Development Goals (SDGs) is the most ambitious political commitment to sustainable development, recognising that the preservation of the Earth’s ecological functioning is a necessity for human societies to thrive [10]. As such, SDG implementation needs to acknowledge and eliminate potential trade-offs between economic growth and environmental preservation. However, several scholars have criticised the SDGs for prioritising economic aspirations over ecological goals [4,5,10,11]. Thus, it is crucial to identify interlinkages between the economic and the environmental SDGs in order to inform policy-making on how to achieve truly sustainable human development.
In recent years, a growing number of studies have been devoted to assessing interlinkages (synergies and trade-offs) between and within the SDGs [12,13,14,15,16,17,18,19,20]. However, to our knowledge, very few of them explicitly deal with the economy–environment nexus [16,21], instead either analysing a more general picture [14,15,20] or focusing on one specific thematic area [12,22]. Moreover, several researchers highlight that most SDG interactions are not universal in nature, but depend on the given geographical and institutional context [23,24,25]. In order to support policy-making towards environmental preservation on the national scale, there is, consequently, a need for case studies assessing SDG interlinkages in their specific context.
The present study addresses this research gap by conducting a context-sensitive assessment of synergies and trade-offs between economic and environmental SDGs for the case of Austria. The study addresses two overarching questions:
  • Which synergies and trade-offs exist both within and between all 17 SDGs in Austria?
  • Focusing on interactions of economic and environmental SDGs, which concrete causal relationships exist between socio-economic activity and environmental conditions in Austria?
Recognising that different methods may yield different results, we apply two widely used methods for analysing SDG interlinkages, correlation analysis and expert judgement. This allows us to highlight the ways these methods lead to different findings while, at the same time, emphasising crucial interactions identified by both methods. Our aim is to contribute to an understanding of SDG interlinkages in the economy–environment nexus in order to support urgently needed national policy-making in this area, while opening up a platform for comparison with future case studies.
The rest of this paper is structured as follows. First, we briefly delve into the theoretical background and context of our analysis. Second, we provide an overview of our mixed-methods approach and the dataset used. Third, we present the main results of our analysis. Fourth, we discuss implications of our findings for designing sustainable development policies and critically investigate limitations and advantages of our method. Finally, we draw conclusions from our results.

2. Background

The adoption of the 2030 Agenda in 2015 posed a landmark for global sustainable development. In contrast to previous international agreements, such as the Millennium Development Goals (MDGs) or the Rio+ process, the Sustainable Development Goals (SDGs) emphasise the crucial nature of interlinkages [25]. The 17 goals and 169 targets are underpinned by an understanding of sustainable development as a process connecting societal well-being, economic prosperity and environmental protection [26]. Since these three spheres and, consequently, the related challenges the 2030 Agenda aims to tackle are interdependent, so too are the SDGs themselves. In response to problems stemming from the fragmentation and siloed implementation of the MDGs [23], the UN committed to the principle of “indivisibility” of the SDGs and to the significance of policy coherence and integration [26]. Thereby, the 2030 Agenda aims for a holistic approach to sustainable development, recognising that policies in one area might have positive or negative impacts on other areas [27]. However, partly due to this indivisibility, the formulation of the SDGs was the result of years of intergovernmental negotiations and political compromise [25,28]. Thus, the resulting policy goals may now be both potentially diverging and mutually supportive [14].

2.1. Trade-Offs between Socio-Economic Development and Environmental Preservation

Defining SDG policies and, ultimately, fulfilling the 2030 Agenda requires an understanding of the inherent interlinkages [29]. This is of particular urgency concerning climate change and ecological degradation. Potential conflicts between economic growth and environmental preservation, as highlighted by numerous scholars [4,30,31,32,33,34,35], need to be addressed by policy-makers in order to prevent the impending ecological collapse while ensuring a good life for all within planetary boundaries [9]. Identifying trade-offs between and within the SDGs may support the implementation of appropriate mitigation and adaptation measures [23]. Drawing on empirical data, Hickel [31] demonstrates that the SDG 8 target of economic growth is incompatible with the SDG 12 and 13 targets of reducing resource consumption and carbon emissions. In a case study of SDG interlinkages in coastal Bangladesh, Hutton et al. [16] identify trade-offs between economic growth (SDG 8) and resource-intensive progressive farming (SDG 2) on the one hand, and environmental impacts on water and land ecosystems (SDGs 14 and 15) on the other. Scherer et al. [17] investigate the environmental impacts of reducing poverty (SDG 1) and inequality (SDG 10) and highlight the need for high-income groups to reduce their footprints radically, balancing out the environmental impacts of pursuing social goals. They emphasise the importance of designing integrative policies across sectors and actors in order to respond appropriately to the trade-offs they identify between social and environmental SDGs. At the same time, comprehending synergies both between and within the SDGs may enable policy-makers to unlock co-benefits that support a faster, more efficient implementation of the SDGs [23]. For instance, in a projection for the year 2050, Springmann et al. [36] show that changing food consumption patterns in favour of a more plant-based diet could reduce food-related greenhouse gas (GHG) emissions by up to 70% while also decreasing global diet- and weight-related mortality by up to 10%, when compared to a reference scenario. This suggests potentially synergistic relationships of SDG 2 (agriculture), SDG 3 (health) and SDG 13 (climate).

2.2. SDG Interlinkages Depend on the Specific Context and the Method Used

While there is consensus in the literature that, in general, SDG interlinkages exhibit more synergies than trade-offs, there is no agreement on the specific nature of these interactions. Different studies use different methods and levels of analysis (indicator, target or goal), identify different interactions and vary in their assessment of how interlinkages affect the overall progress towards the 2030 Agenda [10,13,20,22,24,37,38,39]. Several scholars, thus, highlight the context specificity of SDG interlinkages [12,18,19,22,23,25,29,40,41]. However, only a few studies directly consider this context specificity [25].
Some studies account for context dependence by focusing on specific thematic areas. With regard to SDG 14 (Life below water), Singh et al. [22] find that the realisation of many co-benefits among the SDGs is dependent on the socio-ecological context and policy implementation. Focusing on interlinkages between environmental and social goals, Scherer et al. [17] show that, in general, the pursuit of social goals is associated with higher environmental impacts. Regarding SDG 6 (Clean Water and Sanitation), Requejo-Castro et al. [12] find that this goal displays both direct and indirect interlinkages with a range of other SDGs from the social, economic and environmental realm.
Other researchers emphasise the impact of contextual dimensions, such as resource endowments, institutions or the analysed time horizon [18,19,20,23,40,42,43,44]. Nilsson et al. [19] advise against generalising SDG interlinkages by emphasising the influence of country-specific differences in geography, governance or technology (see also McCollum et al. [40] for an elaboration of these contextual factors). In a follow-up article, Nilsson et al. [23] conclude that even some of the interlinkages that appear to be universal in nature, such as interactions between gender equality and health outcomes, may differ in terms of their specific impact.
A few studies focus on interlinkages in the national context, such as for Sweden [20], Spain [45] and coastal Bangladesh [16]. Both Weitz et al. [20] and de Miguel Ramos and Laurenti [45] analyse SDG interlinkages on a target level, but they use different methods—expert judgement combined with network analysis and correlation analysis combined with regression analysis, respectively. While their results are not directly comparable because they did not pick the same range of targets, overall, the character of the interlinkages identified clearly differ from each other. It is uncertain whether these differences stem from the specific country contexts or from a methods bias. While not conducting a mixed-methods study themselves, Lyytimäki et al. [43] recommend to complement expert judgements with data-intensive quantitative approaches using SDG indicators.
The present study acknowledges the context specificity of interlinkages regarding all aforementioned aspects. It focuses on the thematic area of the economy–environment nexus, accounts for several of the contextual dimensions established by Nilsson et al. [19], incorporates the country-specific context by analysing the case of Austria and aims at reducing the methods bias through conducting a mixed-methods approach. We apply two different methods, expert judgement and correlation analysis, as recommended by Lyytimäki et al. [43]. To ensure compatibility of the two methods, we conduct both analyses on the indicator level. The choice of Austria as object of our case study follows the argumentation of Weitz et al. [20] for focusing their own analysis of SDG interlinkages on Sweden due to their familiarity with the country’s context. Moreover, we consider Austria an interesting case, because of its relatively high SDG performance coupled with comparatively low progress over the past years [5,33,46,47]. As shown by Kostetckaia and Hametner [13], slow SDG progress might be due to the existence of trade-offs, making the country an ideal candidate for an in-depth study of SDG interlinkages.

3. Materials and Methods

3.1. Data Source

Data for the correlation analysis were obtained from the EU SDG indicator set, which was developed by the EU’s statistical office, Eurostat, in 2017. We used the EU’s indicator set, because it provides open and easy access to the most recent data for the EU as a whole and for its Member States. The EU indicators allow for a detailed analysis of both the EU and its Member States in relation to the 2030 Agenda and can be considered the most appropriate indicator set when monitoring the SDGs in an EU context [48]. Importantly, the EU set of indicators allows for cross-country comparison while assuring high quality standards [27,48], thus, allowing comparability with future studies of SDG interlinkages in other EU countries.
The Eurostat list of indicators provides data both on the EU-aggregated level and on a country level for all EU Member States. The version of the indicator set used in this study stems from June 2020 and contains 100 indicators, structured according to the 17 SDGs. Each SDG consists of five to six main indicators plus additional multi-purpose indicators that are assigned to one SDG, but are also used to monitor other goals. Since the Eurostat indicator set lacks Member State data for some environmental indicators, the following data were added for the purpose of this study: The indicator common farmland bird index was included since the overall common bird index was only available on the EU level. The indicator domestic material consumption (DMC) was incorporated as a measure of absolute resource use in addition to resource productivity, which monitors efficiency in terms of the ratio of gross domestic product (GDP) to DMC [10]. Country data on mean near-surface temperature deviation for Austria were added as a replacement for the respective indicator available from Eurostat, which only includes data at the aggregated global and European levels.
Consequently, 95 indicators with SDG data for Austria were used in this study. Data were extracted from the Eurostat website in June 2020; data for Austrian mean near-surface temperature were provided by the Institute of Meteorology and Climatology at the University of Natural Resources and Life Sciences (Vienna) in August 2020.

3.2. Correlation Analysis

This study was designed as a data-driven mixed methods approach. The first part of the analysis consisted of a correlation analysis with the aim of identifying interlinkages among all 17 SDGs. We calculated bivariate correlations between unique pairs of indicator time series for Austria, using Spearman’s rank correlation, which is widely applied for quantitative analysis in the SDG interlinkages literature [13,14,15,21,41,45,49]. Spearman’s correlation coefficient is a measure of the strength of monotonic relationships between two variables [50]. It is able to capture both linear and nonlinear correlations and is less sensitive to outliers than Pearson’s correlation analysis [51].
We applied Spearman’s rank correlation to all possible combinations of unique indicator pairs, using time series data between 2009 and 2019. This allowed us to assess indicator relationships between, and within, the SDGs. Only indicator pairs with more than three common data points were included in the analysis, as a smaller amount of data may result in wrongfully identifying interlinkages [15]. When calculating correlations between two SDGs that share the same multi-purpose indicator, we excluded the paired multi-purpose indicators from our analysis to avoid the bias of such perfect correlations.
Correlations with a p-value below 0.05 were considered statistically significant [15,21,41,45]. In order to capture interlinkages as synergies and trade-offs, indicators were first classified according to their required direction for achieving the SDGs. Indicators whose value should decrease over time, such as ammonia emissions from agriculture, were assigned a negative sign, while indicators whose value is required to increase, such as share of renewable energy, were assigned a positive sign. Statistically significant correlations with a correlation coefficient ρ (Spearman’s rho) of less than −0.5 were considered as trade-offs, while correlations with a ρ value of more than 0.5 were regarded as synergies [14]. Indicator pairs with a correlation coefficient between −0.5 and 0.5 or with a p-value above 0.05 were classified as non-correlations. The correlation results for Austria were then aggregated on the SDG level by calculating the percentage of synergies, trade-offs and non-correlations within each SDG, as well as between every SDG pair [14,15,21,45].
To account for potential time lag effects, where one variable causes changes in another with a delay, we also performed a lagged correlation analysis for a subset of indicators from the economy–environment nexus [13,52] (see Section 3.3). As some interactions do not occur immediately but may take some time to manifest in the data, we calculated correlations with one of the paired indicators delayed by both one and two years. Using a time lag of more than two years was not possible, as in many cases the common time series would then have been too short to provide enough data points.

3.3. Expert Judgement

Significant strong correlations do not imply the existence of a causal relationship between two indicators. While some studies, such as Kroll et al. [14], Pradhan et al. [15], Warchold et al. [49] and Kostetckaia and Hametner [13], attempt to counterbalance this with a large amount of data, our smaller case study sample allowed us to look into the data more closely. Thus, we set up an expert panel in order to complement the quantitative part of the analysis with a qualitative assessment of interlinkages between the environmental and the economic SDGs. To enable comparisons between the expert judgement and the correlation analysis, we conducted the expert judgement at the indicator level (instead of at the more general goal or target levels), using a smaller sample of SDG indicators from the economy–environment nexus. Limiting the qualitative approach to a subset of the SDGs is necessary in order to complete the assessment in a reasonable timeframe. Even if a researcher were to contemplate each interlinkage for only five minutes, they would spend almost half of their annual (full-time) workforce completing the assessment of all possible indicator pairs of the EU SDG indicator set. The resulting subset of indicators consisted of 23 indicators and 253 possible combinations (see Table 1). We left out indicators expressed as a ratio, such as resource productivity, whose constituent parts were already incorporated as indicators in their own right in the used set, such as gross domestic product (GDP) per capita and domestic material consumption (DMC). Due to missing data for some of the nexus indicator time series, a total 185 out of the 253 nexus indicator pairs were comparable between the correlation analysis and the expert judgement. Therefore, the results of the comparison between the two methods presented in Section 4.2 and Section 4.3 below only refer to the 185 indicator pairs.
To harmonise the results of the expert judgement with those of the correlation analysis, we applied the same scaling to both analyses, so that interlinkages were classified as synergies, trade-offs and non-linkages for the expert judgement as well. Borrowing from the widely used [20,24,42,43,44] expert judgement approach developed by Nilsson et al. [19], we adopted some additional contextual dimensions. Besides judging indicator relationships, experts were asked to assess (1) the directionality of the interaction, i.e., whether one indicator is the driving force behind developments in the other, or if they are bidirectional, (2) the time horizon that interlinkages would unfold in (immediately, short-term and long-term), (3) whether trade-offs are reversible through governance and (4) whether trade-offs are reversible through technology. These dimensions were then used to contextualise the results, in particular for cases where the two methods arrived at different conclusions.
Eight experts (see acknowledgements) from academia with different specialisations (economics, water, ecology, landscape planning and climate risk management) performed the expert judgement, including the authors. When experts had diverging opinions, we decided according to the majority while also considering individual expertise or literature provided to back up a claim. A number of remaining cases—for which experts’ opinions were too diverging to aggregate via majority—were discussed and decided upon in the course of an expert workshop.

4. Results

Our results are presented below. First, we give a brief overview of the correlation analysis results for all 17 SDGs, both within and between the goals. Second, we present the results of the expert judgement and compare them with the results of both the lagged and the non-lagged correlation analysis, highlighting differences and similarities between the results of the two methods. Third, we present those interlinkages from the economy–environment nexus where both methods agree in their assessment.

4.1. Correlation Analysis

The correlation analysis (non-lagged) was conducted for all 17 SDGs. Multi-purpose indicators (indicators that are used for measuring progress on more than one SDG) were counted only once and indicators with less than four data points were left out, resulting in a total of 4301 combinations of indicator pairs. As Austria is a landlocked country, it lacks data on SDG 14 (Life below water), and consequently no results are presented for this goal in the sections below. We find that most of the correlations are either not statistically significant or strong enough to count as interlinkages, with 62% of the indicator pairings classified as non-linkages. The remaining 38% of the indicator pairs were classified as SDG interlinkages, with 26% of the correlations based on Austrian data being categorised as synergies and 12% as trade-offs.

4.1.1. Interlinkages within the SDGs in Austria

Figure 1 shows the shares of synergies, non-correlations and trade-offs within the SDGs in Austria, i.e., the relationships between indicators within the same goal. For almost all of the 17 goals, non-correlations make up the biggest share of interactions, with the exception of SDGs 3, 5, 9 and 13. Within the SDGs, synergies generally exceed trade-offs. Only SDGs 2 and 17 display more trade-offs than synergies, and SDG 15 has an equal share of both.
The analysis of interlinkages within the individual goals shows no clear pattern for the SDGs from the economy–environment nexus. Interlinkages within goals from this area range from barely to highly synergistic and from not antagonistic to pronouncedly antagonistic, relative to other goals. As an example, SDG 13 is a nexus SDG with relatively high synergy shares. Within SDG 13, the share of renewable energy in gross final energy consumption is synergistically correlated with greenhouse gas (GHG) emissions, the GHG emissions intensity of energy consumption, average CO2 emissions per km from new passenger cars and the population covered by the Covenant of Mayors for Climate and Energy signatories. Other synergies within SDG 13 include a positive correlation between GHG emissions intensity of energy consumption and overall GHG emissions, and between the population covered by the Covenant of Mayors for Climate and Energy signatories and average CO2 emissions per km from new passenger cars. Within SDG 2, organic farming displays trade-offs with a number of other indicators, namely the harmonised risk indicator for pesticides (HRI1), ammonia emissions from agriculture and the farmland bird index. Furthermore, the indicator nitrate in groundwater exhibits negative correlations with the farmland bird index and ammonia emissions from agriculture as well as the harmonised risk indicator for pesticides (HRI1).

4.1.2. Interlinkages between the SDGs in Austria

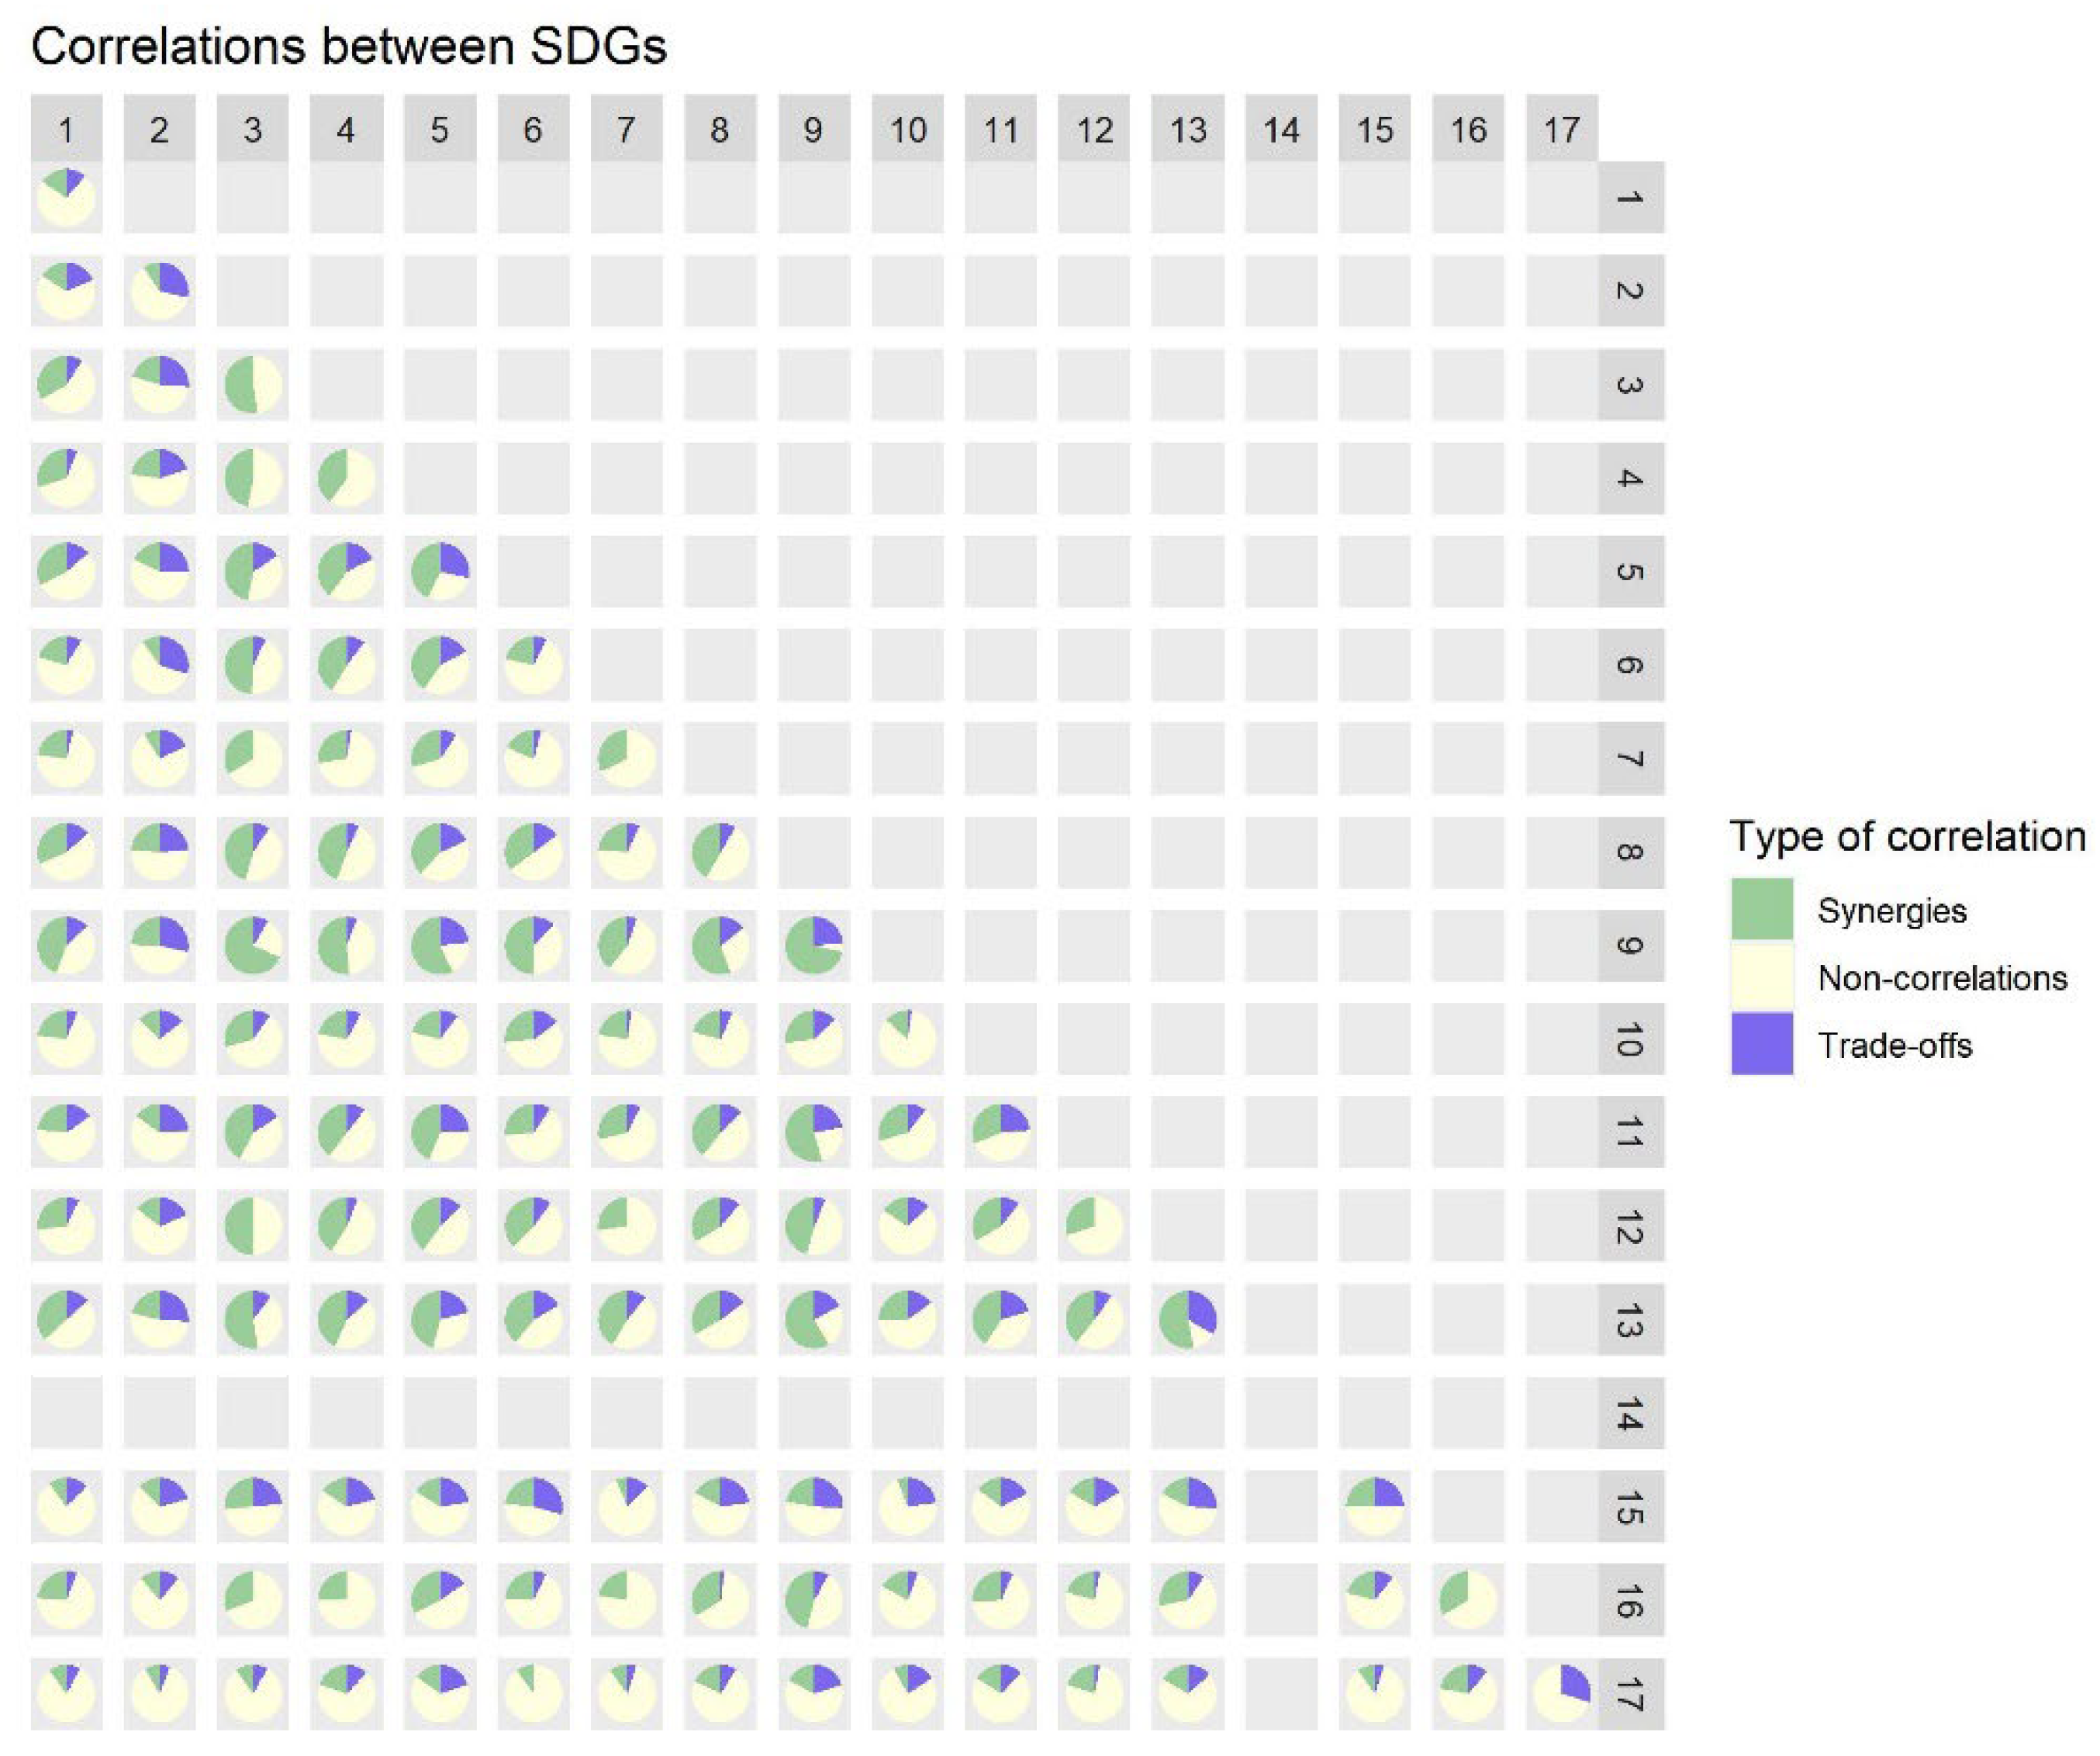
As with the interlinkages within the SDGs, the correlations between the different SDGs consist mainly of non-linkages that are not statistically significant and/or strong enough to count as interlinkages. Still, synergies outweigh trade-offs for the majority of the SDG pairs (see Figure 2). SDG 9 has the highest amount of synergies with indicators from other goals, followed by SDGs 3 and 13. On average, 41% of interactions of these three SDGs with other SDGs are synergistic. SDG 2, on the other hand, is one of the SDGs with the most frequent trade-offs with other goals, followed by SDGs 15 and 5. An average of 19% of indicator pairs from these goals are trade-offs. For 24 SDG pairs, the number of trade-offs outweighs the number of synergies. This is most often the case for SDG 2.
There is only a small amount of SDG pairs displaying a share of synergies above 50%. A notable exception is SDG 9 (see Figure 2). For example, the pairing of SDG 9 with SDG 3 experiences the highest fraction of synergies among the SDG pairs, with a 69% share of synergies. SDGs 2, 15 and 17, in contrast, only exhibit an average of 15% of synergistic interactions with other goals. There are no SDG pairs where trade-offs make up more than 30% of interlinkages between the SDGs. The pairing of SDGs 2 and 6 shows the largest share of trade-offs between the goals, with 30% of correlations being negative. However, the correlation analysis reveals a few synergies even for these goals, for example, between the area under organic farming and the bathing sites with excellent water quality. At an average of 7%, SDGs 7, 12 and 16 all have very low percentages of trade-offs with other goals.
Interlinkages between economic indicators, such as per-capita GDP, and environmental indicators are presented further in the following sections.

4.2. Comparison of Methods for Economy–Environment Nexus Interlinkages

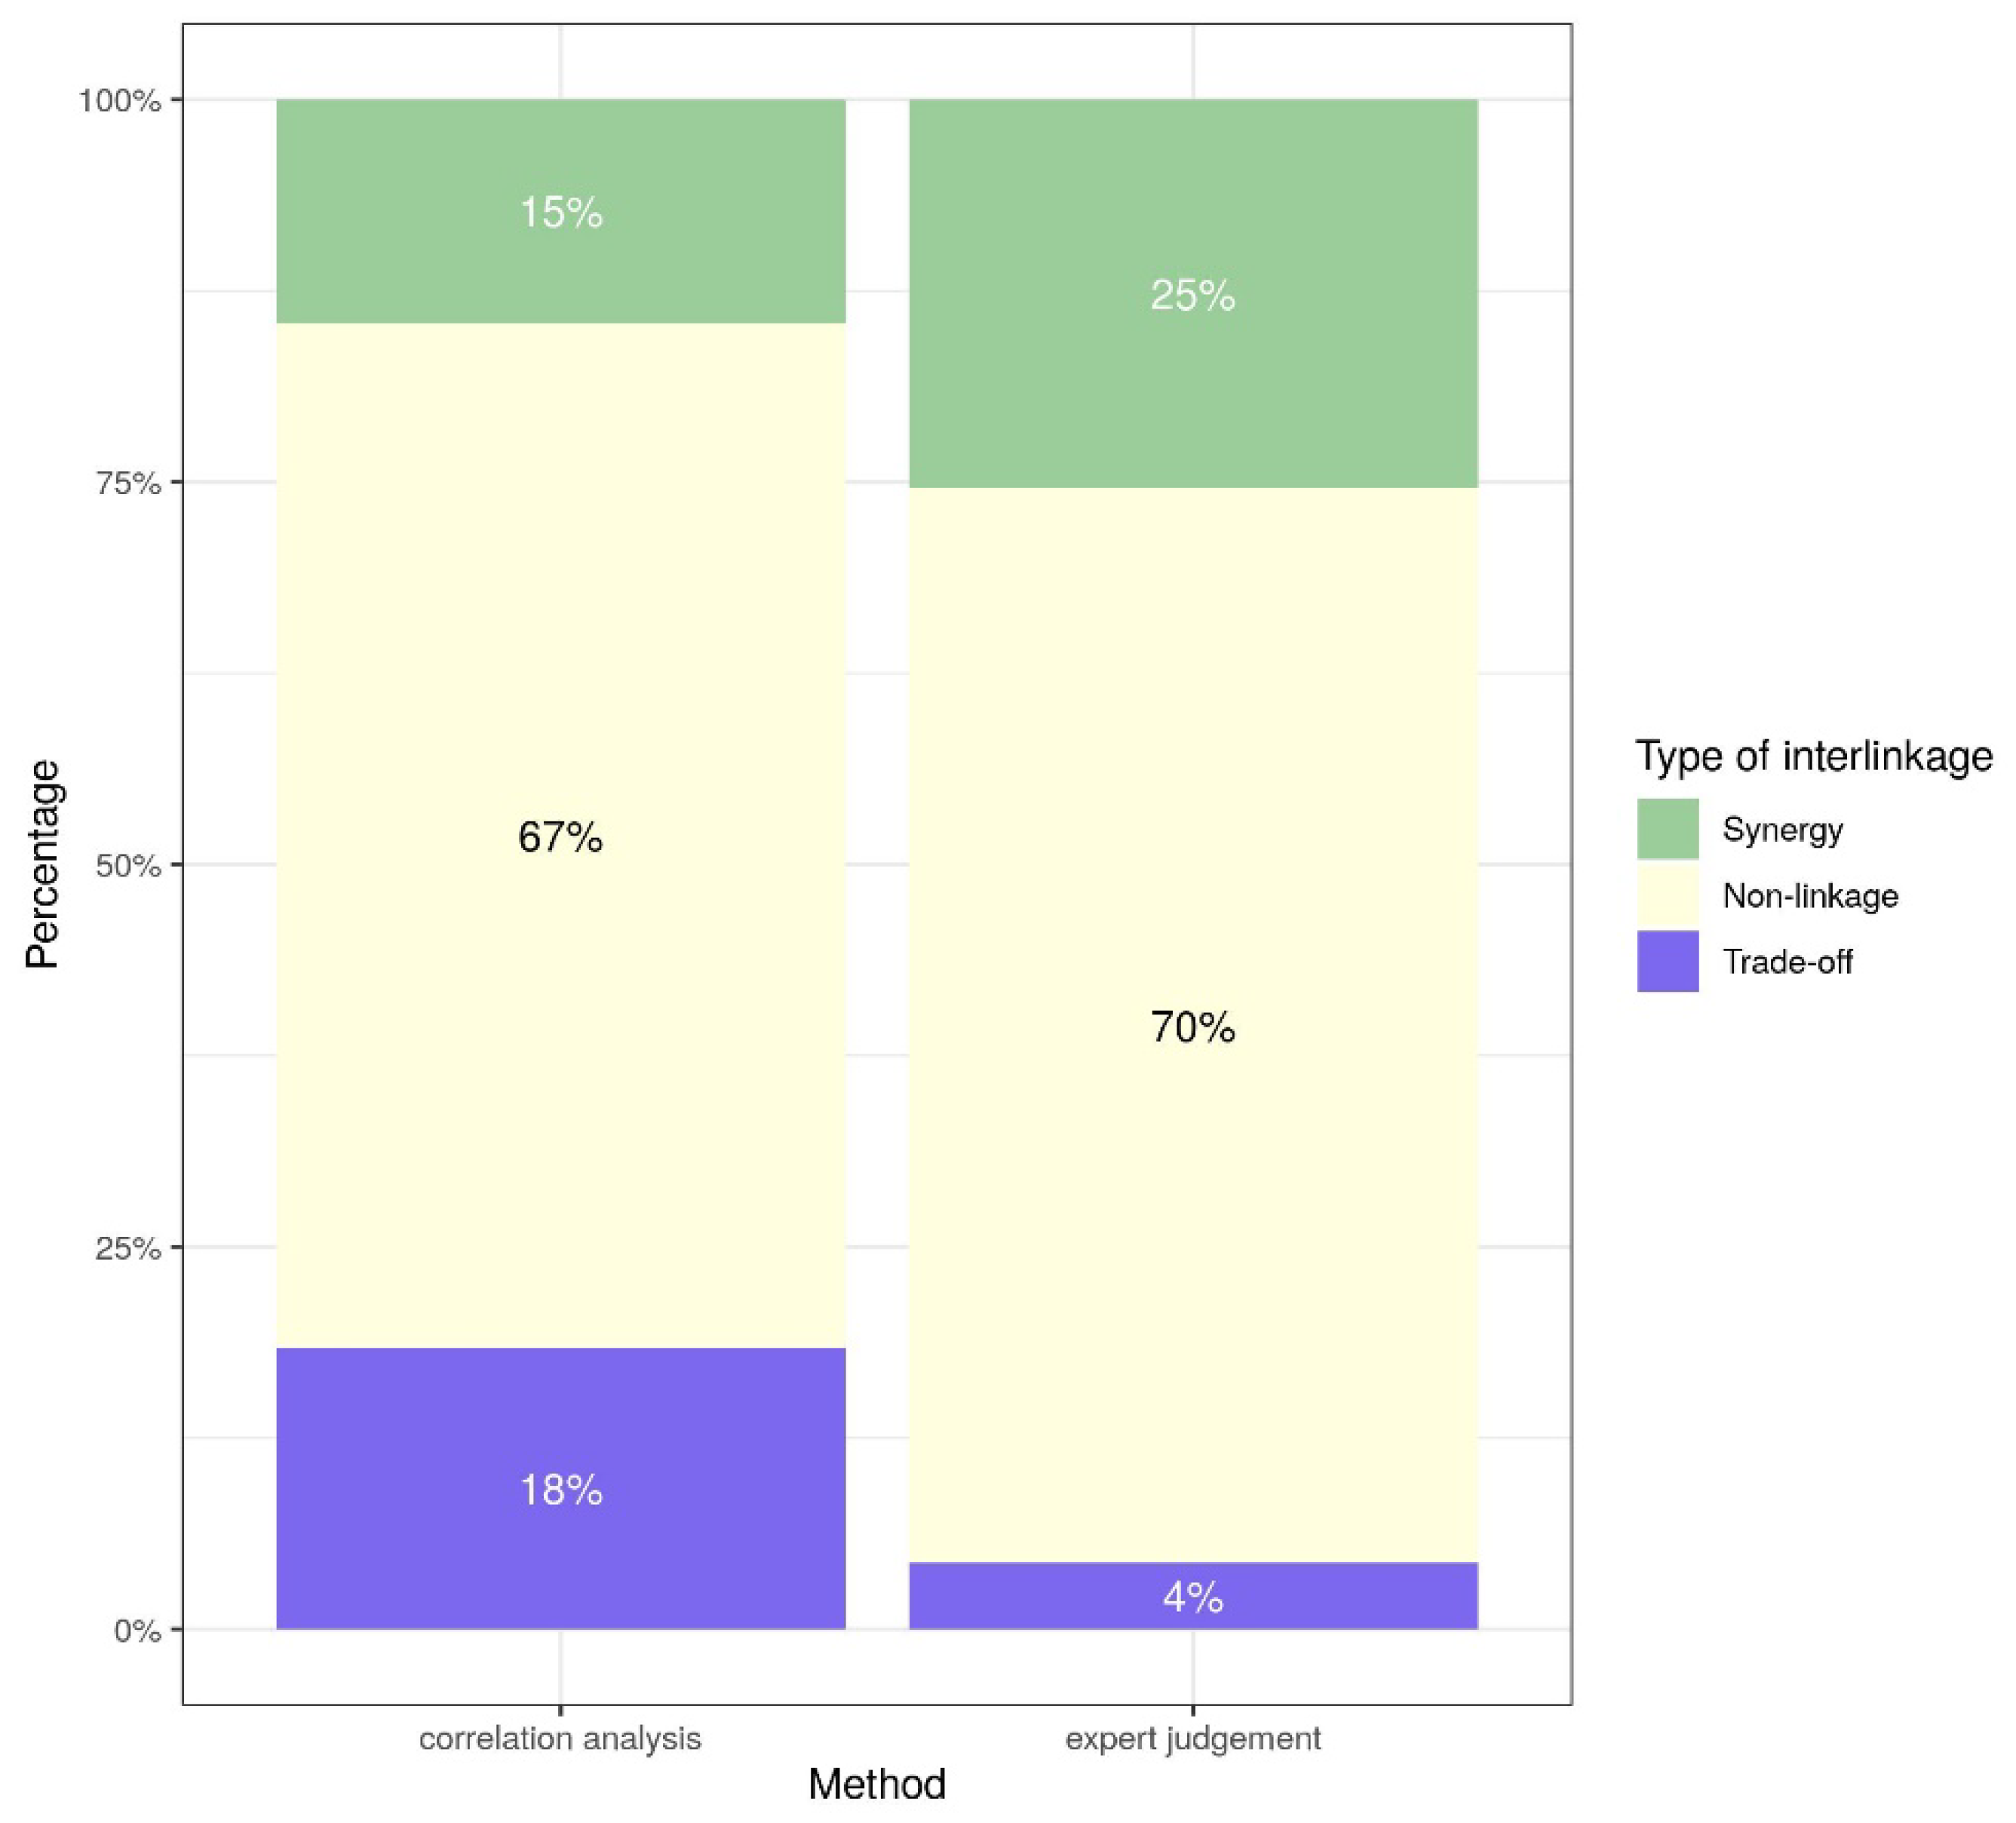
The results presented in the following paragraphs refer to the subset of SDG indicators from the economy–environment nexus (see Table 1). While more than two thirds of the nexus indicator pairs are not linked according to both the experts and the correlation analysis, there are considerable differences regarding synergies and trade-offs (see Figure 3). In contrast with the overall results presented above, the correlation analysis of the nexus indicator pairs shows a relatively large fraction of trade-offs (18%) alongside a relatively small share of synergies (15%). The expert judgement, on the other hand, stipulates a rather small percentage of trade-offs (4%) and a synergy share of 25%.
Figure 4 displays the percentage of agreement between both approaches (including the lagged correlation) per type of interlinkage. The highest share of agreement was found for non-linkages. Here, the correlation analysis confirms 75% of the non-linkages identified by the experts. For synergies, the correlation analysis agrees with 43% of synergistic interactions as specified by the expert judgement. While trade-offs display an agreement share of 50% between both methods, this number is to be interpreted with caution, as there are only eight trade-offs in total discerned by the experts.
The shares of interlinkages, as identified by both methods, is depicted in Figure 5. For around a third of the analysed nexus indicator pairs, the interlinkages indicated by the experts are not confirmed by the (normal and lagged) correlation analysis. Of all the nexus indicator pairs, 11% are classified as synergies by both the correlation analysis and the expert judgement, while only 2% are categorised as agreed-upon trade-offs for both methods. Half of the analysed nexus interactions are consistently rated as non-linkages across both analyses.

4.3. Economy–Environment Nexus Interlinkages Identified by Both Methods

In this section, we present the nexus indicator pairs where experts stipulated linkages between indicators and analyse those in relation to the correlation analysis. We allocated the resulting 55 indicator pairs (corresponding to the in total 30% synergies and trade-offs shown in the right-hand bar in Figure 3) to five different categories: agriculture, water, climate and energy, ecosystems and resource use. Real GDP per capita is the only indicator not assigned a category and serves as a cross-sectional indicator. Non-linkages are omitted from the analysis.

4.3.1. Agriculture Interlinkages

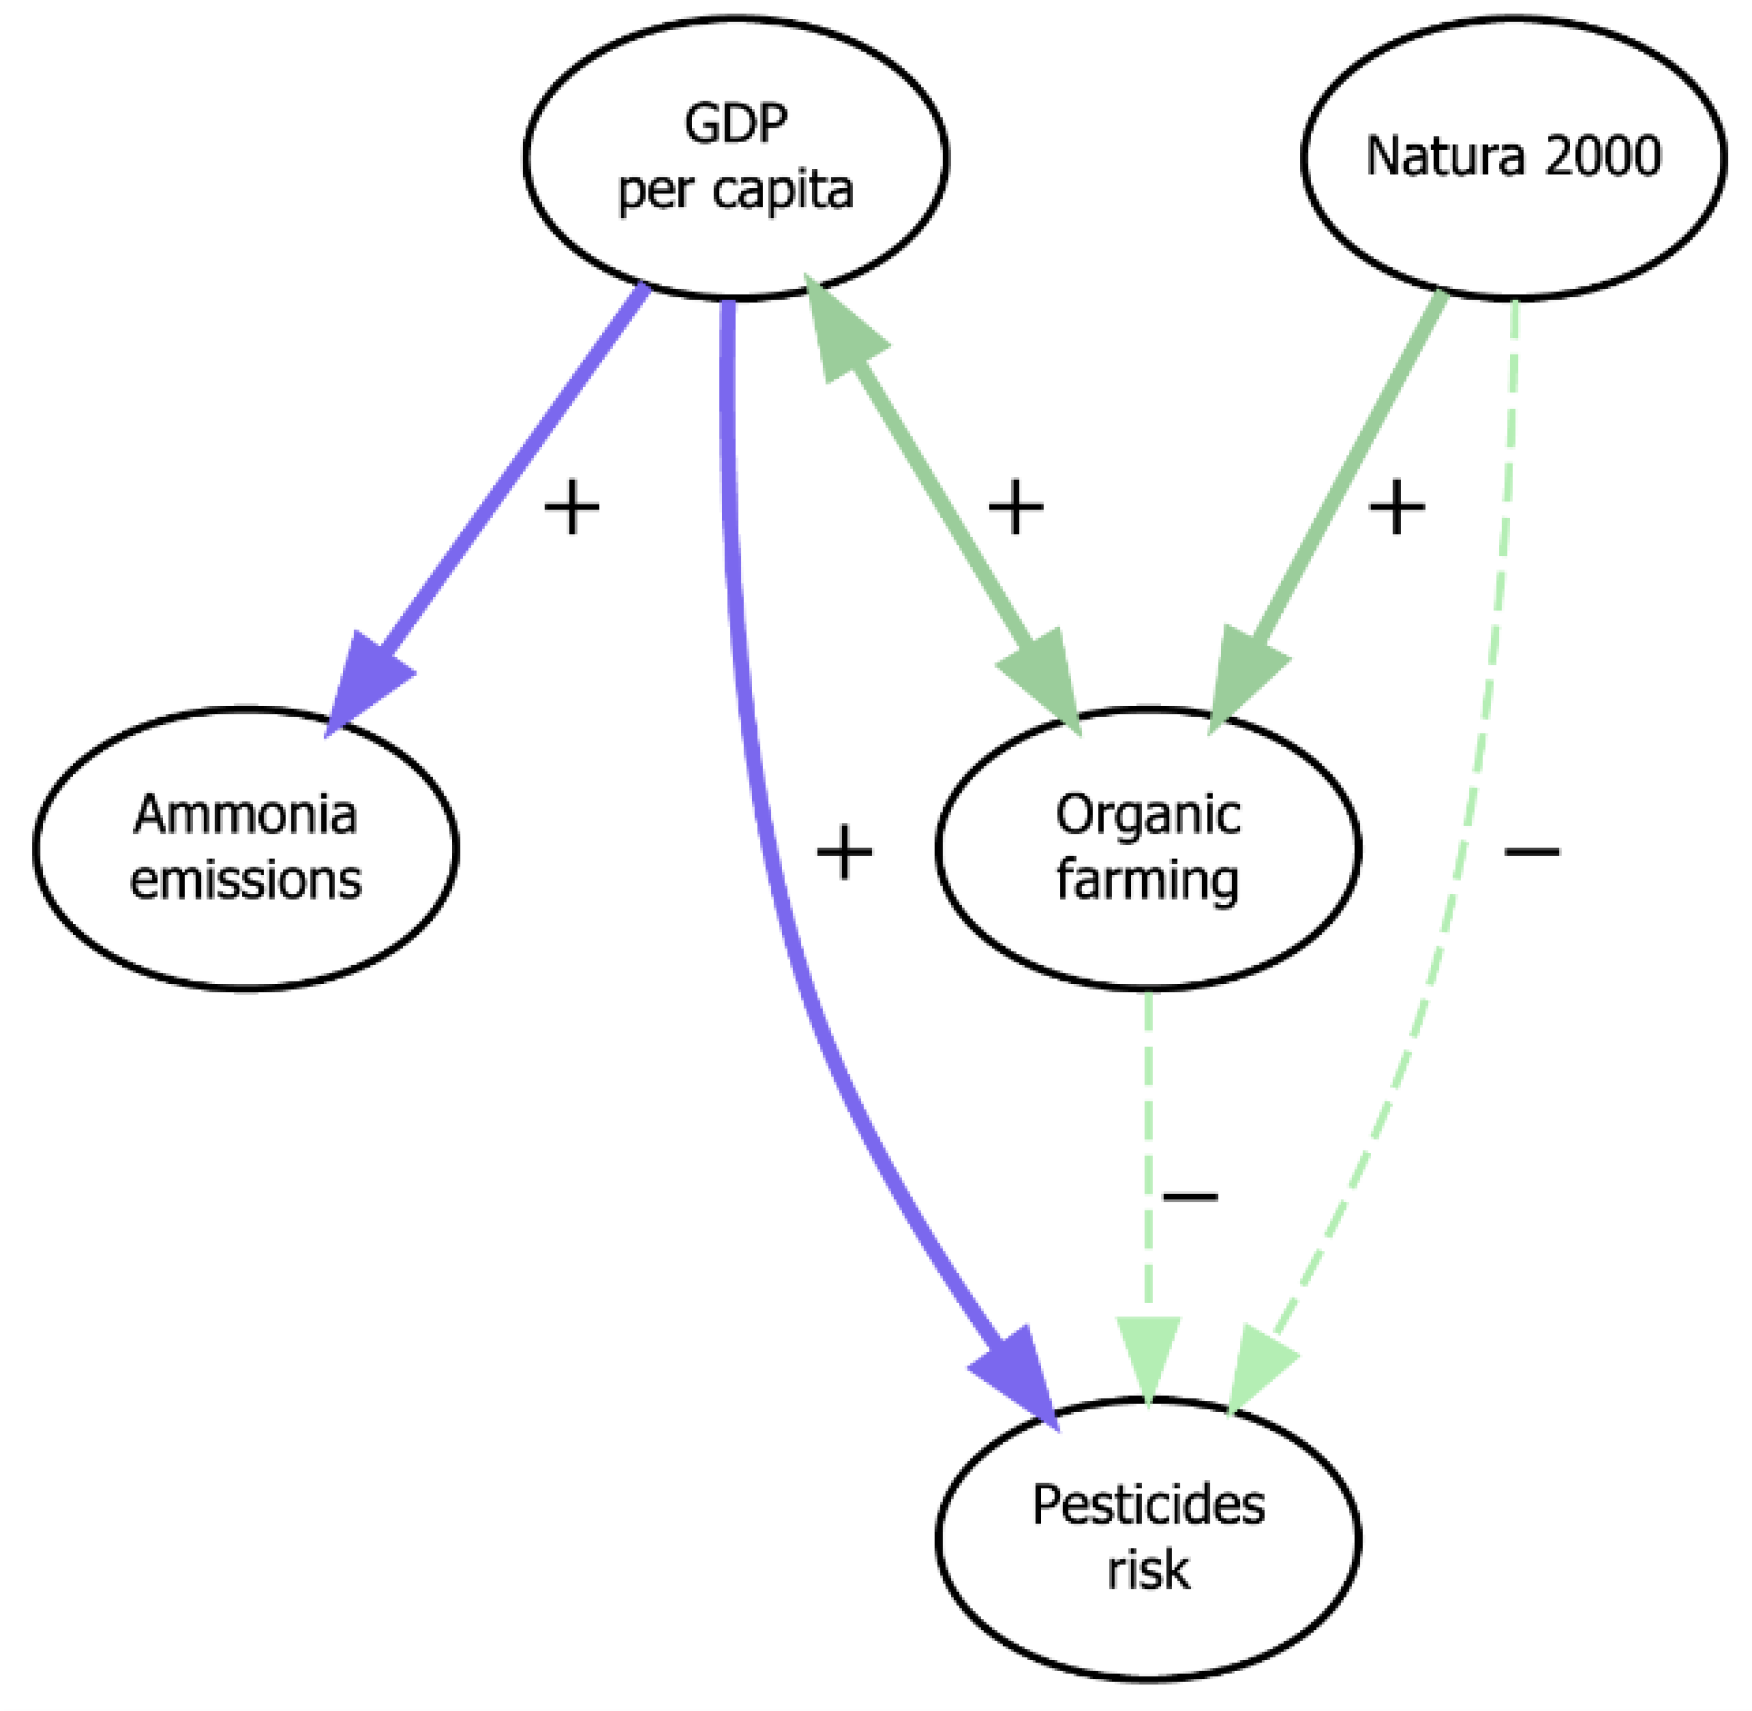
In the area of agriculture, a clear interlinkage is visible between GDP per capita and environmentally harmful consequences. Both the experts and the correlation analysis detected a trade-off between real GDP per capita and agricultural ammonia emissions. The experts generally agreed that this trade-off is driven by GDP growth, but had different opinions regarding the time horizon in which it unfolds. While there was no consensus, some of the experts suggested that the identified antagonistic relationship might be reversible by means of technology or governance mechanisms. Both methods also found a trade-off between GDP per capita and the Harmonised risk indicator for pesticides (HRI1). While the experts did not agree on the time horizon, most of them identified GDP as the cause of the trade-off. Thus, due to increasing per-capita GDP, ammonia emissions from agriculture and the risks from pesticide use increase as well (see Figure 6). The experts did not agree on the reversibility of this trade-off. With regard to organic farming, the experts and the correlation analysis identified synergies with two other indicators: real GDP per capita and Natura 2000 protected areas. The area under organic farming, thus, increases alongside growth in GDP and in the surface of terrestrial sites designated under Natura 2000. However, experts did not agree on the time horizon of either interaction.
There are two interactions in this category that were identified as synergies by the experts, but that were not confirmed by the correlation analysis. While the experts suggested a synergy between risks from pesticide use and Natura 2000 protected sites, the correlation analysis did not. Moreover, all experts unanimously highlighted a synergy between organic farming and pesticide risks, which was not confirmed by the correlation analysis.

4.3.2. Water Interlinkages

In the water category, the experts and the correlation analysis agreed on the existence of several synergies (see Figure 7). Concentrations of nitrate in groundwater are synergistically connected to three other indicators: organic farming, wastewater treatment and Natura 2000 protected sites. The experts agreed that increases in the area under organic farming might act as a driving force for reduced nitrate concentrations in groundwater. However, they highlighted the context specificity of this interaction, which depends on a range of factors and is not of universal nature. In the Austrian case, the correlation analysis confirmed the existence of a synergy. Both methods also agreed on a synergy between the percentage of Austrian population connected to waste water systems with at least secondary treatment and nitrate in groundwater. Thereby, improvements in wastewater treatment act as a driver for reducing nitrate concentrations in groundwater. The same is true for Natura 2000 sites, where increases in protected areas induce improved nitrate concentrations in groundwater. Both the Natura 2000 indicator and the share of population connected to at least secondary wastewater treatment are in turn synergistically interlinked with the biochemical oxygen demand in rivers. Increased access to wastewater systems, thus, leads to a lower biochemical oxygen demand in Austrian rivers, which acts as a proxy for water quality. The experts agreed that this interaction unfolds in a time horizon of less than two years. Furthermore, both methods identified a synergy between areas designated under Natura 2000 and the biochemical oxygen demand in rivers, with Natura 2000 sites acting as a driving force of the interaction.
In several cases, the experts identified an interlinkage (synergy or trade-off) in the water category that was not confirmed by the correlation analysis (see Figure 7). For example, while the experts claimed a trade-off between GDP per capita and nitrate in groundwater, as well as a synergy between GDP per capita and the share of population connected to at least secondary wastewater treatment, the correlation analysis did not confirm these linkages.

4.3.3. Climate and Energy Interlinkages

For climate and energy indicators, there are no agreed-upon trade-offs, but a range of synergies (see Figure 8). Greenhouse gas emissions are synergistically interlinked with both the level and composition of energy consumption in Austria. Lower levels of primary energy consumption, thus, lead to decreases in GHG emissions, as does an increased share of renewable energy in gross final energy consumption. Moreover, increases in the percentage of collective passenger transport (i.e., buses and trains) in total inland passenger transport lead to decreases in GHG emissions, according to both methods. Improvements in collective passenger transport are, in turn, synergistically related with primary energy consumption. Decreasing settlement area per capita also leads to lower energy consumption according to the expert judgement, indicating a synergy between the two indicators, which the correlation analysis confirmed.
While the experts identified synergies between GHG emissions and several other indicators (the amount of domestic material consumption, recycling of municipal waste, Natura 2000 protected sites and the share of rail and inland waterways in total inland freight transport), the correlation analysis did not confirm these interlinkages. The experts also discerned trade-offs between organic farming and energy consumption and between GDP per capita and GHG emissions, as well as energy consumption, which were not verified by the correlation analysis. Regarding the unconfirmed trade-off between organic farming and energy consumption, some of the experts stated that this linkage might be dependent on a range of factors. The experts generally agreed that the trade-off between per-capita GDP and primary energy consumption was reversible. Most of them stated that such a reversibility could be achieved through appropriate governance mechanisms, while one expert indicated that only technological approaches might reverse this antagonistic relationship. While one expert explicitly stated that the trade-off between GDP per capita and GHG emissions was not reversible, the majority agreed that both technological and governance measures may disperse this antagonistic relationship.

4.3.4. Ecosystems Interlinkages

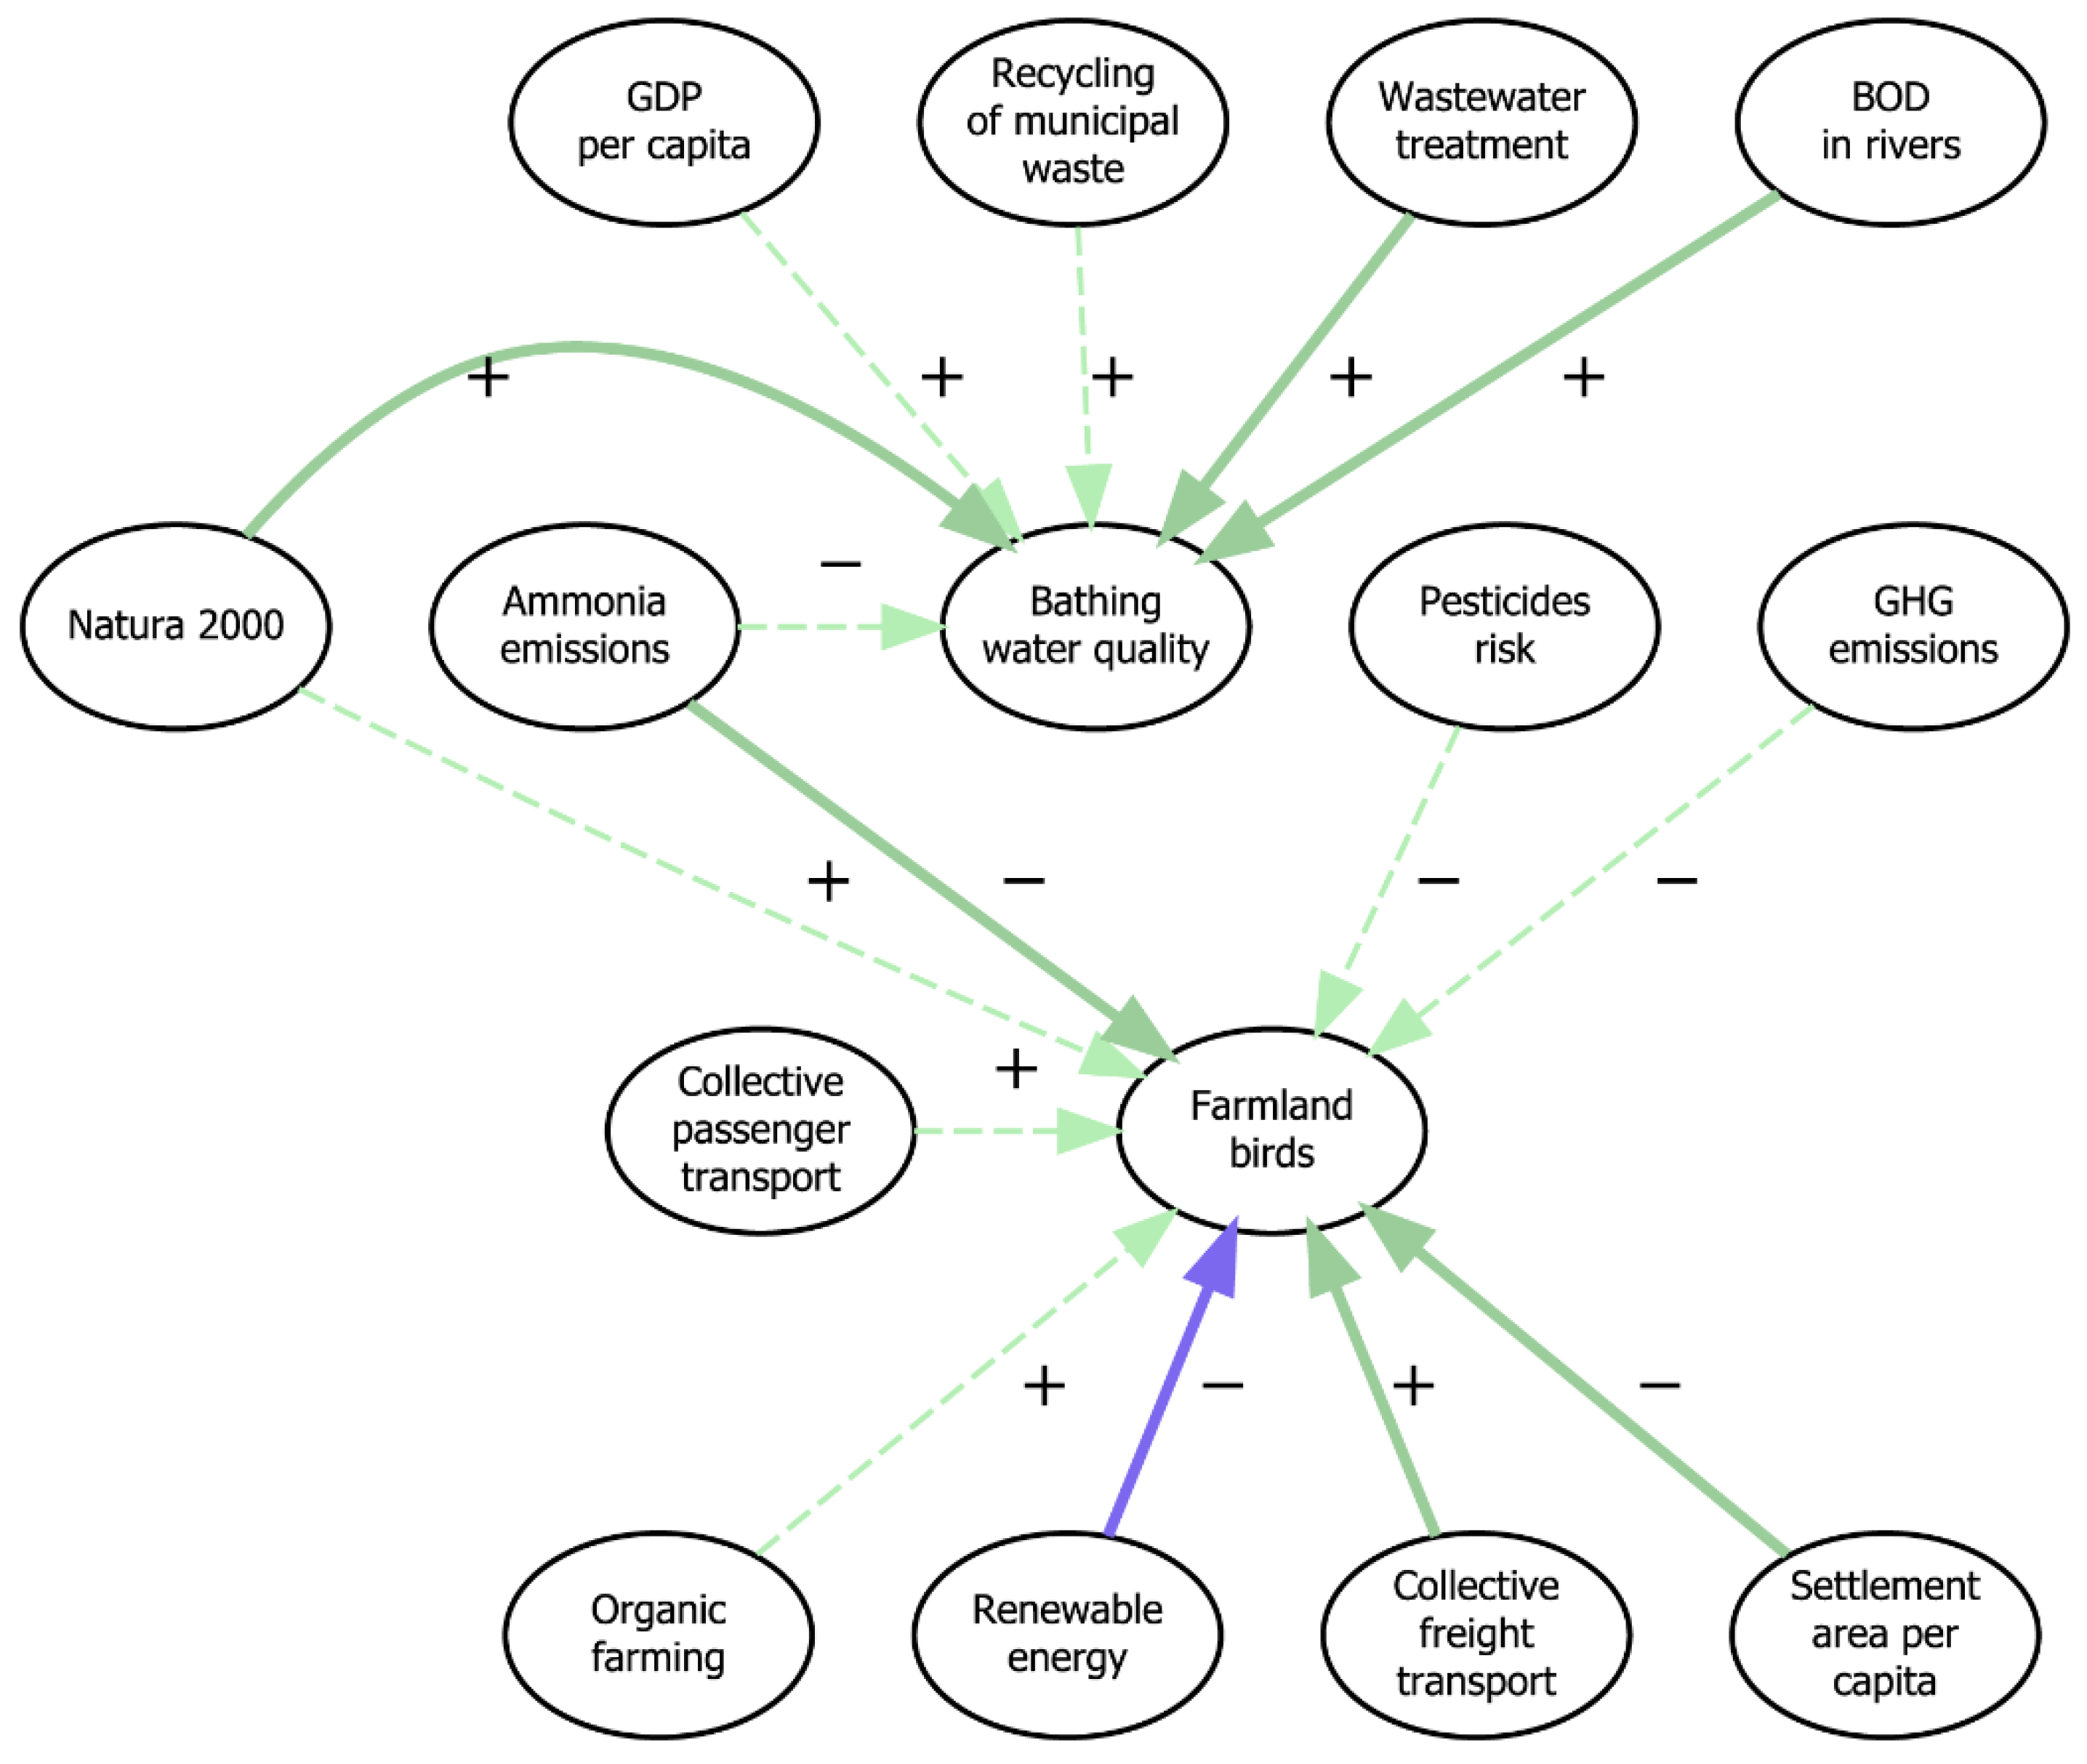
In the area of ecosystems, there is agreement on several interlinkages between the correlation analysis and the expert judgement (see Figure 9). Natura 2000 protected areas exhibit a positive influence on Austrian bathing water quality, as does the share of population connected to at least secondary wastewater treatment. Furthermore, improvements in the biochemical oxygen demand in rivers also lead to improvements in bathing water quality, with the synergy occurring within a time horizon of less than two years. The farmland bird index is another indicator displaying relatively many interactions with other indicators. Both applied methods determined a synergy between Austrian farmland birds and ammonia emissions from agriculture, with reductions in ammonia emissions leading to improved abundance and diversity of farmland bird species. Farmland birds are also synergistically influenced by the settlement area per capita and the share of rail and waterways in collective freight transport. Both methods, however, found a trade-off between the farmland bird index and the share of renewable energy in gross final energy consumption. In this context, the experts highlighted the danger of wind turbines to farmland birds. The experts did not reach an agreement on whether the identified trade-off between renewable energy and farmland birds was reversible.
At the same time, a number of interlinkages identified by the experts were not confirmed by the correlation analysis. For example, there is no significant correlation between bathing water quality and recycling of municipal waste, even though the experts identified a synergy in this case. In fact, the interaction between bathing water quality and ammonia emissions, which was deemed a synergy by the experts, was identified as a trade-off by the correlation analysis. Moreover, the data did not confirm expert judgement synergies between the farmland bird index and organic farming practices or environmental pressures, such as GHG emissions and pesticide risk.

4.3.5. Resource Use Interlinkages

With regard to resource use, both methods revealed a trade-off between domestic material consumption and GDP per capita (see Figure 10). While the experts disagreed on the question of whether this trade-off was reversible by means of technology, most of them indicated that it could be reversed through governance mechanisms. Another interlinkage identified by both methods is a synergistic relationship between domestic material consumption and settlement area per capita. Thus, reducing settlement area per capita could have positive impacts on the amount of materials consumed in Austria. Finally, the share of population connected to wastewater systems with at least secondary treatment displays a synergy with the circular material use rate.
Most interlinkages detected by the experts in this category were not confirmed by the correlation analysis. For instance, according to the experts, the recycling rate of municipal waste synergistically interacts with a number of indicators, such as domestic material consumption or the circular material use rate. These interlinkages were, however, not supported by the correlation analysis.

4.3.6. Economy–Environment Nexus Interlinkages in Austria

In total, there are 18 (of 23 analysed) nexus indicators with agreed-upon interlinkages with other nexus indicators. Interlinkages per indicator range from one to four. The nexus indicators displaying the most synergistic relationships with other indicators are wastewater treatment and Natura 2000 protected areas, while the indicator with the highest number of trade-offs with other indicators is GDP per capita (see Figure 11). GDP per capita is part of almost all identified nexus trade-offs, except for one trade-off between farmland birds and the share of renewable energy. The indicator for Austrian farmland birds is impacted most often by other indicators, followed by bathing water quality, nitrate in groundwater and GHG emissions. On the opposite side, Natura 2000 protected sites, wastewater treatment and GDP per capita are the nexus indicators with the highest impact on other indicators, according to the directionality of their interlinkages with other indicators assigned by the experts.
Figure 11 highlights interdependencies between economic and environmental SDG indicators in Austria. It shows how Austrian economic activity and resource use patterns directly and indirectly influence environmental variables. For example, with growing GDP per capita, agricultural ammonia emissions also increase, which in turn harm Austrian farmland bird populations. At the same time, rising settlement area per capita also negatively impacts farmland birds, highlighting a synergy between these indicators, whereby reducing settlement area could also improve bird populations. Furthermore, settlement area displays synergies with energy and material consumption, suggesting that all three variables might be reduced at the same time, with settlement area per capita acting as a driver of the synergistic relationship. This would also have a positive impact on GHG emissions, as energy consumption affects the level of GHG emissions in Austria. The trade-off between GDP and GHG emissions identified by the experts is not supported by the data. Other resource use variables that influence GHG emissions are collective passenger transport (both directly and via its interlinkage with energy consumption) and the share of renewable energy. Improvements in both indicators lead to reductions in GHG emissions. However, while higher shares of renewable energy in Austria lead to lower GHG emissions, the analysis also reveals a trade-off between renewable energy and farmland bird populations (see Section 4.3.4). A higher percentage of collective freight transport in inland freight transport is, however, beneficial for Austrian farmland birds. Increasing shares of organic farming, which are supported by growing GDP and Natura 2000 protected sites, positively influence levels of nitrate in Austrian ground water, as does wastewater treatment. Furthermore, both Natura 2000 areas and wastewater treatment are synergistically interlinked with other indicators of water quality in Austria.

5. Discussion

5.1. Interlinkages of All 17 SDGs in Austria

The results of the correlation analysis of all SDG interlinkages based on Austrian data—with 26% synergies, 12% trade-offs and 62% non-correlations—confirm previous findings that synergies outweigh trade-offs [13,14,15,21,41] and that the majority of SDG indicators are actually not linked with each other [13,49].
Regarding interlinkages within the SDGs, our results confirm previous findings that SDG 3 has a high fraction of synergies among its own indicators [14,15]. In line with existing studies, we also detected high shares of synergistic relationships within SDG 9 [14], SDG 13 [15] and SDG 5 [49]. According to our analysis, SDG 2 displays several antagonistic relationships among its own indicators, confirming existing research [14,49]. The high share of trade-offs detected within SDG 13 is in line with Kroll et al. [14], but in contrast with Pradhan et al. [15], while the large amount of trade-offs within SDG 5 confirms findings by Warchold et al. [49]. In contrast with the existing literature, we also found a high percentage of trade-offs within SDG 17, which may be a result of the specific Austrian context. Concerning interlinkages between the SDGs, our results revealed that SDGs 3, 9 and 13 display high percentages of synergies with other goals, confirming findings by Pradhan et al. [15] regarding SDG 3 and by Kostetckaia and Hametner [13] regarding SDGs 9 and 13. In line with previous studies, we also found large fractions of trade-offs with other goals for SDG 2 [49], SDG 15 [15] and SDG 5 [13,49].

5.2. The Economy–Environment Nexus

Focusing on the economy–environment nexus, we found that economic growth (SDG 8) in Austria is interlinked with environmental pressures, as expressed by a range of environmental and resource use SDG indicators. Of all nexus interlinkages agreed upon by both the expert judgement and the correlation analysis, GDP per capita displays the highest amount of trade-offs with other indicators. Crucially, the analysis revealed a trade-off between economic growth and material consumption (SDG 12) in the Austrian context. This trade-off is of central importance when it comes to designing sustainable development policies. While the indicator domestic material consumption (DMC) does not directly monitor environmental degradation, it is a widely used proxy for environmental pressures resulting from human activities [6,32]. Thus, in order to stay within planetary boundaries and to prevent overexploitation of the Earth’s resources, material consumption needs to be drastically reduced [4].
There is a longstanding academic debate on whether a reduction in resource use is possible alongside economic growth. The SDGs themselves implicitly assume that productivity and efficiency gains are able to reconcile GDP growth with resource consumption (i.e., reducing the amount of resources consumed per unit of GDP). However, our correlation analysis only identified one significant synergy between energy productivity and GHG emissions intensity of energy consumption. Apart from that, no synergistic relationships between productivity indicators and environmental indicators exist. Moreover, productivity may increase without an absolute reduction in resource use, when GDP increases faster than resource use, which does not alleviate environmental pressures. To reconcile economic growth with reduced resource use, the two variables would need to achieve absolute decoupling from one another [31,53]. Several scholars have already demonstrated that there is no evidence of sustained absolute decoupling of economic growth from resource use, whereby GDP increases while resource use declines [31,32,53]. Therefore, Hickel [31] argues that SDG 8, as currently defined through economic growth, is not compatible with the sustainability objectives of reducing material consumption and carbon emissions.
Our analysis also revealed trade-offs between economic growth and environmental pressures from agricultural production (SDG 2). Rising GDP per capita in Austria is interlinked with higher pesticide risks and increasing ammonia emissions from agriculture. Agricultural ammonia emissions, in turn, negatively affect farmland bird populations (SDG 15). This indirect link between SDG 8 and SDG 15 in Austria is partly in line with findings by Hutton et al. [16] in the context of Bangladesh, who identified trade-offs between economic growth and impacts on land ecosystems. However, while the expert judgement in the present study also suggested direct trade-offs between GDP per capita and environmental pressures, such as GHG emissions (SDG 13) or nitrate in groundwater (SDG 6), this was not confirmed by the correlation analysis. This may be explained by the fact that relationships between GDP and nitrate levels potentially take more time to unfold. Outsourcing of GHG emissions-intensive production to other countries may be another explanatory factor.
Overall, the experts rarely reached a consensus on whether the identified trade-offs among nexus indicators are reversible or not. For three trade-offs—between GDP and pesticide risks, GDP and nitrate in groundwater, as well as between renewable energy and farmland birds—the expert judgement did not reveal a clear statement on the reversibility of these linkages. For other trade-offs, individual answers differed, but general opinions could be derived. Some of the experts suggested that the trade-off identified between GDP per capita and ammonia emissions might be reversible by means of technology and governance mechanisms. Regarding the trade-off between per-capita GDP and primary energy consumption, most of the experts stated that a reversal could be achieved through appropriate governance mechanisms, whereas one expert indicated that only technological approaches might reverse the antagonistic linkage. While one expert explicitly stated that the trade-off between GDP per capita and GHG emissions was not reversible, the majority agreed that both technological and governance measures may disperse this antagonistic relationship. There was no agreement among the experts on whether the trade-off between GDP per capita and DMC could be eliminated, yet two of the experts suggested that governance mechanisms might reverse the antagonistic linkage between the indicators. When reversibility was indicated to exist, governance mechanisms were more often the decisive factor than technology.
Beyond the trade-offs with GDP, the experts identified relatively few antagonistic relationships in the economy–environment nexus. This might be a result of the selection of the indicators, many of which stem from the environmental domain and are, thus, inherently oriented towards the same goal of protecting the environment. It can be assumed that the share of trade-offs identified by the experts would have been higher if more socio-economic indicators had been included in the subset. However, due to the study’s focus on the economy–environment nexus, the majority of interlinkages identified by both methods were synergistic. For example, improvements in the consumption level and composition of energy (SDG 7) are synergistically interlinked with GHG emissions (SDG 13) in Austria. This confirms previous findings that renewable energy is an important part of strategies to reduce GHG emissions [18]. However, while renewable energy can mitigate some environmental impacts (such as GHG emissions), they can also cause severe pressures themselves. For example, renewable energy production may exacerbate land use and water conflicts (for solar farms, biofuels or hydropower), cause increasing extraction of rare earth minerals needed for renewable energy infrastructure (which in turn results in environmental damage), lead to deforestation and, thus, biodiversity loss or even generate high amounts of GHG emissions [53]. In our analysis, both experts and the correlation analysis identified trade-offs between renewable energy and farmland bird populations.
Water indicators (SDGs 6 and 14) display relatively high amounts of synergistic relationships with other indicators, which is in line with findings by Requejo-Castro et al. [12]. In particular, improvements in wastewater treatment are synergistically interlinked with Austrian water quality indicators (biochemical oxygen demand in rivers, bathing water quality and nitrate levels in groundwater). According to our analysis, increasing the shares of protected areas (SDG 15) and of organic farming (SDG 2) is likely to have a positive impact on these aspects, as well. Other potential levers to make use of SDG synergies stem from the realm of resource use. Notably, reducing settlement area per capita (SDG 11) in Austria may have positive impacts on a range of other indicators, such as energy and material consumption and farmland birds (SDGs 7, 12 and 15). Sustainable transport indicators (SDGs 9 and 11) also display synergies with other nexus indicators. For instance, collectivising passenger transport can help with reducing GHG emissions and primary energy consumption.
While the synergistic relationships within the economy–environment nexus may present promising entry points for designing sustainable development policies that positively influence several realms at once, alleviating the identified trade-offs might be of greater importance—especially since trade-offs generally receive less attention by policy-makers [54]. As Kostetckaia and Hametner [13] argue, the presence of many trade-offs may be an explanatory factor for why some EU countries do not progress further towards the SDGs. As a country that has not made significant progress towards the environmental SDGs in recent years [5], policy-makers in Austria should consider the many trade-offs between GDP and environmental indicators. As long as economic growth is the defining target of SDG 8, it may not be compatible with environmental preservation. Other conceptualisations of human well-being and development that focus on equitably de-growing consumption and production levels [4,31,32] may be of greater value to achieving the goal of thriving human societies that exist in a safe and just space [7] within planetary boundaries [9].

5.3. Methodological Considerations

Both correlation analysis and expert judgement have distinct advantages and shortcomings. While the correlation analysis allowed us to investigate relationships between a large number of SDG indicators grounded in actual data, these relationships do not imply causality [15]. Two correlated SDG indicators could be driven by another variable, thus, only showing a co-development of both indicators instead of a meaningful interlinkage. Indeed, results of the correlation analysis revealed a number of strong significant correlations that in practice do not seem to make sense. For example, data showed a trade-off between the gender gap for early leavers from education and CO2 emissions from new passenger cars. Similarly, the correlation analysis revealed a synergy between the share of organic farming and the Austrian population’s inability to keep their homes warm. These are just two examples for a series of quantitatively identified interlinkages that are likely not causally related. The sheer number of interlinkages between SDG indicators makes it very time consuming to include assumptions about causality. We tried to account for this issue by focusing on the economy–environment nexus and complementing the correlation analysis with expert judgement.
On its own, expert judgement is a useful method for assessing not only the existence of SDG interlinkages, but also the causality underlying a given interaction. However, expert judgement may identify interlinkages in theory that have not (yet) materialised in practice, or are only valid in a general, ideal-world situation. For example, Pradhan et al. [15] highlighted that in their quantitative (correlation) analysis, they arrived at different results for interlinkages of SDG 7 than the qualitative (expert judgement) analysis conducted by the ICSU [18]. They concluded that “[…] enhancing our knowledge on SDG interactions will require both qualitative and quantitative approaches” [15]. In our study, the experts identified several interlinkages that were not confirmed by the data. For example, they claimed a trade-off between GDP per capita and GHG emissions, or a synergy between recycling of municipal waste and GHG emissions, neither of which was confirmed by the correlation analysis. The latter may be explained by the fact that the Eurostat GHG emissions indicator only measures production-based emissions instead of emissions along the whole supply chain. Beyond specific cases where the two methods reached diverging results, general differences may stem from the fact that Spearman’s correlation analysis only detects monotonic relationships [13,15], thus, potentially omitting non-monotonic associations, even though it has been shown that such relationships are very rare among SDG interactions [49].
As we have argued, the fact that some of the theoretical interlinkages did not show in the data does not necessarily mean that the experts were incorrect in their judgement. There is a range of possible explanations as to why the quantitative and qualitative results differed from each other. What we can conclude from comparing the results of both applied methods, however, is that agreed-upon interlinkages have a high likelihood of representing meaningful SDG interactions that have already manifested in Austria. Combining both methods allowed us to identify theoretical interlinkages that were grounded in practice, and at the same time apply causality to correlations and exclude mere co-developments. The latter was made possible through the ICSU [18] dimension of directionality, which enabled us to judge which of the correlated indicators was the likely driving force of an interaction, thereby eliminating coincidental relationships among the lagged correlations. The dimensions of reversibility of trade-offs through governance and technology served as an additional explanatory factor as to why some of the nexus interlinkages were not confirmed by the correlation analysis.
Overall agreement shares for the nexus were relatively high, however, as two thirds of the non-linkages, synergies and trade-offs were agreed upon by both methods. While non-linkages made up the biggest share of investigated indicator pairings, synergies outweighed trade-offs, which is consistent with previous literature [14,15,21,41]. This rather high agreement mainly relates to non-linkages. For both synergies and trade-offs, agreement between the two methods is at around 50%. Interestingly, while experts identified a considerably larger fraction of synergies than trade-offs, the correlation analysis in fact found a higher share of trade-offs than synergies among the nexus indicators. While this is in contrast with both the general picture of all EU SDG indicators in Austria and with previous literature examining SDG interlinkages on a more general level, it supports the findings of previous studies on trade-offs between economic growth and environmental degradation [5,10,31,32].

5.4. Limitations

By adopting a mixed-methods approach to studying SDG interlinkages, we attempted to counter the respective shortcomings of both correlation analysis and expert judgement. However, combining the two methods bears its own challenges and limitations. To create comparable results, both approaches had to be conducted on the same level, i.e., the indicator level. This worked well for the correlation analysis and has been established by many different scholars already [14,15,21]. However, it was rather challenging to execute the expert judgement on the indicator level. Despite limiting the indicator amount to a range of chosen nexus indicators, it was a time-consuming process, especially since we decided to include some of the ICSU [18] additional dimensions. Moreover, in some cases, experts were required to look into specific indicator definitions in order to be able to make an informed judgement about potential interactions. Judging interactions on the broader goal or target level—as has been carried out in previous studies [18,19,22,24,42,43]—would be a simpler and less time-consuming process, albeit harder to combine with quantitative analysis. Due to these time restraints, it was challenging to include the additional contextual dimensions developed by the ICSU [18]. As a result, the experts did not consistently judge the additional dimensions, but instead mainly focused on the type of SDG interlinkage (i.e., non-linkage, synergy, trade-off). Moreover, it was not possible to reach agreement among the experts regarding these dimensions. Therefore, we only averaged their responses, taking into consideration the experts’ individual expertise.
While we tried to account for causality by including correlations with a time lag [52], the gap between two indicators could not exceed two years due to the length of the analysed time series. Thus, we were unable to capture interlinkages between indicators that manifest over the long-term.
Another issue included the non-linkages. There were a few indicator pairs that the experts classified as non-linkages because they were too context-specific to judge as either a synergy or a trade-off. Thus, these indicator pairs are not necessarily unrelated. For example, the experts rated the indicator pairing of circular material use rate and GHG emissions as a non-linkage due to its context-specificity, emphasising that a synergy may exist under certain circumstances. While this application of the scoring might have potentially distorted the overall nexus results, cross-checking these cases with the correlation analysis revealed mostly non-linkages as well. Thus, the agreed-upon interlinkages would not have significantly changed. Still, this issue is something to consider in future research.

6. Conclusions

The purpose of the present study was to assess SDG interlinkages—synergies and trade-offs—in the economy–environment nexus for the case of Austria. Acknowledging the methods bias in existing literature, we conducted a mixed-methods analysis of the relationship of selected indicators from economic and environmental SDGs, by combining correlation analysis with expert judgement. In line with previous studies, we found economic growth to show antagonistic relationships with many environmental pressure indicators. In fact, GDP per capita (SDG 8) displays more trade-offs with other economy–environment indicators than any other nexus indicator. According to our analysis, GDP growth in Austria is accompanied by rising material consumption (SDG 12) and environmental pressures from agricultural production (SDG 2), which, in turn, has an impact on land ecosystems (SDG 15). We also found numerous synergies within the economy–environment nexus. Increasing the share of protected areas (SDG 15) and of organic farming (SDG 2) in Austria is able to unlock co-benefits for water quality (SDG 6), while decreasing the settlement area per capita (SDG 11) would also reduce domestic material consumption (SDG 12). Some of the identified interlinkages are not as straightforward—while an increase in renewable energy production (SDG 7) helps to reduce GHG emissions (SDG 13), it can also have negative impacts on local land ecosystems (SDG 15).
Our results have relevant implications for the design of sustainable development policies, both within and beyond Austria. While synergistic relationships between the SDGs may support a faster achievement of the 2030 Agenda as a whole, trade-offs may hinder the process or even undo previous efforts. When economic aspirations are in contrast with the preservation of the ecological foundations our societies depend upon, there will need to be a prioritisation, or, as previous studies have suggested, a re-thinking of socio-economic well-being away from GDP growth—especially in a highly developed country, such as Austria. As long as human development is primarily defined by economic growth, it will increasingly deplete the Earth’s resources, thus posing a threat to the very foundation upon which it depends. In order to enable a good life for all within planetary boundaries, decision-makers, consequently, need to take into account interlinkages—especially trade-offs—between economic and environmental SDGs.
Studies on SDG interlinkages have the potential to support policy-makers in this process. The present paper contributes to the existing literature on SDG synergies and trade-offs by demonstrating that a mixed-methods approach to studying SDG interlinkages is useful when conducting a context-sensitive case study, where specific SDG interlinkages are analysed in more detail. Combining expert judgement with correlation analysis supports the elimination of non-causal correlations. At the same time, contrasting theoretical expert judgements with actual data helps identify real-world interlinkages that have already materialised and can, thus, be leveraged in practice. The results of the present study, therefore, do not only add to the academic discourse but are also directly relevant for sustainable development policy-making in Austria, highlighting some of the synergies that can be exploited and some of the trade-offs that need to be overcome.
A couple of avenues for further research emerge from the present study. For example, it would be interesting to complement the analysis of the SDGs’ economy–environment nexus in Austria with assessments focusing on other relationships, such as between poverty or education and environmental aspects. This would help create a more complete picture of the country’s SDG interlinkages. Additionally, similar nexus case studies could be conducted in other EU Member States and beyond, allowing to assess the similarities and differences in economy–environment relationships across countries. For example, some countries might have already been able to overcome—at least in part—the trade-off between economic growth and environmental degradation and could, thus, offer important insights into how to tackle this destructive relationship elsewhere.

Author Contributions

Conceptualisation, P.U. and M.H.; methodology, P.U. and M.H.; software, P.U.; validation, P.U. and M.H.; formal analysis, P.U. and M.H.; investigation, P.U. and M.H.; data curation, M.H.; writing—original draft preparation, P.U.; writing—review and editing, P.U. and M.H.; visualisation, P.U.; supervision, M.H.; project administration, P.U. and M.H. All authors have read and agreed to the published version of the manuscript.

Funding

This research received no external funding.

Data Availability Statement

Publicly available datasets were analyzed in this study. This data can be found here: [https://ec.europa.eu/eurostat/web/sdi/database].

Acknowledgments

We would like to sincerely t hank the following experts for participating in the expert judgement: Georg Gratzer (University of Natural Resources and Life Sciences, Vienna), Mariia Kostetckaia (Vienna University of Economics and Business), Andreas Melcher (University of Natural Resources and Life Sciences, Vienna), Thomas Schinko (International Institute for Applied Systems Analysis), Karin Weber (University of Natural Resources and Life Sciences, Vienna) and Matthias Zessner-Spitzenberg (Vienna University of Technology).

Conflicts of Interest

The authors declare no conflict of interest.

References

  1. IPCC. Climate Change 2021: The Physical Science Basis. Contribution of Working Group I to the Sixth Assessment Report of the Intergovernmental Panel on Climate Change; Masson-Delmotte, V., Zhai, P., Pirani, A., Connors, S.L., Péan, C., Berger, S., Caud, N., Chen, Y., Goldfarb, L., Gomis, M.I., et al., Eds.; Cambridge University Press: Cambridge, UK; New York, NY, USA, 2021. [Google Scholar]
  2. Reid, W.; Mooney, H.; Cropper, A.; Capistrano, D.; Carpenter, S.; Chopra, K.; Dasgupta, P.; Dietz, T.; Duraiappah, A.; Hassan, R.; et al. Millennium Ecosystem Assessment Synthesis Report; Island Press: Washington, DC, USA, 2005. [Google Scholar]
  3. IPBES Summary for Policymakers of the Global Assessment Report on Biodiversity and Ecosystem Services of the Intergovernmental Science-Policy Platform on Biodiversity and Ecosystem Services; IPBES Secretariat: Bonn, Germany, 2019.
  4. O’Neill, D.W.; Fanning, A.L.; Lamb, W.F.; Steinberger, J.K. A good life for all within planetary boundaries. Nat. Sustain. 2018, 1, 88–95. [Google Scholar] [CrossRef]
  5. Hametner, M. Economics without ecology: How the SDGs fail to align socioeconomic development with environmental sustainability. Ecol. Econ. 2022, 199, 107490. [Google Scholar] [CrossRef]
  6. Krausmann, F.; Gingrich, S.; Eisenmenger, N.; Erb, K.-H.; Haberl, H.; Fischer-Kowalski, M. Growth in global materials use, GDP and population during the 20th century. Ecol. Econ. 2009, 68, 2696–2705. [Google Scholar]
  7. Raworth, K. A Safe and just Space for Humanity: Can We Live within the Doughnut? Oxfam: Oxford, UK, 2012. [Google Scholar]
  8. Steffen, W.; Richardson, K.; Rockström, J.; Cornell, S.E.; Fetzer, I.; Bennett, E.M.; Biggs, R.; Carpenter, S.R.; De Vries, W.; De Wit, C.A.; et al. Planetary boundaries: Guiding human development on a changing planet. Science 2015, 347, 1259855. [Google Scholar] [CrossRef]
  9. Rockström, J.; Steffen, W.; Noone, K.; Persson, Å.; Chapin, F.S., III; Lambin, E.; Lenton, T.M.; Scheffer, M.; Folke, C.; Schellnhuber, H.J. Planetary Boundaries: Exploring the Safe Operating Space for Humanity. Ecol. Soc. 2009, 14, 1–33. Available online: http://www.ecologyandsociety.org/vol14/iss2/art32/ (accessed on 5 March 2021).
  10. Eisenmenger, N.; Pichler, M.; Krenmayr, N.; Noll, D.; Plank, B.; Schalmann, E.; Wandl, M.-T.; Gingrich, S. The Sustainable Development Goals prioritize economic growth over sustainable resource use: A critical reflection on the SDGs from a socio-ecological perspective. Sustain. Sci. 2020, 15, 1101–1110. [Google Scholar]
  11. Robra, B.; Heikkurinen, P. Degrowth and the sustainable development goals. Decent Work. Econ. Growth 2019, 3, 253–262. [Google Scholar]
  12. Requejo-Castro, D.; Giné-Garriga, R.; Pérez-Foguet, A. Data-driven Bayesian network modelling to explore the relationships between SDG 6 and the 2030 Agenda. Sci. Total Environ. 2020, 710, 136014. [Google Scholar] [CrossRef]
  13. Kostetckaia, M.; Hametner, M. How Sustainable Development Goals interlinkages influence European Union countries’ progress towards the 2030 Agenda. Sustain. Dev. 2022. [Google Scholar] [CrossRef]
  14. Kroll, C.; Warchold, A.; Pradhan, P. Sustainable Development Goals (SDGs): Are we successful in turning trade-offs into synergies? Palgrave Commun. 2019, 5, 140. [Google Scholar] [CrossRef]
  15. Pradhan, P.; Costa, L.; Rybski, D.; Lucht, W.; Kropp, J.P. A Systematic Study of Sustainable Development Goal (SDG) Interactions. Earth’s Future 2017, 5, 1169–1179. [Google Scholar] [CrossRef]
  16. Hutton, C.W.; Nicholls, R.J.; Lázár, A.N.; Chapman, A.; Schaafsma, M.; Salehin, M. Potential trade-offs between the sustainable development goals in coastal Bangladesh. Sustainability 2018, 10, 1108. [Google Scholar] [CrossRef]
  17. Scherer, L.; Behrens, P.; de Koning, A.; Heijungs, R.; Sprecher, B.; Tukker, A. Trade-offs between social and environmental Sustainable Development Goals. Environ. Sci. Policy 2018, 90, 65–72. [Google Scholar] [CrossRef]
  18. ICSU, A. Guide to SDG Interactions: From Science to Implementation; Griggs, D.J., Nilsson, M., Stevance, A., McCollum, D., Eds.; International Council for Science: Paris, France, 2017. [Google Scholar]
  19. Nilsson, M.; Griggs, D.; Visbeck, M. Policy: Map the interactions between Sustainable Development Goals. Nat. News 2016, 534, 320–322. [Google Scholar] [CrossRef] [Green Version]
  20. Weitz, N.; Carlsen, H.; Nilsson, M.; Skånberg, K. Towards systemic and contextual priority setting for implementing the 2030 Agenda. Sustain. Sci. 2018, 13, 531–548. [Google Scholar] [CrossRef]
  21. Ronzon, T.; Sanjuan, A. Friends or foes? A compatibility assessment of bioeconomy-related Sustainable Development Goals for European policy coherence. J. Clean. Prod. 2019, 254, 119832. [Google Scholar] [CrossRef]
  22. Singh, G.G.; Cisneros-Montemayor, A.M.; Swartz, W.; Cheung, W.; Guy, J.A.; Kenny, T.-A.; McOwen, C.J.; Asch, R.; Geffert, J.L.; Wabnitz, C.C. A rapid assessment of co-benefits and trade-offs among Sustainable Development Goals. Mar. Policy 2018, 93, 223–231. [Google Scholar] [CrossRef]
  23. Nilsson, M.; Chisholm, E.; Griggs, D.; Howden-Chapman, P.; McCollum, D.; Messerli, P.; Neumann, B.; Stevance, A.-S.; Visbeck, M.; Stafford-Smith, M. Mapping interactions between the sustainable development goals: Lessons learned and ways forward. Sustain. Sci. 2018, 13, 1489–1503. [Google Scholar] [CrossRef]
  24. Weitz, N.; Carlsen, H.; Skånberg, K.; Dzebo, A.; Viaud, V. SDGs and the environment in the EU: A systems view to improve coherence. In Report Commissioned by the European Environment Agency; Stockholm Environment Institute: Stockholm, Sweden, 2019. [Google Scholar]
  25. Breuer, A.; Janetschek, H.; Malerba, D. Translating Sustainable Development Goal (SDG) Interdependencies into Policy Advice. Sustainability 2019, 11, 2092. [Google Scholar] [CrossRef]
  26. UN. Resolution Adopted by the General Assembly on 25 September 2015. Transforming Our World: The 2030 Agenda for Sustainable Development. 2015. Available online: https://www.un.org/en/development/desa/population/migration/generalassembly/docs/globalcompact/A_RES_70_1_E.pdf (accessed on 5 August 2022).
  27. Cling, J.-P.; Eghbal-Teherani, S.; Orzoni, M.; Plateau, C. The interlinkages between the SDG indicators and the differentiation between EU countries: It is (mainly) the economy! Stat. J. IAOS 2020, 36, 455–470. [Google Scholar]
  28. Tosun, J.; Leininger, J. Governing the interlinkages between the sustainable development goals: Approaches to attain policy integration. Glob. Chall. 2017, 1, 1700036. [Google Scholar] [CrossRef]
  29. Bennich, T.; Weitz, N.; Carlsen, H. Deciphering the scientific literature on SDG interactions: A review and reading guide. Sci. Total Environ. 2020, 728, 138405. [Google Scholar] [CrossRef] [PubMed]
  30. Kallis, G. In defence of degrowth. Ecol. Econ. 2011, 70, 873–880. [Google Scholar] [CrossRef]
  31. Hickel, J. The contradiction of the sustainable development goals: Growth versus ecology on a finite planet. Sustain. Dev. 2019, 27, 873–884. [Google Scholar] [CrossRef]
  32. Hickel, J.; Kallis, G. Is green growth possible? New Political Econ. 2020, 25, 469–486. [Google Scholar] [CrossRef]
  33. Hametner, M.; Kostetckaia, M. Frontrunners and laggards: How fast are the EU member states progressing towards the sustainable development goals? Ecol. Econ. 2020, 177, 106775. [Google Scholar] [CrossRef]
  34. Jackson, T. Prosperity without Growth: The Transition to a Sustainable Economy. 2009. Available online: https://www.sd-commission.org.uk/data/files/publications/prosperity_without_growth_report.pdf (accessed on 5 March 2021).
  35. Meadows, D.H.; Meadows, D.L.; Randers, J.; Behrens, W.W. The limits to growth. New York 1972, 102, 27. [Google Scholar]
  36. Springmann, M.; Godfray, H.C.J.; Rayner, M.; Scarborough, P. Analysis and valuation of the health and climate change cobenefits of dietary change. Proc. Natl. Acad. Sci. USA 2016, 113, 4146–4151. [Google Scholar] [CrossRef] [PubMed]
  37. Le Blanc, D. Towards integration at last? The sustainable development goals as a network of targets. Sustain. Dev. 2015, 23, 176–187. [Google Scholar] [CrossRef]
  38. Barbier, E.B.; Burgess, J.C. The Sustainable Development Goals and the systems approach to sustainability. Econ. E-J. 2017, 11, 1–23. [Google Scholar] [CrossRef]
  39. Thacker, S.; Adshead, D.; Fay, M.; Hallegatte, S.; Harvey, M.; Meller, H.; O’Regan, N.; Rozenberg, J.; Watkins, G.; Hall, J.W. Infrastructure for sustainable development. Nat. Sustain. 2019, 2, 324–331. [Google Scholar] [CrossRef]
  40. McCollum, D.L.; Echeverri, L.G.; Busch, S.; Pachauri, S.; Parkinson, S.; Rogelj, J.; Krey, V.; Minx, J.C.; Nilsson, M.; Stevance, A.-S. Connecting the sustainable development goals by their energy inter-linkages. Environ. Res. Lett. 2018, 13, 033006. [Google Scholar] [CrossRef]
  41. Miola, A.; Borchardt, S.; Neher, F.; Buscaglia, D. Interlinkages and Policy Coherence for the Sustainable Development Goals Implementation: An Operational Method to Identify Trade-offs and Co-Benefits in a Systemic Way; Joint Research Centre (JRC): Luxembourg, 2019. [Google Scholar]
  42. Van Soest, H.L.; Van Vuuren, D.P.; Hilaire, J.; Minx, J.C.; Harmsen, M.J.; Krey, V.; Popp, A.; Riahi, K.; Luderer, G. Analysing interactions among sustainable development goals with integrated assessment models. Glob. Transit. 2019, 1, 210–225. [Google Scholar] [CrossRef]
  43. Lyytimäki, J.; Lonkila, K.-M.; Furman, E.; Korhonen-Kurki, K.; Lähteenoja, S. Untangling the interactions of sustainability targets: Synergies and trade-offs in the Northern European context. Environ. Dev. Sustain. 2020, 23, 3458–3473. [Google Scholar] [CrossRef]
  44. Pham-Truffert, M.; Metz, F.; Fischer, M.; Rueff, H.; Messerli, P. Interactions among Sustainable Development Goals: Knowledge for identifying multipliers and virtuous cycles. Sustain. Dev. 2020, 28, 1236–1250. [Google Scholar] [CrossRef]
  45. De Miguel Ramos, C.; Laurenti, R. Synergies and Trade-offs among Sustainable Development Goals: The Case of Spain. Sustainability 2020, 12, 10506. [Google Scholar] [CrossRef]
  46. Sachs, J.; Kroll, C.; Lafortune, G.; Fuller, G.; Woelm, F. Sustainable Development Report 2021; Cambridge University Press: Cambridge, UK, 2021. [Google Scholar]
  47. Guijarro, F.; Poyatos, J.A. Designing a sustainable development goal index through a goal programming model: The Case of EU-28 Countries. Sustainability 2018, 10, 3167. [Google Scholar] [CrossRef]
  48. Miola, A.; Schiltz, F. Measuring sustainable development goals performance: How to monitor policy action in the 2030 Agenda implementation? Ecol. Econ. 2019, 164, 106373. [Google Scholar] [CrossRef]
  49. Warchold, A.; Pradhan, P.; Kropp, J.P. Variations in sustainable development goal interactions: Population, regional, and income disaggregation. Sustain. Dev. 2021, 29, 285–299. [Google Scholar] [CrossRef]
  50. Spearman, C. The proof and measurement of association between two things. Am. J. Psychol. 1904, 15, 72–101. [Google Scholar] [CrossRef]
  51. Hauke, J.; Kossowski, T. Comparison of Values of Pearson’s and Spearman’s Correlation Coefficients on the Same Sets of Data. Quaest. Geogr. 2011, 30, 87–93. [Google Scholar] [CrossRef]
  52. Ospina-Forero, L.; Castañeda, G.; Guerrero, O.A. Estimating networks of sustainable development goals. Inf. Manag. 2020, 59, 103342. [Google Scholar] [CrossRef]
  53. Parrique, T.; Barth, J.; Briens, F.; Kerschner, C.; Kraus-Polk, A.; Kuokkanen, A.; Spangenberg, J. Decoupling Debunked. Evidence and Arguments against Green Growth as a Sole Strategy for Sustainability. A Study Edited by the European Environment Bureau EEB 2019. Available online: https://eeb.org/library/decoupling-debunked (accessed on 5 March 2021).
  54. Nilsson, M.; Weitz, N. Governing trade-offs and building coherence in policy-making for the 2030 agenda. Politics Gov. 2019, 7, 254–263. [Google Scholar] [CrossRef] [Green Version]
Figure 1. Correlation analysis of interlinkages within the 17 SDGs in Austria. Green bars represent the share of synergies within the same goal, and violet bars denote trade-offs. Off-white bars signify fractions of non-correlations.
Sustainability 14 12281 g001
Figure 2. Correlation analysis of interlinkages between the 17 SDGs in Austria. Green pieces of the pie charts indicate shares of synergies between the indicators of different goals, and violet pieces represent trade-offs. Off-white pieces denote the percentages of non-correlations.
Sustainability 14 12281 g002
Figure 3. Shares of SDG interlinkages for selected indicators from the economy–environment nexus for correlation analysis and expert judgement. Green bars signify synergies, violet bars signify trade-offs and off-white bars signify non-linkages.
Sustainability 14 12281 g003
Figure 4. Percentage of agreement between correlation analysis and expert judgement for interlinkages of selected indicators from the economy–environment nexus, and per type of interlinkage. Red bars signify cases where the correlation analysis did not confirm the expert judgement, and blue bars represent cases where both methods arrived at the same result. Width of bars represents the number of cases per type of interlinkage, as also denoted by the variable n .
Sustainability 14 12281 g004
Figure 5. SDG interlinkage shares for selected indicators from the economy–environment nexus, as agreed upon by the expert judgement and the correlation analysis. The green bar represents the share of synergies, the violet bar represents the share of trade-offs and the off-white bar represents the share of non-linkages according to both methods. The red bar represents the share of indicator pairings where the correlation analysis did not confirm the expert judgement.
Sustainability 14 12281 g005
Figure 6. Synergies and trade-offs between agricultural SDG indicators and other economy–environment nexus indicators. Arrows between nodes refer to synergies and trade-offs identified by the experts and confirmed by the correlation analysis. Dashed arrows signify synergies and trade-offs claimed by the experts, but not identified by the correlation analysis. Violet arrows represent trade-offs, and green arrows represent synergies. Plus signs connote a relationship between two indicators where an increase in one indicator trend is associated with an increase in another indicator trend. Minus signs connote a relationship where an increase in one indicator trend is associated with a decrease in another indicator trend. Arrowheads represent the direction of an interlinkage (i.e., driving variable and driven variable) as suggested by the experts.
Sustainability 14 12281 g006
Figure 7. Synergies and trade-offs between water SDG indicators and other economy–environment nexus indicators. Arrows between nodes refer to synergies and trade-offs identified by the experts and confirmed by the correlation analysis. See caption of Figure 6 for a more detailed explanation of the arrows and signs.
Sustainability 14 12281 g007
Figure 8. Synergies and trade-offs between climate and energy SDG indicators and other economy–environment nexus indicators. Arrows between nodes refer to synergies and trade-offs identified by the experts and confirmed by the correlation analysis. See caption of Figure 6 for a more detailed explanation of the arrows and signs.
Sustainability 14 12281 g008
Figure 9. Synergies and trade-offs between ecosystem SDG indicators and other economy–environment nexus indicators. Arrows between nodes refer to synergies and trade-offs identified by the experts and confirmed by the correlation analysis. See caption of Figure 6 for a more detailed explanation of the arrows and signs.
Sustainability 14 12281 g009
Figure 10. Synergies and trade-offs between resource use SDG indicators and other economy–environment nexus indicators. Arrows between nodes refer to synergies and trade-offs identified by the experts and confirmed by the correlation analysis. See caption of Figure 6 for a more detailed explanation of the arrows and signs.
Sustainability 14 12281 g010
Figure 11. Synergies and trade-offs between SDG indicators from the economy–environment nexus. Arrows between nodes refer to synergies and trade-offs identified by the experts and confirmed by the correlation analysis. See caption of Figure 6 for a more detailed explanation of the arrows and signs.
Sustainability 14 12281 g011
Table 1. Economy–environment nexus SDG indicators used for comparing expert judgement and correlation analysis.
SDGIndicatorUsed in Expert JudgementUsed in Correlation Analysis
SDG 2Ammonia emissions from agriculture
Area under organic farming
Harmonised risk indicator for pesticides (HRI1)
SDGs 2 and 6Nitrate in groundwater
SDGs 2 and 15Farmland bird index
SDG 6Water exploitation index plus (WEI+)
Bathing sites with excellent water quality (inland)
SDGs 6 and 11Population connected to at least secondary wastewater treatment
SDGs 6 and 15Biochemical oxygen demand in rivers
SDGs 6 and 15Phosphate in riversExcluded due to insufficient time series
SDG 7Primary energy consumption
SDGs 7 and 13Share of renewable energy consumption in gross final energy consumption
SDG 8Real GDP per capita
SDG 9Share of rail and inland waterways in inland freight transport
SDGs 9 and 11Share of buses and trains in inland passenger transport
SDG 11Recycling rate of municipal waste
Settlement area per capita
SDG 12Circular material use rate
Domestic material consumption (DMC)
SDG 13Greenhouse gas emissions
SDG 15Share of forest area
Soil sealing indexExcluded due to insufficient time series
Surface of terrestrial sites designated under Natura 2000
Publisher’s Note: MDPI stays neutral with regard to jurisdictional claims in published maps and institutional affiliations.