Article

Does Human Capital Homogeneously Improve the Corporate Innovation: Evidence from China’s Higher Education Expansion in the Late 1990s

1
Department of World Economy, Wuhan University, Wuhan 430072, China
2
State Grid Nanchang County Electric Power Supply Company, Nanchang 330200, China
*
Author to whom correspondence should be addressed.
Sustainability 2022, 14(19), 12352; https://doi.org/10.3390/su141912352
Submission received: 3 September 2022 / Revised: 23 September 2022 / Accepted: 23 September 2022 / Published: 28 September 2022

Abstract

:
The effect of human capital on corporate innovation varies with the distribution of human capital intensity among industries. To analyze this heterogenous effect, we utilized the variation of college enrollment expansion across different regions in China as an exogenous human capital shock. Using a sample of Chinese industrial enterprises from 1998 to 2008 and the difference-in-difference strategy, we found that industries with intensive human capital significantly increase the number of patent applications after the expansion policy. The effect is pronounced in invention patents and significantly positive in exporting and capital-intensive corporates. As for the channels, corporates in these industries are apt to adopt new technologies and increase R&D expenditures. Moreover, the agglomeration of new graduates accelerates knowledge spillover, thus promoting innovation in knowledge-intensive industries. In sum, this paper verifies the importance of policy intervention on skilled labor supply towards corporate innovation and supports the talent introduction plan of local government in China.

1. Introduction

The college expansion in China was implemented in the background where unemployment increased because of large-scale state-owned enterprise restructuring policies and the cancellation of the system of distributing work by the state for college students. At the same time, economic growth also slowed down considerably, and domestic demand was weak. In this context, the economist Tang Min submitted a proposal to the central government in November 1998, “On the Effective Ways to Initiate China’s Economy-Double the Enrollment Volume”, implying that the central government began to expand the number of college enrollments in 1999. Historically, this enrollment expansion is another exogenous milestone in the development of China’s education system, as important as the resumption of the college entrance examination after the reform and opening-up policy. As a result, we could exploit it as a quasi-experiment to learn the effect of human capital.
In 1999, college enrollment increased by 513,200, and the total enrollment reached 1.5968 million, an unprecedented growth rate of 47.4%. The specific change trend can be seen in Figure 1. By 2003, the number of undergraduate and junior college students in China’s ordinary universities exceeded 10 million. This unprecedented reform provided an incredibly increasing labor to local markets, especially to local high-tech markets, because more and more graduates have flooded in labor markets since 2003. As shown in Figure 1, the ratio of graduates to labor gradually increased at an average rate of 22.68% 3 or 4 years after the expansion was conducted.
In the era of a planned economy, university education has always imitated the elite education model of the former Soviet Union, and the expansion of university enrollment shows a policy change to liberal education in a sense. In other words, the college enrollment expansion contributes to delivering more labor with abundant knowledge to the labor markets. Because of that, the central part of multi-domain ideas, the core of innovation referred to ref. [1], and provided by these new skilled graduates is satisfied. The bar in Figure 1 represents the growth tendency of total patent applications in enterprises—seen as a usual and efficient measure of corporate innovation—in China from 1998 to 2008. Before the expansion, the average growth rate of the application was about 37.28%, while the rate increased by 10 percent after the expansion. This shows that innovation has the same developing trend as college enrollment and the ratio of graduates to labors. Furthermore, we could guess there may be a relationship and even causal effect between human capital and corporate innovation.
Consequently, this paper aims to explore the impact of college enrollment expansion on corporate innovation, consistent with the endogenous growth theory, and human capital as the driving force of innovation (for example, refs. [2,3,4,5]). More importantly, given the heterogenous level of technology intensity and diverse efficiency of absorbing human capital, each industry reacts differently to the increasing supply of high-quality labor. Ref. [6] has found a discrepancy in TFP growth, while we supplement the disparity on the innovation output, which is proxied by the number of patent applications. After that, a question coming behind it is that through which path the expansion can diversely impact corporate innovation. This study considers three potential mechanisms: R&D investment, patent stock, and agglomeration effect. Figure 2 presents our conceptual framework.
The rest of this article is organized as follows. The second part reviews the findings of related academic research on university enrollment expansion, labor absorption, and innovation. Section 3 introduces the methodology, including identification strategies, data sources, and sample composition. Section 4.1 introduces the benchmark model. The results of the empirical analysis are provided in Section 4.2, Section 4.3, Section 4.4 and Section 4.5, including the results of the benchmark model, as well as a series of robustness, heterogeneity tests, and possible mechanism discussions. Finally, Section 5 and Section 6 is for discussion and conclusions.

2. Literature Review

2.1. Policy-Driven College Expansion

To a certain extent, researchers reach a consensus on the positive impact of policy-driven college expansion on regional innovation. Refs. [7,8,9] studied policy-driven university expansion in Sweden and Italy, respectively. The former explored that the decentralization of the skilled labor force (i.e., university-based researchers and technicians), extending the scale of college enrollment incidentally, affects regional development by promoting local innovation. The latter studied how the opening of new Italian universities in 1985–2000 involved the regional innovation system, analyzed whether university expansion would affect the innovation of local industries, and found that the opening of new universities would lead to a 7% increase in the number of patents filed by regional companies. Institutional factors in high-education systems also matter. We could see the new universities as an endogenous shock to a certain extent, as the chosen locations are not random. Afterward, ref. [10] studies a natural experiment: the end of the “professor’s privilege” in Norway, where university researchers previously enjoyed full rights to their innovations. Using comprehensive data on Norwegian workers, firms, and patents, they found a 50 percent decline in both entrepreneurship and patenting rates by university researchers after the reform. This reform, similar to patent system reform, is more suitably related to system and property rights design rather than students’ quantitative expansion. Therefore, unique college enrollment expansion in China directly aiming at scale extension in college students and human capital is a better case to study the influence upon regional innovation.
Relevant research on the expansion of China’s university enrollment also explored the effect of policies from multiple perspectives. Ref. [11] found that China’s expansion policy has caused the unemployment rate of college graduates to rise sharply, and the unemployment rate of college graduates in non-coastal areas (especially the central region) has increased more than that in large coastal cities. Ref. [12] further established a model to confirm that when skill is a scarce resource, the increase in the supply of college graduates caused by the expansion of university enrollment will increase the higher education premium for older groups and reduce that of the younger groups. These conclusions are also strong support for those who hold a negative attitude towards the expansion policy. Ref. [6] found that industries that use more human capital-intensive technologies had greater growth in total factor productivity after 2003 than in previous years. The path of influence is that these industries have accelerated the adoption of new technologies, specifically reflected in the import of advanced capital goods, R&D expenditure and capital intensity, and the employment of more highly skilled individuals. This research above all affirmed the positive effects of the expansion policy and affirmed that the expansion policy contributes necessary input to innovation activities. Naturally, we are interested in whether or not the policy leads to innovative results positively.
There have been several papers studying the relationship between the appearance and expansion of Chinese colleges and innovation output. For instance, ref. [13], focusing on the natural experiment of the merger of Chinese universities that began in the 1990s, studied the impact of university mergers on scientific research results, and found that due to excessive government intervention and the instability of cultural integration, university mergers have had a significant negative impact on scientific research performance. That is, university mergers cannot effectively improve the level of scientific research or bring economies of scale, leading to diseconomies of scale. Currently, relevant research mostly focuses on general and college innovation rather than the firm’s creation which is closer to the consumption market.

2.2. Skilled Human Capital and Innovation

As for the relationship between skilled human capital and innovation, according to the endogenous growth theory [2], the stock of human capital determines the growth rate. Ref. [4] further expands on this basis and obtains the endogenous technological theory. He takes the United States as an example and finds that when the relative supply of skilled workers increases exogenously, the market has altered the direction of technological change due to greater technological complementarity, so the skill premium decreases in the short term but then increases, possibly even exceeding its initial value. The neoclassical model constructed by ref. [14] also supports this conclusion to a certain extent. After major technological innovations, the increase in the supply of skills will only accelerate the transition to new technologies and will not cause the return of skill premiums. Reviewing the literature on human capital and technological progress, we can see that the increase in the supply of skilled labor has, to some extent, caused the skill-biased technological change (SBTC).
From an industrial perspective, due to heterogeneous factor intensity in different businesses, the impact of skilled labor on innovation varying among multiple industries is also worth exploring. Ref. [15] used German and Dutch data as samples and considered five different levels of technological intensity. In the manufacturing and service industries, it is found that the Dutch industry is characterized by a high average proportion of highly skilled employees. In contrast, the German industry is characterized by a less even distribution of human capital intensity. In these two countries, the return increases as the technological boundaries of low-tech industries are approached.
Concerning channels between skilled human capital and innovative technological change, a set of papers are based on corporate behavior. Although the exit and entry of enterprises matter, studies have shown that the internal adjustment of enterprises is the primary mechanism for the economy to absorb labor and increase output. Ref. [16] analyzed that immigration brings more skilled labor into corporates and promotes innovation mainly through high-tech enterprises. The research of ref. [17] also points out that change in producing technology is a necessary solution to respond to labor supply change given constant factor prices in the trade sector. Most of the responses are made within the company. Following these channels, we narrow our attention to research and development within the corporate and expect that there is a sensitive reflection after a sudden high-educated labor extension.
We can infer from the former studies that increasing skilled human capital in the labor market has expanded technological innovation. Enterprises play an essential role in the process. Moreover, there are differences in the conversion efficiency of skills-based human capital for enterprises in different industries, which is the focus of our study.
Based on these papers, we propose our first hypothesis:
Hypothesis 1 (H1).
The increase in human capital in higher education brought about by the expansion of colleges and universities will help increase the innovation output of enterprises. Due to the heterogeneous nature of the industry, industries with high human capital intensity can absorb high-quality human capital more efficiently in the transformation of innovation output.
For the exploration of the path of human capital promoting innovation output, considering the impact of factor input, we propose Hypotheses 2 and 3:
Hypothesis 2 (H2).
The increase in human capital of higher education brought about by the expansion of colleges and universities is transformed by the innovation input of enterprises as a medium for innovation output. That is, companies with high human capital intensity will pay more attention to its R&D investment, thereby promoting the company’s innovation output as the supply of high-skilled human capital increases.
Hypothesis 3 (H3).
Through the graduates’ agglomeration and knowledge spillover, the college enrollment expansion positively affects corporate innovation. What’s more, graduates in science and engineering (S&E) fields play a more important role during the process.
The following main task of this article is to explore these three hypotheses, test the robustness of the model, and present the differences caused by possible heterogeneous samples.

3. Methodology

3.1. Identification Strategy

In order to explore the impact of university enrollment expansion on enterprise innovation, this paper uses the Difference-in-Difference method to evaluate the effect of human capital expansion on the innovation of Chinese enterprises based on the natural experimental framework of the policy impact of university enrollment expansion in 1999. As a method widely used in the quantitative evaluation of public policies and project implementation effects in recent years, the Difference-in-Difference method has effectively controlled the ex-ante differences between the research objects by introducing a control group, reducing the impact of other intervention factors on the implementation effect, thereby achieving the purpose of separating the real result of the policy effectively.
After the policy of enrollment expansion in universities has been implemented for a certain period of time, the supply of human capital in the whole society has increased significantly. In this context, due to the differences in the application of skilled labor elements in different industries, the expansion of human capital brought about by the expansion of college enrollment is heterogeneous. In response to this topic, following the construction ideas of ref. [6], we use human capital intensity as an identification variable to distinguish and compare industries with higher human capital intensity and industries with a lower human capital intensity of the changes in corporate innovation behavior around 2003.
The distinction between high and low industry human capital intensity is determined based on the proportion of employees in each industry in the United States with a four-year university degree or above in 1980. The reason for this determination is that the United States created a large number of new technologies in the 1970s. In addition, the labor market is highly flexible, which can well reflect the technological frontiers of various industries, while the Chinese labor market is affected by the distortion of resource allocation. According to the calculations of ref. [6], the intensity of labor distribution in various industries in China with a four-year university degree or above in 2004 is closely related to the distribution of high-skilled human capital in the United States in 1980, with a correlation coefficient of 0.73.

3.2. Data

In the analysis process, the two micro-databases mainly used in this article are the Annual Survey of Industrial Enterprises maintained by the National Bureau of Statistics of China and the Chinese Patent Database released by the State Intellectual Property Office. The Annual Survey of Industrial Enterprises contains enterprises with more than five million RMB sales, which are more representative than the listed company. We match these data with patent application data through the enterprise name and legal person code. The research time span is from 1998 to 2008, five years before and after the shock year 2003, when the college enrollment expansion brought the first batch of graduates to the labor market. For the measurement of industry human capital intensity indicators, we refer to the data of ref. [18], and match the industry codes of Chinese enterprises and the industry norms they use, namely revision 2 of the United Nations International Standard Industry Classification (ISIC Rev2.0, 1968) covering 28 three-digit coding industries in the manufacturing industry. In the subsequent series of inspections, the control variables at the regional level were derived from the China City Statistical Yearbook, and we also apply the China Customs data released by the General Administration of Customs of China in the corresponding inspections.

3.3. Sample Construction

The observation period was eleven years, from 1998 to 2008. One of the primary data sources used in this article is the annual survey of industrial enterprises released by the National Bureau of Statistics of China. The data set includes all state-owned and non-state-owned industrial enterprises with annual sales of more than 5 million yuan during the sample period. These data include information on the essential characteristics of the company and financial variables from the company’s balance sheet, income statement, and cash flow statement.
Since the main dependent variable is the number of patent applications, the following sample comes from the result of matching industrial enterprise data with patent data. The number of companies in the sample increased from 74,581 in 1998 to 362,748 in 2008. The sharp increase in the number of companies in 2004 reflects the fact that the 2004 survey of industrial companies found that due to imperfect business registration, many companies were excluded from the annual survey. Since 2004 is the census year, there are detailed technical numbers and the number of employers with a graduate degree or above, which are not included in other years. Correspondingly, data such as value-added, export delivery value, and R&D investment are not announced. The descriptive statistics of the data are presented in Table 1, which includes the basic information of the company and the company patent information obtained after matching. The window period covers the years when China’s patent data have undergone tremendous structural changes, providing strong support for subsequent investigations.
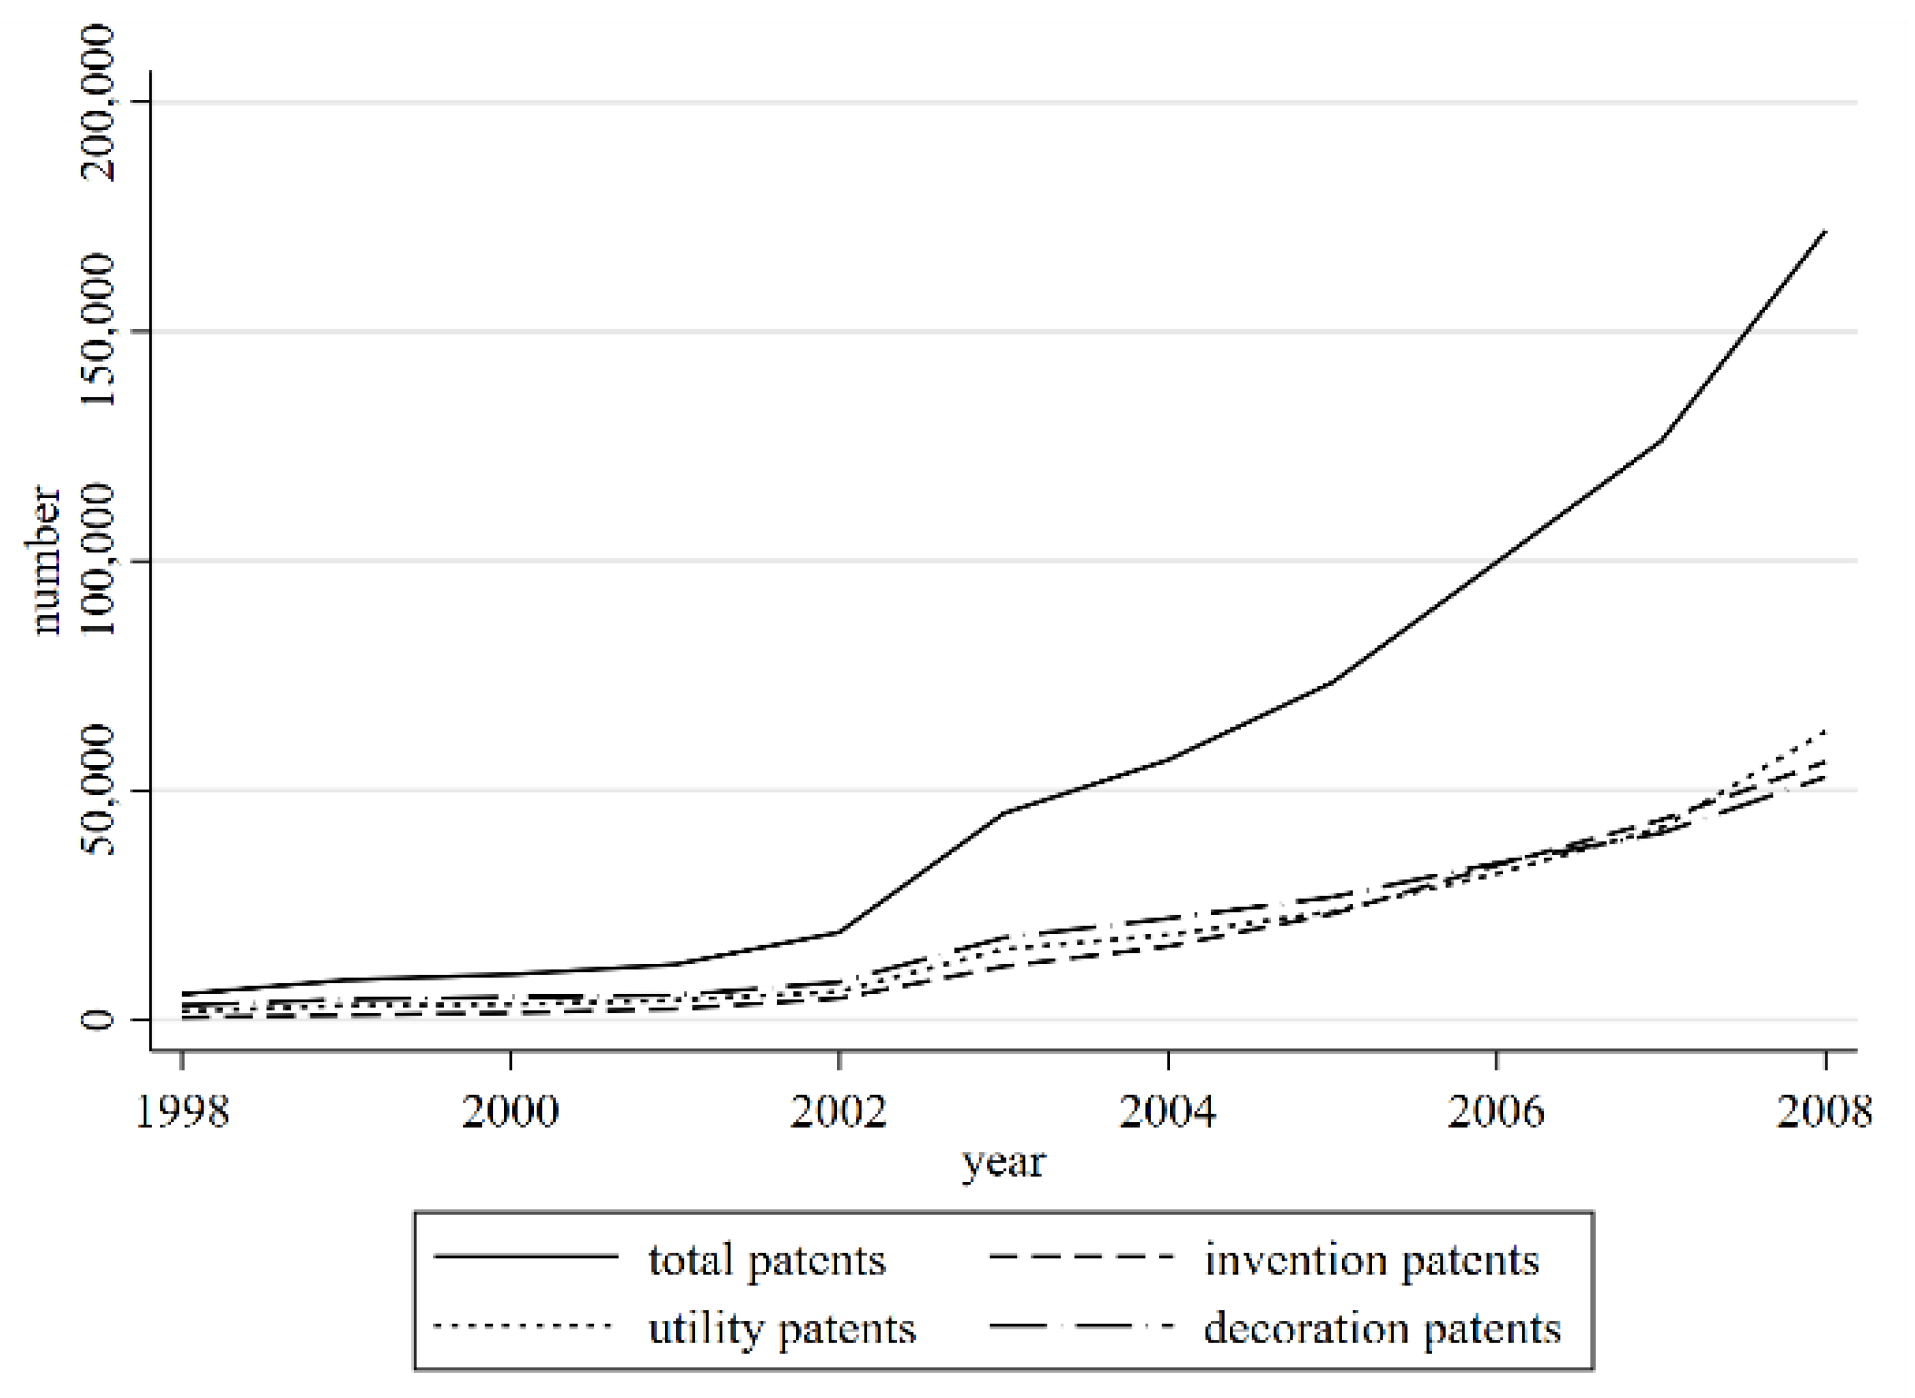
The changes in the number of patent applications by enterprises during the sample period are shown in Figure 3. The data are also a matching data set between the applied industrial enterprise database and patent data. The first category is the total number of three categories of patent applications by enterprises, and the other three categories are the annual statistics of invention patents, utility model patents and design patents during the window period. We can easily find that the number of patent applications has increased significantly in 2003. This coincides with the year when the first four-year college students who experienced college enrollment expansion entered the labor market discussed in this article. In addition, invention patents in category 2, as a patent type with a higher technical content, are consistent with the change in the total number of patents in this regard. That is, there was a substantial increase in 2003. Through horizontal comparison, it is not difficult to find that design patents accounted for the highest proportion of the total patent applications. Before 2003, they accounted for about half of the total. After 2003, they accounted for about one-third of the total. The decrease in the proportion corresponds to the increase in the share of invention and utility model patents. Moreover, invention patents accounted for less than one-tenth (7.79%) of the total applications in 1998 to nearly one-third (32.52%) of the total applications in 2008. This also shows that the company’s innovation capabilities have greatly improved in this period of time.
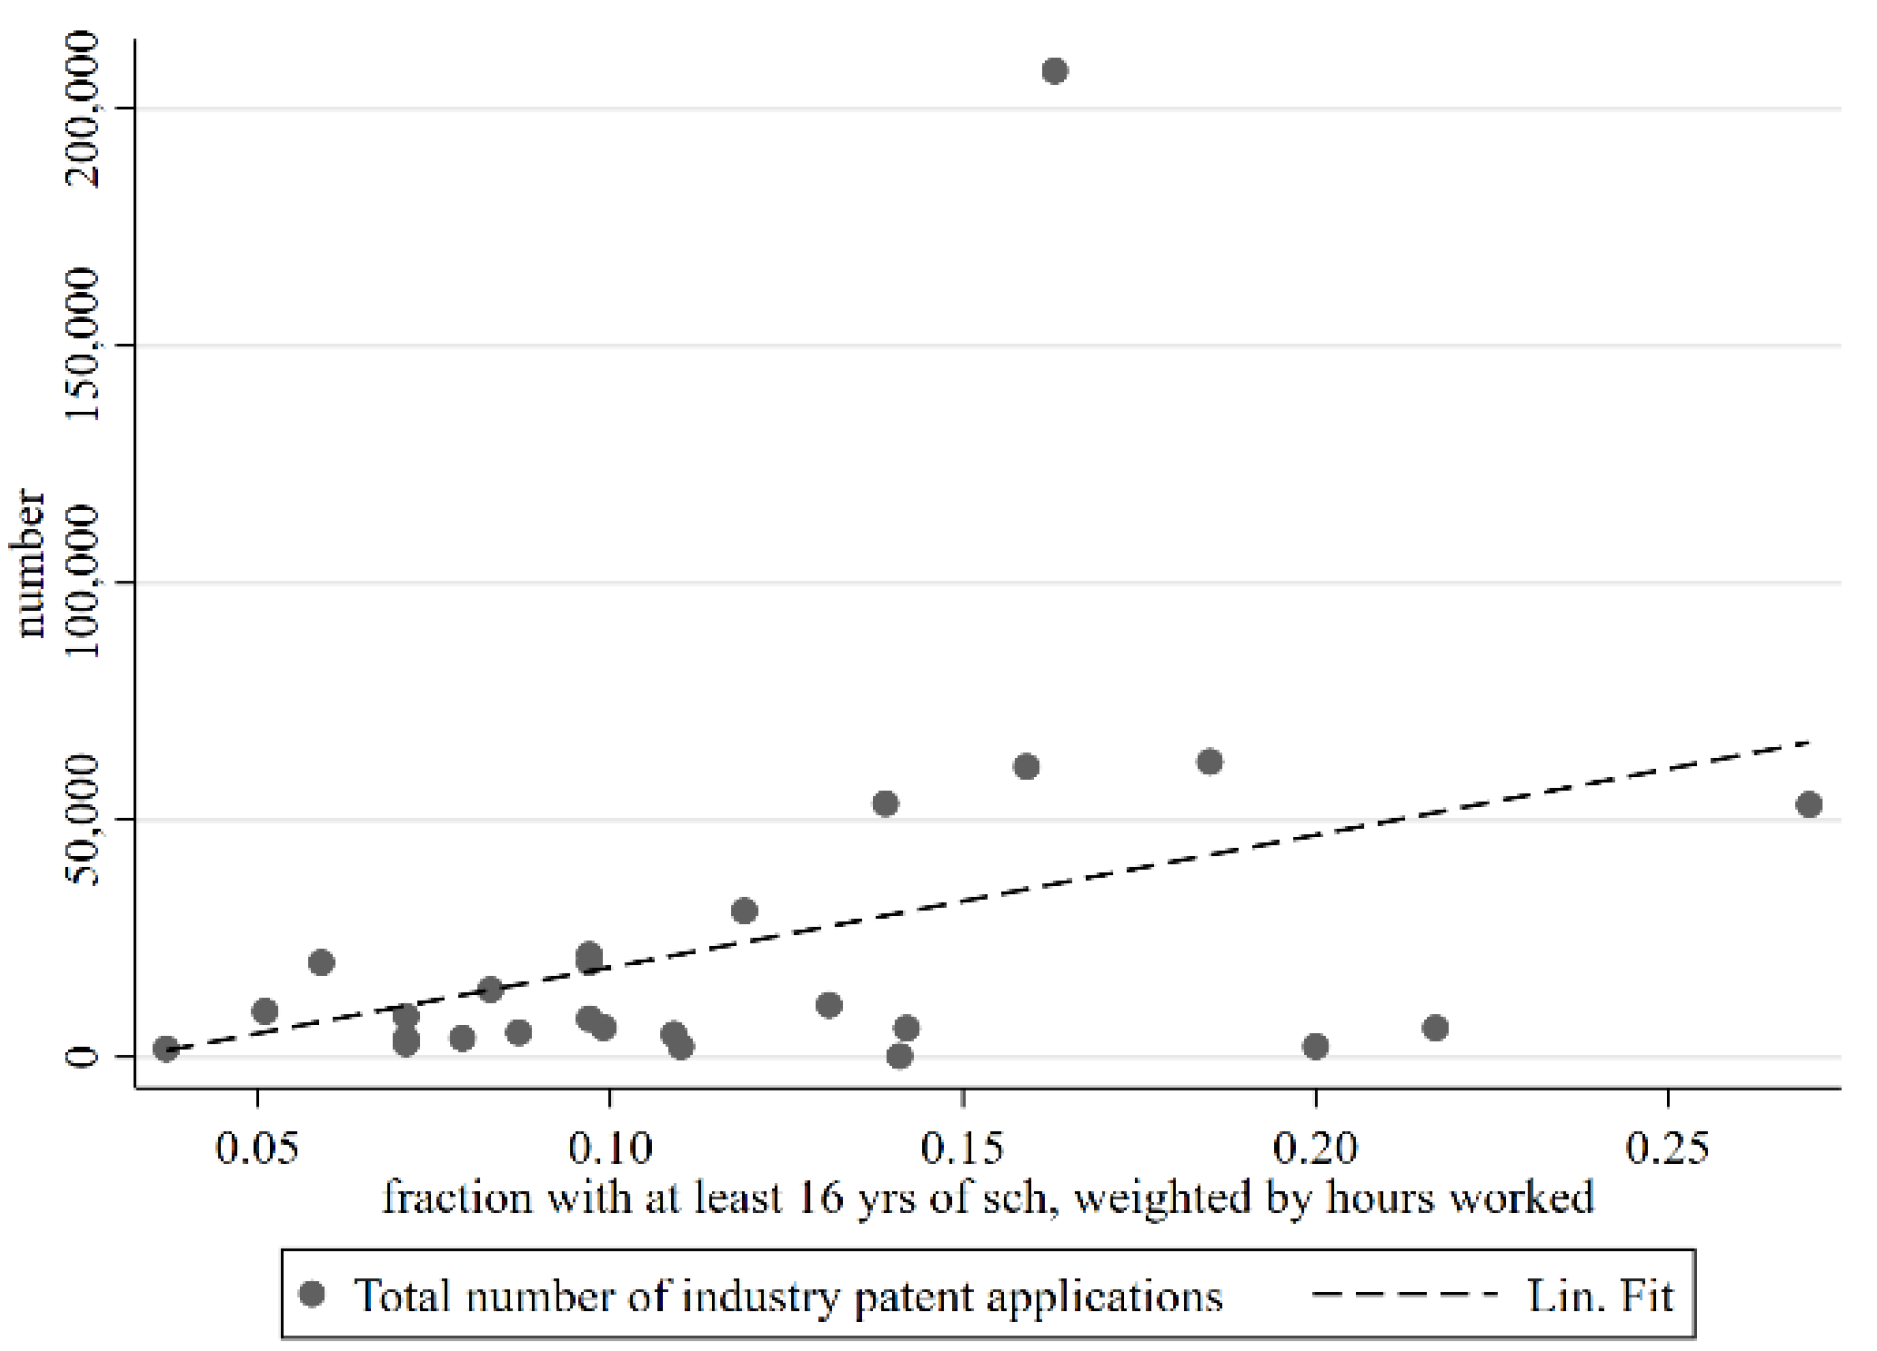
As a regression hypothesis, we further observe the relationship between total patents and human capital in different industry categories. From Figure 4, we can see that the trend of human capital intensity corresponding to corporate innovation is a curve that slopes upward to the right, indicating that with the expansion of higher education human capital in the industry, there is an overall upward trend. Among them, the outlier is the point where the number of patent applications is much higher than that of other industries. In addition, the corresponding industry is electric machinery, which is also determined by the characteristics of the industry.

4. Model and Results

4.1. Setup

After the implementation of the policy of enrollment expansion in universities, the human capital stock of the whole society has increased significantly. Different industries have differences in the application of skilled labor elements, so the demand and absorption of human capital in different industries are various from each other. In other words, the expansion of human capital brought about by college enrollment has a heterogeneous impact on different industries. Aiming at the topic discussed in this article, we distinguished and compared industries with higher human capital intensity and industries with lower human capital intensity, observing the changes in corporate innovation behavior around 2003. We establish a difference-in-difference regression model on this basis:
y ij ( t + 1 ) = α i + γ t + β · ( IndustryHC j · Post t ) + φ · X ijt + ε ijt
Among them, the explained variable y ij ( t + 1 ) represents the innovation status of i company in industry j (4-digit code) in the (t + 1) year, measured by the logarithm of the number of patents applied by the company. In light of the fact that the number of enterprise patent applications in a year may be zero, the calculation method here is the natural logarithm of the number of patent applications plus one. In addition, we also take the time lag effect of innovation output into consideration, that is, the patent data are lagging for one year. In this way, the patent output in the following year corresponds to the nature of the industrial enterprise of the present year. IndustryHC j is the human capital intensity of industry j, which distinguishes the level of human capital intensity of the industry, based on employees with a four-year university degree or above in each industry in the United States in 1980. Post t is the year of policy shock. The year of implementing the university expansion policy is 1999 and China’s undergraduate education is usually a four-year system. Therefore, the first year when the first batch of college students affected by the policy implementation entered the labor market was 2003. Post t equals to 1 for 2003 and subsequent years, and 0 for the previous year. The cross-product coefficient β measures the average difference in changes in the degree of corporate innovation in industries with different human capital intensities before and after the policy. If β   >   0 , it indicates that the expansion of human capital has a positive impact on corporate innovation; if β   <   0 , it shows that the expansion of human capital for higher education has a negative impact on enterprise innovation. α i and γ t represent firm fixed effects and year fixed effects, respectively, and ε ijt is a random error term.
In order to control the differential impact of macroeconomic policies on different industries, the control variable X ijt adopted is a series of interaction terms between industry characteristics and year dummy variables, including capital intensity, which is the ratio of the industrial actual capital stock to the industrial added value. External financing constraints are expressed as the ratio of industry capital expenditure minus cash flow to capital expenditure. Contract intensity is calculated as the proportion of intermediate inputs that require relational investment. The measurement of capital intensity refers to the results of ref. [18]. The external financing constraint data come from the measurement of ref. [19]. The contract intensity data are based on the 1996 US input–output table to obtain the proportion of intermediate input that requires specific relationship investment [20].
Based on the benchmark regression formula, we further estimate the dynamic regression formula:
y ij ( t + 1 ) = α i + γ t + t = 1999 2008 β · ( IndustryHC j · Year t ) + φ · X ijt + ε ijt
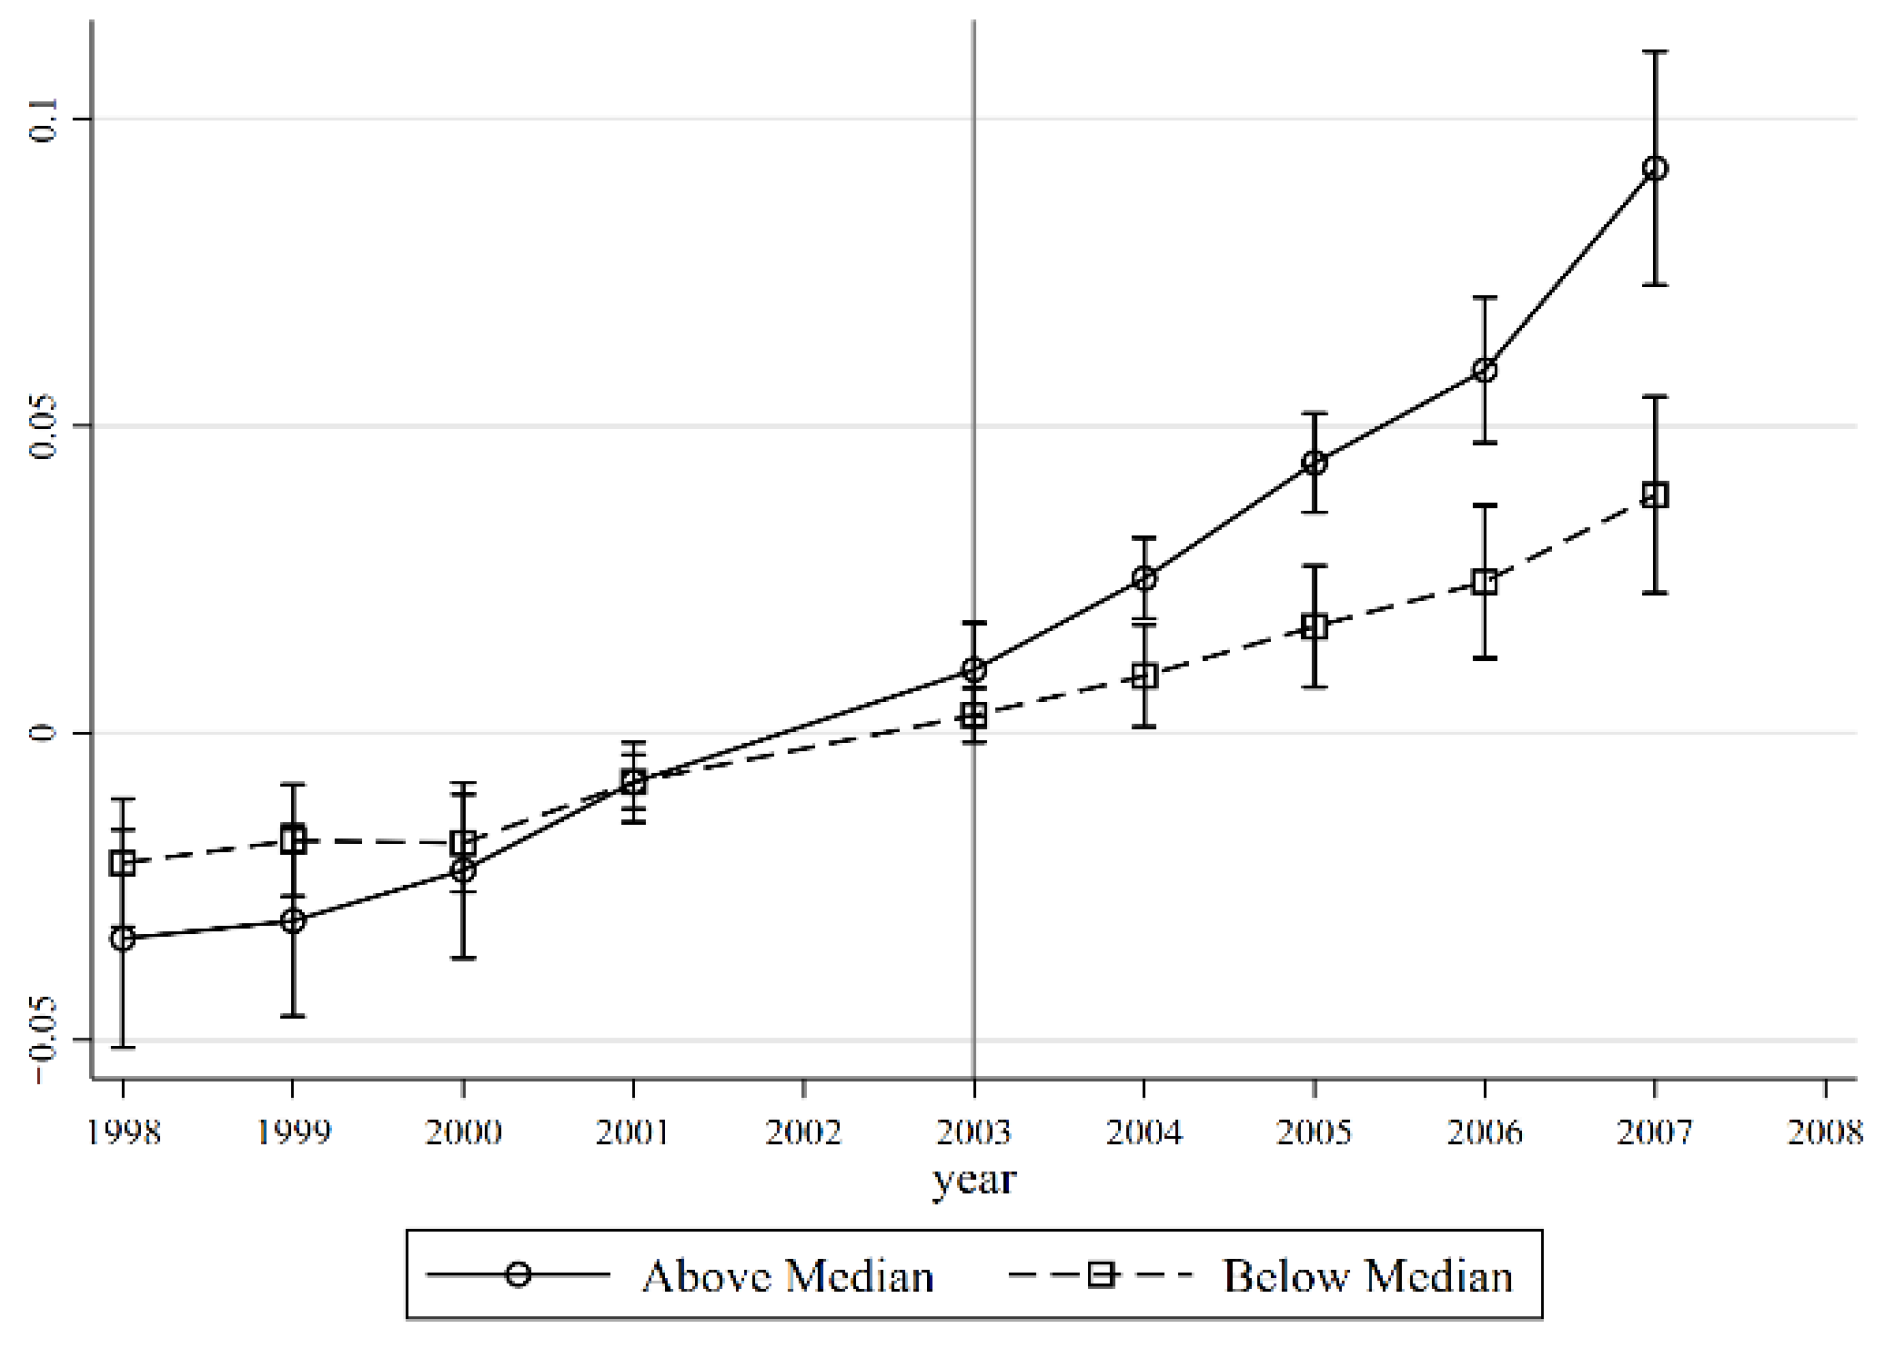
In the formula, the interaction terms of industry human capital intensity and year dummy variables are added year by year to present estimated coefficients, so as to clearly show the dynamic changes in corporate innovation behavior in each year before and after the impact. During the setting process, 1998 was used as the base period for comparison. At the same time, this dynamic estimation formula can also be used as the basis for judging the parallel trend assumption before the impact of the difference-in-difference model. As shown in the Figure 5, the estimated coefficient is not significant before the policy shock year, indicating that the dependent variable is not affected by the time trend variable. That is, it will not be affected by other external shocks when the policy shock does not exist. Satisfying the assumption of parallel trends indicates that the changes in corporate innovation behavior before and after the impact are caused by the policy impact.

4.2. Estimation Results

4.2.1. Baseline Regression

Table 2 summarizes the benchmark regression results. Column (1) only controls firm fixed effects and year fixed effects, and the estimated coefficient of the crossover term is positive, indicating that compared with firms in industries with lower human capital density (control group), firms in industries with high human capital density (treatment group) have a higher degree of innovation. That is, the increase in human capital with a university degree promotes enterprise innovation. In addition, this effect is more evident in high-skilled human capital-intensive companies.
Column (2) adds industry-level control variables, including the intersection of industry capital intensity and year dummy variables, where industry-level capital intensity is measured by the ratio of the actual capital stock and value added of each industry in the United States in 1980. The control of this part is mainly due to the fact that capital-intensive industries are susceptible to policy shocks, which affects the estimation results. After joining the control, the estimated coefficient is still positive, and the trend of corporate innovation still has a positive correlation with the expansion of human capital. Column (3) introduces the cross-multiplication of the degree of dependence on foreign investment and the year dummy variable and the cross-multiplication of the contract intensity with the year dummy variable. Among them, the measurement of the degree of dependence on foreign investment comes from ref. [18], and the contract intensity is based on the 1996 US input–output table to obtain the intermediate input ratio that requires specific relationship investment [20]. The industry characteristic data in this part continue the industry classification of human capital intensity in the identification strategy.
As the industry distribution of different provinces has certain characteristics, in order to eliminate the impact of this difference in the distribution of provincial industries, Column (4) further controls the fixed effects of provincial years. The estimated coefficients in Columns (2) to (4) are all positive and significant. We use the estimated formula in Column (4) as the benchmark regression formula for the following text. Below we conduct a detailed analysis of the estimated coefficients.
The estimated coefficient of the benchmark regression (4) is 0.072, which shows that, on average, the industry with the highest human capital intensity (chemical manufacturing) is more innovative than the industry with the lowest human capital intensity (shoe manufacturing). About two percentage points higher (0.072 × (0.27 − 0.037)). In the same way, taking the footwear manufacturing industry with the lowest human capital intensiveness as a reference, we can also calculate the innovation trend gap of other industry categories relative to this. The calculation formula is gap j = 0 . 072   ×   ( HC j     HC 0 ) , and HC 0 = 0 . 037 . We can also obtain the innovation output variance between any two industries by changing the reference industry.

4.2.2. Dynamic Regression

Columns (5)–(8) of Table 2 are the regression result based on the dynamic estimation formula to test the time-series response of enterprise innovation behavior to the impact of human capital expansion. For comparison, the fifth column reports the estimates of the benchmark regressions listed in the fourth column of Table 2.
The estimated results of the interaction term from 1999 to 2001 are not statistically significant, which indicates that the patent application of enterprises in industries with low human capital intensity has not improved significantly compared with that of high capital-intensive industries in the years before the surge of skilled labor. This finding supports hypothesis 1. That is, before the rapid increase in university graduates caused by the expansion policy, there are basically no large systemic differences in the growth of corporate innovation behavior in various industries. In other words, after controlling for a series of industry characteristics, we can safely deduce that if it were not for the increase in the quantity and quality of human capital brought about by the expansion, the variance in corporate innovation in high and low human capital-intensive industries would not appear after 2003.
In order to further eliminate other mixing factors that may interfere with the results, the interaction between industry dummy variables and year dummy variables is added to the benchmark model so that the innovation results of each industry show a steady trend over time. The regression results are reported in the sixth column of Table 2. These estimates are slightly larger than those reported in the first column, but the patterns are similar: 1999–2001 estimates are small and insignificant. There was a slight increase in 2002, a sharp jump in 2003, and roughly the same from 2004 to 2007. One possible explanation for the slight increase in 2002 is that three-year college graduates have already graduated and entered the labor market at this time.
In Column (7), Table 2, the interaction between innovation achievements and year dummy variables is added to the benchmark model to directly control the pre-sample trend of enterprise innovation. This approach helps eliminate the influence of innovation trends before the sample period on innovation in the year after the expansion. In Column (8), following the method of ref. [21], by controlling the interaction before the pre-processing policy, the trend of suppressing the pre-processing (1998–2002) dependent variable and year dummy variable is achieved. The regression results are still in line with expectations. In general, the estimates in the Columns (5)–(8) report show that the benchmark estimates are robust to the regression results of different enterprise innovations.

4.3. Robustness Test

4.3.1. WTO Accession

In the 1990s, in order to join the World Trade Organization, China conducted long negotiations with the member states. With the deepening of the reform and opening-up and the rapid development of the economic construction, China joined the WTO in November 2001. However, the impact of this measure on different industries is not the same. Suppose different industries obtain disproportionate in the benefits from human capital due to their accession to the WTO. In that case, it may bias the impact of human capital on innovation discussed in our analysis.
First, due to the reduction in imports, Chinese companies can enter overseas markets at a lower cost. The elimination of tariffs or other trade barriers in destination countries will enable companies in export-intensive industries to benefit more from joining the WTO. To ensure that the estimation results are not driven by export industries, Table 3 estimates the benchmark models that exclude the computer and footwear industries, which are the two largest export industries in China during the sample period. The estimated results are shown in the first and second columns of Table 3. In these two columns, the estimated values of the interaction between the industry human capital density and the indicators after 2003 are positively significant and are similar in magnitude to the benchmark regression results. After excluding the shoe industry, the regression coefficient increased slightly, which is an indication that the patent output of the shoe industry was less affected before and after the policy was implemented. The third column controls the interaction between the export industry and the dummy variables around 2003.
Second, China’s entry into the WTO requires China to significantly reduce import tariffs. The most extensive tariff cuts occurred between 1992 and 1997. The decline in 2002 was much smaller, and the changes in other years were also smaller. Tariffs on inputs and final products followed a similar downward trend [22]. In order to reduce the mixing effect brought about by the potential correlation between tariff reduction and human capital intensity, we have further controlled the tariffs imposed on inputs and final products. The estimated results are shown in Column 4. The input–output tariffs all show insignificant results here, indicating that the effect of tariffs brought about by WTO entry has negligible impact on the human capital and innovation.

4.3.2. Other Macroeconomic Shocks

To further confirm that it is the sharp increase in the supply of high-skilled labor that lead to the change in corporate innovation behavior, rather than the change brought about by macroeconomic policies, we can separate this effect by redefining the impact.
Since macroeconomic policies generally affect all provinces and cities, we first assume that most college graduates choose to work in the province where the university is located. That is, the increase in college graduates affects the labor supply in the province where the university is located. Inferring from this hypothesis, we can see if it is due to the overall economic policy that guides corporate innovation behavior. If it is, then there will be a general increase in corporate innovation behavior among provinces with a large gap in the supply of skilled labor. Conversely, if it is not due to macroeconomic policy regulation, but the increase in the supply of high-skilled labor that leads to the difference of company’s innovation behavior, then in different provinces, especially between the provinces with a large gap in the supply of high-skilled labor, the innovation behavior of companies will be different. It is expected that in provinces where the supply of highly skilled labor accounts for a relatively high proportion of the labor force, the gap in the supply of skilled labor will increase the innovative behavior of enterprises with high human capital intensity compared with provinces with a lower proportion.
In this regard, we redefine the shock as provincial college graduate growth rate during 2001 and 2003 over the 2001 labor force. The shock equals to 1 if the enterprises belong to the province that is on the top 50% of our indicator. If this ratio is low, it indicates that the newly added skilled labor supply in this province is below average level. On this basis, we further define shock 2 to ensure its robustness. That is, to replace the 2001 college graduate number of the province with the average of 2000 and 2001 (the same is true for the calculation of 2003), standardized with the average labor force from 2000 to 2001.
Considering that Beijing, Shanghai, and Guangzhou have a relatively large population flow rate which may interfere with the results, we remove the samples from these three regions here for regression analysis. The results are shown in Columns (5)–(8) of Table 3. We can see that in areas where the province has a larger supply of newly added skilled labor, corporate innovation behavior is more significant with changes in human capital characteristics. For regions with a relatively lower supply of graduates, the results of the industrial corporate innovation behavior are not statistically significant. Moreover, its estimated coefficient is less than that of the province where graduates supply is above the median. When the two-year average is used to redefine shock2, the gap becomes more obvious. In this way our assumption proved to be true. It is due to the surge in the supply of skilled labor, not macroeconomic policies, that has brought about distinctions in corporate innovation behavior in different industries.

4.3.3. Further Robustness Checks

Beijing and Shanghai are cities with large numbers of university graduates in China, as well as the location of the most educated labor force. With the expansion of higher education, these two cities continue to attract huge amounts of university graduates from all over the country. Therefore, the concentration of university graduates in Beijing and Shanghai may be much higher than in other regions, which may lead to a significant increase in the innovative behavior of enterprises in Beijing and Shanghai in high-skilled human capital-intensive industries.
The ninth column of Table 3 reports the estimated results of the benchmark regression, excluding the sub-sample of companies in Beijing and Shanghai. The corresponding coefficient is slightly smaller than the benchmark regression result (0.072), but still significant. Therefore, we can infer that the benchmark result may not only be driven by the progress of corporate innovation in Beijing and Shanghai. This also indicates that the contribution of college graduates to the local economy is likely to depend on the local economic environment.
Enterprise entry also plays an important role in innovation behavior and economic growth. To measure the extent to which the surge of highly educated labor entering the market benefits capital-intensive industries, the tenth column of Table 3 estimates a benchmark model consisting of the subsample of new business entry only. The entry of new enterprises refers to the samples whose establishment year and the year when they first appeared in the industrial enterprise database are within two years. As we can see in the tenth column of the table, the estimated value of the interaction term is 0.110, which is greater than the benchmark regression result. This reflects the fact that newly established enterprises have great potential to absorb college students and creating innovative output.
The results reported in the eleventh column are from a set of balanced panel sub-samples, that is, companies that have survived the 11-year window from 1998 to 2008. This estimate (0.205) is significantly larger than the benchmark regression result. Considering that the data of all surviving companies before and after the policy shock are available, it will more significantly show the changes in corporate innovation behavior brought about by the impact. It again shows that the redistribution of resources within the industry is a source of the observed differentiated growth of corporate innovation.

4.4. Heterogeneous Analysis

4.4.1. Type of Patent Application

There are three main types of patent applications for enterprises: invention patents, utility model patents, and design patents. Previously, the measurement of corporate innovation was based on the aggregate data of the three types of patent applications. Therefore, for different types of patent applications, the detailed discussion of patent types helps to further explore the relationship between human capital intensity and corporate innovation behavior. In this part, because invention patents can most directly show corporate innovation, we have performed benchmark regression tests and dynamic regression analysis for total patents application and invention patents application respectively. The estimated results are presented in Panels A and B in Table 4, among which the first column is an estimate of the total applications for the three types of patents, and the second column is the application status of invention patents.
From the estimation results in Panel A, we can see that as the supply of human capital with higher education increases sharply, enterprises with higher human capital intensity have significantly improved their innovation behavior, especially in invention patent applications, compared with enterprises with lower intensity of human capital. Moreover, the estimated coefficient of invention patent applications is higher than the benchmark regression. In addition, in the dynamic regression, this year-by-year gap has always existed, which further proves that high human capital density industries can better absorb talents and transform them into corporate innovation in the face of human capital expansion.

4.4.2. Export Companies and Non-Export Companies

As China has integrated into the international division of labor since the reform and opening-up policy, more and more Chinese companies have begun to export. The existing literature finds that there is a significant positive correlation between export status and firm productivity. In this regard, some studies emphasize the selection effect and believe that firms with high productivity are more inclined to export [23], while other studies consider that the export of enterprises promotes the increase in productivity [24]. Based on the matching data, the sample is divided into two parts based on its export condition. In addition, by observing the conversion of human capital absorption into innovation, we can see that in the face of the influx of new laborers with higher education in 2003, the regression results of export companies to innovation are positively significant (Table 4, third column), while non-export companies are insignificant (Table 4, fourth column).

4.4.3. Capital-Intensive and Labor-Intensive Industries

It is generally believed that the rapid development of China’s economy since the reform and opening-up policy is mainly based on “sweat” rather than “inspiration.” Therefore, compared with capital-intensive industries, labor factor-intensive industries should be less innovative. Therefore, we further distinguish between capital-intensive and labor-intensive enterprises and observe the innovation conversion efficiency of industries with different levels of human capital intensity. The results in Columns (5) and (6) from Table 4 also support economic predictions that capital-intensive enterprises will be better able to face external shocks from human capital supply and transform it into the enterprise’s patent application results.

4.5. Potential Mechanisms

This section explores possible ways in which the surge in the number of skilled labors can stimulate corporate innovation. Skilled labor can promote the innovative behavior of enterprises by promoting the application of new technologies and new production organizations. Considering the rapid development of technology-oriented industries in recent decades, this explanation may be more reasonable for companies in human capital-intensive industries.

4.5.1. R&D Investment

Firstly, the prediction of a hypothetical mechanism for college graduates to promote corporate innovation behavior is that with the massive increase in the university-educated labor force, companies may strengthen research and development (R&D) activities to promote the operation and application of high-tech equipment. Specific practices may include improving its production processes and organizational practices, improving existing products, and creating new products, thereby promoting various innovative activities of the enterprise. We explored the possible innovation activities of enterprises, and selected research and development expenses as the dependent variable. Since there are a large number of companies with 0 R&D data in the full sample, the explained variable is the natural logarithm of one plus R&D investment.
Secondly, we divide the sample and further select companies that have at least one year of R&D data during the window period and whose R&D investment is greater than zero. With the accelerating development of the capital market, accounting standards are also required to move closer to the rules of the world’s major economies in the process of corporate bookkeeping. Since the corporate accounting standards were updated in 2006, the window period just covers before and after the reform of accounting standards. The record of enterprise R&D data in this sample is somewhat irregular and incomplete, but we still use it as the object of measurement and analysis, which can provide certain reference value. In addition, 2004 was the census year, and its data composition was quite different from other years. Data on industrial added value, export delivery value, and R&D investment were not published.
According to the regression results presented in Columns (7) and (8) in Table 4, the R&D investment of R&D companies in the window period is correlated with the expansion of human capital receiving higher education. That is, after the implementation of the policy in 2003, when the first batch of college students flooded into the labor market, there was a big industry difference in R&D investment compared with previous years. Enterprises with high human capital intensity increased their investment in R&D at this time, which can explain the source of innovation output to a certain extent. The expansion of human capital in receiving higher education has led to industry differences in innovation output by affecting the investment in research and development. In contrast, the full sample data include companies with no R&D investment data or companies with 0 R&D investment, and the regression results always show the industry heterogeneity of R&D investment, which is also in line with cognition. That is, higher human capital density industries are more capable of engaging in research and development. However, compared with the results of only retaining R&D samples, it will weaken the effect of human capital expansion as a whole and cover the fact that the heterogeneous effect of industry R&D investment brought by university expansion is more concentrated on companies that value R&D.

4.5.2. Patent Stock

The ninth column of Table 4 estimates the regression results of the invention patents stock as a supplementary measure of the quality of the company’s long-term patents. The calculation of patent stock is based on the following formula [25,26,27]:
K it = [ 1     θ ]   ×   K it 1 + r it
K it is the patent stock of firm i in year t. θ represents the depreciation rate of patent stock, and we set it as 15% according to a previous study. r it is the granted patents of firm i in year t. According to the regression result in Column (9), Table 4, in terms of the quality of long-term invention patents, the expansion of university enrollment has increased the stock performance of invention patents, which is economically significant.

4.5.3. Agglomeration and Knowledge Spillover

Except for R&D expenditure and patent stock, from a more macroeconomic perspective, we find out that the agglomeration effect could also accelerate college enrollment expansion stimulating corporate innovation. The agglomeration effect means that the enrollment expansion brings about a rise and concentration of higher-educated labors in a local labor market, contributing to the increasing number of college students per company on average, which is a path beneficial to production and process innovation. When more graduates work together in the same company, they will discuss, communicate, and share professional knowledge and ideas, thereby generating economies of scale to solve technical problems in innovating process. Meanwhile, because of the clear functions of the urban zones, companies engaged in similar industries are often located in one area. The addition of college students will bring knowledge spillover to corporates, including their corporates and other surrounding corporates, that is, after college students impart knowledge to other employees in the company, these employees would sometimes tell the knowledge to workers in surrounding business during their daily communication such as lunch chat. Over the time, the overall skill level and innovative ability of the whole companies has improved, and they are more likely to develop high-tech products.
To measure the agglomeration effect varying with place and time, we interact our key variable IndustryHC j   Year t with the ratio of graduates to labor at a province-year level. Furthermore, we standardize all variables to eliminate the influence of dimensions on the results. Firstly, we explore how the agglomeration effect works in general. Columns (1) and (2) in Table 5 show that after adding the three interaction into the total sample, the estimate of three interaction is 0.0201, significant at the 1% level and the coefficient of IndustryHC j   Year t becomes insignificant, which infers that the agglomeration effect surely plays a mechanism between high-tech human capital and corporate innovation. Otherwise, we refer to ref. [6] and divide the total graduates into three parts: science and engineering (S&E) fields, economics, management and law (EML) fields, and other fields to compare different agglomeration among various fields. The results have been shown in Columns (3)–(5) in Table 5, which represents S&E fields, EML fields, and other fields, respectively. The significant estimate for S&E fields shows that a larger number of graduates in scientific and engineering fields are relevant to the rise of corporate innovation after college enrollment expansion. However, the estimate for EML fields and other fields shows no significance, suggesting that graduates in these fields generate less impact on corporate innovation. It is consistent with national conditions at that time where the total society was vigorously secondary industry and encouraging science talents berried into manufacturing. However, we should admit that the different results among fields are partly due to the variable we choose to measure corporate innovation because most patents are related to nature science rather than social science, maybe strengthen the effect of graduates in S&E fields but underestimate the influence of Arts graduates.

5. Discussion

To what extent the increase in human capital brought about by university enrollment has affected the innovation of different industries is an empirical issue worthy of attention. In this regard, the paper selects the policy time of college enrollment expansion as the cut-off point and takes the year of the influx of graduates into the labor market as the policy impact time to observe the changes in corporate innovation in the preceding and subsequent periods. The main finding of this paper is that in China, the college enrollment expansion has brought about two percent more innovation outputs to industries with the highest human capital intensity than industries with the lowest human capital intensity. Though divergent methods, this finding achieves a congruence with ref. [28] which developed a multi-industry general equilibrium model to analyze the heterogenous influence on industries with different skill intensities. Additionally, our finding is consistent and complementary to ref. [6] which views the increasing disparity of R&D activities as one of the reasons why firm productivity is higher in more human-capital-intensive industries.
Broadly, our research shows that policy-driven education expansion could stimulate corporates’ patents by at least 3.7%. To put the magnitude in perspective, it may be helpful to compare it to the impacts of similar education expansion policies in other countries. First, the decentralization of post-secondary education in Sweden enabled a single post-graduate researcher to increase the patents by almost 0.01% (ref. [8]). This suggests that the Chinese policy conducted a more profound impact than the Swedish owing to broader affected populations and manufacturing firms. Second, in Italy, an opening of the university has caused an increase in regional innovation by 7% (ref. [9]), which is larger than our estimates. This difference rises because (1) the scale of regional innovation is broader than the corporate innovation, reflecting more spillover effects of education expansion policy, or (2) economic divergence between China and Italy. Nevertheless, our research provides evidence in a developing country to support that policy-driven education expansion positively affects creativity.
Moreover, this paper contributes to a strand of the literature about the effect of increasing human capital. Previous articles have focused on total factor productivity [12], skill-biased technology adoption [29], and college premium [11,30]. The paper cuts in from the perspective of industrial enterprise innovation and observes the significance of this indicator. We use enterprise-level data to measure corporate innovation performance with more diversified measures, including patent applications and patent stock. More importantly, we find that human capital enhancement induced by the college enrollment expansion improves corporate innovation through diverse mechanisms, including R&D investment, patent stock, and agglomeration effect of graduates.

6. Conclusions

This study provides further evidence to support that human capital can stimulate firm innovation, and the magnitude of this impact varies with human capital intensities in industries. Taking the year when the first batch of college graduates affected by the expansion of enrollment joined the labor market as the shock year, we find that, on average, the effect on the industry with the highest human capital intensity is two percentage points higher than the industry with the lowest human capital intensity. After a series of robustness tests, the results are still significant. This finding indicates firms’ heterogenous innovating response to an exogenous human capital influx. Firms’ absorption and human capital transformation are more vividly reflected in the invention patents. Further, in the same capital-intensive industry, compared to non-tradable and weakly productive firms, export and advanced productive firms are inclined to have a stronger ability to absorb high-skilled labor and transform it into innovative behavior.
As for the mechanism for college enrollment expansion to promote the absorption of human capital, we firstly focus on the discrepancy of R&D investment in different industries and find that there is a higher R&D investment in human-capital-intensive industries, through which these industries present higher innovative outputs. This finding holds both in the whole samples and the subsamples only with positive R&D investment. Moreover, the college enrollment expansion also improves the firms’ long-term patent quality proxied by the patent stock, especially in industries with highly human-capital intensity. Further, the agglomeration of high-skilled labors caused by the college expansion in the province where the firms are located also stimulates the knowledge spillover effect, which should be another important mechanism to provide local firms more chances to access advanced technology and invent high-quality patents.
Human capital is particularly important to China’s current economic stage when the demographic dividend is decreasing, the population structure is aging, while industries are transitioning to technology-intensive. As a milestone event in contemporary Chinese history, the college enrollment expansion not only increases the overall education level of residents but also supplies high-tech talents and expands the knowledge spillovers from colleges and universities to manufacturing firms and industries and translates theoretical research into practice and products. Based on the analyses in this paper, we try to put forward three policy recommendations to help industries use human capital. First, the local government should take measures to dredge the channels of new graduates flowing to high-technical firms. More specifically, local administration could create an extensive communication platform among firms, colleges, and graduates, provide settlement convenience for graduates, and improve public utilities. Second, the local government could also increase the subsidy and tax deduction for R&D investment. This policy could encourage local firms to enhance R&D investment, which would speed up the transformation of human capital into innovation productivity. Finally, the quality of higher education should be improved by increasing the share of fiscal expenses, implementing intellectual property protection, and introducing advanced experts in key support areas, which can provide a think tank and a reserve army of talents for local firms.

Author Contributions

Conceptualization, M.K. and Z.Z.; Data curation, Y.L. and M.Z.; Formal analysis, Y.L. and M.Z.; Funding acquisition, M.K. and Z.Z.; Investigation, Z.Z.; Project administration, M.K. and H.W.; Resources, and H.W.; Software, Y.L. and M.Z.; Supervision, M.K. and H.W.; Validation, and H.W.; Writing—original draft, M.Z.; Writing—review and editing, Y.L. and Z.Z. All authors have read and agreed to the published version of the manuscript.

Funding

This research was funded by National Natural Science Foundation of China, grant number 71802152, and National Social Science Fund of China, grant number 18BGJ015.

Institutional Review Board Statement

Not applicable.

Informed Consent Statement

Not applicable.

Data Availability Statement

Not applicable.

Conflicts of Interest

The authors declare no conflict of interest.

References

  1. Romer, P.M. Idea gaps and object gaps in economic development. J. Monet. Econ. 1993, 32, 543–573. [Google Scholar] [CrossRef]
  2. Romer, P.M. Endogenous technological change. J. Political Econ. 1990, 98, S71–S102. [Google Scholar] [CrossRef]
  3. Aghion, P.; Howitt, P. A model of growth through creative destruction. Econometrica 1992, 60, 323–351. [Google Scholar] [CrossRef]
  4. Acemoglue, D. Why do new technologies complement skills? Directed technical change and wage inequality. Q. J. Econ. 1998, 113, 1055–1089. [Google Scholar] [CrossRef]
  5. Aghion, P.; Howitt, P. Endogenous Growth Theory; MIT Press: Cambridge, MA, USA, 1998. [Google Scholar]
  6. Che, Y.; Zhang, L. Human capital, technology adoption and firm performance: Impacts of China’s higher education expansion in the late 1990s. Econ. J. 2018, 128, 2282–2320. [Google Scholar] [CrossRef]
  7. Andersson, R.; Quigley, J.M.; Wilhelmson, M. University decentralization as regional policy: The Swedish experiment. J. Econ. Geogr. 2004, 4, 371–388. [Google Scholar] [CrossRef]
  8. Andersson, R.; Quigley, J.M.; Wilhelmson, M. Urbanization, productivity, and innovation: Evidence from investment in higher education. J. Urban Econ. 2009, 66, 2–15. [Google Scholar] [CrossRef]
  9. Cowan, R.; Zinovyeva, N. University effects on regional innovation. Res. Policy 2013, 42, 788–800. [Google Scholar] [CrossRef]
  10. Hvide, H.K.; Jones, B.F. University innovation and the professor’s privilege. Am. Econ. Rev. 2018, 108, 1860–1898. [Google Scholar] [CrossRef]
  11. Li, S.; Whalley, J.; Xing, C. China’s higher education expansion and unemployment of college graduates. China Econ. Rev. 2014, 30, 567–582. [Google Scholar] [CrossRef]
  12. Li, H.; Ma, Y.; Meng, L.; Qiao, X.; Shi, X. Skill complementarities and returns to higher education: Evidence from college enrollment expansion in China. China Econ. Rev. 2017, 46, 10–26. [Google Scholar] [CrossRef]
  13. Kang, Y.; Liu, R. Does the merger of universities promote their scientific research performance? Evidence from China. Res. Policy 2021, 50, 104098. [Google Scholar] [CrossRef]
  14. Beaudry, P.; Doms, M.; Lewis, E. Should the personal computer be considered a technological revolution? Evidence from U.S. metropolitan areas. J. Political Econ. 2010, 118, 988–1036. [Google Scholar] [CrossRef]
  15. Bartelsman, E.; Dobbelaere, S.; Peters, B. Allocation of human capital and innovation at the frontier: Firm-level evidence on Germany and the Netherlands. Ind. Corp. Chang. 2014, 24, 875–949. [Google Scholar] [CrossRef]
  16. Lewis, E. Immigration and production technology. Annu. Rev. Econ. 2013, 5, 165–191. [Google Scholar] [CrossRef]
  17. Dustmann, C.; Glitz, A. How do industries and firms respond to changes in local labor supply? J. Labor Econ. 2015, 33, 711–750. [Google Scholar] [CrossRef]
  18. Ciccone, A.; Papaioannou, E. Human capital, the structure of production, and growth. Rev. Econ. Stat. 2009, 91, 66–82. [Google Scholar] [CrossRef]
  19. Rajan, R.G.; Zingales, L. Financial dependence and growth. Am. Econ. Rev. 1998, 88, 559–586. [Google Scholar]
  20. Nunn, N. Relationship-specificity, incomplete contracts, and the pattern of trade. Q. J. Econ. 2007, 122, 569–600. [Google Scholar] [CrossRef]
  21. Hornbeck, R. The enduring impact of the American dust bowl: Short- and long-run adjustments to environmental catastrophe. Am. Econ. Rev. 2012, 102, 1477–1507. [Google Scholar] [CrossRef]
  22. Brandt, L.; Van Biesebroech, J.; Zhang, Y. Creative accounting or creative destruction? Firm-level productivity growth in Chinese manufacturing. J. Dev. Econ. 2012, 97, 339–351. [Google Scholar] [CrossRef] [Green Version]
  23. Melitz, M.J. The impact of trade on intra-industry reallocations and aggregate industry productivity. Econometrica 2003, 71, 1695–1725. [Google Scholar] [CrossRef]
  24. Atkin, D.; Khandelwal, A.K.; Osman, A. Exporting and firm performance: Evidence from a randomized experiment. Q. J. Econ. 2017, 132, 551–615. [Google Scholar] [CrossRef]
  25. Hall, B.H.; Harhoff, D. Recent research on the economics of patents. Annu. Rev. Econ. 2012, 4, 541–565. [Google Scholar] [CrossRef]
  26. Fang, L.H.; Lerner, J.; Wu, C. Intellectual property rights protection, ownership, and innovation: Evidence from China. Rev. Financ. Stud. 2017, 30, 2446–2477. [Google Scholar] [CrossRef]
  27. Huang, Z.; Phillips, G.M.; Yang, J.; Zhang, Y. Education and Innovation: The Long Shadow of the Cultural Revolution; No. w27107; National Bureau of Economic Research: Cambridge, MA, USA, 2020. [Google Scholar]
  28. Ma, X. College Expansion, Trade and Innovation: Evidence from China; MPRA Paper 109469; University Library of Munich: Munich, Germany, 2022. [Google Scholar]
  29. Feng, S.; Xia, X. Endogenous skill-biased technology adoption: Evidence from China’s college enrollment expansion program. Hum. Cap. Econ. Oppor. Work. Group Work. Pap. 2018, 99, 1–52. [Google Scholar]
  30. Rong, Z.; Wu, B. Scientific personnel reallocation and firm innovation: Evidence from China’s college expansion. J. Comp. Econ. 2020, 48, 709–728. [Google Scholar] [CrossRef]
Figure 1. This is a figure about changes in the enrollment rate, graduate-labor rate of Chinese universities, and patents from 1998 to 2008. The data are from China Education Statistics Yearbook. The two vertical dotted line represents the beginning year of college enrollment expansion (1999) and the first year that the influx of college graduates into the labor market after the expansion (2003).
Sustainability 14 12352 g001
Figure 2. Conceptual framework of this paper. In this figure, the college enrollment expansion in China positively poses heterogeneously positive effects on corporate innovation in different industries, mainly through R&D investment, patent stock, and agglomeration effect.
Sustainability 14 12352 g002
Figure 3. This is a figure about annual patent data trends distinguished by patent types.
Sustainability 14 12352 g003
Figure 4. This is a figure about the relationship between the number of patent applications and human capital intensity distinguished by industries based on matched data.
Sustainability 14 12352 g004
Figure 5. This is a figure about the parallel trend test.
Sustainability 14 12352 g005
Table 1. Summary statistics of firms and patent characteristics based on the matched sample.
VariableMeanMin.P50Max.
Basic firm characteristics
Total assets75,489.45013,5241.72 × 108
Firm age11.2999617359
Number of employees248.96930100198,971
Output1,954,322019,6241.93 × 108
Innovation variables
Patent application0.3209843006122
Invention patent application0.099444005757
Granted patent0.2529065005487
Granted invention patent0.0478676004398
Patent citation0.035951900564.6
Table 2. Effects of increase in college-educated labor force on innovation behavior of firms.
(1)(2)(3)(4)(5)(6)(7)(8)
lpatent t + 1 lpatent t + 1 lpatent t + 1 lpatent t + 1 lpatent t + 1 lpatent t + 1 lpatent t + 1 lpatent t + 1
Industry HC intensity * Post030.203 ***0.192 ***0.069 **0.072 **
(0.021)(0.021)(0.030)(0.030)
Industry HC intensity*1999 −0.051 *−0.005−0.010−0.043
(0.028)(0.025)(0.026)(0.029)
Industry HC intensity*2000 −0.059 *−0.0060.010−0.047
(0.032)(0.031)(0.031)(0.031)
Industry HC intensity*2001 −0.0080.0510.027−0.036
(0.034)(0.038)(0.034)(0.030)
Industry HC intensity*2002 0.081 **0.142 ***0.108 ***0.075 **
(0.036)(0.042)(0.035)(0.029)
Industry HC intensity*2003 0.072 **0.113 **0.076 **0.067 **
(0.036)(0.053)(0.038)(0.026)
Industry HC intensity*2004 0.090 **0.129 **0.103 ***0.080 ***
(0.037)(0.055)(0.040)(0.025)
Industry HC intensity*2005 0.070 *0.109 *0.081 *0.060 **
(0.039)(0.056)(0.042)(0.025)
Industry HC intensity*2006 0.0570.096 *0.083 *0.047 *
(0.041)(0.058)(0.044)(0.025)
Industry HC intensity*2007 0.114 ***0.153 **0.173 ***0.100 ***
(0.044)(0.060)(0.047)(0.026)
Capital intensity*year indicators-YesYesYesYesYesYesYes
External finance*year indicators--YesYesYesYesYesYes
Contract enforcement*year indicators--YesYesYesYesYesYes
Province by year FE---YesYesYesYesYes
Linear industry trend-----Yes--
1995 industry lpatents*year dummy------Yes-
98-02 lpatents*year dummy-------Yes
Firm FEYesYesYesYesYesYesYesYes
Year FEYesYesYesYesYesYesYesYes
Observations1,327,9301,327,9301,327,9301,327,9301,327,9301,327,930859,9071,327,930
Note: Based on the matched samples, Columns (1)–(4) present the regression results of the benchmark regression model, Equation (1). Column (1) only controls the fixed effect of the firm and the year. Column (2) adds the interaction of capital intensity and year indicators. Column (3) adds external finance and contract enforcement multiplied by the year dummy. The province by year fixed effect is added in Column (4). Columns (5)–(8) estimate the dynamic regression Equation (2). Column (5) controls the baseline regression effect. Column (6) adds the linear enterprise trend to the baseline control. Column (7) adds the pre-sample patent trend to the baseline control. Column (8) adds pre-policy patent trends to baseline control. Robust standard errors in parentheses are clustered at the firm level. *** p < 0.01, ** p < 0.05, * p < 0.1.
Table 3. Robustness tests.
(1)(2)(3)(4)(5)(6)(7)(8)(9)(10)(11)
Excluding Computer IndustryExcluding Footwear IndustryInteraction of Export Industry with post03Control for 2-Digit
Industry Level Tariffs
Shock is Defined as the Increase in New College Graduates Relative to Labor ForceExcluding
Beijing and Shanghai
Subsample of
Entrants
Balanced Panel of Firms
Shock1Shock2
Above MedianBelow
Median
Above MedianBelow
Median
lpatent t + 1 lpatent t + 1 lpatent t + 1 lpatent t + 1 lpatent t + 1 lpatent t + 1 lpatent t + 1 lpatent t + 1 lpatent t + 1 lpatent t + 1 lpatent t + 1
Industry HC intensity*Post20030.072 **0.077 **0.073 **0.071 **0.124 **0.0500.155 ***0.0400.066 **0.110 *0.205 ***
(0.030)(0.030)(0.030)(0.031)(0.053)(0.042)(0.060)(0.040)(0.031)(0.063)(0.069)
Input tariff 0.000
(0.001)
Output tariff −0.000
(0.000)
Baseline controlsYesYesYesYesYesYesYesYesYesYesYes
Observations1,319,7721,307,7531,327,9301,243,698375,483673,936335,212714,2071,220,988422,906106,470
Note: Columns (1)–(4) test the robustness of the regression results based on the benchmark regression. Column (1) excludes the computer industry. Column (2) excludes the footwear industry. Column (3) considers the interaction between the export industry and the post03 dummy. Column (4) control the impact of tariffs on 2-digit industry level. Columns (5)–(8) remove the impact of macroeconomic policies on the regression results by redefining shocks. We redefine the shock as provincial college graduate growth rate during 2001 and 2003 over the 2001 labor force. Shock 1 equals to1 if the enterprises belong to the province that are on the top 50% our indicator. On this basis, we further define shock 2 to ensure its robustness by replacing the 2001 college graduate number of the province with the average of 2000 and 2001 (the same is true for the calculation of 2003), standardized with the average labor force from 2000 to 2001. Regression on shock subsamples of 1 and 0 are performed respectively. Columns (9)–(11) further divide the sample. Column (9) excludes the Beijing and Shanghai samples. Column (10) keeps the entry of new enterprises only, which refers to the samples whose establishment year and the year when they first appeared in the industrial enterprise database is within two years. Column (11) retains samples that survive the full window period. Robust standard errors in parentheses are clustered at the firm level. *** p < 0.01, ** p < 0.05, * p < 0.1. The regressions include the same control variables as in Column (4), Table 2.
Table 4. Heterogeneous analysis and potential mechanism.
(1)(2)(3)(4)(5)(6)(7)(8)(9)
Export_1Export_0K_intensityL_intensityAll FirmsR&D FirmsAll Firms
lpatent t + 1 lpatent _ i t + 1 lpatent t + 1 lpatent t + 1 lpatent t + 1 lpatent t + 1 linnovation linnovation patent i   stock
Panel A
Industry HC intensity * Post030.072 **0.109 ***0.406 ***0.0300.139 **0.048 0.056 ***
(0.030)(0.019)(0.097)(0.028)(0.068)(0.047) (0.016)
Panel B
Industry HC intensity*1999−0.051 *−0.036 ***
(0.028)(0.014)
Industry HC intensity*2000−0.059 *−0.038 **
(0.032)(0.016)
Industry HC intensity*2001−0.0080.010 0.955 ***0.839
(0.034)(0.019) (0.197)(0.836)
Industry HC intensity*20020.081 **0.089 *** 0.999 ***1.322 *
(0.036)(0.021) (0.187)(0.748)
Industry HC intensity*20030.072 **0.070 *** 1.241 ***1.586 ***
(0.036)(0.022) (0.150)(0.584)
Industry HC intensity*20040.090 **0.103 ***
(0.037)(0.024)
Industry HC intensity*20050.070 *0.142 *** 0.971 ***1.039 **
(0.039)(0.026) (0.105)(0.450)
Industry HC intensity*20060.0570.136 *** 0.936 ***0.657 *
(0.041)(0.027) (0.097)(0.386)
Industry HC intensity*20070.114 ***0.219 ***
(0.044)(0.029)
Baseline controlsYesYesYesYesYesYesYesYesYes
Observations1,327,9301,327,930383,955943,975456,776424,3681,331,863168,2971,327,708
Note: Columns (1) and (2) present the heterogeneity test for distinguishing patent types. Panel A estimates the benchmark regression Equation (1). Panel B estimates the dynamic regression Equation (2). Column (1) estimates total patent. Column (2) estimates invention patent only. Columns (3)–(6) present the heterogeneity test for distinguishing whether an export company or a capital-intensive company respectively. Column (7) reports the dynamic estimation results of human capital and innovation investment. The dependent variable is calculated as the logarithm of 1 plus the firm’s R&D investment. Column (8) selects subsamples of positive R&D investment for the dynamic regression test. Column (9) reports the regression result of the patent stock calculated based on Equation (3) as the dependent variable. Robust standard errors in parentheses are clustered at the firm level. *** p < 0.01, ** p < 0.05, * p < 0.1. The regressions include the same control variables as in Column (4), Table 2.
Table 5. Effects of agglomeration on corporate innovation.
(1)(2)(3)(4)(5)
Variables lpatent t + 1 lpatent t + 1 lpatent t + 1 lpatent t + 1 lpatent t + 1
Industry HC intensity * Post030.0067 *0.00060.00180.00520.0083
(0.004)(0.004)(0.005)(0.005)(0.005)
Industry HC intensity * Post03* Province-year Ratio of graduates to labor force 0.0201 ***
(0.007)
Industry HC intensity * Post03* Province-year Ratio of graduates in science and engineering to labor force 0.0205 **
(0.009)
Industry HC intensity * Post03* Province-year Ratio of graduates in economy, management and law to labor force 0.0102
(0.008)
Industry HC intensity * Post03* Province-year Ratio of graduates in other fields to labor force −0.0010
(0.009)
Capital intensity*year indicatorsYesYesYesYesYes
External finance*year indicatorsYesYesYesYesYes
Contract enforcement*year indicatorsYesYesYesYesYes
Province FEYesYesYesYesYes
Year FEYesYesYesYesYes
Observations1,327,9271,327,927708,261708,261708,261
Note: Columns (1) and (2) represent the results testing the effect of college enrollment expansion through agglomeration. The dependent variable in Columns (1)–(5) is the logarithm of patent application in t + 1 time. The number of total graduates and graduates in three fields and local labor is from Chinese Education Statistics Yearbooks and Provincial Statistics Yearbooks. However, there are eight provinces with totally missing data and six provinces and cities with partially missing data in division of graduates in S&E fields, EML fields, and other fields. These provinces and cities include both high-GDP provinces such as Zhejiang Province and low-GDP provinces such as Qinghai Province, so to some extent, the result would not be largely biased. Column (1) shows the basic relation between college enrollment expansion and patent application. Column (2) represents the result after adding the three interactions between IndustryHC_j\bullet Year_t and ratio of graduates to local labor. Columns (3)–(5) report the result in S&E fields, EML fields, and other fields. *** p < 0.01, ** p < 0.05, * p < 0.1.
Publisher’s Note: MDPI stays neutral with regard to jurisdictional claims in published maps and institutional affiliations.