
Does Human Capital Homogeneously Improve the Corporate Innovation: Evidence from China’s Higher Education Expansion in the Late 1990s

Abstract
:1. Introduction
2. Literature Review
2.1. Policy-Driven College Expansion
2.2. Skilled Human Capital and Innovation
3. Methodology
3.1. Identification Strategy
3.2. Data
3.3. Sample Construction
4. Model and Results
4.1. Setup
4.2. Estimation Results
4.2.1. Baseline Regression
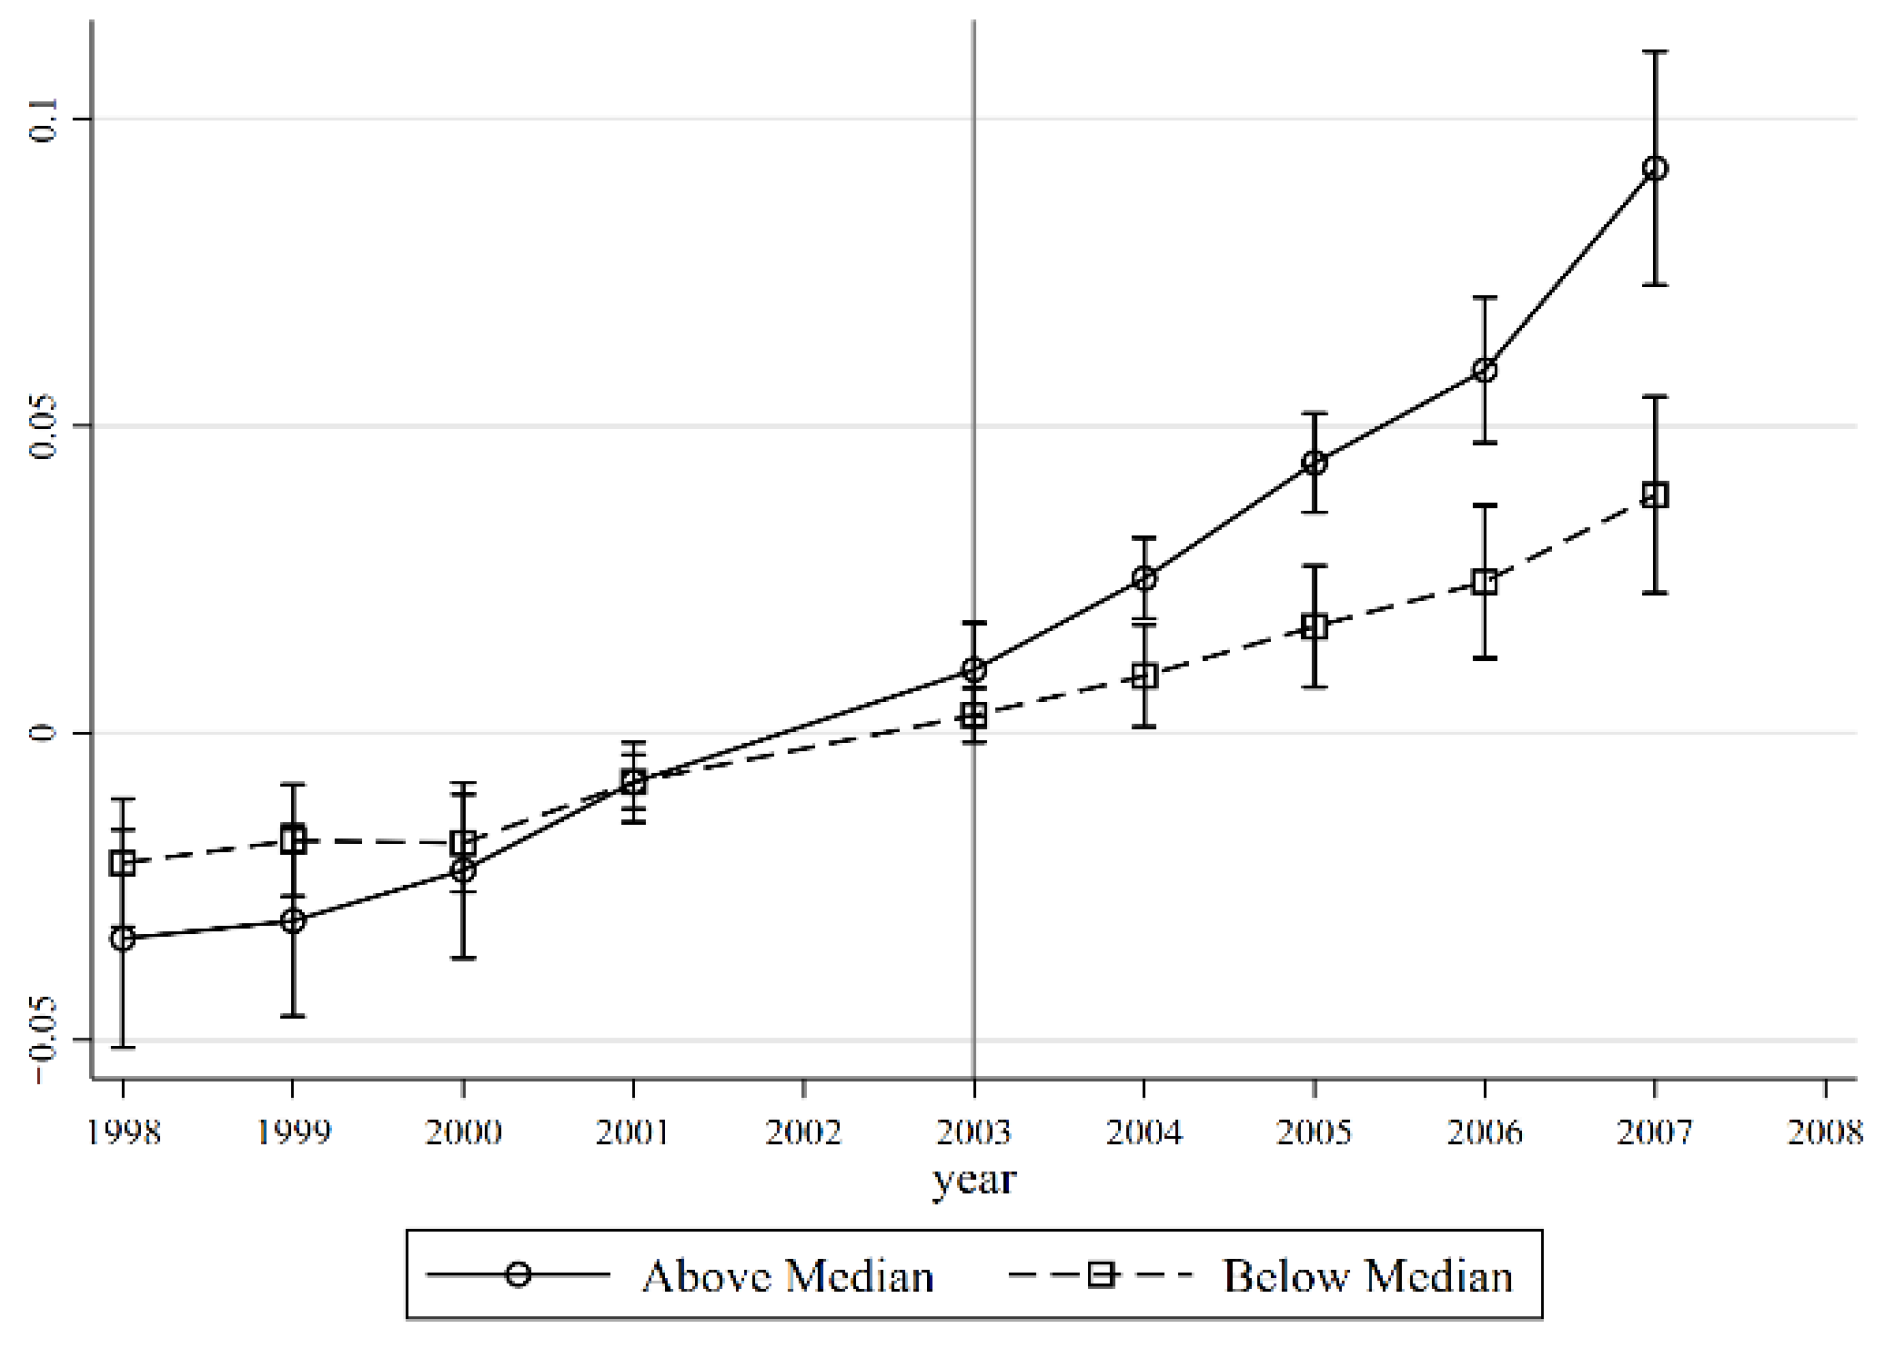
4.2.2. Dynamic Regression
4.3. Robustness Test
4.3.1. WTO Accession
4.3.2. Other Macroeconomic Shocks
4.3.3. Further Robustness Checks
4.4. Heterogeneous Analysis
4.4.1. Type of Patent Application
4.4.2. Export Companies and Non-Export Companies
4.4.3. Capital-Intensive and Labor-Intensive Industries
4.5. Potential Mechanisms
4.5.1. R&D Investment
4.5.2. Patent Stock
4.5.3. Agglomeration and Knowledge Spillover
5. Discussion
6. Conclusions
Author Contributions
Funding
Institutional Review Board Statement
Informed Consent Statement
Data Availability Statement
Conflicts of Interest
References
- Romer, P.M. Idea gaps and object gaps in economic development. J. Monet. Econ. 1993, 32, 543–573. [Google Scholar] [CrossRef]
- Romer, P.M. Endogenous technological change. J. Political Econ. 1990, 98, S71–S102. [Google Scholar] [CrossRef]
- Aghion, P.; Howitt, P. A model of growth through creative destruction. Econometrica 1992, 60, 323–351. [Google Scholar] [CrossRef]
- Acemoglue, D. Why do new technologies complement skills? Directed technical change and wage inequality. Q. J. Econ. 1998, 113, 1055–1089. [Google Scholar] [CrossRef]
- Aghion, P.; Howitt, P. Endogenous Growth Theory; MIT Press: Cambridge, MA, USA, 1998. [Google Scholar]
- Che, Y.; Zhang, L. Human capital, technology adoption and firm performance: Impacts of China’s higher education expansion in the late 1990s. Econ. J. 2018, 128, 2282–2320. [Google Scholar] [CrossRef]
- Andersson, R.; Quigley, J.M.; Wilhelmson, M. University decentralization as regional policy: The Swedish experiment. J. Econ. Geogr. 2004, 4, 371–388. [Google Scholar] [CrossRef]
- Andersson, R.; Quigley, J.M.; Wilhelmson, M. Urbanization, productivity, and innovation: Evidence from investment in higher education. J. Urban Econ. 2009, 66, 2–15. [Google Scholar] [CrossRef]
- Cowan, R.; Zinovyeva, N. University effects on regional innovation. Res. Policy 2013, 42, 788–800. [Google Scholar] [CrossRef]
- Hvide, H.K.; Jones, B.F. University innovation and the professor’s privilege. Am. Econ. Rev. 2018, 108, 1860–1898. [Google Scholar] [CrossRef]
- Li, S.; Whalley, J.; Xing, C. China’s higher education expansion and unemployment of college graduates. China Econ. Rev. 2014, 30, 567–582. [Google Scholar] [CrossRef]
- Li, H.; Ma, Y.; Meng, L.; Qiao, X.; Shi, X. Skill complementarities and returns to higher education: Evidence from college enrollment expansion in China. China Econ. Rev. 2017, 46, 10–26. [Google Scholar] [CrossRef]
- Kang, Y.; Liu, R. Does the merger of universities promote their scientific research performance? Evidence from China. Res. Policy 2021, 50, 104098. [Google Scholar] [CrossRef]
- Beaudry, P.; Doms, M.; Lewis, E. Should the personal computer be considered a technological revolution? Evidence from U.S. metropolitan areas. J. Political Econ. 2010, 118, 988–1036. [Google Scholar] [CrossRef]
- Bartelsman, E.; Dobbelaere, S.; Peters, B. Allocation of human capital and innovation at the frontier: Firm-level evidence on Germany and the Netherlands. Ind. Corp. Chang. 2014, 24, 875–949. [Google Scholar] [CrossRef]
- Lewis, E. Immigration and production technology. Annu. Rev. Econ. 2013, 5, 165–191. [Google Scholar] [CrossRef]
- Dustmann, C.; Glitz, A. How do industries and firms respond to changes in local labor supply? J. Labor Econ. 2015, 33, 711–750. [Google Scholar] [CrossRef]
- Ciccone, A.; Papaioannou, E. Human capital, the structure of production, and growth. Rev. Econ. Stat. 2009, 91, 66–82. [Google Scholar] [CrossRef]
- Rajan, R.G.; Zingales, L. Financial dependence and growth. Am. Econ. Rev. 1998, 88, 559–586. [Google Scholar]
- Nunn, N. Relationship-specificity, incomplete contracts, and the pattern of trade. Q. J. Econ. 2007, 122, 569–600. [Google Scholar] [CrossRef]
- Hornbeck, R. The enduring impact of the American dust bowl: Short- and long-run adjustments to environmental catastrophe. Am. Econ. Rev. 2012, 102, 1477–1507. [Google Scholar] [CrossRef]
- Brandt, L.; Van Biesebroech, J.; Zhang, Y. Creative accounting or creative destruction? Firm-level productivity growth in Chinese manufacturing. J. Dev. Econ. 2012, 97, 339–351. [Google Scholar] [CrossRef] [Green Version]
- Melitz, M.J. The impact of trade on intra-industry reallocations and aggregate industry productivity. Econometrica 2003, 71, 1695–1725. [Google Scholar] [CrossRef]
- Atkin, D.; Khandelwal, A.K.; Osman, A. Exporting and firm performance: Evidence from a randomized experiment. Q. J. Econ. 2017, 132, 551–615. [Google Scholar] [CrossRef]
- Hall, B.H.; Harhoff, D. Recent research on the economics of patents. Annu. Rev. Econ. 2012, 4, 541–565. [Google Scholar] [CrossRef]
- Fang, L.H.; Lerner, J.; Wu, C. Intellectual property rights protection, ownership, and innovation: Evidence from China. Rev. Financ. Stud. 2017, 30, 2446–2477. [Google Scholar] [CrossRef]
- Huang, Z.; Phillips, G.M.; Yang, J.; Zhang, Y. Education and Innovation: The Long Shadow of the Cultural Revolution; No. w27107; National Bureau of Economic Research: Cambridge, MA, USA, 2020. [Google Scholar]
- Ma, X. College Expansion, Trade and Innovation: Evidence from China; MPRA Paper 109469; University Library of Munich: Munich, Germany, 2022. [Google Scholar]
- Feng, S.; Xia, X. Endogenous skill-biased technology adoption: Evidence from China’s college enrollment expansion program. Hum. Cap. Econ. Oppor. Work. Group Work. Pap. 2018, 99, 1–52. [Google Scholar]
- Rong, Z.; Wu, B. Scientific personnel reallocation and firm innovation: Evidence from China’s college expansion. J. Comp. Econ. 2020, 48, 709–728. [Google Scholar] [CrossRef]


| Variable | Mean | Min. | P50 | Max. |
|---|---|---|---|---|
| Basic firm characteristics | ||||
| Total assets | 75,489.45 | 0 | 13,524 | 1.72 × 10⁸ |
| Firm age | 11.29996 | 1 | 7 | 359 |
| Number of employees | 248.9693 | 0 | 100 | 198,971 |
| Output | 1,954,322 | 0 | 19,624 | 1.93 × 10⁸ |
| Innovation variables | ||||
| Patent application | 0.3209843 | 0 | 0 | 6122 |
| Invention patent application | 0.099444 | 0 | 0 | 5757 |
| Granted patent | 0.2529065 | 0 | 0 | 5487 |
| Granted invention patent | 0.0478676 | 0 | 0 | 4398 |
| Patent citation | 0.0359519 | 0 | 0 | 564.6 |
| (1) | (2) | (3) | (4) | (5) | (6) | (7) | (8) | |
|---|---|---|---|---|---|---|---|---|
| Industry HC intensity * Post03 | 0.203 *** | 0.192 *** | 0.069 ** | 0.072 ** | ||||
| (0.021) | (0.021) | (0.030) | (0.030) | |||||
| Industry HC intensity*1999 | −0.051 * | −0.005 | −0.010 | −0.043 | ||||
| (0.028) | (0.025) | (0.026) | (0.029) | |||||
| Industry HC intensity*2000 | −0.059 * | −0.006 | 0.010 | −0.047 | ||||
| (0.032) | (0.031) | (0.031) | (0.031) | |||||
| Industry HC intensity*2001 | −0.008 | 0.051 | 0.027 | −0.036 | ||||
| (0.034) | (0.038) | (0.034) | (0.030) | |||||
| Industry HC intensity*2002 | 0.081 ** | 0.142 *** | 0.108 *** | 0.075 ** | ||||
| (0.036) | (0.042) | (0.035) | (0.029) | |||||
| Industry HC intensity*2003 | 0.072 ** | 0.113 ** | 0.076 ** | 0.067 ** | ||||
| (0.036) | (0.053) | (0.038) | (0.026) | |||||
| Industry HC intensity*2004 | 0.090 ** | 0.129 ** | 0.103 *** | 0.080 *** | ||||
| (0.037) | (0.055) | (0.040) | (0.025) | |||||
| Industry HC intensity*2005 | 0.070 * | 0.109 * | 0.081 * | 0.060 ** | ||||
| (0.039) | (0.056) | (0.042) | (0.025) | |||||
| Industry HC intensity*2006 | 0.057 | 0.096 * | 0.083 * | 0.047 * | ||||
| (0.041) | (0.058) | (0.044) | (0.025) | |||||
| Industry HC intensity*2007 | 0.114 *** | 0.153 ** | 0.173 *** | 0.100 *** | ||||
| (0.044) | (0.060) | (0.047) | (0.026) | |||||
| Capital intensity*year indicators | - | Yes | Yes | Yes | Yes | Yes | Yes | Yes |
| External finance*year indicators | - | - | Yes | Yes | Yes | Yes | Yes | Yes |
| Contract enforcement*year indicators | - | - | Yes | Yes | Yes | Yes | Yes | Yes |
| Province by year FE | - | - | - | Yes | Yes | Yes | Yes | Yes |
| Linear industry trend | - | - | - | - | - | Yes | - | - |
| 1995 industry lpatents*year dummy | - | - | - | - | - | - | Yes | - |
| 98-02 lpatents*year dummy | - | - | - | - | - | - | - | Yes |
| Firm FE | Yes | Yes | Yes | Yes | Yes | Yes | Yes | Yes |
| Year FE | Yes | Yes | Yes | Yes | Yes | Yes | Yes | Yes |
| Observations | 1,327,930 | 1,327,930 | 1,327,930 | 1,327,930 | 1,327,930 | 1,327,930 | 859,907 | 1,327,930 |
| (1) | (2) | (3) | (4) | (5) | (6) | (7) | (8) | (9) | (10) | (11) | |
|---|---|---|---|---|---|---|---|---|---|---|---|
| Excluding Computer Industry | Excluding Footwear Industry | Interaction of Export Industry with post03 | Control for 2-Digit Industry Level Tariffs | Shock is Defined as the Increase in New College Graduates Relative to Labor Force | Excluding Beijing and Shanghai | Subsample of Entrants | Balanced Panel of Firms | ||||
| Shock1 | Shock2 | ||||||||||
| Above Median | Below Median | Above Median | Below Median | ||||||||
| Industry HC intensity*Post2003 | 0.072 ** | 0.077 ** | 0.073 ** | 0.071 ** | 0.124 ** | 0.050 | 0.155 *** | 0.040 | 0.066 ** | 0.110 * | 0.205 *** |
| (0.030) | (0.030) | (0.030) | (0.031) | (0.053) | (0.042) | (0.060) | (0.040) | (0.031) | (0.063) | (0.069) | |
| Input tariff | 0.000 | ||||||||||
| (0.001) | |||||||||||
| Output tariff | −0.000 | ||||||||||
| (0.000) | |||||||||||
| Baseline controls | Yes | Yes | Yes | Yes | Yes | Yes | Yes | Yes | Yes | Yes | Yes |
| Observations | 1,319,772 | 1,307,753 | 1,327,930 | 1,243,698 | 375,483 | 673,936 | 335,212 | 714,207 | 1,220,988 | 422,906 | 106,470 |
| (1) | (2) | (3) | (4) | (5) | (6) | (7) | (8) | (9) | |
|---|---|---|---|---|---|---|---|---|---|
| Export_1 | Export_0 | K_intensity | L_intensity | All Firms | R&D Firms | All Firms | |||
| Panel A | |||||||||
| Industry HC intensity * Post03 | 0.072 ** | 0.109 *** | 0.406 *** | 0.030 | 0.139 ** | 0.048 | 0.056 *** | ||
| (0.030) | (0.019) | (0.097) | (0.028) | (0.068) | (0.047) | (0.016) | |||
| Panel B | |||||||||
| Industry HC intensity*1999 | −0.051 * | −0.036 *** | |||||||
| (0.028) | (0.014) | ||||||||
| Industry HC intensity*2000 | −0.059 * | −0.038 ** | |||||||
| (0.032) | (0.016) | ||||||||
| Industry HC intensity*2001 | −0.008 | 0.010 | 0.955 *** | 0.839 | |||||
| (0.034) | (0.019) | (0.197) | (0.836) | ||||||
| Industry HC intensity*2002 | 0.081 ** | 0.089 *** | 0.999 *** | 1.322 * | |||||
| (0.036) | (0.021) | (0.187) | (0.748) | ||||||
| Industry HC intensity*2003 | 0.072 ** | 0.070 *** | 1.241 *** | 1.586 *** | |||||
| (0.036) | (0.022) | (0.150) | (0.584) | ||||||
| Industry HC intensity*2004 | 0.090 ** | 0.103 *** | |||||||
| (0.037) | (0.024) | ||||||||
| Industry HC intensity*2005 | 0.070 * | 0.142 *** | 0.971 *** | 1.039 ** | |||||
| (0.039) | (0.026) | (0.105) | (0.450) | ||||||
| Industry HC intensity*2006 | 0.057 | 0.136 *** | 0.936 *** | 0.657 * | |||||
| (0.041) | (0.027) | (0.097) | (0.386) | ||||||
| Industry HC intensity*2007 | 0.114 *** | 0.219 *** | |||||||
| (0.044) | (0.029) | ||||||||
| Baseline controls | Yes | Yes | Yes | Yes | Yes | Yes | Yes | Yes | Yes |
| Observations | 1,327,930 | 1,327,930 | 383,955 | 943,975 | 456,776 | 424,368 | 1,331,863 | 168,297 | 1,327,708 |
| (1) | (2) | (3) | (4) | (5) | |
|---|---|---|---|---|---|
| Variables | |||||
| Industry HC intensity * Post03 | 0.0067 * | 0.0006 | 0.0018 | 0.0052 | 0.0083 |
| (0.004) | (0.004) | (0.005) | (0.005) | (0.005) | |
| Industry HC intensity * Post03* Province-year Ratio of graduates to labor force | 0.0201 *** | ||||
| (0.007) | |||||
| Industry HC intensity * Post03* Province-year Ratio of graduates in science and engineering to labor force | 0.0205 ** | ||||
| (0.009) | |||||
| Industry HC intensity * Post03* Province-year Ratio of graduates in economy, management and law to labor force | 0.0102 | ||||
| (0.008) | |||||
| Industry HC intensity * Post03* Province-year Ratio of graduates in other fields to labor force | −0.0010 | ||||
| (0.009) | |||||
| Capital intensity*year indicators | Yes | Yes | Yes | Yes | Yes |
| External finance*year indicators | Yes | Yes | Yes | Yes | Yes |
| Contract enforcement*year indicators | Yes | Yes | Yes | Yes | Yes |
| Province FE | Yes | Yes | Yes | Yes | Yes |
| Year FE | Yes | Yes | Yes | Yes | Yes |
| Observations | 1,327,927 | 1,327,927 | 708,261 | 708,261 | 708,261 |
Publisher’s Note: MDPI stays neutral with regard to jurisdictional claims in published maps and institutional affiliations. |
© 2022 by the authors. Licensee MDPI, Basel, Switzerland. This article is an open access article distributed under the terms and conditions of the Creative Commons Attribution (CC BY) license (https://creativecommons.org/licenses/by/4.0/).
Share and Cite
Kang, M.; Li, Y.; Zhao, Z.; Zheng, M.; Wu, H. Does Human Capital Homogeneously Improve the Corporate Innovation: Evidence from China’s Higher Education Expansion in the Late 1990s. Sustainability 2022, 14, 12352. https://doi.org/10.3390/su141912352
Kang M, Li Y, Zhao Z, Zheng M, Wu H. Does Human Capital Homogeneously Improve the Corporate Innovation: Evidence from China’s Higher Education Expansion in the Late 1990s. Sustainability. 2022; 14(19):12352. https://doi.org/10.3390/su141912352
Chicago/Turabian StyleKang, Meiling, Yucheng Li, Zhongkuang Zhao, Minjuan Zheng, and Han Wu. 2022. "Does Human Capital Homogeneously Improve the Corporate Innovation: Evidence from China’s Higher Education Expansion in the Late 1990s" Sustainability 14, no. 19: 12352. https://doi.org/10.3390/su141912352