Article

Simulation and Evaluation of Rainwater Runoff Control, Collection, and Utilization for Sponge City Reconstruction in an Urban Residential Community

1
Faculty of Architecture, Civil and Transportation Engineering, Beijing University of Technology, Beijing 100124, China
2
Guangzhou Municipal Engineering Design & Research Institute Co., Ltd., Guangzhou 510095, China
3
Guangdong AIKE Environmental Science and Technology Co., Ltd., Zhongshan 528400, China
4
Beijing Municipal Institute of City Planning and Design, Beijing 100045, China
*
Author to whom correspondence should be addressed.
Sustainability 2022, 14(19), 12372; https://doi.org/10.3390/su141912372
Submission received: 23 August 2022 / Revised: 20 September 2022 / Accepted: 23 September 2022 / Published: 28 September 2022

Abstract

:
Residential areas are important for the underlying surface of a city, and the sponge construction of a residential area is a key topic in sponge city construction. Taking the Zi-Jing community as the research case, the SWMM model was established for simulation, and the rainwater runoff control, collection, and utilization were compared and analyzed before and after the implementation of sponge transformation for the designed rainfall conditions of once in 3, 5, 10, 20, and 50 years. The results showed that the water depth of the four outlet pipes was not a full tube at the first peak time. The full duration time was reduced to 1–5 h at the second peak, and the flow reduction rate at the pipe outlet was between 30% and 100%. The water storage of sub-catchments A1, A3, and A4 increased significantly and continued to increase after the peak rainfall occurred, while that of A2 decreased significantly after the transformation after the transformation. For the whole residential area, the surface runoff decreased by 37–47%, while the surface water storage and infiltration increased by 8–14% and 23–39% respectively after reconstruction. The direct storage volume of rainwater in the four sub-catchment areas was filled at least once above a once in 5 years scenario. The main conclusions were as follows: Sponge transformation in residential areas with 17.46% sunken greenbelt and 40.85% permeable pavement, and the time of the pipe outlet in full status can be shortened by 30–200 min in different rainfall return periods. With the increase in the rainfall return period, the improvement range of the infiltration increased from 23.36% to 39.54%, the improvement range of the storage capacity for rainwater decreased from 14.36% to 8.06%, and the reduction degree of surface runoff increased from 37.73% to 47.43%. The water consumption for flushing is about 30 m3 per day for 1000 people, and the rainwater storage volume of 765 m3 in this study can meet the flushing water demand of 5000 residents in the community for 3–5 days.

1. Introduction

Since the 1990s, China’s urbanized water problems have become serious and complex, with prominent manifestations in water shortages, frequent urban floods, serious water pollution, and serious water ecological damage [1]. The structures of the urban underlying surfaces and the interference of artificial activities have changed the hydrological cycle process of the urban surfaces. Specifically, the surface production and confluence coefficients have increased, the peak value of the rainwater runoff has increased, and the peak time of rainwater flooding has advanced [2]. On the other hand, climate change changes the frequency and intensity of rainfall in cities, increasing the risk of rainstorm and flood disasters in cities [3] Research on the influence of climate change on urban rainfall characteristics and flood disasters has become a hot topic in urban hydrology research [4,5]. Especially in the past 10 years, with the influence of climate change, extreme rainstorms have occurred frequently in cities, such as the “7.21” heavy rain in Beijing in 2012 and the “7.20” heavy rain in Zhengzhou in 2021. These extreme rainstorms have caused huge casualties and property damage in cities [6]. However, urban water resources are in serious shortage [7]. Taking Beijing as an example, the per capita water resources in Beijing are only 150 m3, which is far lower than the international warning line of extreme water shortage of 500 m3, and it is only 1/8 of the national per capita water resources and 1/32 of the world’s per capita water resources [8]. After the water supply at the end of 2014, the South-to-North Water Diversion Project supplied a total of 7.5 billion m3 of water to Beijing, and the average annual water supply in recent years has been 1.4 billion m3. The same city faces both severe floods and severe water shortages as well as serious water pollution, water environment damage, and water ecological damage [9,10]. To solve the urban comprehensive water problem, the management of rainfall is the key point, and managing the urban rainwater is a dual-effect measure for solving urban flood disasters and water shortages [11,12].
In order to alleviate and govern the increasingly severe urban water problem, the Chinese government proposed the sponge city construction strategy at the end of 2013 [13]. Sponge city refers to a city that, like a sponge, has good resilience in adapting to environmental changes and coping with natural disasters. The international general term is “construction of low-impact development rainwater system”. When precipitation happens, it absorbs water, stores water, seeps water and purges water. When it is needed, the stored water will be released and utilized to realize the free migration of rainwater in the city [14]. In 2015, the first batch of 16 sponge city pilot constructions began. In 2016, the second batch of 14 sponge city pilot constructions was approved [13]. In 2021, the Ministry of Housing and Urban-Rural Development, Ministry of Finance, and Ministry of Water Resources jointly issued the notice to carry out the Systematic and Comprehensive Sponge City Construction Demonstration Work during the 14th Five-Year Plan Period. Sponge city construction is a new concept for urban stormwater management that can effectively relieve urban flooding and promote the usage of rainwater resources [15]. Improving urban rainwater management infrastructure is an important part of sponge city construction [11], and the construction of sponge cities is of great strategic significance for solving the urban water resource problem in the future [16]. The construction and renovation of a sponge city in residential quarters is an important measure for sponge city construction. Residential quarters are an important part of the underlying surface of a city, and residential land usually accounts for 40–50% of the total urban construction land area [17]. The ability of a residential area to resist floods and waterlogging disasters is an important guarantee of the safety of residents’ lives and properties [18]. Carrying out a comparative analysis of the rainwater runoff control, collection, and utilization before and after the construction and renovation of the sponge in a residential area has an important supporting role in the evaluation of the effect and benefit of the sponge renovation in the residential area and the construction of the sponge city [19,20].
There have been many studies on sponge city construction in residential districts. Hou [21] proposed a refined simulation method for the rainfall–runoff process in a residential community that could reflect the physical process and quantify the effects of LID (Low Impact Development) measures. LID is a rainstorm management and non-point source pollution treatment technology developed in the late 1990s, which aims to control the runoff and pollution caused by rainstorm through decentralized and small-scale source control, and make the development area as close as possible to the natural hydrological cycle [22]. Lin [23] showed that the building of sponge city facilities in target residential communities in Shanghai could equal the total quantity of carbon emissions for 18.8 years in the future. The Curve Number (CN) method was used to determine the maximum potential of rainwater harvesting (surface runoff), and water cycle management (WCM) was established for the sustainable exploitation of groundwater for sponge city construction [24]. For permeable pavement, permeable bricks can effectively improve the sustainability performance in sponge city construction more than cement pavement [25]. Seven renovation scenarios (green roof, rain garden, permeable pavement, green roof and permeable pavement, rain garden and permeable pavement, green roof and rain garden, green roof and rain garden, and permeable pavement) were set for simulating the possible effects of sponge city construction in a city based on SWMM, and the simulated results showed that the potentially available amount of rainwater resources in the main urban area of Xi’an was close to the annual public water consumption [26]. Scholars have studied the effect of stormwater runoff control and rainwater utilization after sponge transformation in residential areas through simulation modeling or statistical analysis; these studies are mostly carried out with a single LID or sponge city measure, and they are mainly aimed at the result after reconstruction. The existing research on the combination of various low-impact development measures and the comparison of effect on rainwater control and utilization before and after sponge community reconstruction is insufficient.
The main measures of residential area sponge transformation include rain gardens, roof greening, sunken green spaces, permeable road surfaces, seepage wells, biological retention pools, constructed wetlands, planting ditches, rain tanks, storage modules, and drainage system transformation. Among these measures, permeable pavement has the highest application proportion, being used by 100% of the projects, followed by rain gardens, green roofs, grass ditches, and rainwater collection ponds, which account for 97.9%, 79.4%, 8.2%, and 14.4%, respectively. Related studies have shown that single-sponge measures and different combinations of sponge measures can achieve the purpose of reducing the flood peak discharge, the lag peak occurrence time, and the total runoff. However, there is a lack of comparative analysis and research on rainwater runoff control, flow reduction, and rainwater storage before and after residential area sponge transformation. What are the changes in the rainwater management and resources situation before and after sponge city construction in a region? This is the scientific basis for quantifying the hydrological effect of sponge reconstruction in a residential area.
The research gap is the comparative study on rainwater runoff reduction, rainwater storage, rainwater collection and utilization before and after residential area sponge renovation. Taking the Zi-Jing community as a study case, this research established the SWMM model before and after sponge transformation in the community, simulated rainfall production and the confluence process for a typical designed rainfall scenario, analyzed rainwater runoff reduction and rainwater storage capacity of catchment units in the community for different rainfall return periods, and analyzed the stormwater runoff reduction, stormwater storage, rainwater collection and utilization capacity. This was completed in order to provide technical support and a scientific basis for urban residential area sponge transformation.

2. Materials and Methods

2.1. Research Method Flow
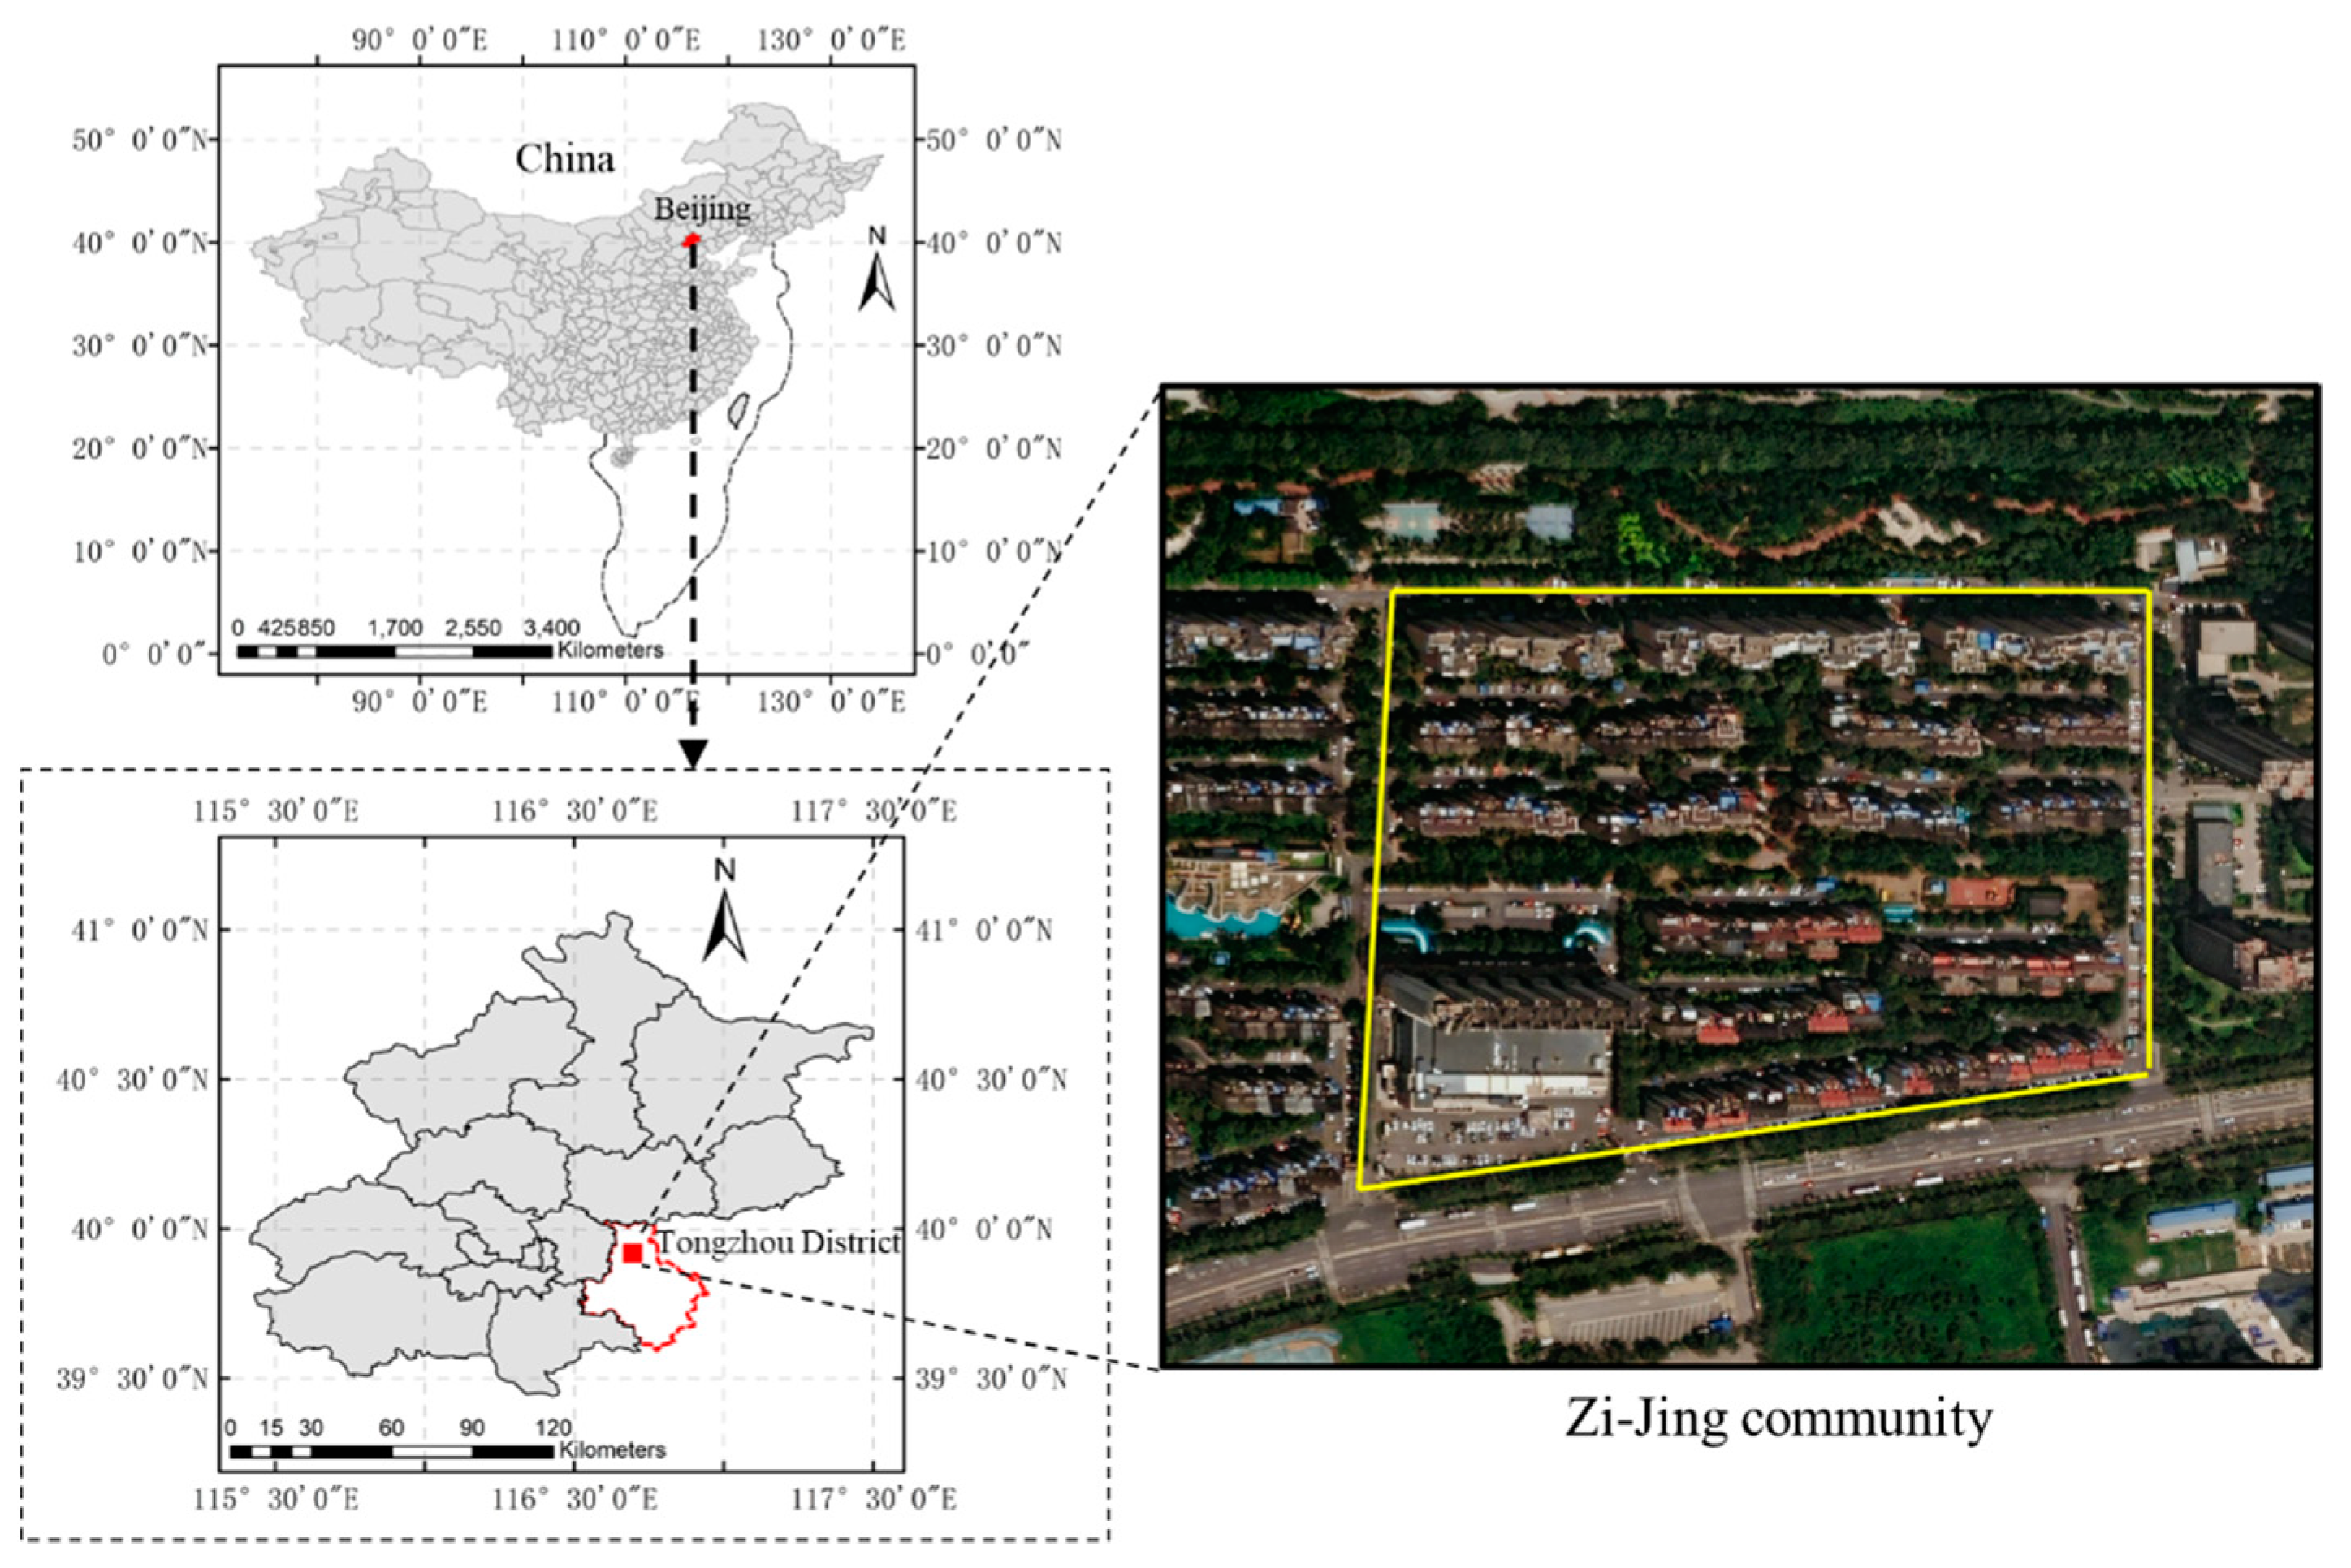
On the basis of determining the research topic and selecting the research area, the network data and rainfall data of the research area before and after the reconstruction were collected, and the SWMM models before and after the reconstruction were established, respectively. The model parameters were calibrated before and after the reconstruction, and the simulation and analysis scenarios were set based on the research topic. Then, we ran a simulation and analysed the effects of residential unit sponge transformation was carried on rainwater runoff control, rainwater storage, rainwater collection and utilization under different scenarios. The “B” in the method flow represents before the transformation, and the “A “represents after the transformation. Figure 1 shows the method flow.

2.2. Research Area

The Zi-Jing community, located in the Tongzhou District, which is one of the first batches of sponge city pilot areas to implement sponge city transformation in Beijing. It is located between Baolong Road in the north, Tonghu Road in the south, the Rose Garden in the east, and the Peony Garden in the west. Figure 2 shows the location of the Zi-Jing community in the yellow frame, which is the research area.
Beijing has a semi-humid and semi-arid monsoon climate in the warm temperate zone. It is hot and rainy in summer, and it is cold and dry in winter. The annual frost-free period is 180–200 days, and the western mountainous area has a shorter period. Figure 3 shows the annual and flood season rainfall in Beijing from 2011 to 2020. The annual average rainfall from 2011 to 2020 is 569 mm, of which the annual average rainfall in the flood season (from June to September) is 453 mm, accounting for 79.68% of the total on average, and the rainfall exceeds 90% of the annual rainfall in the flood season in some years. The seasonal distribution of precipitation is uneven, and heavy rain usually occurs in July and August.
The Zi-Jing community consists of residential land covering an area of 118,000 m2. Before the transformation, the greening rate of the community was 30.4%, the hardened ground area rate was 48.0%, the building density was 21.6%, the community had no sunken green space, and the hardened ground was all impervious. After transformation, 57% of the green land was converted to sunken greenbelt, and 85% of the hardened ground was changed to permeable hardened ground. The roofs of the buildings were not transformed with the sponge transformation, and a new reservoir was built with a total volume of 765 m3. The underlying surface statistics of the Zi-Jing community for the sponge residential area before and after reconstruction are shown in Table 1.

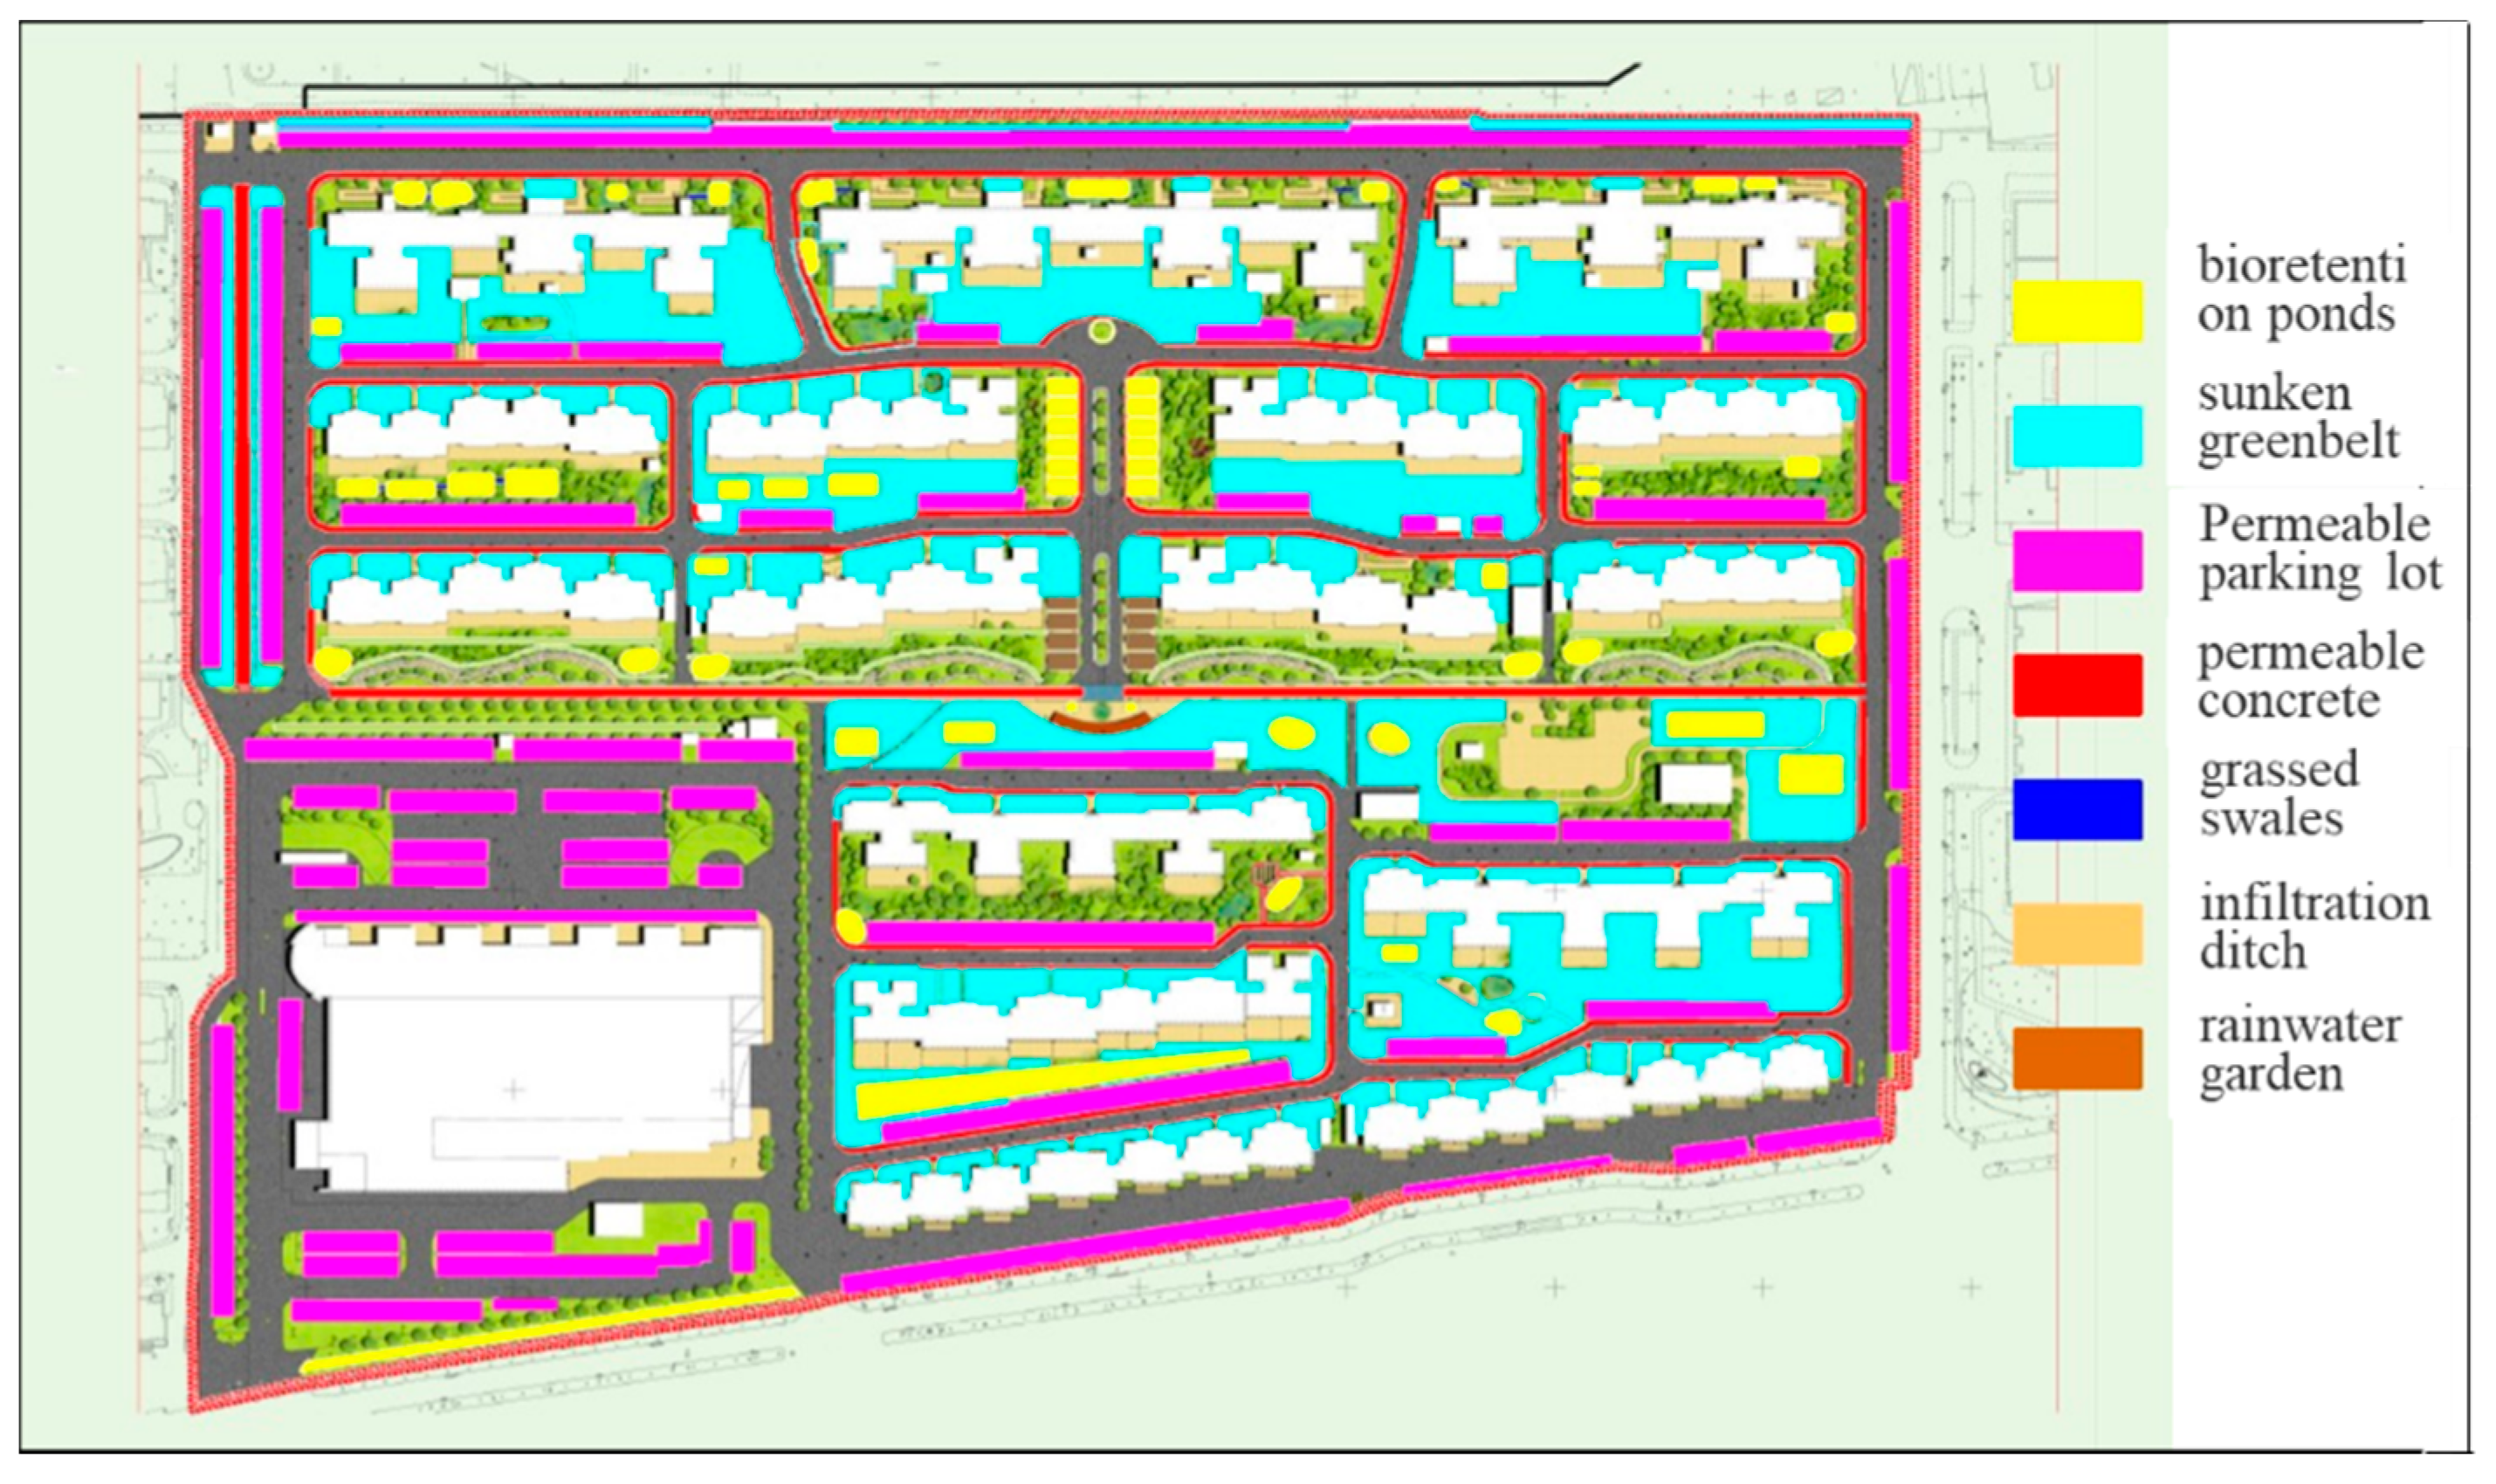
2.3. Sponge Community Reconstruction Measures

The LID facilities adopted in the reconstruction of the sponge community for the Zi-Jing community include a rain garden (biological retention facility), sunken green space, a permeable parking lot, permeable concrete, a grass planting ditch, and a seepage ditch. Figure 4 shows the spatial distribution of each measure. The reconstruction of the sponge residential area was mainly the reconstruction of the pervious pavement of the hardened ground, including the reconstruction of the pervious parking lot and pervious concrete, which are both counted as pervious pavement in Table 1. The green land was transformed into a sunken greenbelt, grass swales, an infiltration ditch, and a rainwater garden, which are all counted as sunken greenbelt transformations in Table 1. The building roofing was not modified with sponge measures.

2.4. Simulation Model and Methods
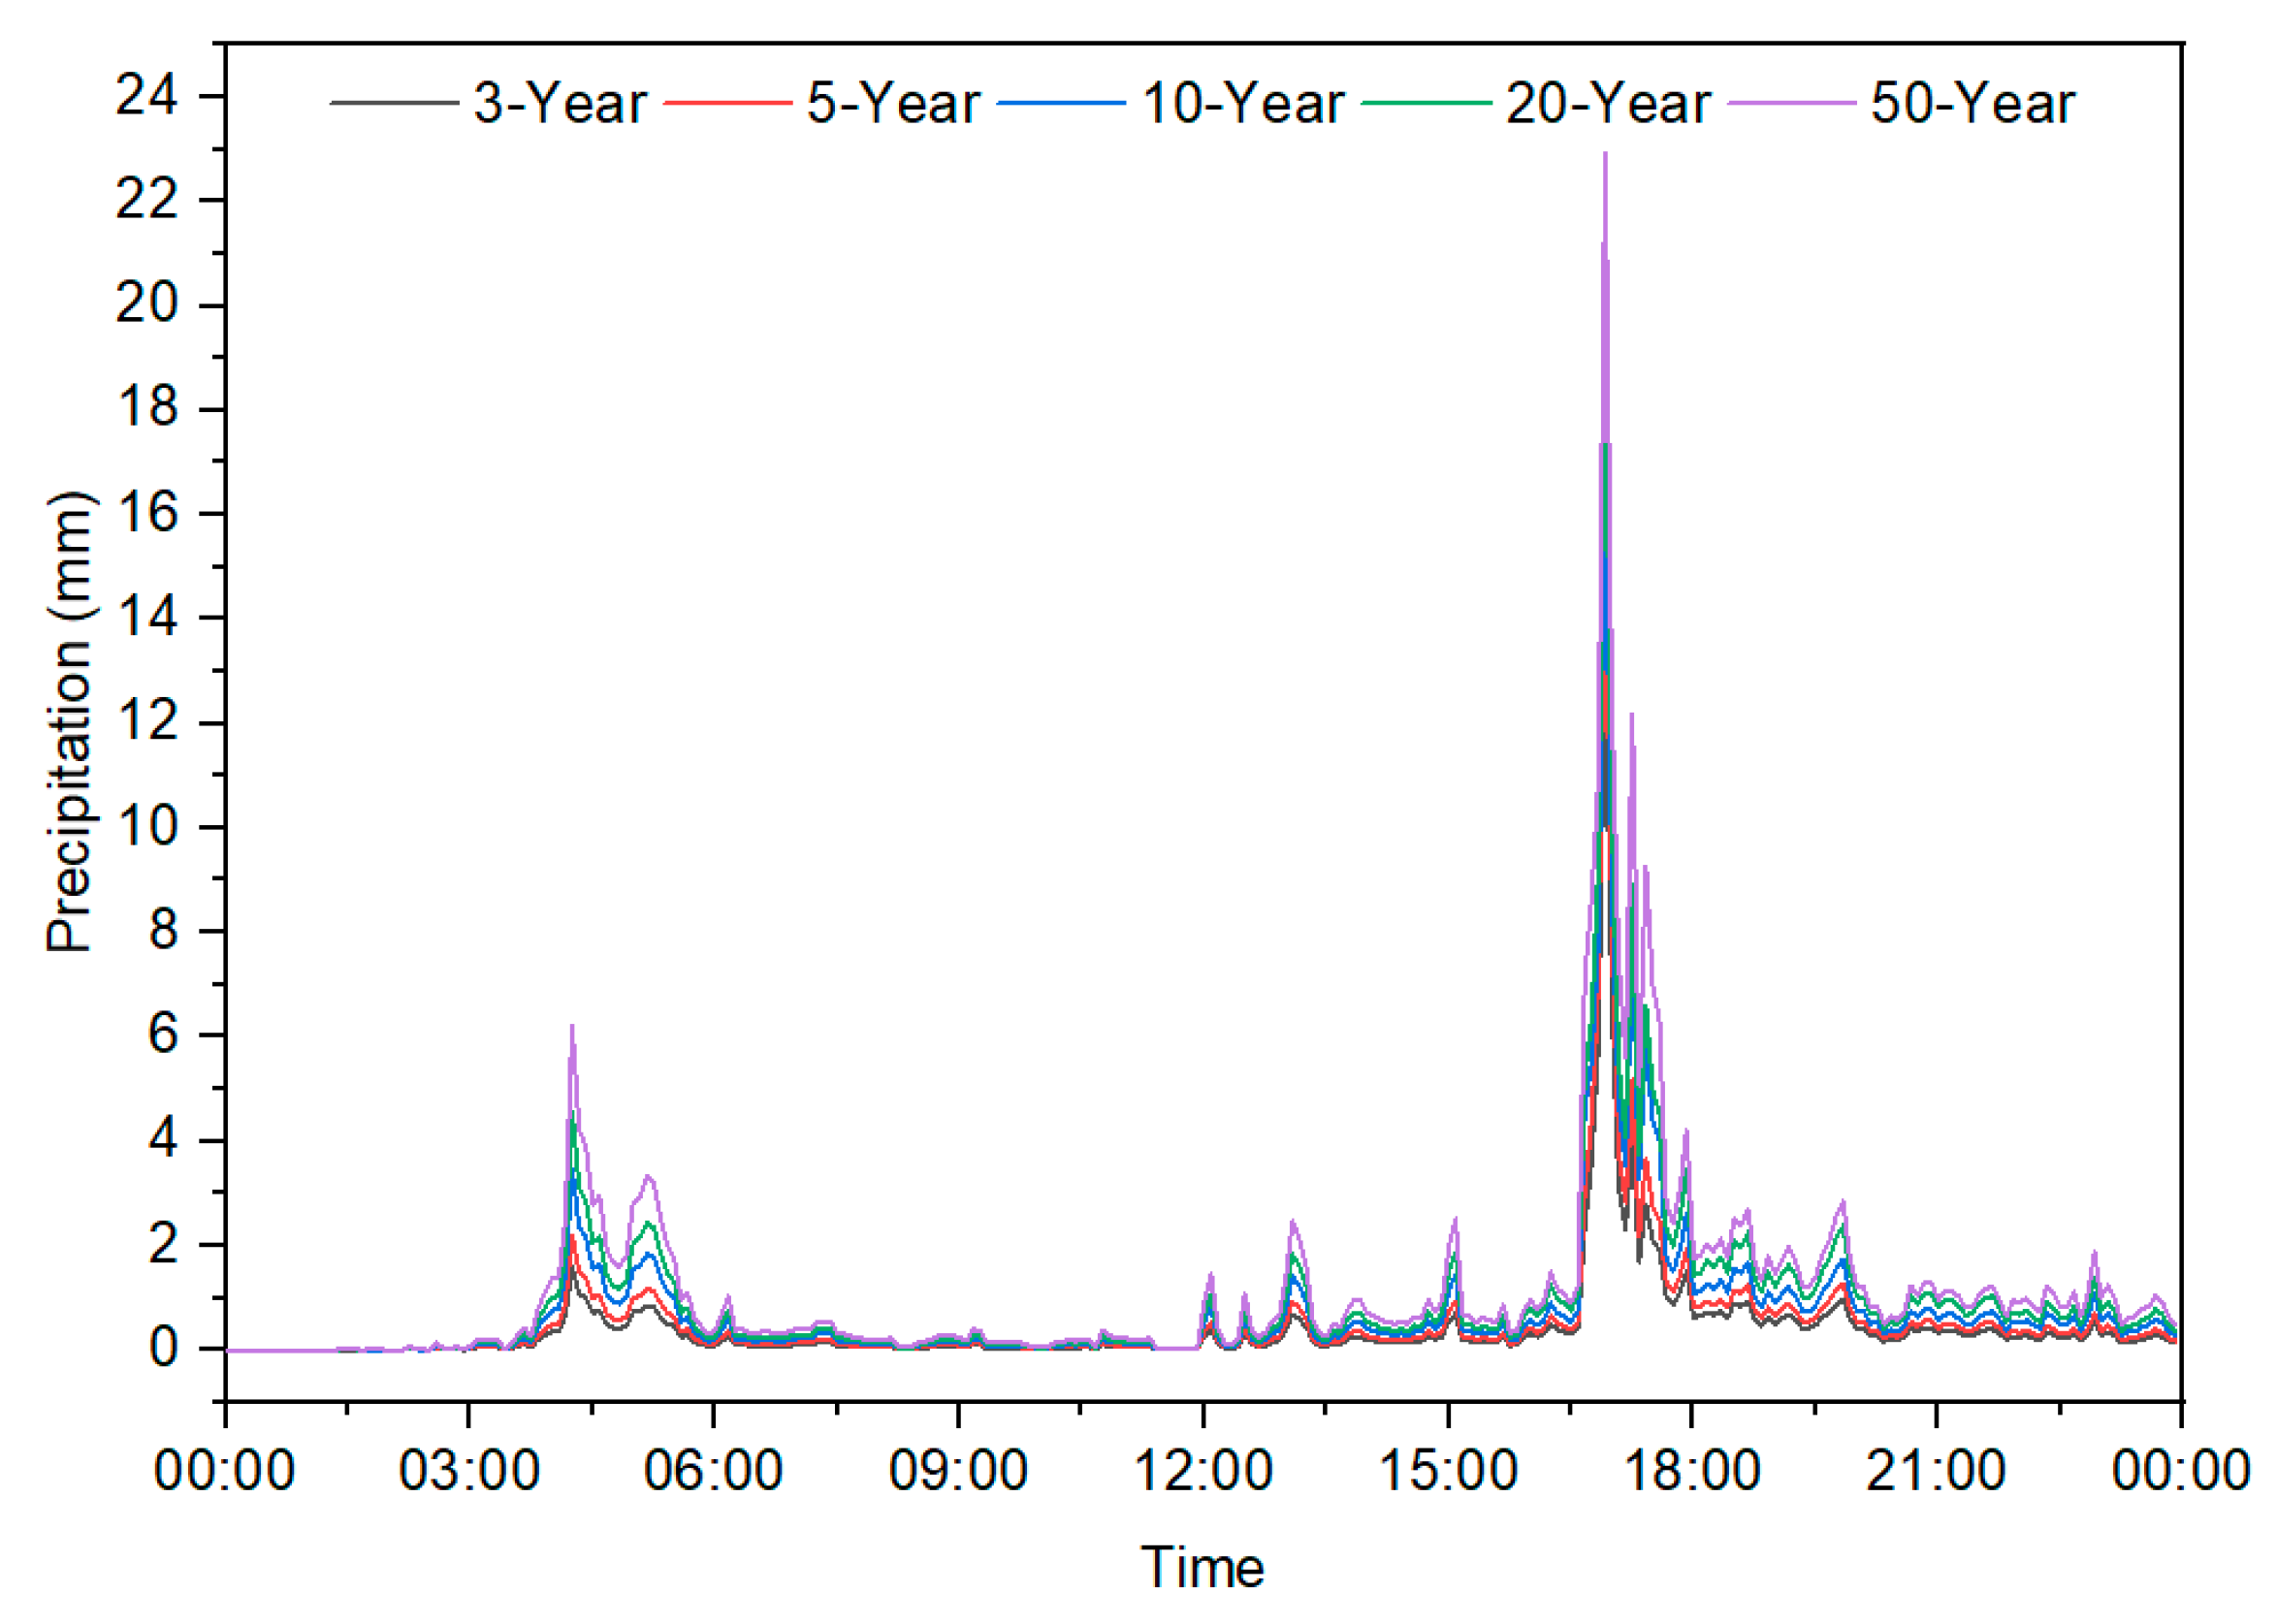
SWMM is a free open stormwater management model developed by the Environmental Protection Agency (EPA) in the USA. SWMM is a dynamic precipitation and runoff simulation model, which is mainly used to simulate a single precipitation event or long-term water and water quality simulation in urban area, and it is characterized by open source code, simple operation, and fast simulation speed [27]. SWMM has been widely used in small-area, multi-feature urban area research due to its advantages of low cost, small size, fast speed, simple operation, being easy to master, and secondary development [28]. The SWMM core is a typical unsteady flow model that includes dynamic rainfall and runoff calculation modules that can simulate the water quantity and water quality of urban rainfall and runoff processes instantaneously or continuously in a specified period of time [29]. LID facilities or sponge measures such as biological retention ponds, permeable pavement, rain gardens, and sunken green space can be set up in the model, which is very important for the comparative analysis of hydrological process changes and the study of rainwater collection and utilization before and after sponge city reconstruction. Additionally, the model can finely simulate the change process after the addition of LID measures. Because the study area was a residential area that was categorized as a small-scale urban rain flood simulation, and the main simulation content was a hydrological process and a hydraulic process with complete basic data and detailed data, the SWMM model was used for modeling and simulation in this study.
SWMM provides three options for the infiltration equation: the Horton equation, the Green–AMPT method, and the SCS-CNO method [28]. Among these options, Horton’s infiltration formula is an empirical formula for calculating the infiltration curve, which was established by R.E. Horton in 1933 on the basis of a large number of soil infiltration experiments [30]. Its form is: F = F C + ( F 0 F C ) e kt , where F C is infiltration rate, F 0 is initial infiltration rate, t is time, and κ is an empirical constant related to soil properties. Houghton’s infiltration formula is widely used because its parameters have wide flexibility and can generally cooperate well with the actual observation data [31]. The input parameters required for this method include the maximum and minimum infiltration rates, attenuation coefficients that describe how the rates decline over time, and the time required for the fully saturated soil to be completely drained. The Green–Ampt method simulates infiltration and assumes that there is a sharp wet front in the main body of the soil, and the method separates the soil with some initial moisture content from the upper saturated soil, which requires a large quantity of soil data. The SCS-CNO model is usually suitable for a watershed larger than 50 km2. In this study, the Horton equation is used to simulate infiltration.
For the sub-catchment area demarcating method, according to the direction of the rainwater gravity flow, the rainwater on a roof is discharged into green space or pavement through a rainfall pipe, and the rainwater on the green space or pavement is diffused and discharged onto a road surface and then into rainwater pipe. The roof sub-catchment area is delimited according to the range of the rainfall pipe water collection, the road face sub-catchment area is delimited according to the vertical elevation of the road combined with the rain grate distribution, and the green land and pavement sub-catchment area is delimited according to the vertical elevation.

2.5. Rainfall Data

Rainfall is a decisive factor affecting the control and utilization of rainwater, and rainfall data are the basis for determining rainwater source control objectives [32]. The simulation results are shown during the designed rainfall scenarios of the recurrence period that occurred once in 3 years, once in 5 years, once in 10 years, once in 20 years, and once in 50 years. Analysis was carried out mainly based on the three aspects of the surface runoff reduction rate, rainwater storage rate, and rainwater collection and utilization rate.
For the rainfall, the 24 h rain pattern of the rainstorm intensity formula method in DB11/T969-2016, the standard for Calculating Storm Runoff in Urban Rainwater System Planning and Design, was adopted, and the recurrence periods were once in 3 years, once in 5 years, once in 10 years, once in 20 years and once in 50 years. The corresponding rainfall amounts were 116.36 mm, 150.58 mm, 208.70 mm, 264.64 mm, and 339 mm, respectively. The design rainfall was characterized by bimodal rain, with small front and large rear peaks. The designed rainfall process for each return period is shown in Figure 5. The rainfall interval was 5 min, and the rainfall unit was mm.

3. Model Building and Parameter Selection

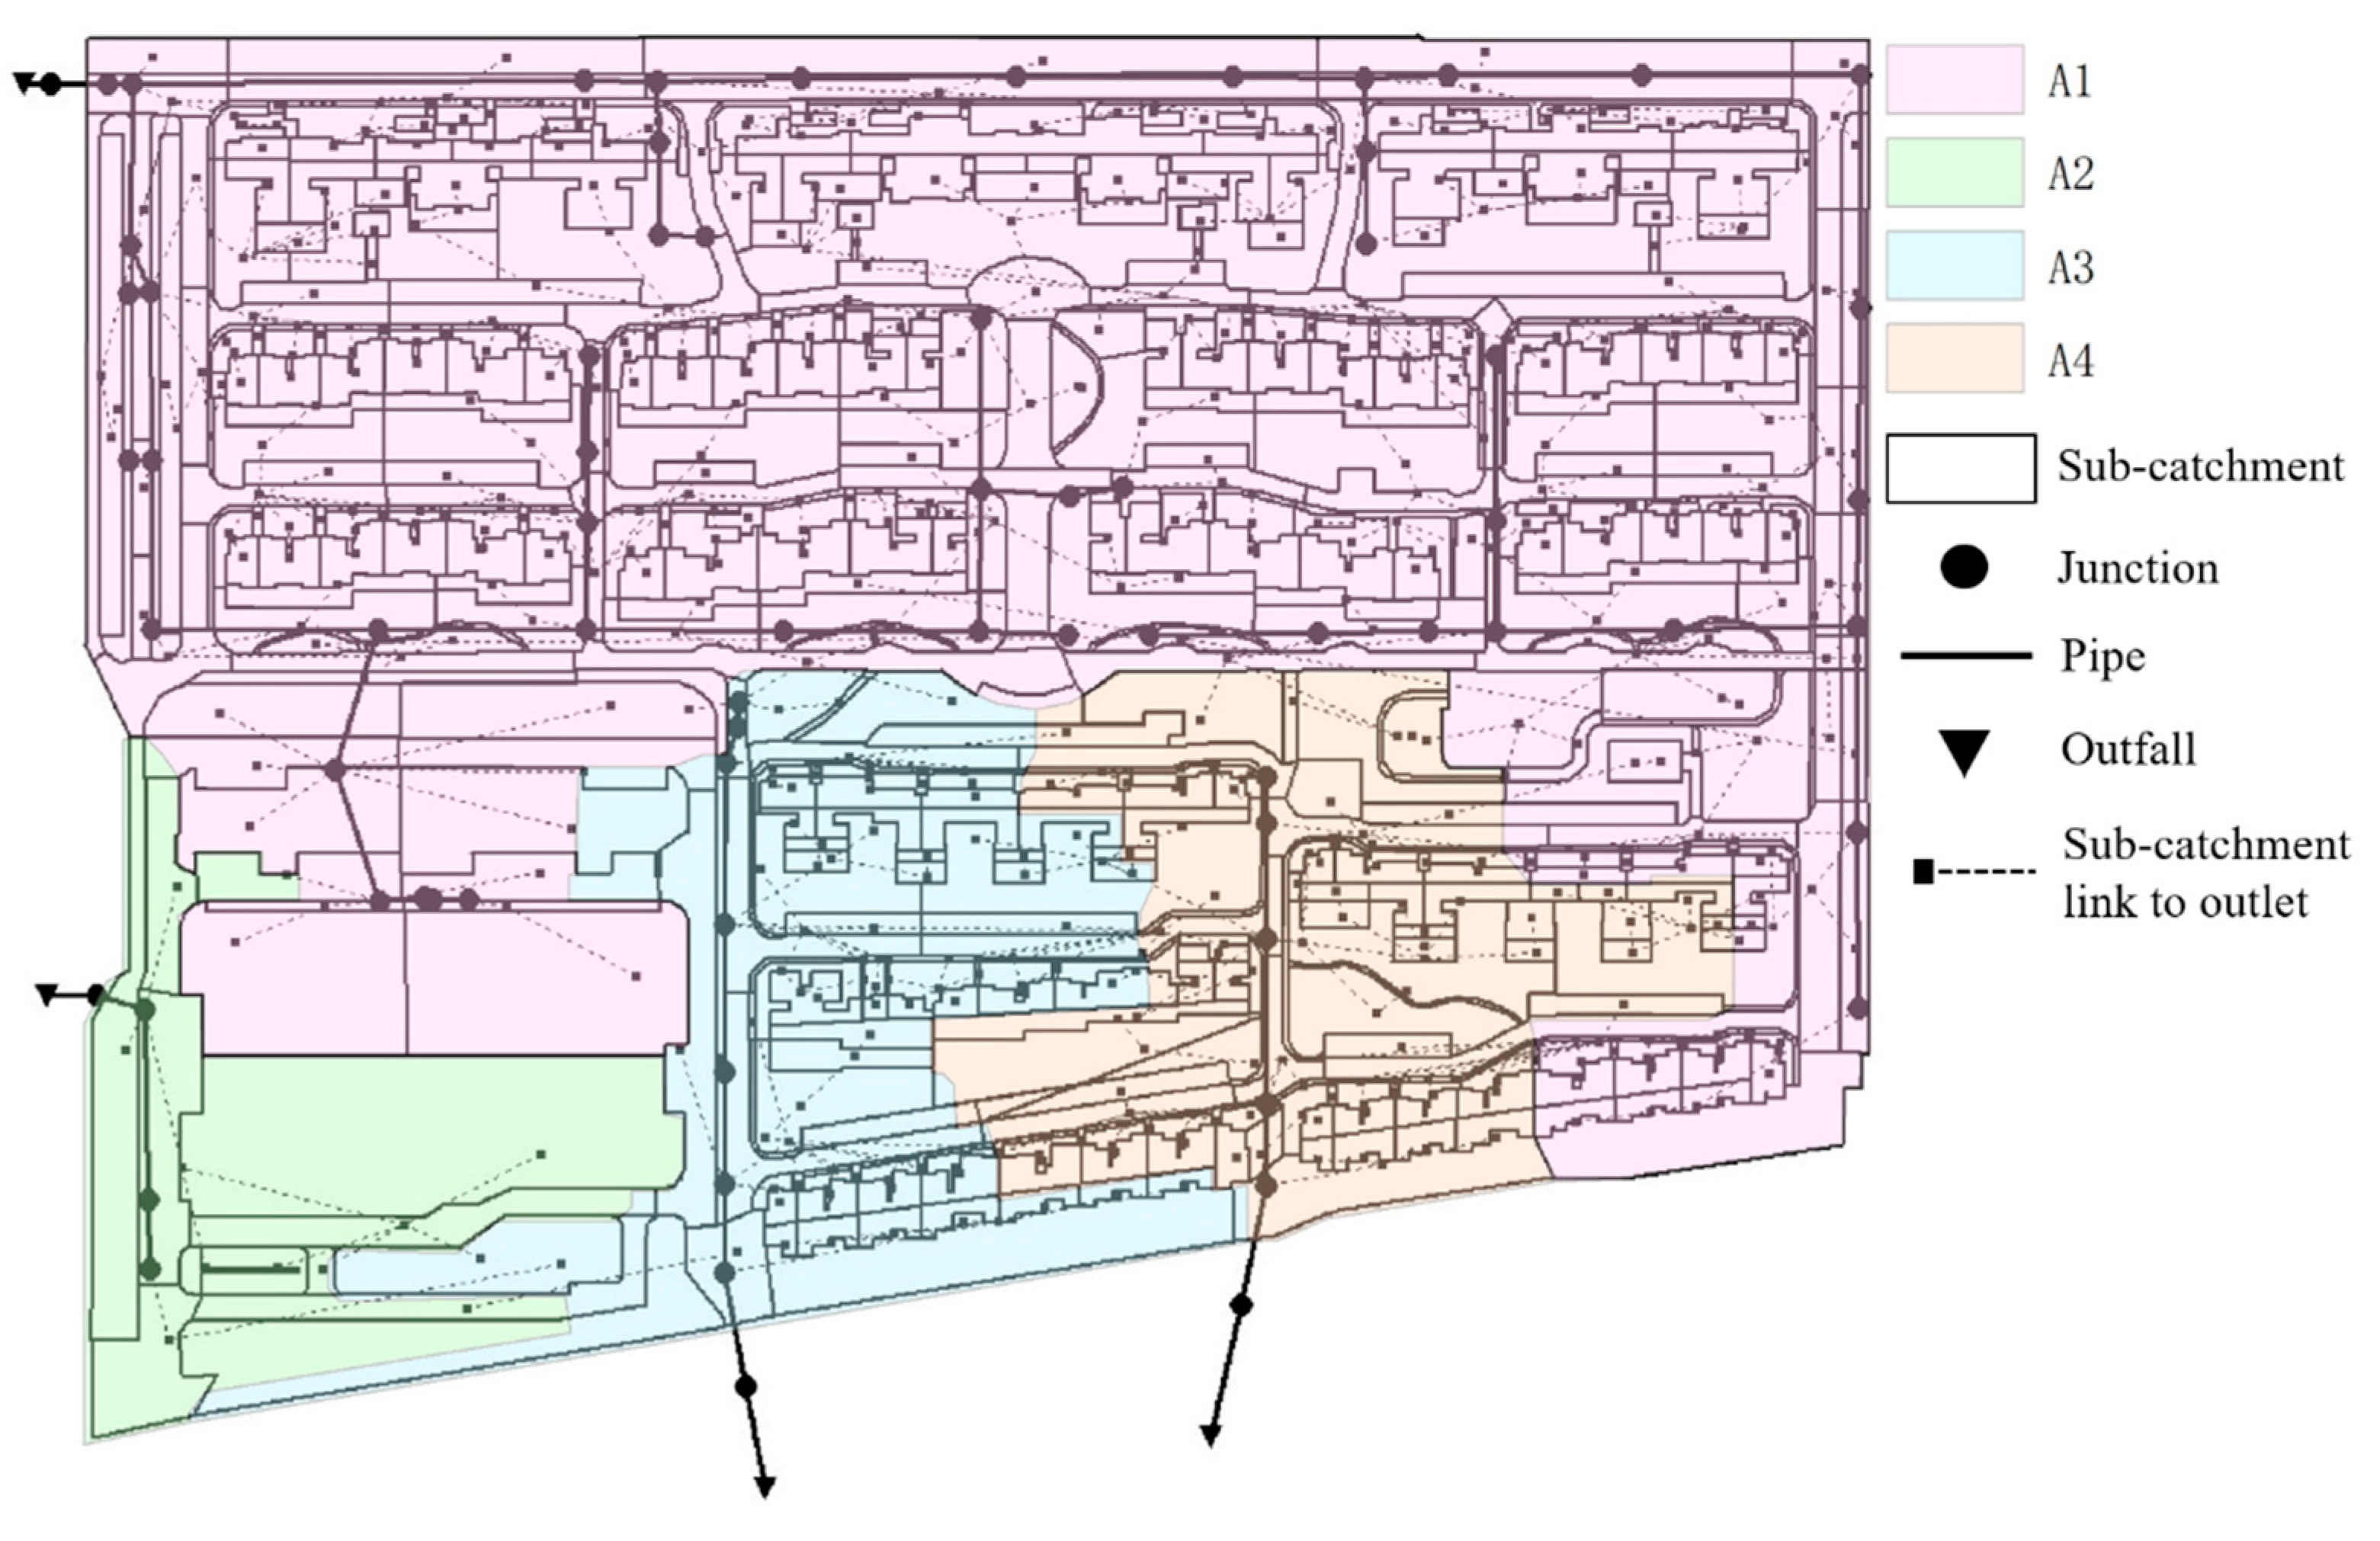
3.1. SWMM Model Establishment and Catchment Division

The SWMM model of the Zi-Jing community was established before and after sponge measure reform, and the model divided the small area into four drainage areas. The SWMM model divided the Zi-Jing community into four sub-catchment areas, A1, A2, A3, and A4, which had the same range before and after transformation. Figure 6 shows the SWMM model and the sub-catchment area division results after the sponge transformation. The A1 drainage subdivision was distributed with a DN200–DN1000 mm rainwater pipeline, which was 1545 m in length and was discharged into the downstream tidal river. The A2 drainage division was distributed with a DN200 mm rainwater pipeline, 72 m in length, which was connected downstream to the municipal pipe network. The A3 drainage area had distribution with a DN400–DN500 mm current rainwater pipeline, with a length of 160 m and downstream south access to the Tonghu Street current rainwater pipeline. The A4 drainage partition had a distribution with a DN400–DN500 mm current rainwater pipeline with a length of 123 m and downstream south access to the Tonghu Street current rainwater pipeline. The four drainage zones were divided as shown in the following figure. During the reconstruction of the sponge city, the pipes in the A2 area were thickened, and the diameter of the renovated rainwater pipe was DN500 mm.
Table 2, below, shows the changes in the underlying surface of each catchment area before and after the sponge renovation. The table lists the areas of green space, hardened ground, and roof before the transformation of each catchment area, and the table lists the areas of sunken green space and permeable pavement transformed by the sponge measures as well as the calculation of the area proportion of transformation. The roof was not modified, and rainwater reservoirs were built in each district. The model of the Bauhinia Elegant Garden before transformation had the following parameters: catchment area: 674, current rainwater wells: 70, current pipeline: 1.9 km, pipe diameter DN200–DN1000 mm, discharge outlets: 4. After sponge transformation, the model had 930 catchment areas, 86 rainwater wells, rainwater pipelines with a total length of 2.2 km, and four outfalls.

3.2. Model Parameter Selection

A high-precision DEM (digital elevation model) was used to extract the average percentage slope of the sub-catchment area with a GIS (Geographic Information System) spatial analysis tool, and the average slope was determined to be 1.39%. In this study, the characteristic width of the sub-catchment area was calculated using the measured maximum overflow characteristic length of the slope in CAD design drawings. Three periods of rainfall events in 2021 were input into the model, and the simulated results of the water level and flow were compared with the measured data to verify the model’s accuracy. The model parameters were determined as shown in Table 3.
The roughness coefficients in the model included the pipe network and surface roughness coefficients. According to the calibration results of the central city model and the actual situation of the pipe network and river in the study area, the roughness of the pipe network was determined to be 0.0147. The surface roughness coefficient referenced the urban rainwater drainage system planning design storm runoff calculation standards, weighted according to the different surface areas, which were determined via research within the scope of the roof, concrete pavement, hardening, permeable asphalt pavement, permeable brick shop outfit, vegetation cover, grassed swales, seepage channel, and other different types of surface roughness coefficient values, as shown in Table 4.

3.3. Evaluation Index Calculation

The flow reduction rate is used to analyze the reduction effect of sponge plot reconstruction on the runoff of a catchment unit, and the calculation formula is as follows:
R F = 1 F A F B
where R F is the flow reduction rate, F A is the flow after sponge transformation, and F B is the flow before sponge transformation.
Surface storage water is used to analyze the amount of water that can be stored and retained on the ground surface after the reconstruction of a sponge plot, and it is an important index for runoff reduction and rainwater control during the reconstruction of a sponge plot. Its calculation formula is as follows:
V S = V P + V O R V E V I V R
where V S is the stored rainwater on the surface of the catchment area, V P is the amount of rainfall in this catchment area, V O R is the amount of water flowing into this catchment area from the adjacent catchment area, V E is the amount of water evaporation during rainfall, V I is the amount of water seeping into the ground, and V R is the amount of rain flowing out of this catchment area.

4. Results

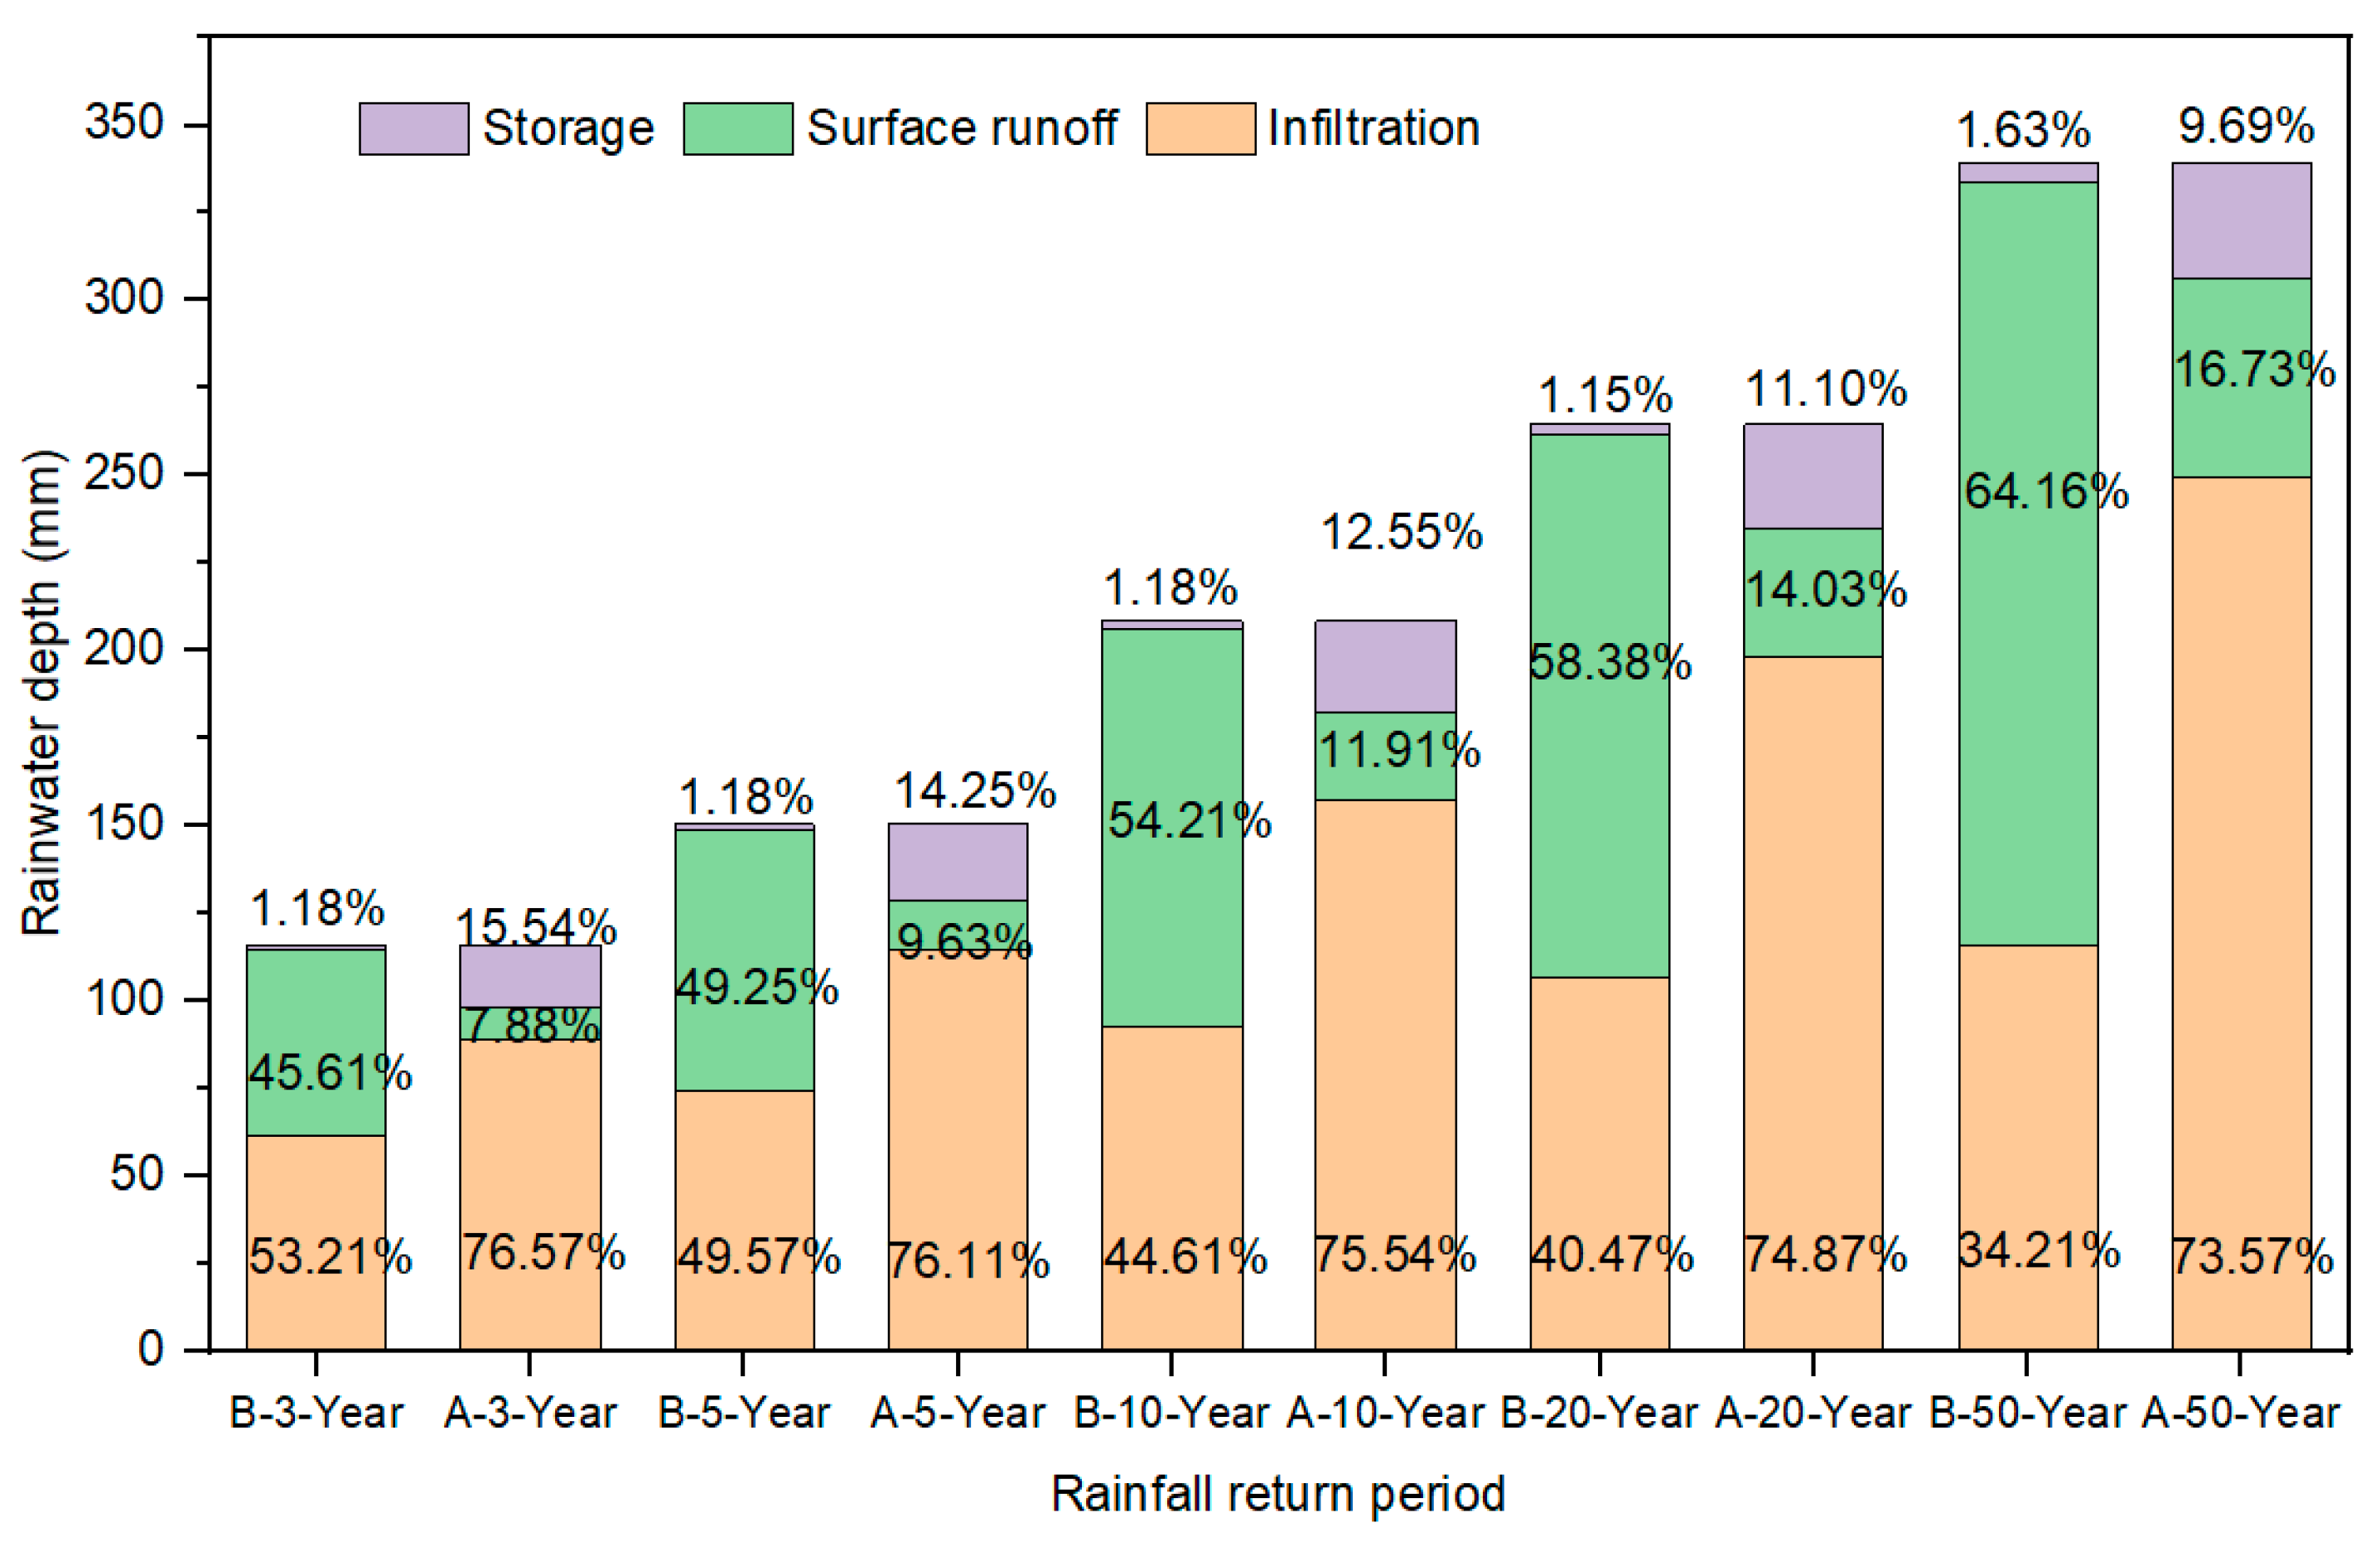
4.1. Runoff Reduction Rate

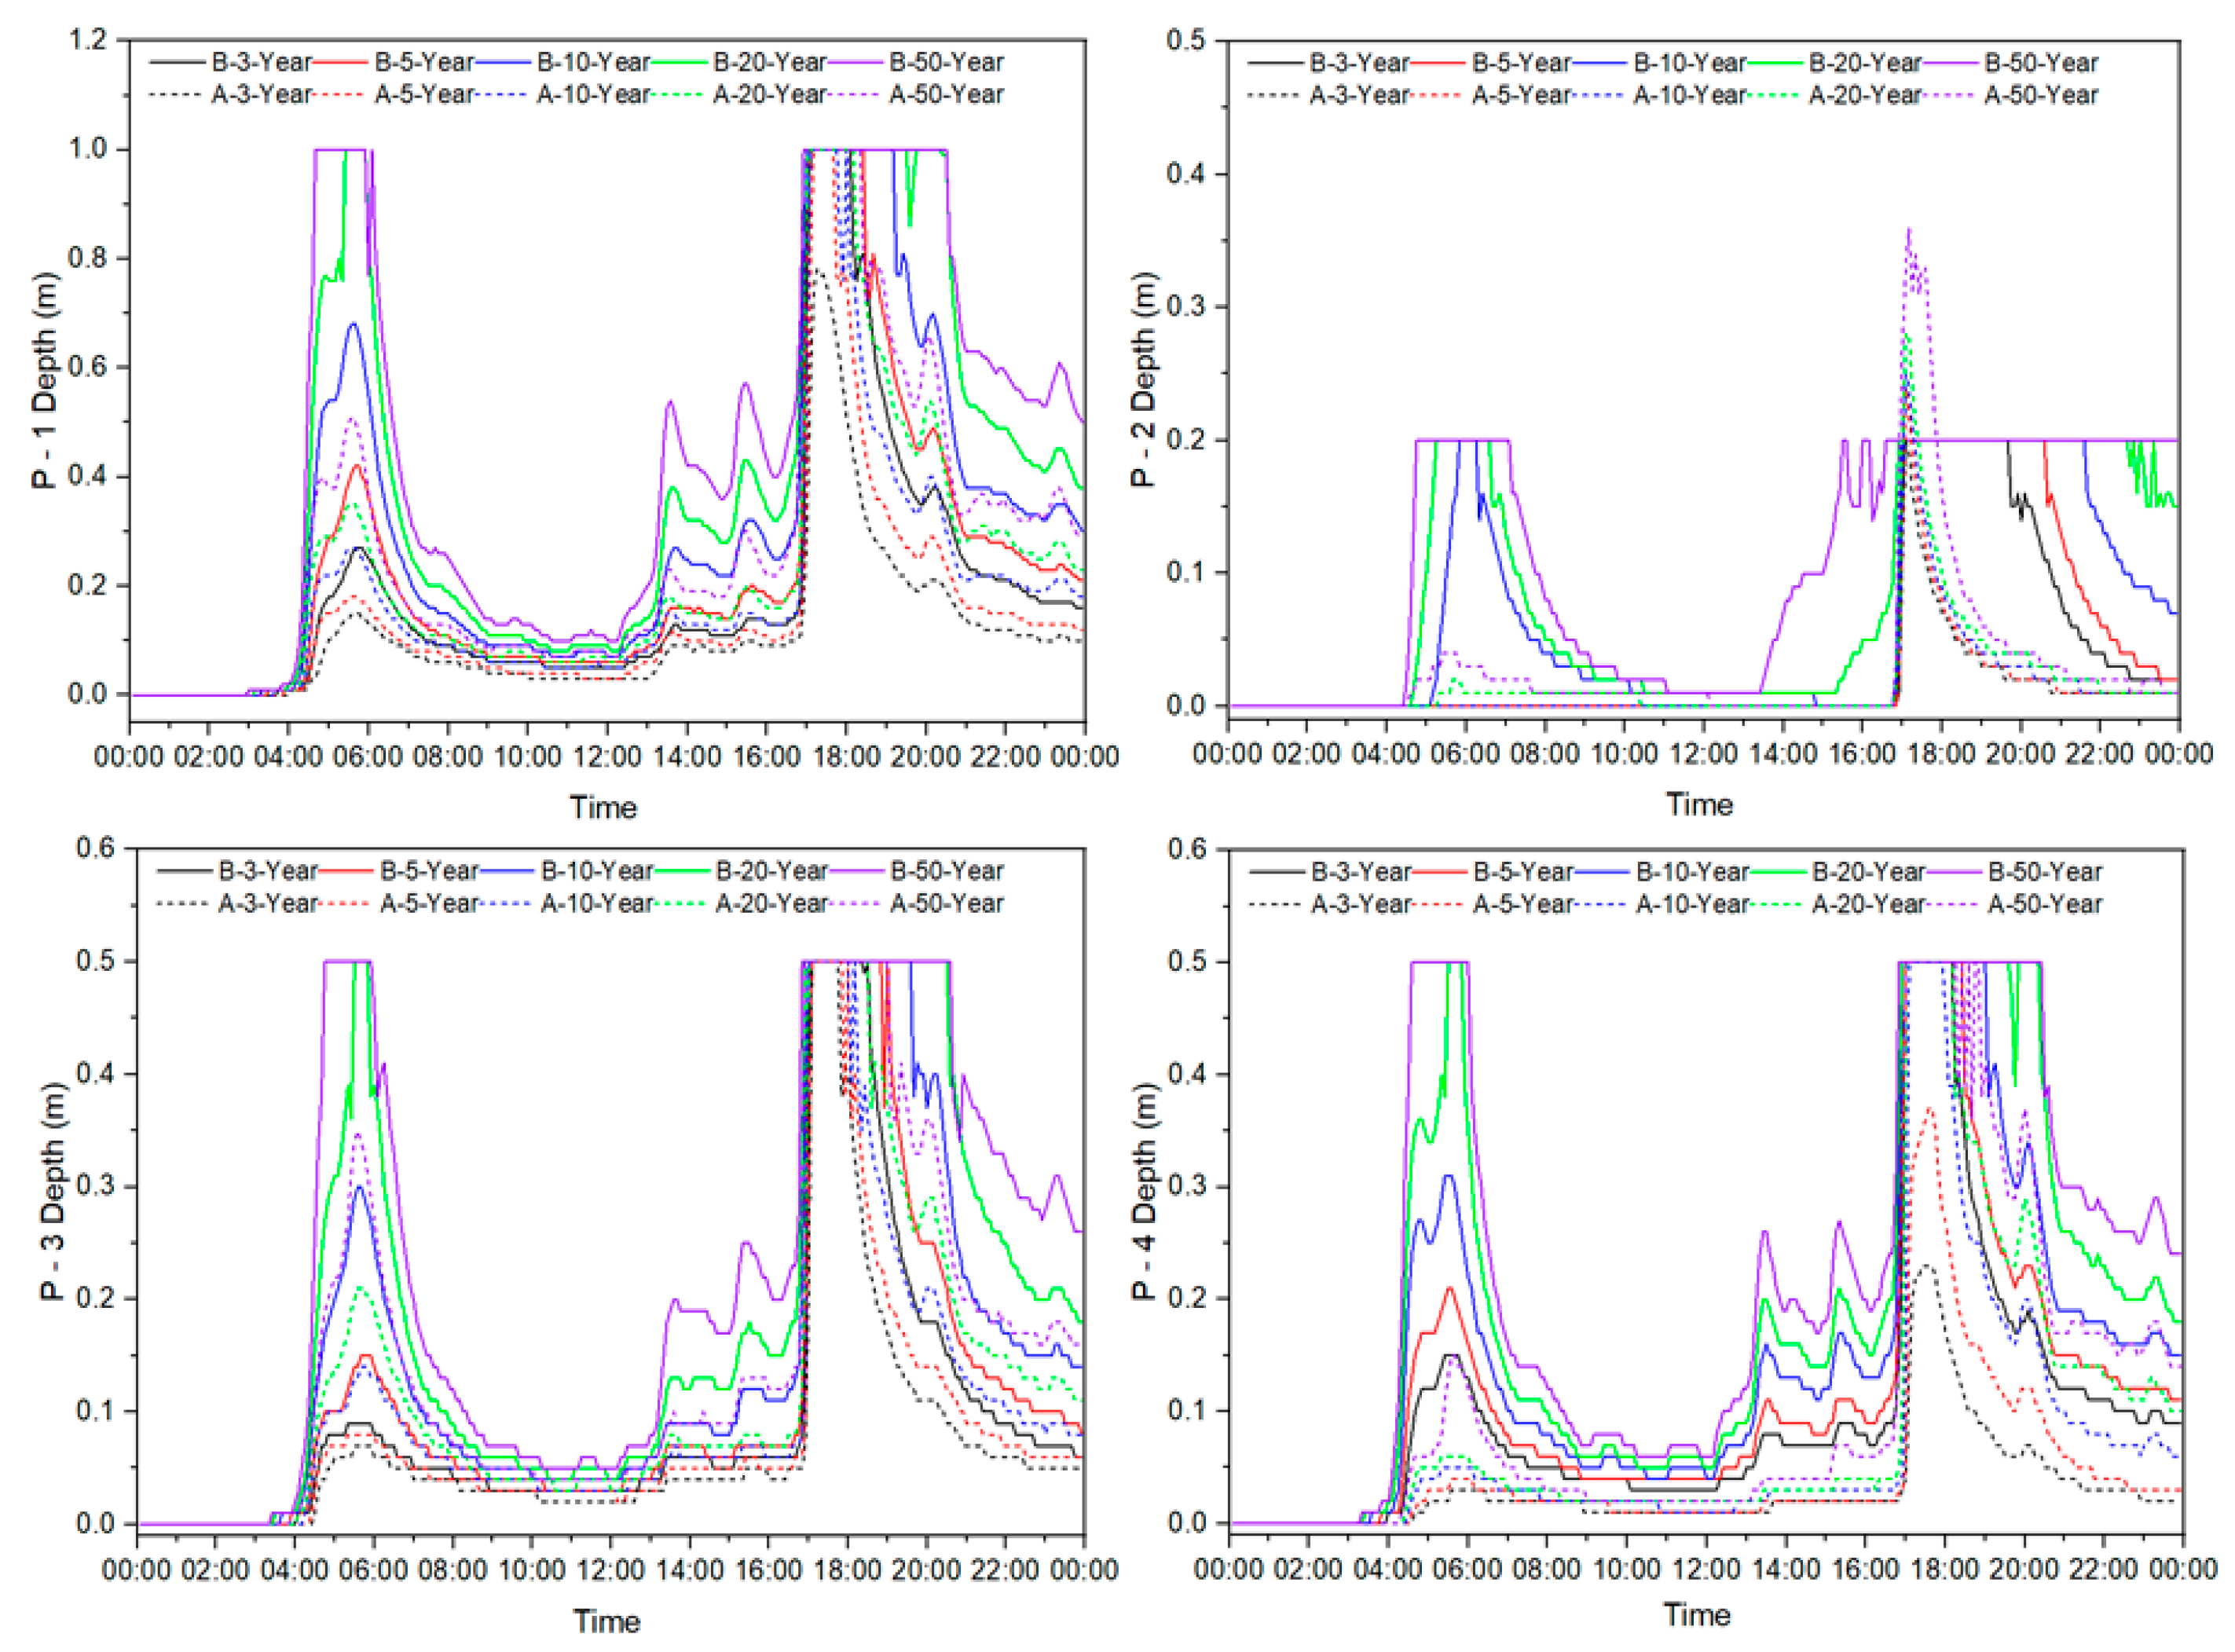
4.1.1. Water Depth of Outlet Pipe

The runoff depth, outlet pipeline flow, and reduction rate for the outlet of the four sub-catchment areas were selected to analyze the runoff reduction rate. Figure 7 shows the change process of the water depth at outlets P1, P2, P3, and P4 in different rainfall return periods. The solid line represents the runoff depth before reconstruction, and the dotted line represents the runoff depth after reconstruction. Before and after the reconstruction, under the design rainfall conditions, there were two peak values at the four exits, from 05:00 to 08:00 and from 17:00 to 21:00.
The water depth of P1 reached its peak value in the first peak period in the cases of occurrence in 20 years and occurrence in 50 years, with durations of 35 min and 80 min, respectively. The durations of the second peak period in the cases of occurrence in 3 years, occurrence in 5 years, occurrence in 10 years, occurrence in 20 years, and occurrence in 50 years all reached the full tube, and the durations were 65 min, 90 min, 135 min, 200 min, and 220 min, respectively. After the sponge transformation, only the second peak period occurred once every 5 years, once every 10 years, once every 20 years, and once every 50 years. The durations were 35 min, 60 min, 75 min, and 90 min, respectively. The first peak period did not reach the full tube.
Before reconstruction, the water depth of P2 reached its first peak period and second peak period in the cases of once in 3 years, once in 5 years, once in 10 years, once in 20 years, once in 50 years, and all reached the full pipe. The durations were 160 min, 220 min, 280 min, 355 min, and 445 min, respectively. After sponge city modification, there was not a full tube in the two peak periods in each return period.
Before reconstruction, the water depth of P3 reached the peak value in the first peak period in the cases of occurrence in 20 years and occurrence in 50 years, and the durations were 25 min and 75 min, respectively. The water depths at the second peak period in the cases of occurrence in 3 years, occurrence in 5 years, occurrence in 10 years, occurrence in 20 years, and occurrence in 50 years all reached the full pipe, and the duration times were 80 min, 115 min, 160 min, 220 min, and 230 min, respectively. After the sponge city transformation, the first peak period did not reach the full tube, and the second peak period occurred once in 3 years, once in 5 years, once in 10 years, once in 20 years and once in 50 years, and the durations were 45 min, 50 min, 65 min, 95 min, and 130 min, respectively.
Before reconstruction, the water depth of P4 reached the peak value in the first peak period in the case of once in 20 years and once in 50 years, and the durations were 25 min and 90 min, respectively. The water depths at the second peak period were those in the cases of once in 3 years, once in 5 years, once in 10 years, once in 20 years, and once in 50 years, and all reached the full pipe. The durations were 75 min, 90 min, 130 min, 165 min, and 220 min, respectively. After transformation, the first peak period did not reach the full tube, while the second peak period occurred in the cases of once in 10 years, once in 20 years, and once in 50 years, with durations of 55 min, 75 min, and 80 min, respectively.

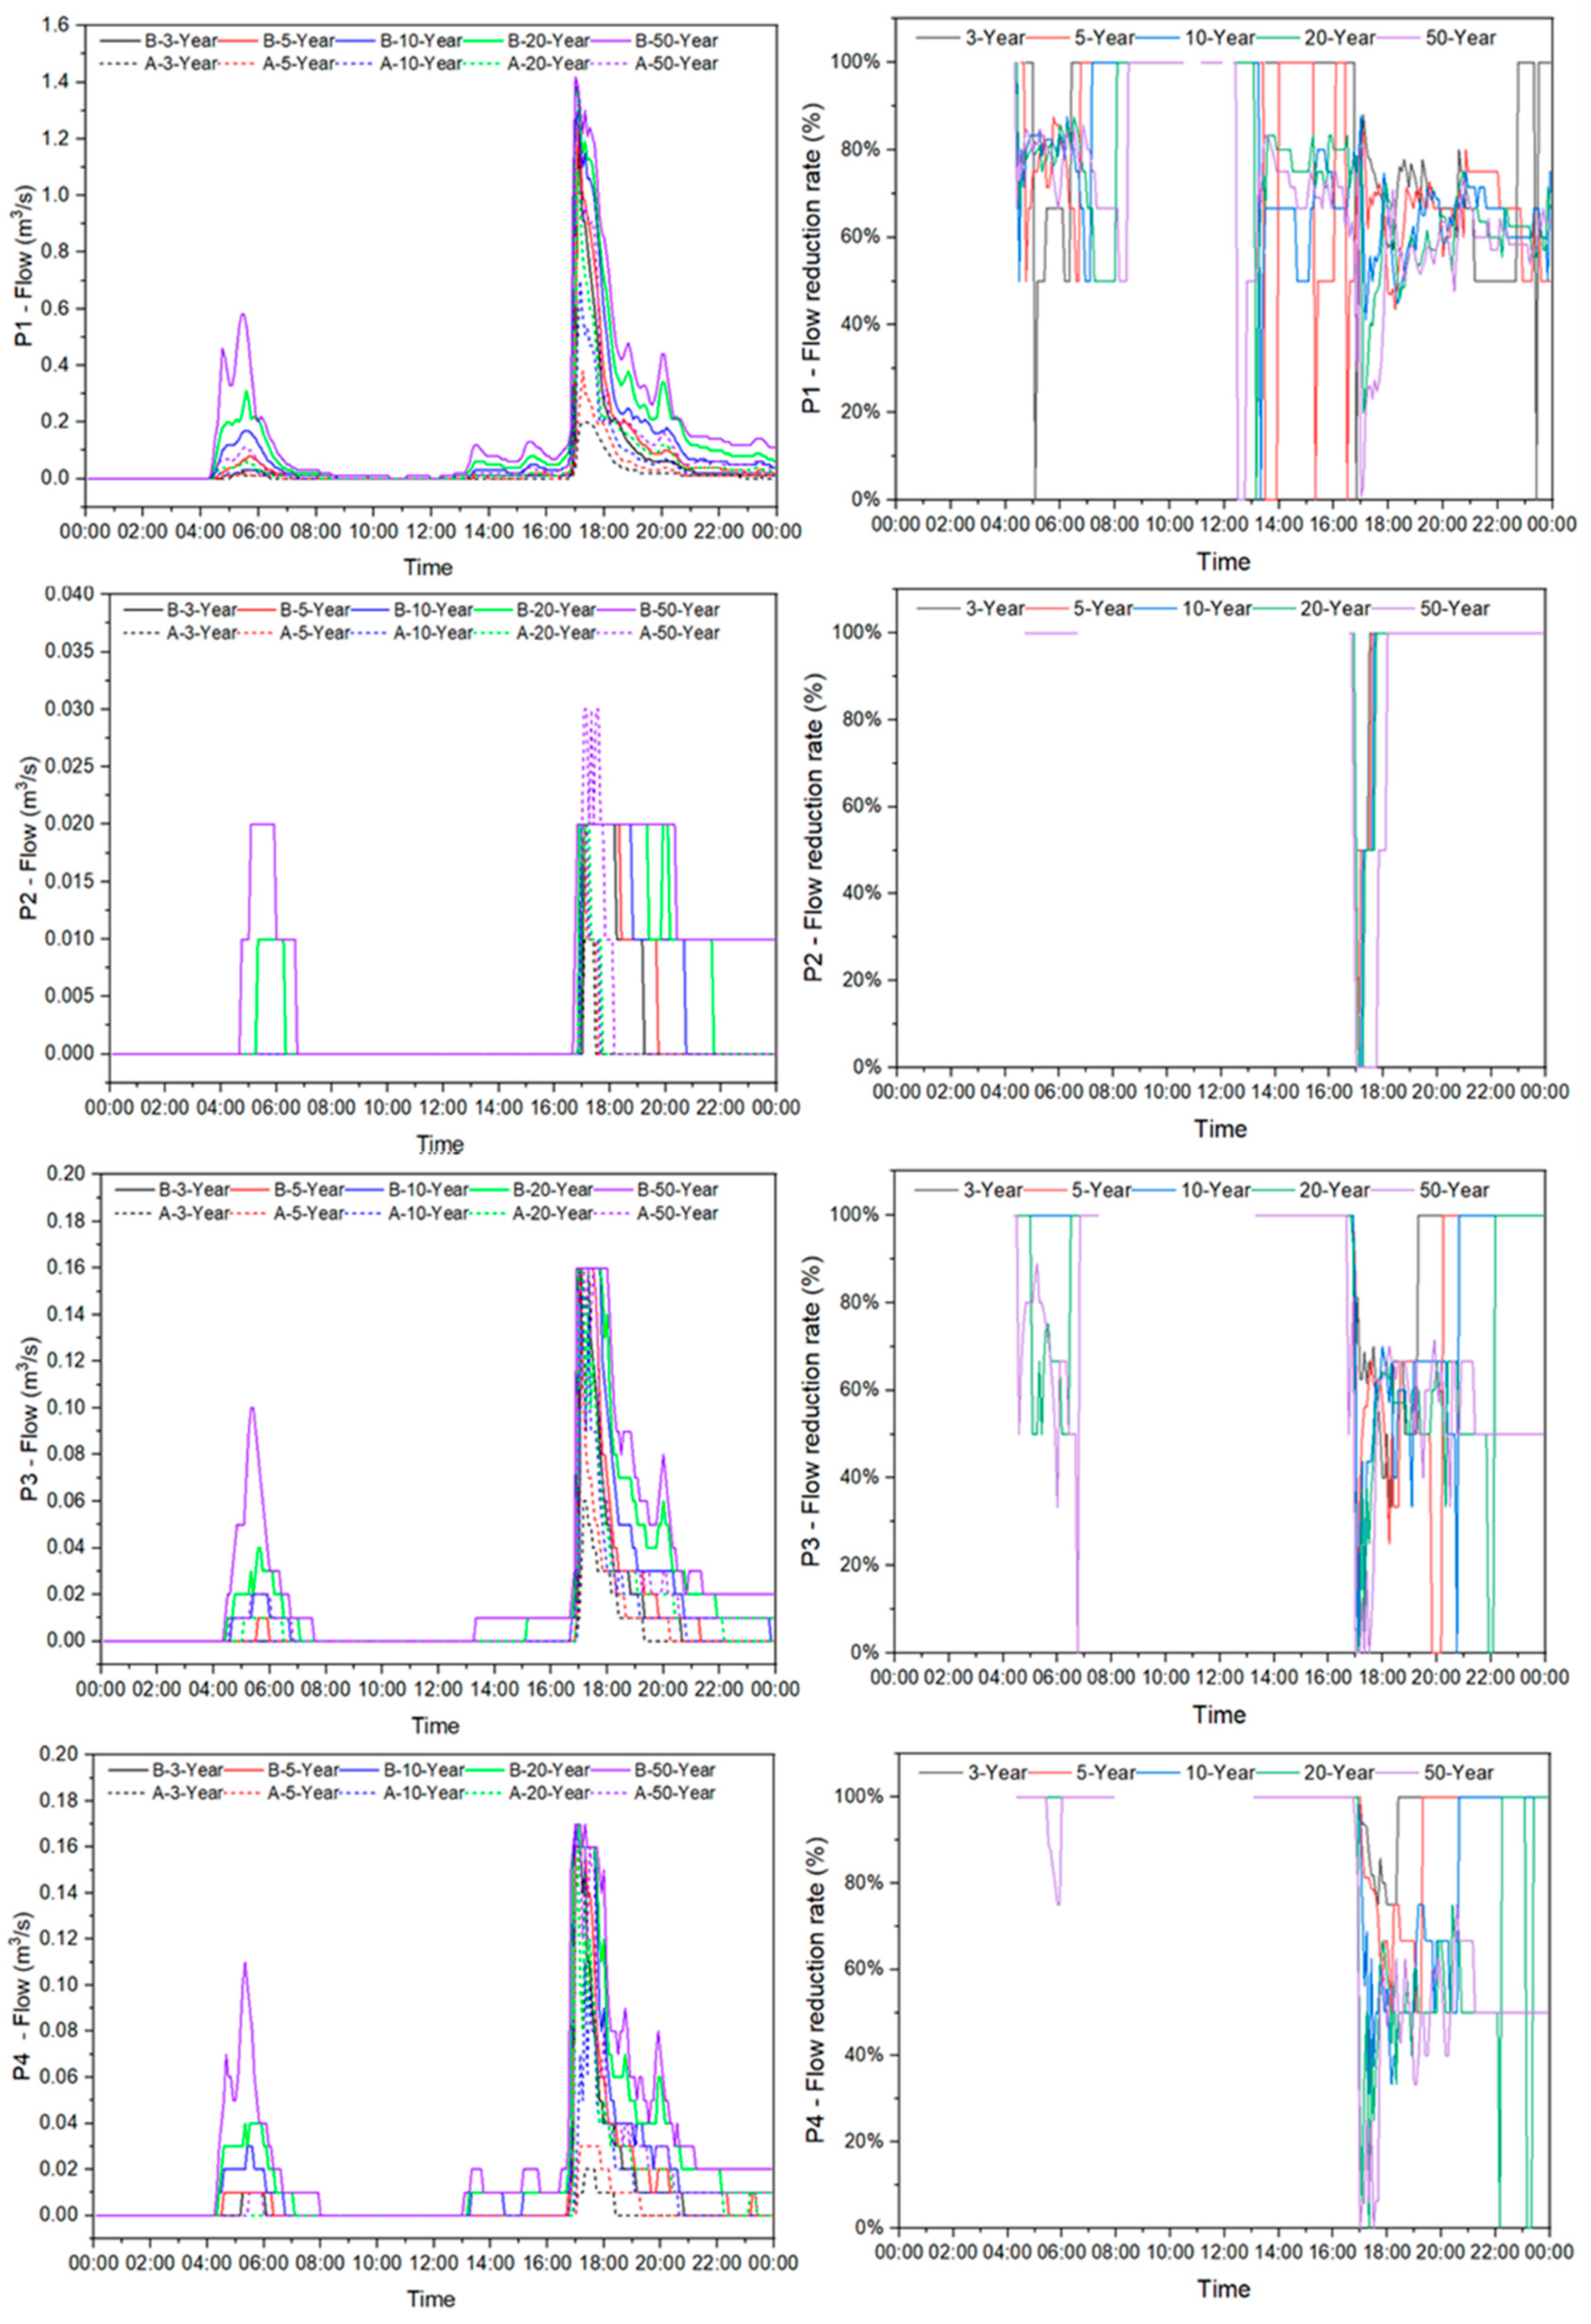
4.1.2. Outlet Flow and Reduction Rate

Figure 8 shows the flow process of outlets P1, P2, P3, and P4, as well as the change process of the runoff reduction rate in each region. The figure on the left side describes the flow change process of each sub-catchment outlet of the Zi-Jing community before and after the reconstruction of the sponge plot for different return periods. Compared with the process before the reconstruction, the overall process of the outlet flow after the reconstruction was better controlled, especially in the two peak periods of rainfall, and the outlet flow after the reconstruction was significantly reduced.
A1 was the largest sub-catchment area. The flow peak of P1 at the first peak period before reconstruction had a recurrence period of more than 0.58 m3/s once in 50 years, and the peak flow at the same time after reconstruction was only 0.11 m3/s. The peak flow at the second peak period was similar before and after reconstruction, at 1.42 m3/s before reconstruction, and 1.41 m3/s after transformation. However, the duration times of the peak flow and the peak drop times were shortened after transformation. The results of the outflow reduction rate on the right side showed that the runoff reduction rate fluctuated between 50 and 100% after reconstruction, the reduction rate at the peak period was mainly concentrated in the range of 60–80%, and the reduction rate at the first peak period was higher than that at the second peak period.
A2 was the smallest sub-catchment area. The pipe diameter of the P2 outlet was increased from 0.2 to 0.5 m in the reconstruction. In terms of the flow process, the first flow peak disappeared after reconstruction, while the second flow peak was higher than that before reconstruction for the period of 50 years, which was due to the increase of the pipe diameter. The flow peak period of the P2 outlet decreased significantly. According to the flow reduction rate results on the right side, the reduction rate in the first peak period was 100%, the reduction rate in the second period was 50–90%, and the reduction rate lasted until the end of the simulation.
A3 was larger than that of A2 but smaller than that of A1. Before the modification, P3 had an obvious bimodal flow process, the first peak value decreased obviously after modification, and the peak period shrank. The reduction rate of the first peak value period was close to 100% within the recurrence period of 20 years. The duration of the second peak period was obviously reduced. The results for the flow reduction rate on the right side showed that the reduction rate was 100% during the recurrence period of the first peak within 20 years, and the reduction rate was distributed in the range of 50–90% for the condition of the recurrence period of 50 years. In the second peak period, the reduction rate ranged from 30% to 70%. With the increase in the return period, the reduction rate decreased.
P4 had an obvious bimodal flow process before reconstruction. The first peak value and the duration time decreased significantly after reconstruction. The reduction rate of the first peak period was close to 100% within the recurrence period of 20 years. The duration time of the second peak period was obviously reduced, and the flow reduced value was not significant. The reduction rate results of the flow at the right exit showed that the reduction rate of the first peak period was 100% in the recurrence period of fewer than 20 years, and the reduction rate for 50 years was more than 70%. The reduction rate of the second peak period ranged from 35% to 80%. With the increase in the return period, the reduction rate decreased.

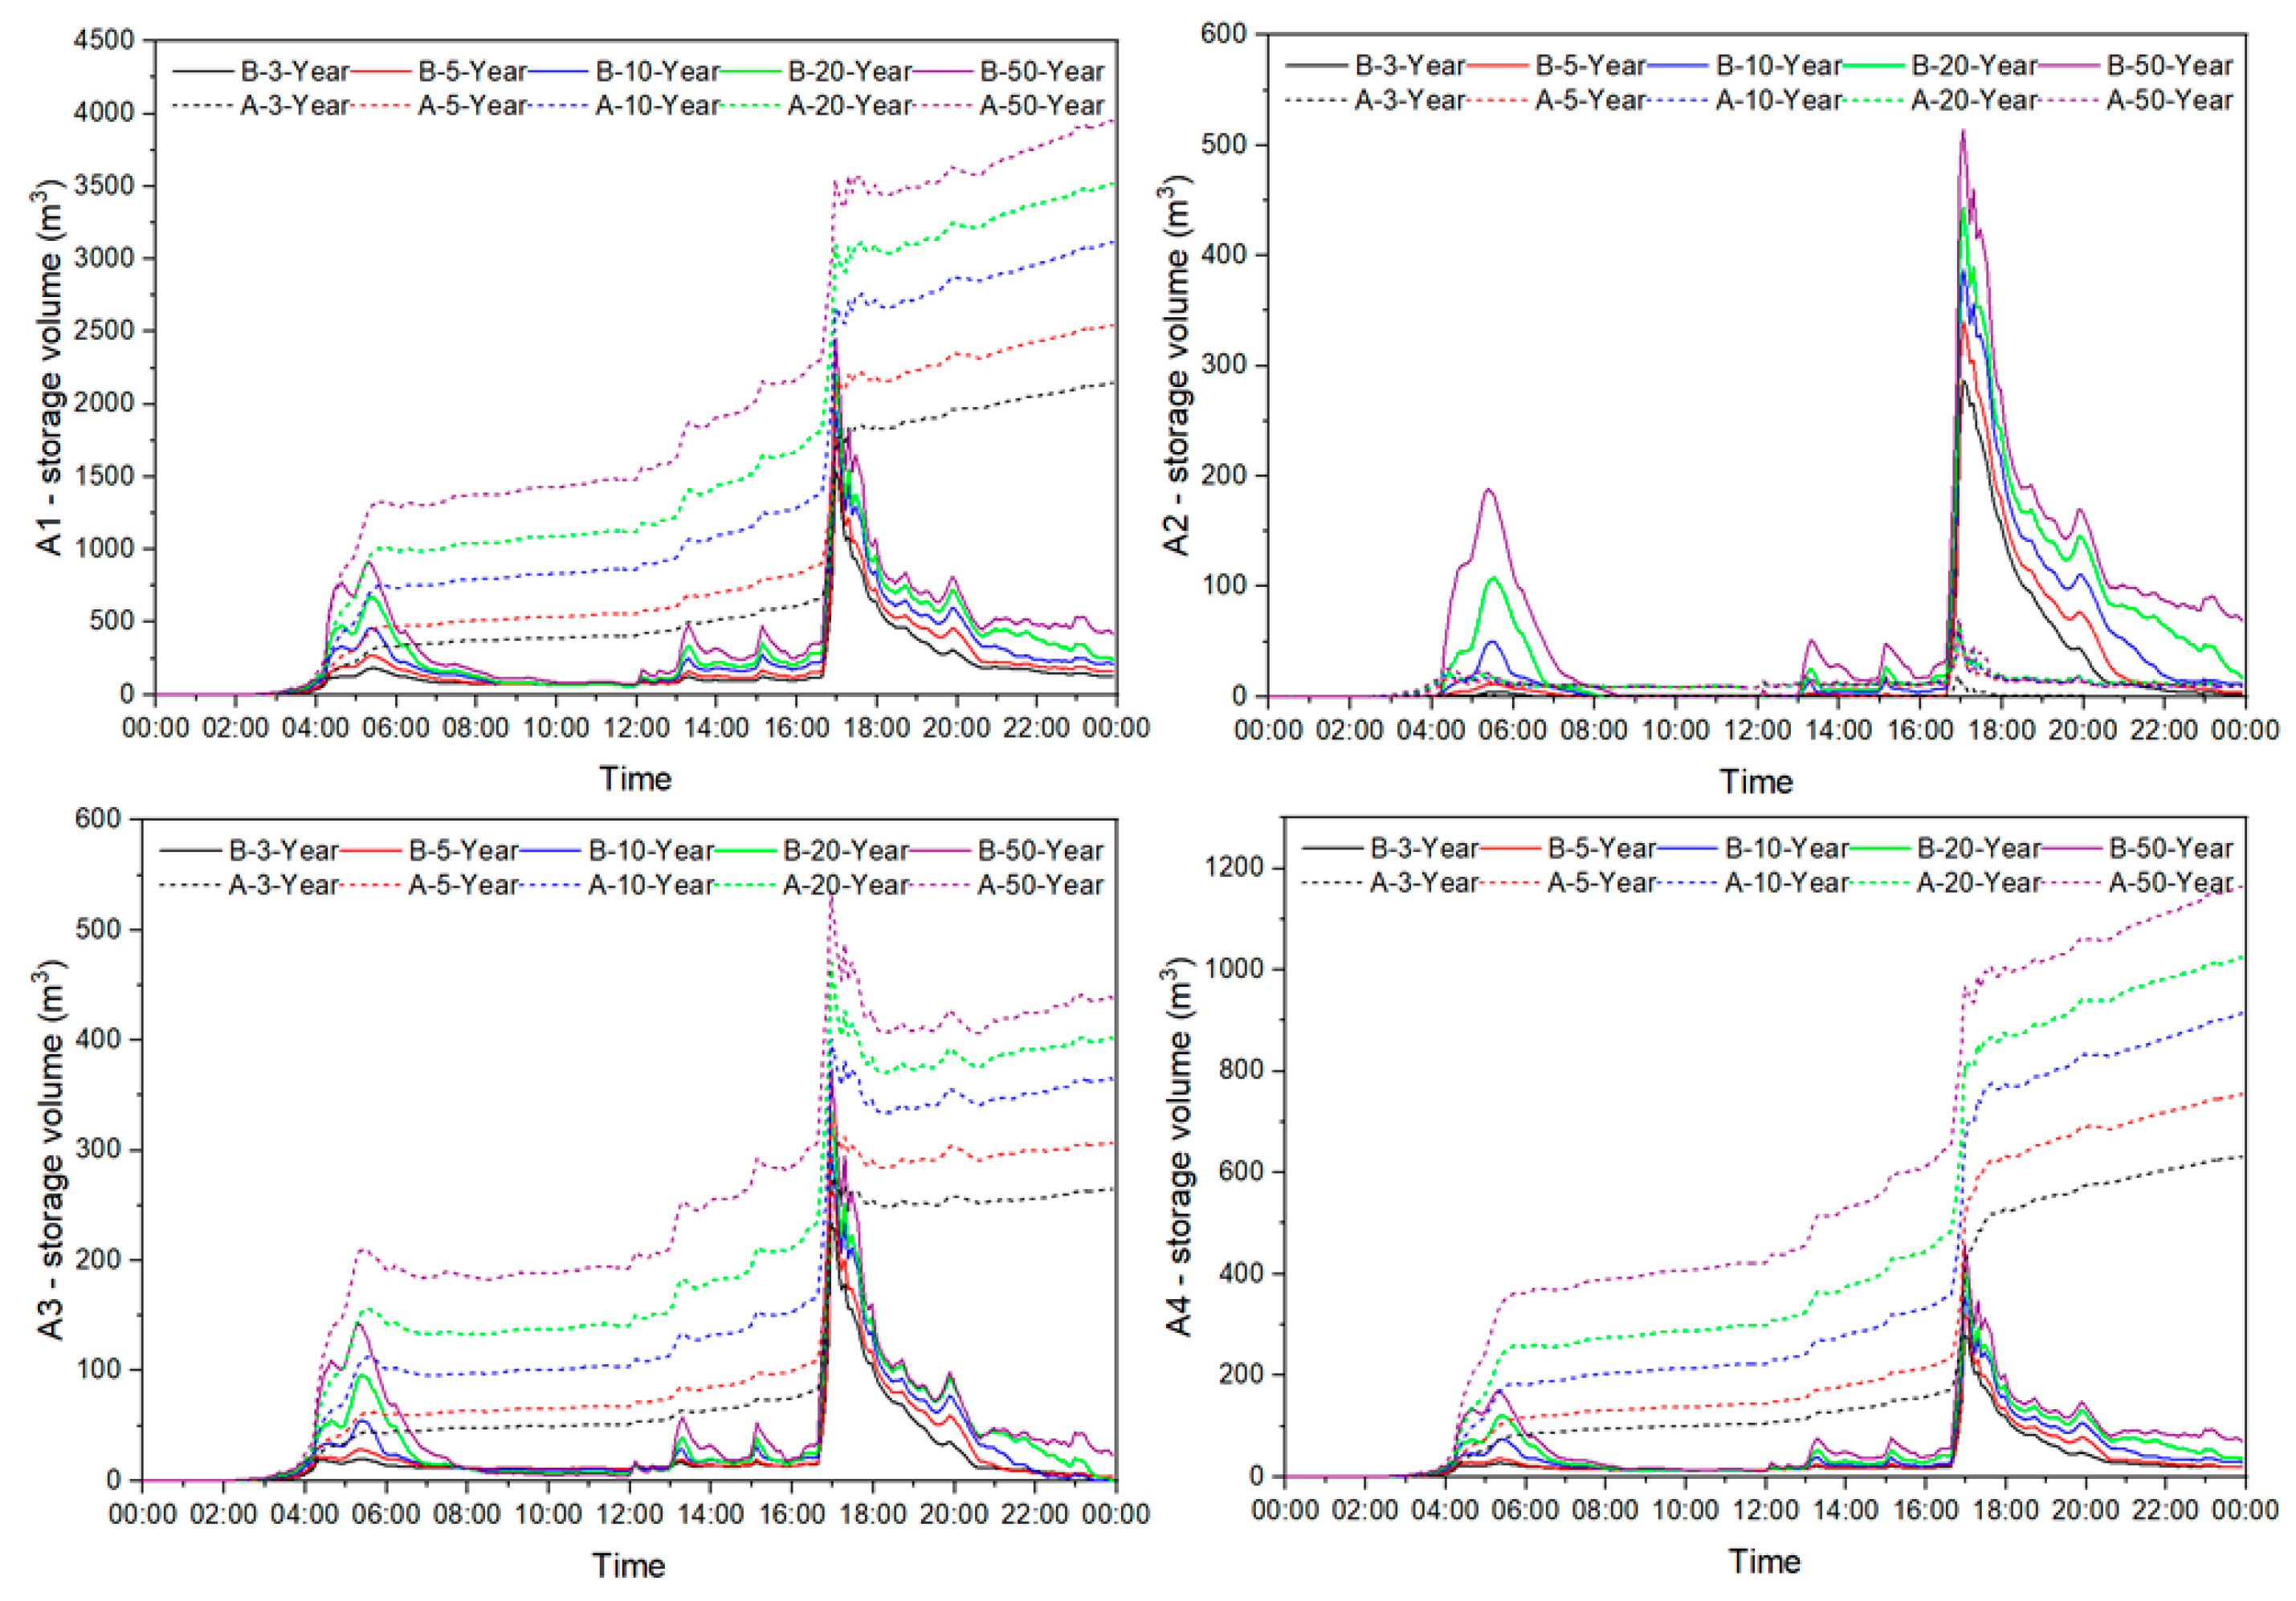
4.2. Rainwater Storage Rate

The rainwater storage rate was compared and analyzed for the stormwater storage amount of the four sub-catchment areas in different return periods before and after the reconstruction of the sponge community, as well as the stormwater storage, infiltration, and runoff ratio of the whole community in different return periods before and after the reconstruction of the sponge community.
Figure 9 shows the variation process of water retention in sub-catchment areas A1, A2, A3, and A4 before and after reconstruction. The retention water in the figure is calculated using the equation of regional “rainfall + inflow-evaporation-infiltration–outflow.” The A1, A3, and A4 peaks flowed from the first to present the rise as well as the situation of the high return period, water content, and different return period at the same time the water had an obvious hierarchy. Afterward, the stored water amount once in three years after the renovation is higher than that once in 50 years before the modification. The variation process of the water storage in sub-catchment area A2 was not significant in the other three areas in different return periods. The water storage in the sub-catchment area decreased after the first flow peak and after the second flow peak. The reason for this might have been that in the transformation process of A1, A3, and A4, the sunken green spaces were transformed, including the grass ditches, rain gardens, and biological retention ponds, which could retain rainwater on the surface. Additionally, the A2 sub-catchment area was not the area of green land reformation but rather of sponge transformation hardening and oriented permeable pavement reconstruction, including the transformation of the waterproof concrete and permeable parking lot, resulting in the hardening of the surface of the ground storage delay function being lost, so the modified A2 area had less storage water than before, and the majority of the rainwater infiltrated the ground.
Figure 10 shows the proportion of rainwater storage, surface runoff, and rainwater infiltration before and after sponge transformation in the Zi-Jing community for different return periods. For the same return period, the proportion of rainwater infiltration and rainwater storage increased significantly, while the proportion of surface runoff decreased significantly. The rainwater infiltration rate was the highest before and after the reconstruction during the 3-year recurrence period. The rainwater infiltration rate before and after the reconstruction during the 50-year recurrence period decreased significantly, by nearly 20%, but it decreased only by 3% after the reconstruction. With the increase of the rainfall return period, the increase rate of the rainwater storage improvement decreased, the decrease rate of the surface runoff decline increased, and the increase rate of the rainfall infiltration increased. Based on the results, the comprehensive runoff coefficients of the plots with different recurrence periods were calculated. Before the reconstruction, the runoff coefficients for the periods of once in 3 years, once in 5 years, once in 10 years, once in 20 years, and once in 50 years were 0.46, 0.49, 0.54, 0.58, and 0.64, respectively. After reconstruction, the runoff coefficients were 0.08 for the period of once in 3 years, 0.1 for the period of once in 5 years, 0.12 for the period of once in 10 years, 0.14 for the period of once in 20 years, and 0.17 for the period of once in 50 years.

4.3. Rainwater Utilization Rate

In this study, only the proportion of rainwater directly used after the collection was evaluated. The directly utilized water storage was stored in the rainwater reservoir of the sponge reconstruction construction with the rainwater pipe. The model considered the loss of rainfall generation and the confluence in the calculation process, and the rainwater corresponding to rainfall of 5 mm after the rainwater runoff entered the pipe was discarded as the initial rainwater. After the completion of the abandoned flow, the rainwater was stored. According to the runoff process, the time of reservoir filling in each sub-catchment area was recorded. The table below records the time of the first storage filling in the four sub-catchment areas in different return periods. In the reconstruction of the sponge residential area, the time cycle of the water discharge of the reservoir was 7 h, so the first full reservoir could only be used once within 24 h after 17:00. It can be seen from the results in Table 5 that once every three years, the reservoirs in the A2 and A4 sub-catchment areas would not be full in 24 h.

5. Discussion

The results for the outlet water depth of the four sub-catchment areas showed that before sponge reconstruction, the four outlets were full packages at the two rainfall peaks, which indicated that the outlet pipe section had a full load operation at the rainfall peak period before sponge reconstruction, which caused waterlogging and surface water to a certain extent. With the increase of the rainfall return period, the duration of the full tube condition increased [33]. After sponge reconstruction, none of the four outlets appeared to be in the full tube state in the first rainfall peak, while the second rainfall peak appeared to have a short full tube state in the high return period. The water depth of the P2 outlet exceeded that before the reconstruction because the diameter of the P2 pipe was improved during the reconstruction. It can be seen from the water depth reduction results that after sponge reconstruction, the water depth reduction effect at the outlet of the four sub-catchment areas of the residential community was significant, and the full pipe duration for each return period was shortened, which was similar with the results of case study in Gui’an New District [34]. The full pipe duration at the outlet of P1 was reduced by 30–130 min, and the full pipe duration at the outlet of P3 was reduced by 35–135 min. The P4 exit full tube duration was reduced by 35–80 min. After the outlet pipe diameter of P2 was raised from 0.2 to 0.5, there was no full pipe state, and the peak water depth fall time was obviously shortened, which was the result of the combined effect of the sponge reconstruction and pipe diameter raising. This is consistent with the research conclusion that increasing the drain pipe diameter can effectively reduce the risk of flood disaster in sponge plot reconstruction [35].
The value of the reduction rate could not be calculated at the initial stage of rainfall and the period between the two peak values based on the reduction rate on the right side of Figure 7 because the runoff before reconstruction itself was zero. During the peak rainfall period, the smaller the runoff after reconstruction was, the greater the runoff reduction rate was. When the runoff after reconstruction was zero but the runoff before reconstruction was not zero, the runoff reduction rate was 100%. The 100% runoff reduction rate was more likely to occur before and after the peak rainfall period, indicating that the reduction rate of the sponge transformation for a small flow could reach 100%, and the average reduction rate for the peak rainfall period was also higher than 50%. The related research shows that the proportion of reduction rate in China is between 20% and 60% [29].
Before the reconstruction, the water storage on the surface showed a temporary peak at the peak of rainfall because the rainfall on the surface was temporarily stored on the surface without enough time to enter the pipeline. When the peak of the rainfall passed, the water storage on the surface decreased rapidly. After the reconstruction, the surface water storage of the A1, A3, and A4 sub-catchment areas was higher than that before the reconstruction, and the surface water storage did not decrease rapidly after the rainfall peak but rather increased slowly with the increase of the rainfall. The main reason for this was that a large proportion of the green spaces in these three sub-catchments were transformed into sponge rainwater gardens, grass planting ditches, and biological retention ponds, thus improving the water storage capacity of the surface [15]. The effect of the surface water storage in sub-catchment area A2 after sponge reconstruction was different from that of the other three sub-catchment areas. The surface water storage in sub-catchment area A2 after sponge reconstruction decreased significantly, and the surface water storage in the sub-catchment area after sponge reconstruction was lower than that before reconstruction, even in the peak period of rainfall. The main reason for this was that there was no green space reconstruction in the sponge reconstruction of block A2. The permeable paving of the 95.45% impervious hardened ground was transformed, which greatly improved the permeability of the ground and reduced the water storage capacity of the ground [25].
The proportion of rainwater infiltration after sponge transformation can reach 45–74%, which is similar to Qin’s research result that it can absorb 80% rainwater [36]. Since Qin’s research is about the water absorption ratio of pervious pavement, this study is about the comprehensive water absorption or infiltration ratio, so it also indicates that the water absorption of pervious pavement is stronger than other sponge measures. In terms of the proportion of rainwater storage, surface runoff, and infiltration in the whole residential area, the proportion of infiltration and storage increased during different rainfall return periods, while the proportion of surface runoff decreased significantly. The main reason for this was that the pervious pavement of some impervious roads was reformed in the sponge reconstruction of residential areas, which improved the infiltration capacity. Rainwater gardens, grass ditches, biological retention ponds, and other sunken green spaces were transformed to improve the rainwater storage capacity of the surface [37]. With the increase of the rainfall return period, the proportion of surface runoff increased, but the increase of the proportion of surface runoff after reconstruction was less than that before the reconstruction, which indicated that the reconstruction of the sponge plot had a certain reduction effect on surface runoff [38], and from 3 years to 50 years, the reduction rate of surface runoff increased from 37.73% to 47.43%. The improvement rate of the rainfall infiltration also increased from 23.36% to 39.36%.
According to the 7 h drainage plan of the reservoir, the reservoir of A1 could be filled up three times, while the other sub-catchment areas could only be filled up and used one time with the rainfall that occurred once in 5 years and once in 10 years. For a 20-year rainfall, the reservoirs in the A1 and A3 sub-catchment areas could be filled up and utilized three times. In the event of a 50-year rainfall, the reservoirs in the catchment areas of A1, A3, and A4 could be filled up and used three times. At the perspective of water demand, the resident population of Zi-Jing Community was about 5000 people, and the average daily flushing water consumption was 18 L, so the daily flushing water demand of the community was 90 m3. The green area of the community was 35,800 m2, the irrigation water of the single-side area was 2 L/m2, and the irrigation water was 72 m3 per day. The total water demand of the community after reconstruction was 765 m3, which could be used for flushing and afforestation irrigation for five days in the community. According to 765 m3 for rainwater use, if only considering rainwater utilization volume on hardened ground and roof, the rainwater utilization rate is 8.04% in the case of 3 years in a community after sponge transforming, which is similar with the results of rainwater utilization rate of 8% [28].

6. Conclusions

Taking the Zi-Jing community as the research case, the SWMM model was established before and after the sponge transformation for the rainfall runoff simulation analysis, and 3-year, 5-year, 10-year, 20-year, and 50-year rainfall return periods were chosen. This study compared runoff reduction, rainwater storage, rainwater collection, and utilization ability before and after the renovation of the residential area. The main conclusions were as follows:
The sponge transformation of the green space, such as the rain garden, grass planting ditch, biological retention pond, and other sponge measures could greatly improve the rainwater storage capacity of the green space surface while increasing the infiltration performance of the green space. After pervious pavement modification, the permeability of the impervious hardened surface was improved effectively, and the rainwater storage capacity of the hardened surface was reduced. Sponge transformation in residential areas with 17.46% sunken greenbelt and 40.85% permeable pavement; the time of the pipe outlet in full status can be shortened by 30–200 min in different rainfall return periods.
Through the reconstruction of the sponge residential area, the infiltration and storage capacity of the rainwater could be improved, and the surface runoff could be effectively reduced. The reduction rate of outlet flow in the sub-catchment area is 30–100%, and the runoff reduction rate in the peak period is 30–70%. With the increase of the rainfall return period, the improvement range of the infiltration increased from 23.36% to 39.54%, the improvement range of the storage capacity for rainwater decreased from 14.36% to 8.06%, and the reduction degree of surface runoff increased from 37.73% to 47.43%.
The rainwater collected in sponge communities is mainly used for flushing and irrigation. The study of the Zi-Jing residential unit showed that for the rainfall scenario with a recurrence period of more than five years, the 24 h rainfall collected by the 765 m3 capacity could meet the water consumption of 5000 residents for the flushing and afforestation of the residential unit for 3–5 days. Water scarcity problems in Beijing could be mitigated through the optimization of the rainwater resource utilization system in the future.

Author Contributions

Conceptualization, J.Z. and H.W.; methodology, W.L.; software, H.W.; validation, W.L., H.W. and J.Z.; formal analysis, W.L.; investigation, Z.L. and H.Z.; resources, Z.L.; data curation, Y.P.; writing—original draft preparation, W.L.; writing—review and editing, W.L., L.Y. and T.H.; visualization, H.Z. and T.H.; supervision, J.Z.; project administration, J.Z.; funding acquisition, J.Z. and L.Y. All authors have read and agreed to the published version of the manuscript.

Funding

This research was supported by the Beijing Municipal Natural Science Foundation (grant number 8214046), the Open Research Fund of State Key Laboratory of Simulation and Regulation of Water Cycle in River Basin, China Institute of Water Resources and Hydropower Research (grant number IWHR-SKL-202105), the Major Science and Technology Projects of Zhongshan City (grant number 2019A4035), the Technology Development Project of Guangzhou Municipal Engineering Design and Research Institute Co., Ltd. (grant number KY-2020-003), the National Natural Science Foundation of China (grant number 52192671), and the General Science and Technology Projects of the Beijing Municipal Education Commission (KM202210005017).

Institutional Review Board Statement

Not applicable.

Informed Consent Statement

Not applicable.

Data Availability Statement

Not applicable.

Conflicts of Interest

The authors declare no conflict of interest.

References

  1. Liu, H.; Jia, Y.; Niu, C. “Sponge city” concept helps solve China’s urban water problems. Environ. Earth Sci. 2017, 76, 1–15. [Google Scholar] [CrossRef]
  2. Zhou, J.; Liu, J.; Yan, D.; Wang, H.; Wang, Z.; Shao, W.; Luan, Y. Dissipation of water in urban area, mechanism and modelling with the consideration of anthropogenic impacts: A case study in Xiamen. J. Hydrol. 2019, 570, 356. [Google Scholar] [CrossRef]
  3. Schreider, S.Y.; Smith, D.I.; Jakeman, A.J. Climate Change Impacts on Urban Flooding. Clim. Chang. 2000, 47, 91–115. [Google Scholar] [CrossRef]
  4. Kermanshah, A.; Derrible, S.; Berkelhammer, M. Using Climate Models to Estimate Urban Vulnerability to Flash Floods. J. Appl. Meteorol. Clim. 2017, 56, 2637–2650. [Google Scholar] [CrossRef]
  5. Wang, X.; Kinsland, G.; Poudel, D.; Fenech, A. Urban flood prediction under heavy precipitation. J. Hydrol. 2019, 577, 123984. [Google Scholar] [CrossRef]
  6. Hu, M.; Zhang, X.; Li, Y.; Yang, H.; Tanaka, K. Flood mitigation performance of low impact development technologies under different storms for retrofitting an urbanized area. J. Clean Prod. 2019, 222, 373–380. [Google Scholar] [CrossRef]
  7. Wang, H.; Zhou, J.; Tang, Y.; Liu, Z.; Kang, A.; Chen, B. Flood economic assessment of structural measure based on integrated flood risk management: A case study in Beijing. J. Environ. Manag. 2021, 280, 111701. [Google Scholar] [CrossRef]
  8. Zhang, S.; Li, Y.; Ma, M.; Song, T.; Song, R. Storm Water Management and Flood Control in Sponge City Construction of Beijing. Water 2018, 10, 1040. [Google Scholar] [CrossRef]
  9. Zhang, S.; Zhang, J.; Yue, T.; Jing, X. Impacts of climate change on urban rainwater harvesting systems. Sci. Total Environ. 2019, 665, 262–274. [Google Scholar] [CrossRef]
  10. Liu, W.; Chen, W.; Peng, C.; Wu, L.; Qian, Y. A water balance approach to assess rainwater availability potential in urban areas: The case of Beijing, China. Water Supply 2015, 15, 490–498. [Google Scholar] [CrossRef] [Green Version]
  11. Chen, W.; Gao, S. Research on Rainwater Management from the Perspective of Sponge City. IOP Conf. Ser. Earth Environ. Sci. 2019, 252, 32064. [Google Scholar] [CrossRef]
  12. De Sá Silva, A.C.R.; Bimbato, A.M.; Balestieri, J.A.P.; Vilanova, M.R.N. Exploring environmental, economic and social aspects of rainwater harvesting systems: A review. Sustain. Cities Soc. 2022, 76, 103475. [Google Scholar] [CrossRef]
  13. Zhou, J.; Liu, J.; Shao, W.; Yu, Y.; Zhang, K.; Wang, Y.; Mei, C. Effective Evaluation of Infiltration and Storage Measures in Sponge City Construction: A Case Study of Fenghuang City. Water 2018, 10, 937. [Google Scholar] [CrossRef]
  14. China Ministry of Housing and Urban-Rural Construction (MHURC). Technical Guide for Sponge City Construction—Construction of Rain Water System for Low Impact Development; MHURC: Beijing, China, 2014; p. 88. [Google Scholar]
  15. Li, Q.; Wang, F.; Yu, Y.; Huang, Z.; Li, M.; Guan, Y. Comprehensive performance evaluation of LID practices for the sponge city construction: A case study in Guangxi, China. J. Environ. Manag. 2019, 231, 10–20. [Google Scholar] [CrossRef] [PubMed]
  16. Chi, Y.; Bai, G.; Dong, H. A New Multicriteria Decision-Making Method for the Selection of Sponge City Schemes with Shapley—Choquet Aggregation Operators. Math. Probl. Eng. 2021, 2021, 1–16. [Google Scholar] [CrossRef]
  17. You, L.; Xu, T.; Mao, X.; Jia, H.; Wre, D. Site-Scale LID-BMPs Planning and Optimization in Residential Areas. J. Sustain. Water Built Environ. 2018, 5018001–5018004. [Google Scholar] [CrossRef]
  18. Jianshi, L.; Jing, Y.; Hao, Z. The Control Index for the Construction of Sponge City in the Residential Area: A Case Study of Nanjing Jiangbei New District. J. Environ. Public Health 2022, 2022, 2209161. [Google Scholar] [CrossRef]
  19. Jiayu, H.; Manhua, L.; Yang, S. Research on Residential Quarters Based on the Concept of Sponge City. Sci. Discov. 2019, 7, 385–389. [Google Scholar] [CrossRef]
  20. Shen, J.; Ma, G.; Chun, T. Optimized Design of Hard Landscape in Residential Area Under the Concept of Sponge City—A Case Study of Road Planning and Buildings’ Aprons. In Proceedings of the 2015 International Conference on Education, Management and Systems Engineering (EMSE 2015), Phuket, Thailand, 23 August 2015; pp. 222–225. [Google Scholar]
  21. Hou, J.; Wang, X.; Li, B.; Gao, X.; Huang, M.; Han, H.; Shen, R. Refined Simulation Method of the Rainfall—Runoff Processes in a Residential Area with LID Measures. J. Hydrol. Eng. 2021, 26, 4021031–4021038. [Google Scholar] [CrossRef]
  22. Coffman, L.; Cheng, M.S.; Weinstein, N.; Clar, M. Low-impact development hydrologic analysis and design. Water Resour. Urban Environ. 1998, 1–8. [Google Scholar]
  23. Lin, X.; Ren, J.; Xu, J.; Zheng, T.; Cheng, W.; Qiao, J.; Huang, J.; Li, G. Prediction of Life Cycle Carbon Emissions of Sponge City Projects: A Case Study in Shanghai, China. Sustainability 2018, 10, 3978. [Google Scholar] [CrossRef] [Green Version]
  24. Su, D.; Zhang, Q.H.; Ngo, H.H.; Dzakpasu, M.; Guo, W.S.; Wang, X.C. Development of a water cycle management approach to Sponge City construction in Xi’an, China. Sci. Total Environ. 2019, 685, 490–496. [Google Scholar] [CrossRef] [PubMed]
  25. Wang, Q.; Ma, Z.; Yuan, X.; Wang, J.; Mu, Z.; Zuo, J.; Zhang, J.; Hong, J.; Wang, S. Is cement pavement more sustainable than permeable brick pavement? A case study for Jinan, China. J. Clean Prod. 2019, 226, 306–315. [Google Scholar] [CrossRef]
  26. Liu, Z.; Li, W.; Wang, L.; Li, L.; Xu, B. The scenario simulations and several problems of the Sponge City construction in semi-arid loess region, Northwest China. Landsc. Ecol. Eng. 2022, 18, 95–108. [Google Scholar] [CrossRef]
  27. Shamsi, U.M. Storm-water management implementation through modeling and GIS. J. Water Resour. Plan. Manag. ASCE 1996, 122, 114–127. [Google Scholar] [CrossRef]
  28. Ji, M.; Bai, X. Construction of the sponge city regulatory detailed planning index system based on the SWMM model. Environ. Technol. Innov. 2021, 23, 101645. [Google Scholar] [CrossRef]
  29. Si, S.; Li, J.; Jiang, Y.; Wang, Y.; Liu, L. The Response of Runoff Pollution Control to Initial Runoff Volume Capture in Sponge City Construction Using SWMM. Appl. Sci. 2022, 12, 5617. [Google Scholar] [CrossRef]
  30. Beven, K. Robert E. Horton’s perceptual model of infiltration processes. Hydrol. Process. 2004, 18, 3447–3460. [Google Scholar] [CrossRef]
  31. Davidsen, S.; Löwe, R.; Ravn, N.H.; Jensen, L.N.; Arnbjerg-Nielsen, K. Initial conditions of urban permeable surfaces in rainfall-runoff models using Horton’s infiltration. Water Sci. Technol. 2018, 77, 662–669. [Google Scholar] [CrossRef]
  32. Zhang, Z.; Liu, D.; Zhang, R.; Li, J.; Wang, W. The impact of rainfall change on rainwater source control in Beijing. Urban Clim. 2021, 37, 100841. [Google Scholar] [CrossRef]
  33. Han, H.; Hou, J.; Xu, Z.; Jing, H.; Gong, J.; Zuo, D.; Li, B.; Yang, S.; Kang, Y.; Wang, R. A GPU-Accelerated Hydrodynamic Model for Urban Rainstorm Inundation Simulation: A Case Study in China. KSCE J. Civ. Eng. 2022, 26, 1494–1504. [Google Scholar] [CrossRef]
  34. Yao, Y.; Hu, C.; Liu, C.; Yang, F.; Ma, B.; Wu, Q.; Li, X.; Soomro, S.E.H. Comprehensive performance evaluation of stormwater management measures for sponge city construction: A case study in Gui’an New District, China. J. Flood Risk Manag. 2022, e12834. [Google Scholar] [CrossRef]
  35. Chen, W.; Zheng, M.; Gao, Q.; Deng, C.; Ma, Y.; Ji, G. Simulation of surface runoff control effect by permeable pavement. Water Sci. Technol. 2021, 83, 948–960. [Google Scholar] [CrossRef]
  36. Qin, Z.; Yao, Y.; Zhao, J.; Fu, H.; Zhang, S.; Qiu, L. Investigation of migration rule of rainwater for sponge city roads under different rainfall intensities. Environ. Geochem. Health 2021, 1–13. [Google Scholar] [CrossRef]
  37. Zheng, Z.; Duan, X.; Lu, S. The application research of rainwater wetland based on the Sponge City. Sci. Total Environ. 2021, 771, 144475. [Google Scholar] [CrossRef]
  38. Li, J.; Mu, C.; Deng, C.; Ma, M. Hydrologic-environmental effects of sponge city under different spatial scales. J. Water Reuse Desal. 2020, 10, 45–56. [Google Scholar] [CrossRef] [Green Version]
Figure 1. Method flow of this research.
Sustainability 14 12372 g001
Figure 2. Location map of Zi-Jing community.
Sustainability 14 12372 g002
Figure 3. Rainfall distribution in Beijing from 2011 to 2020.
Sustainability 14 12372 g003
Figure 4. LID facility floor plan for Zi-Jing community.
Sustainability 14 12372 g004
Figure 5. Design rainfall process for each return period of 24 h.
Sustainability 14 12372 g005
Figure 6. Sub-catchment area division and SWMM model of Zi Jing community after reconstruction.
Sustainability 14 12372 g006
Figure 7. Comparison of water depth of outlet pipe before and after sponge transformation.
Sustainability 14 12372 g007
Figure 8. Comparison of discharge process and flow reduction rate of outlet before and after sponge transformation.
Sustainability 14 12372 g008
Figure 9. Comparison of storage volume before and after sponge transformation.
Sustainability 14 12372 g009
Figure 10. Comparison of storage, runoff, and infiltration before and after sponge transformation.
Sustainability 14 12372 g010
Table 1. Underlying surface area characteristics of Zi-Jing community before and after sponge city transformation.
ItemGreen LandBuilding Roof
Green Land (m2)Sunken Greenbelt (m2)Sunken Greenbelt ratio (%)Roof (m2)
Before transformation35,9000025,500
After transformation15,30020,6005725,500
ItemHardened GroundStoring Rainwater
Hardened Ground (m2)Permeable Hardened Ground (m2)Permeable Hardened Ground Ratio (%)Storage Pond (m3)
Before transformation56,600000
After transformation840048,20085765
Table 2. Land use structure of catchment subdivision.
ItemsA1A2A3A4Total
Green land (m2)24,6002004500660035,800
Sunken greenbelt (m2)16,3000.001200310020,600
Sunken greenbelt ratio (%)66.230.0026.6746.9757.65
Hardened ground (m2)36,30066008900480056,600
Permeable hardened ground (m2)29,20063008500420048,200
Permeable hardened ground ratio (%)80.4495.4595.5187.5085.16
Roof (m2)16,00039002600300025,500
Storage pond volume (m3)4801177890765
Storage depth (mm/d)18.633.314.718.619.5
Total area (m2)76,90010,50016,00014,600118,000
Table 3. Calibration results of the model parameters.
ParametersMeaningUnitCalibration Results
SlopeMean percentage slope of sub-catchment area%1.39
S-ImpervStorage depth of impervious surfacemm2.54
NSrate- ImpervPercentage of impermeable area without depression water storage%25
S-PervStorage depth of pervious surfacemm5.08
Max RateInitial infiltration capacitymm/h76.2
Min RateStable infiltration capacitymm/h3.3
DecayDecay index of infiltration capacityL/h4
N-PervManning coefficient in pervious area/Permeable pavement 0.1
vegetation or green space 0.2
N-ImpervManning coefficient in impervious area/Roof/ground:0.02
RoughnessPipeline Manning coefficient/0.0147
Table 4. LID facility parameters values.
LID FacilityParameter NameValue BasisValues
Bioretention ponds
Sunken greenbelt
Rainwater garden
Dike dam height (mm)Design drawings100
Soil layer thickness (mm)200/500
Aquifer thickness (mm)400
Vegetation volume fractionDesign criteria0.1
Aquifer porosity ratioSWMM manual0.5
Aquifer seepage rate (mm/h)3.3
Grassed swalesDike dam height (mm)Design drawings300
Surface slope (%)1.5
Side slope3
Vegetation volume fractionDesign criteria0.1
Surface roughness0.02
Permeable parking lot
Permeable concrete
Dike dam height (mm)Design drawings0
Surface slope (%)1.5
Surface layer thickness (mm)65/80
Impermeable surface fractionDesign criteria0
Surface porosity ratioDesign drawings0.09/0.11
Surface seepage rate (mm/h)360
Aquifer thickness (mm)200
Vegetation volume fractionSWMM manual0
Aquifer porosity ratio0.5
Aquifer seepage rate (mm/h)3.3
Jam factors0
Surface roughnessDesign criteria0.025/0.02
Infiltration ditchDike dam height (mm)Design drawings50
Surface slope (%)1.5
Aquifer thickness (mm)400
Surface roughnessDesign criteria0.02
Aquifer porosity ratioSWMM manual0.5
Aquifer seepage rate (mm/h)3.3
Table 5. First fill-up times of each sub-catchment for different rainfall return periods.
3-Year5-Year10-Year20-Year50-Year
A119:006:305:505:305:15
A2\17:4517:4017:4017:25
A318:1017:2517:105:505:20
A4\17:3017:2017:106:25
Publisher’s Note: MDPI stays neutral with regard to jurisdictional claims in published maps and institutional affiliations.

