Article

Activated Biochar-Based Organomineral Fertilizer Delays Nitrogen Release and Reduces N2O Emission

by
Valéria Viana Pereira
1,
Marina Moura Morales
2,
Dalton Henrique Pereira
1,
Fabiana Abreu de Rezende
3,
Ciro Augusto de Souza Magalhães
3,
Larissa Borges de Lima
1,
Ben Hur Marimon-Junior
4 and
Fabiano André Petter
1,*
1
Instituto de Ciências Agrárias e Ambientais, Universidade Federal de Mato Grosso, Câmpus Universitário de Sinop, Sinop 78550-728, Mato Grosso, Brazil
2
Embrapa Florestas, Colombo 83411-000, Paraná, Brazil
3
Embrapa Agrossilvipastoril, Sinop 78550-970, Mato Grosso, Brazil
4
Departamento de Ciências Biológicas, Universidade do Estado de Mato Grosso, Câmpus Universitário de Nova Xavantina, Nova Xavantina 78690-000, Mato Grosso, Brazil
*
Author to whom correspondence should be addressed.
Sustainability 2022, 14(19), 12388; https://doi.org/10.3390/su141912388
Submission received: 22 August 2022 / Revised: 20 September 2022 / Accepted: 22 September 2022 / Published: 29 September 2022

Abstract

:
Leaching and nitrous oxide (N2O) emissions can represent substantial nitrogen (N) losses from chemical fertilizers, and slow-release fertilizers (SRFs) can mitigate these effects. Thus, biochar can be an alternative from an agronomic and environmental point of view to synthesize SRFs due to its physicochemical characteristics. We investigated the effect of nitrogenous organomineral fertilizers (OMF-N) formulated based on activated biochar on N losses by leaching and N2O emissions. The OMF-N were developed from a dry mechanical pelleting process with different biochar and urea proportions (2:1; 1:2, and 1:4). Three experiments were conducted using four fertilizer sources (urea, OMF-N 2:1, OMF-N 1:2, and OMF-N 1:4): i. to analyze the kinetics of N release from OMF-N at times: 5, 15, 30, 60, 90, and 120 min; ii. for N2O emission analysis determined at 3, 6, 10, 14, 24, 44, 54, 64, 74, 84, 104, and 118 days after application to the soil; and iii. for a double factorial design that was adopted to analyze N leaching, consisting of the combination of applying 160 kg N ha−1 of fertilizers in PVC columns at different depths (20, 40, 60, and 80 cm) and analyzed at five times (1, 7, 14, 21, and 28 days). FTIR spectroscopic analysis, specific surface area, porosity, and surface morphology showed physicochemical interactions of N of the OMF with biochar; the N from the OMF interacts physically and chemically binds to the functional surfaces of biochar, delaying the dissolution flow. The OMF-N proved capable of retaining 48% to 60% more NH4+ and reduced the release of Ntotal from urea from 27% to 60%, as well as reduced N2O emissions from 47% to 66%. Although absolute CO2 emissions intensified with the application of OMF-N, its use provides C sequestration in the soil to due to the recalcitrant C of the biochar, which results in a positive input-output balance in the system. The NO3 concentration profiles revealed that the OMF-N application was able to reduce leaching in the soil to a depth of 80 cm. These studies enabled better understanding of the processes involved in the biochar:urea interaction and revealed that biochar can be used as an organic matrix in the synthesis of SRF.

1. Introduction

With the widespread use of chemical fertilizers, negative impacts on the environment are receiving increasing attention worldwide, as the estimated loss of fertilizers to the environment is around 40–70% N, 80–90% P, and 50–70% K [1,2]. The indiscriminate use of nitrogen fertilizers has allowed successive gains in agricultural productivity; however, the NO3 leaching, NH3 volatilization, and N2O emission processes cause high N losses, resulting in low N utilization efficiency, as well as high economic costs and potential for environmental pollution [3].
Nutrient losses from chemical fertilizers can be minimized by using slow or controlled-release fertilizers (SRFs). These technologies have gained more and more global attention as they provide a slow release of nutrients without affecting the synchrony with the demand required by the crop, thus ensuring availability for plants and reducing losses in the environment [1].
SRFs are generally produced by coating the conventional fertilizer granule with polymers derived from fossil fuels (i.e., petroleum), such as polyethylene, polystyrene, and resins [4]. Although these materials have been shown to be useful to increase the efficiency of nutrient use and decrease losses, they can be toxic and non-biodegradable, in addition to having a high production cost [5].
In this context, biochar with its porous carbonaceous structure, high surface area, and abundant functional groups has been intensively studied as an adsorbent, and more recently as a promising organic matrix to produce SRFs [6,7]. The characteristics of biochar allow chemical elements which are essential to plants to be retained on its surface by physical and chemical adsorption. In addition, it is possible to increase the number of pores and functional groups on the biochar surface through the activation process to improve the interaction abilities with chemical elements of interest [8].
Biochar can be obtained from different raw materials, with emphasis on agro-industrial waste, and thus can present different physicochemical characteristics with objectives ranging from use as soil conditioner to pesticide adsorption, removal of pollutants such as toxic metals, greenhouse gas reduction, to fertilizer synthesis. [9,10,11,12,13,14]. In the case of fertilizers, depending on the type of biochar, the composite formed with the inorganic matrix of mineral fertilizers can result in interactions which have not yet been fully elucidated, and these interactions govern the response magnitude to the N release efficiency from these fertilizers. Thus, central questions need answers, such as: Would biochar from wood industry residues (environmental liabilities) constitute an organic matrix capable of controlling the N release flow from organomineral nitrogen fertilizers? If so, could controlling the N release flow from biochar-based organomineral nitrogen fertilizers reduce GHG emissions and soil N leaching?
In order to elucidate these questions, the study was guided by an agronomic and environmental perspective supported by the following basic hypotheses: (i) activated biochar reduces the flow of mineral N dissolution when used as an organic matrix; (ii) controlling the N release flow in an organomineral nitrogen fertilizer based on activated biochar reduces N2O emissions; (iii) controlling the N release flow in an organomineral nitrogen fertilizer based on activated biochar reduces the leaching of NO3 in the soil; and (iv) application of an organomineral nitrogen fertilizer based on activated biochar has the potential to sequester C in the soil and thus fit into a regenerative agriculture model.
Therefore, the objective of this study was to investigate the effect of organomineral fertilizers (OMF-N) formulated with activated biochar on N losses in NO3 and NH4+ leaching and on N2O emissions.

2. Materials and Methods

2.1. Study Site

The experiments were carried out on the premises of Embrapa Agrossilvipastoril and in a greenhouse at the Federal University of Mato Grosso (UFMT) in Sinop, Mato Grosso, Brazil, from November 2020 to October 2021.

2.2. Activated Biochar Production

The biochar came from the slow pyrolysis of sawmill residues from native species obtained in the Sinop, MT region, produced in the pyrolysis shed of Embrapa Agrossilvipastoril, Sinop, Mato Grosso, Brazil. The batch reactor with the capacity to process about 9 kg of biomass per batch was adjusted to pyrolyze the sawdust at 450 °C with a retention time of 40 min and activation with the injection of water vapor (3 L of water) in the last 15 min. The physicochemical composition of activated biochar is shown in Table 1.
The C, N, and S contents were determined by elemental analysis via the CNHS Vario TOC Cube analyzer. Nutrients were determined according to fertilizer analysis methodology [15]. The analysis of specific surface area and pore size was performed according to the physical adsorption method in a Quantachrome NOVA 4200e surface area analyzer.

2.3. Preparation of Organomineral Nitrogen Fertilizers (OMF-N) Based on Activated Biochar

The OMF-N were developed from the mixture of biochar and urea proportions (m:m) (2:1; 1:2, and 1:4) which resulted in the following N contents for the OMF-N: 16%, 32%, and 36%, respectively. The urea was initially placed in a rotor mill in the defined proportions and then the biochar and urea were uniformly mixed without the use of binders in a pelletizer (Biobrax PBX-100/05), which resulted in pellets with an average of 5.30 mm in length and 3.87 mm in diameter. The pellets were evaluated for hardness using a Texture Analyzer TA HD PLUS device (Stable Micro Systems) [16]. The results obtained corresponded to 17.6, 12, and 1.82 kgf, respectively, for the OMF-N 2:1, 1:2, and 1:4 formulations.

2.4. Fourier Transform Infrared (FTIR) Spectroscopic Analysis

OMF-N samples were submitted to FTIR spectroscopy in order to verify the physicochemical interaction of activated biochar with urea. To do so, an attenuated total reflectance (ATR) mid-IR spectrometer (Agilent Technologies Cary 630, Dansbury, CT, USA) was used. The Cary 630 laboratory spectrometer is interfaced with a custom three-reflection diamond ATR sampling accessory with a 1 mm diameter sampling surface and an active area of 200 μm. IR spectra were collected using the Agilent MicroLab PC software program (Agilent Technologies, Dansbury, CT, USA) in the spectral region between 4000 and 650 cm−1. The resolution used was 8 cm−1. Each spectrum was composed of the average of 64 samples (64 scans). The spectrometer crystal was cleaned with isopropanol (PA) at each sample application and a new background spectrum (I0) background was performed before each sample application.

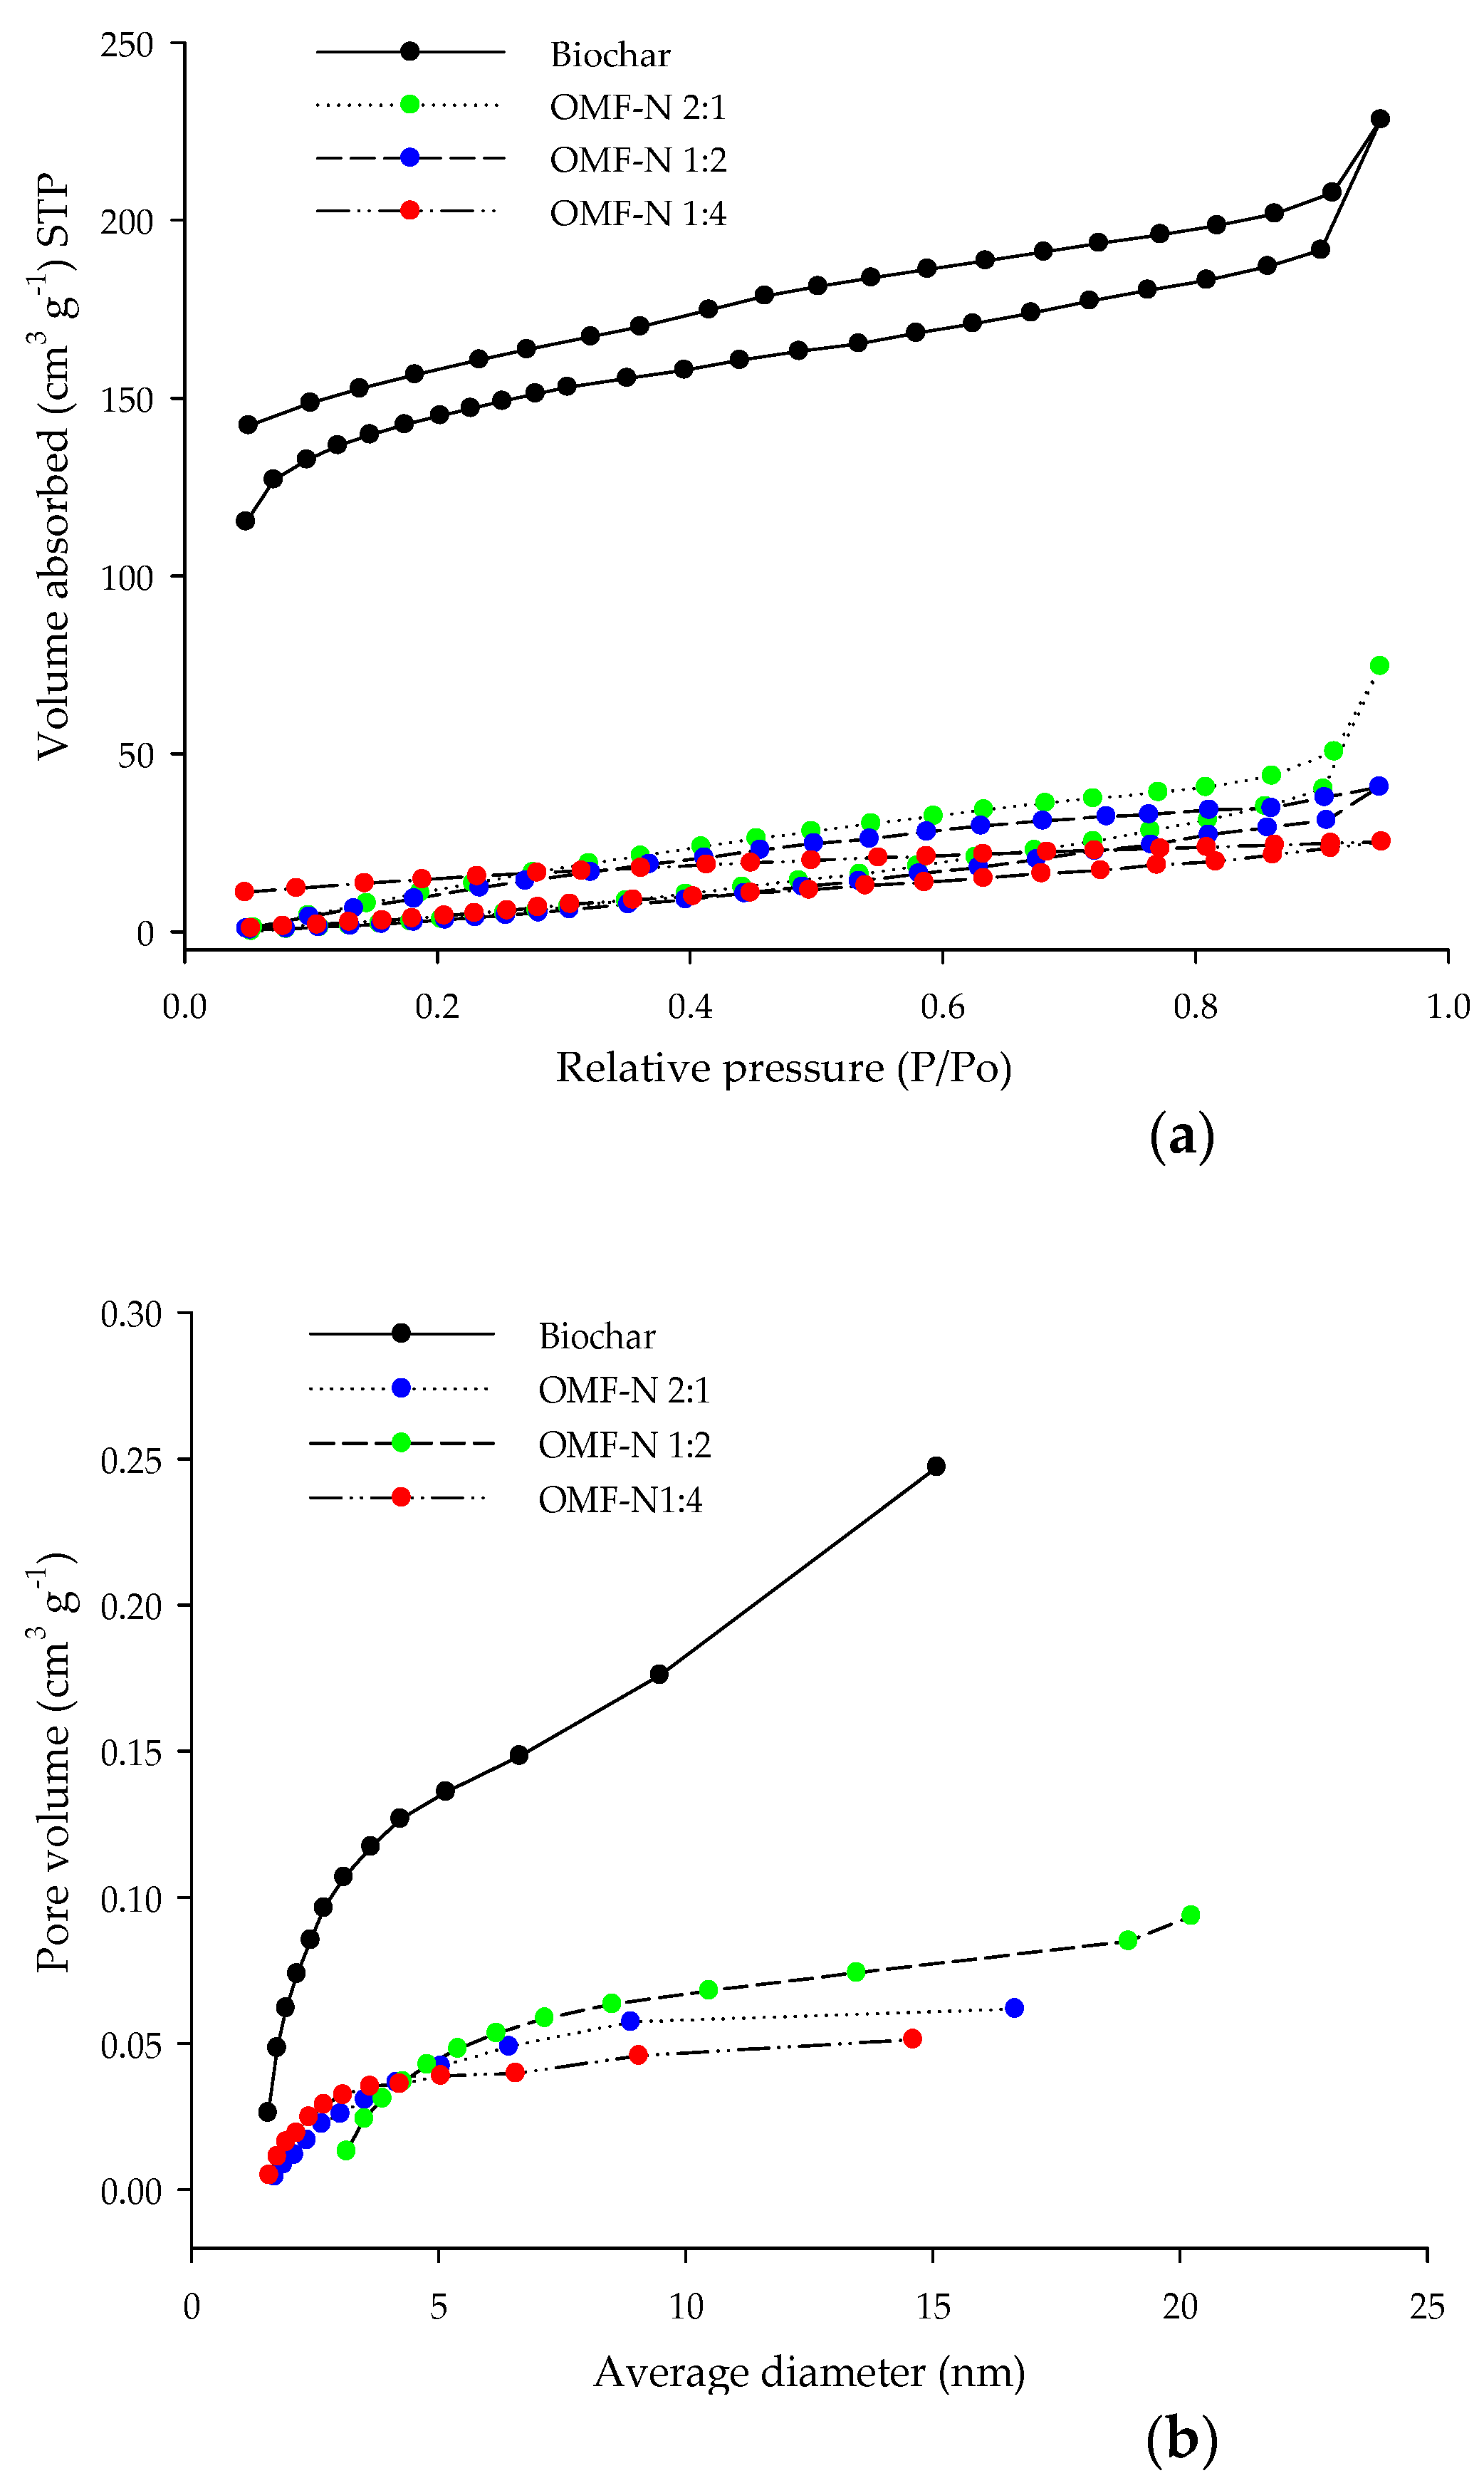
2.5. Specific Surface Area (SSA) and Pore Size and Distribution

The biochar and OMF-N samples were subjected to degassing and removal of other surface impurities through vacuum pre-treatment at 105 °C for 12 h. SSA was determined by nitrogen adsorption isotherms using the Brunauer–Emmett–Teller (BET) method [17]. The pore size and distribution were characterized using the theory of progressive pore emptying with decreasing pressure [18].

2.6. Scanning Electron Microscopy (SEM) and Energy Dispersive X-ray Spectroscopy (EDS)

The surface morphology of the biochar and the OMF-N were characterized by scanning electron microscopy (SEM-JSM-6610-Jeol) equipped with an X-ray energy dispersive spectroscopic device (EDS-Thermo Scientific NSS) with an acceleration voltage of 10–15 kV and 1000 magnification.

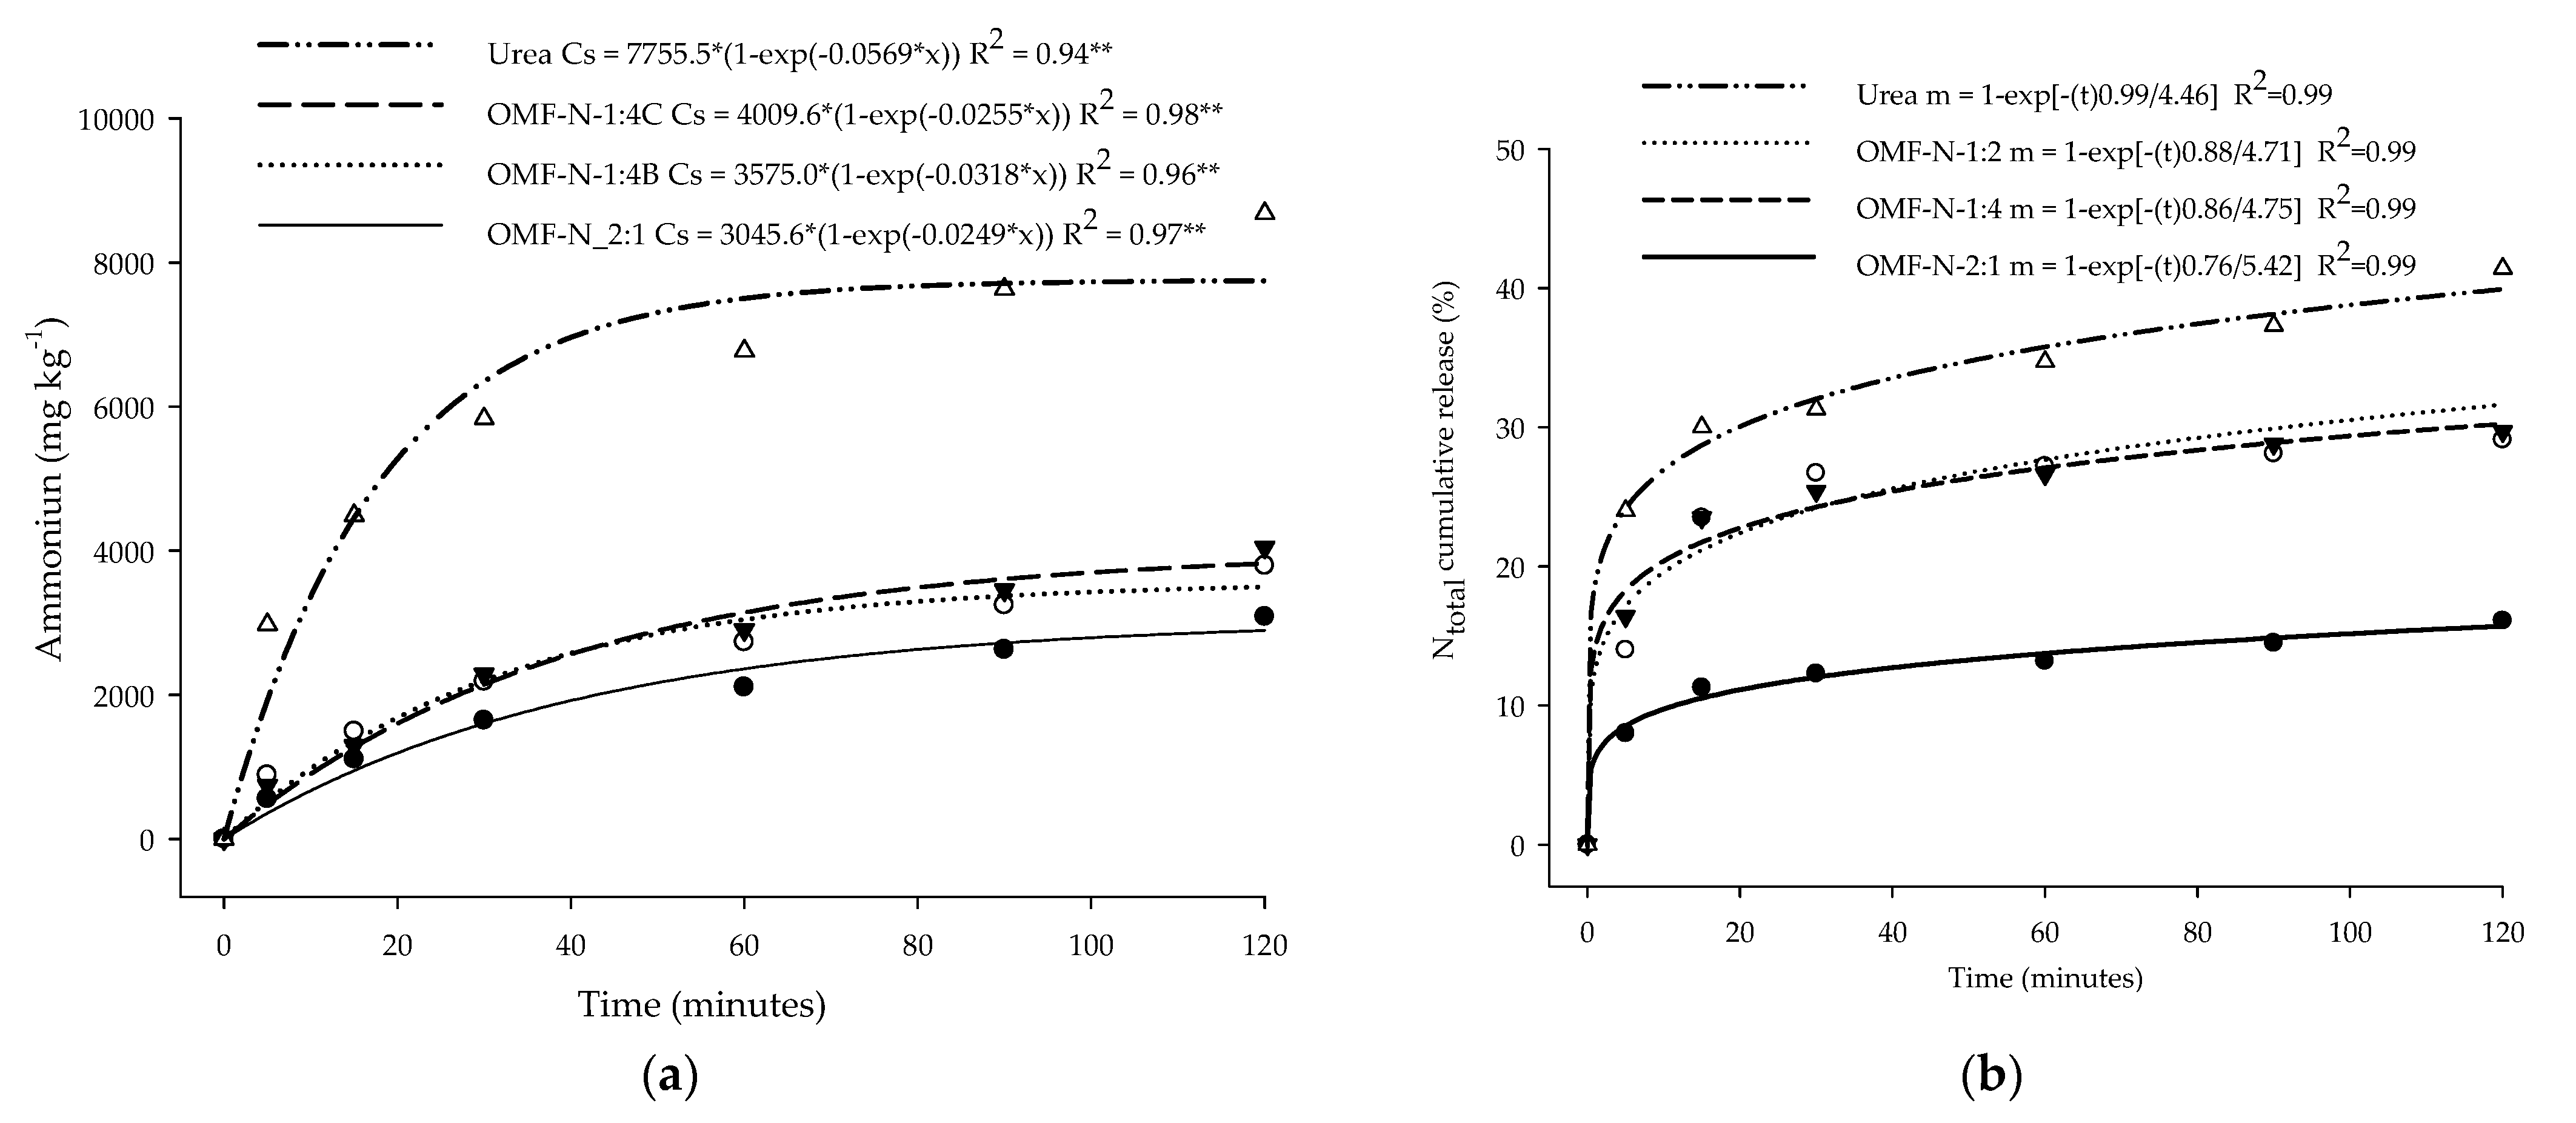
2.7. OMF-N Solubilization Kinetics

The nitrogen solubilization kinetics in OMF-N was performed in triplicate for the following times: 5, 15, 30, 60, 90, and 120 min, stirring 1 g of the samples in 50 mL of water at 96 cycles per minute. After filtering the samples through a 45 μm filter, the total nitrogen was measured by the Total Organic Carbon (TOC) Analyzer in liquid mode (vario TOC cube model, Elementar Analysensysteme GmbH). The injection volume was adjusted to 0.2 mL of the sample diluted (1:1) with distilled water. The combustion column was maintained at 690 °C throughout the analysis and compounds measured by a near infrared detector (NDIR). A calibration curve (20 to 100 ppm of C) was performed with potassium biphthalate.

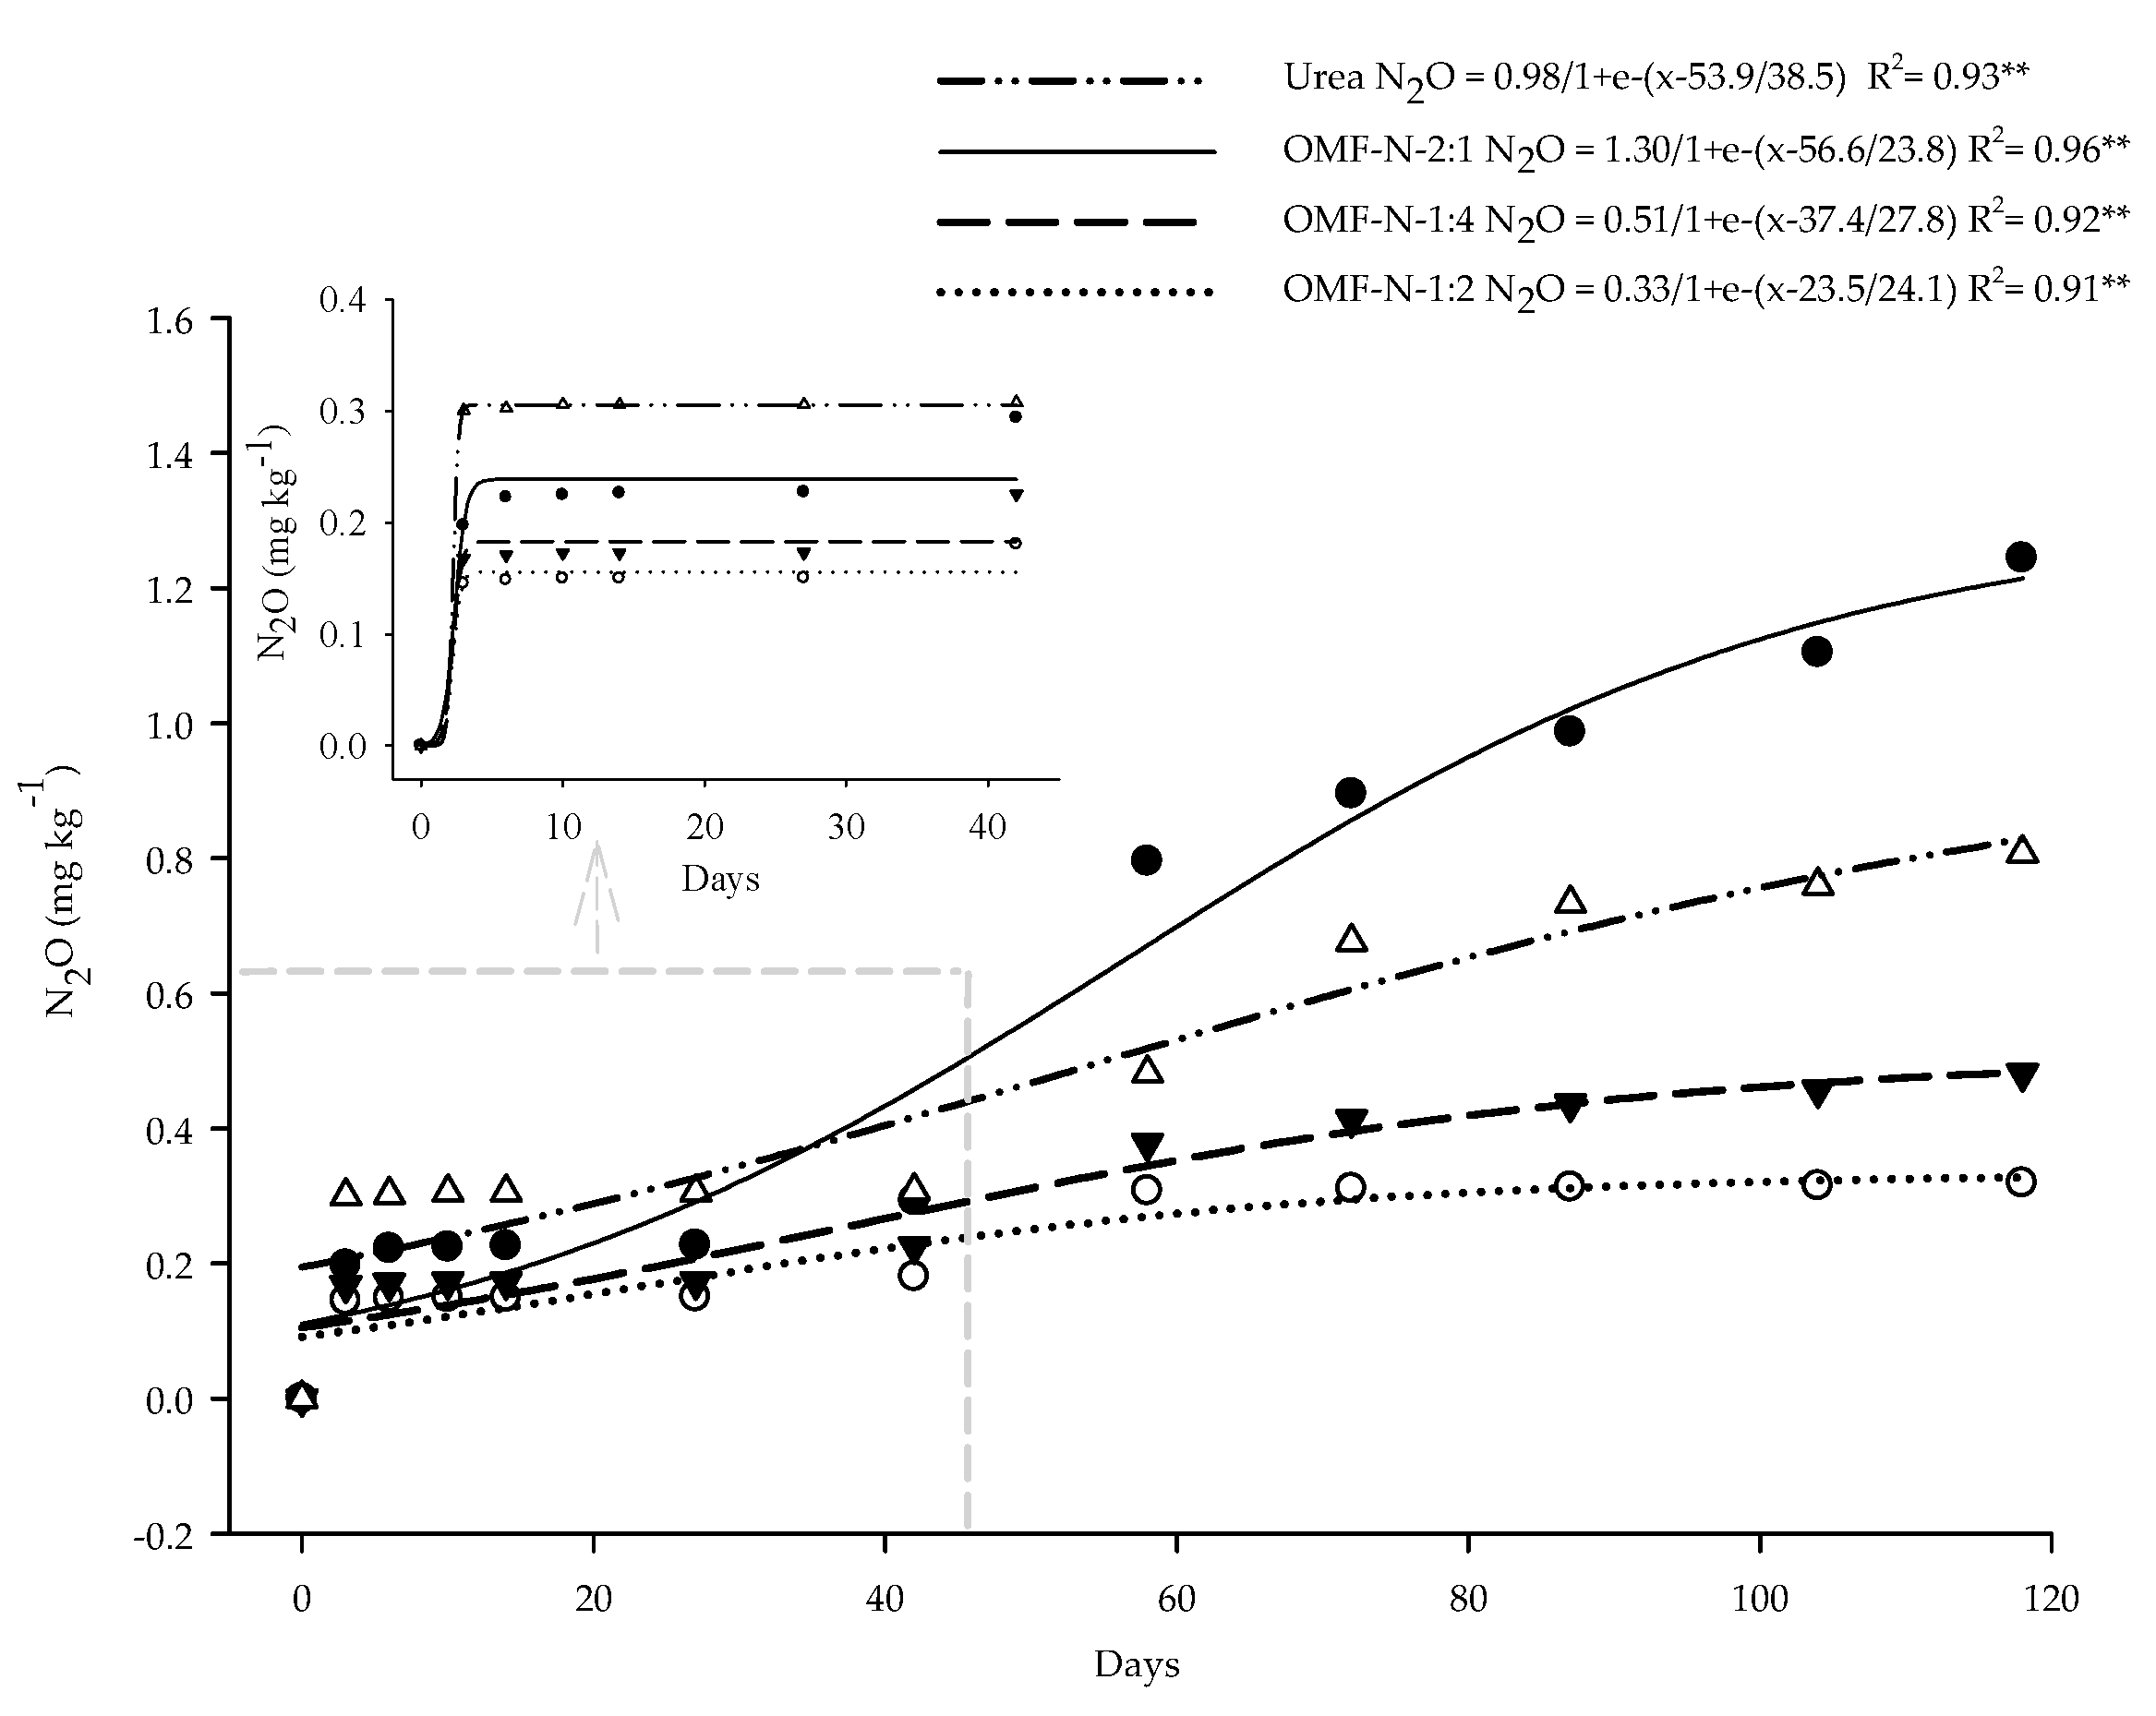
2.8. OMF-N N2O and CO2 Emission Kinetics
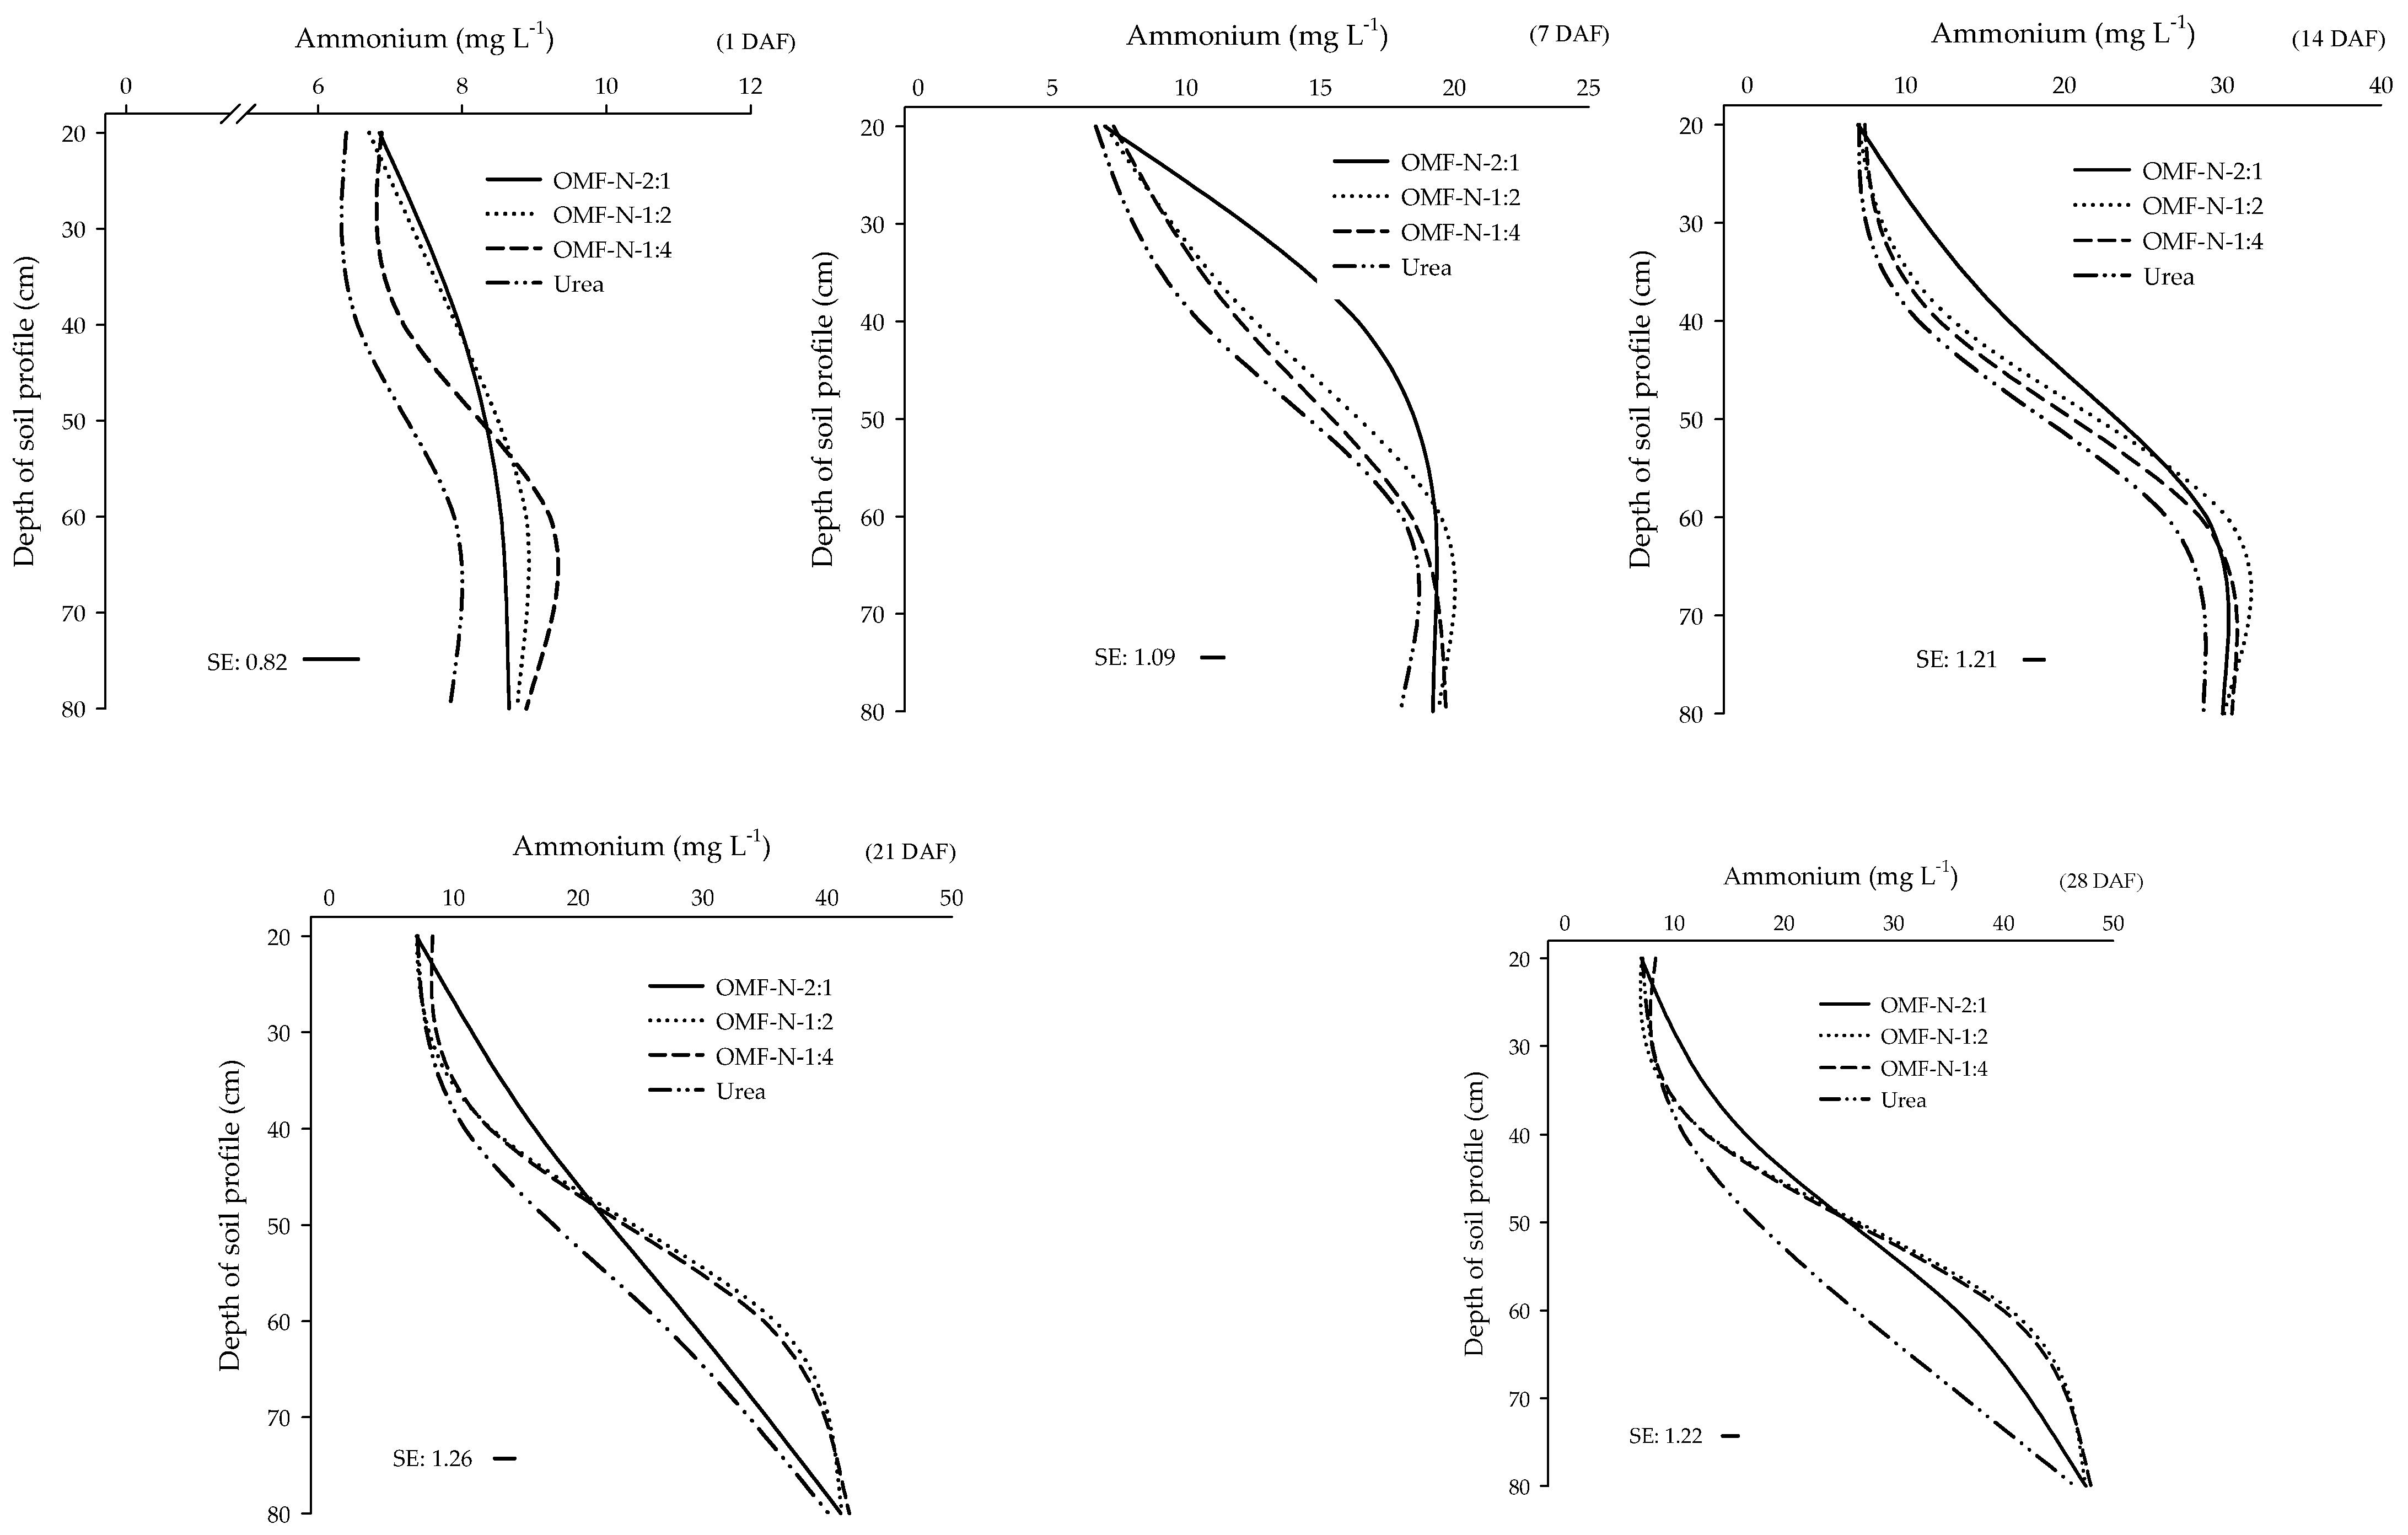
The N2O and CO2 emission kinetics were performed by incubating urea and OMF-N at 25 °C under field capacity, which is the optimal condition for most microbial processes to maximize microbial activity. Thus, 500 mg of urea and OMF-N were incubated in 1 × 1 mm open mesh screens and covered in 30 g of soil. The calculations were performed with due compensation for the N content of the fertilizer sources. CO2 and N2O were measured at 3, 6, 10, 14, 24, 44, 54, 64, 74, 84, 104, and 118 days in gas chromatography equipped with a flame ionization detector (FID) for CO2 and an electron capture detector for N2O, both with column and injector. Ultrapure nitrogen was used as carrier gas at an inlet pressure of 300 kPa (40 psi) and as detector make-up gas at a flow rate of 25 mL min−1.

2.9. NH4+ and NO3 Leaching in Soil Fertilized with Urea and OMF-N

Soil was collected on a rural property in the municipality of Sinop, Mato Grosso, at a depth of 0 to 20 cm. The soil was classified as Dystrophic Red Yellow Latosol, medium texture (Clay: 258 g kg−1; Silt: 50 g kg−1 and Sand: 692 g kg−1), with the following chemical characteristics: pH (H2O): 5.8; P: 64.4 mg/dm3 (Mehlich method); K+: 70.60 mg/dm3; Ca2+: 3.22 cmolc/dm3; Mg2+: 1.10 cmolc/dm3; Al3+: 0.00 cmolc/dm3; H + Al: 3.40 cmolc/dm3; V%: 57; CEC: 7.9 cmol/dm3; O.M.: 3.02 g/dm3; Fe: 114 mg/dm3; Mn: 8.8 mg/dm3; Zn: 3.7 mg/dm3; and Cu: 0.9 mg/dm3. The deformed soil samples were taken to a greenhouse, air dried, sieved, and homogenized. The columns to simulate soil depths (20, 40, 60, and 80 cm) were composed by the superposition of four PVC rings, 15 cm in diameter and 20 cm in height, joined by adhesive tape. A hole was made in the lower portion of each ring to insert the hoses, with removable covers, to collect the leaching water. Each soil column was filled with 14 kg of soil, and they were irrigated after 24 h to reach the maximum water holding capacity. Fertilization was performed 24 h after irrigation, making a superficial ring in the soil, applying the fertilizers evenly, and then covered by a thin layer of soil. Leaching water collections took place on days 1, 7, 14, 21, and 28 days after fertilization. Next, 2 L of artesian well water was added to the surface of the column on the day of each collection, while 1 L of water was added every 3 days in the days between collections. The leached water was collected from each depth of the columns in properly labeled sterile pots with approximately 40 mL. The volumes were filtered on quantitative black belt filter paper, then 3 drops of chloroform were added and stored in a cooler with ice. The pots were placed in a refrigerator after each daily collection for further analysis. The samples were submitted to centrifugation in the laboratory in Falcon tubes with 14 mL aliquots for 15 min at 4000 rpm. The spectrophotometry technique was used for the NO3 readings in the wavelengths of 220 and 275 nm, without adding reagents and with a 1:4 mL dilution (sample: distilled water) of the aliquots. The Berthelot reaction was performed with sodium salicylate to determine NH4+, also by spectrophotometry at a wavelength of 647 nm. The NO3 and NH4+ readings were taken using a Global Analyzer UV-VISIBLE spectrophotometer, according to the spectrophotometric method [19].

2.10. Statistical Analyses

The descriptive analysis of the data estimated the mean, median, minimum and maximum values, coefficient of variation, kurtosis, and data asymmetry. Data normality was verified by the Shapiro–Wilk test [20]. There was a need to remove some outliers from the data set, however, respecting the limit of 5% of the total observations. Values of three times the interquartile range in the box plot chart were used to define outliers [21]. Data analysis of variance was performed, followed by the F-test, with means compared by Tukey’s test at 5% error probability for significant qualitative data, and quantitative data were analyzed by regression by the Student’s t-test when significant. Finally, the standard error of the solubilization and emission coefficients of the respective models generated by the properly fitted curves was used to differentiate the regression analyses in the solubilization and emission kinetics studies.

3. Results and Discussion

3.1. Physicochemical Interaction of OMF-N

The FTIR spectra of OMF-N showed similar characteristics to those of urea (Figure 1), with peaks associated with stretching and deformation of N-H at 3430 cm−1 and 1148 cm−1, respectively, and N-H out of plane at 786 cm−1 [22,23]. The stretching frequency of C=O appears at 1677 cm−1 and 1589 cm−1 and C-N stretching at 1459 cm−1 and 1002 cm−1 [22,24].
The spectra associated with urea and OMF-N clearly reveal that urea overlapped the biochar’s organic matrix peaks without major changes in the OMF-N spectra, suggesting that the main interaction of urea with the OMF-N biochar occurs physically. However, it is possible to verify that bands inherent to the N-H stretches in the region of 3430 cm−1 and 1148 cm−1 were weakened, as well as C=O in the region of 1587 cm−1, suggesting that there is interaction, even if weak, via hydrogen bonds between the amino (NH2) and carbonyl (C=O) groups of urea with the carboxylic (-COOH) or hydroxyl (-OH) groups of biochar. These observations are confirmed by the suppression of bands inherent to the carboxylic and hydroxyl groups of biochar (dashed lines) after interaction with urea. These results corroborate the interactions for urea-functionalized biochar and for a physical mixture of urea, mineral, and biochar [14,25].
In view of this, it seems evident to us that the mechanisms which govern the interaction between urea and biochar in the dry pelletization process occur physically (with greater intensity) and chemically (less intensity). The physical interaction would mainly occur through urea deposition in hydrophobic partition zones, but especially in the innermost pores of the organic matrix where the partial oxidation of the polycondensed aromatic structures of the biochar is lower [26]. On the other hand, the chemical interaction would occur at the outer edges of the peripheral polycondensed aromatic structures of the biochar, a region that is subject to greater partial oxidation and consequently greater presence of reactive functional groups [27]. This interaction seems to be favored by the high temperature observed during the pelleting process which reached values between 92 and 95 °C.

3.2. Physical Properties of the OMF-N

The specific surface area and porosity of biochar and OMF-N 2:1, 1:2, and 1:4 investigated through N2 adsorption-desorption isotherms reveal the presence of mesoporous structures, characteristic of isotherms of the type IV (IUPAC). The presence of hysteresis at relatively low pressures is noteworthy (Figure 2a), indicating spontaneous filling of the mesopores due to capillary density [12]. The hystereses verified are similar to the H3 type, characterized by parallel loops typical of mesoporous materials consisting of non-uniform pores regarding their shape and size.
The pore size distribution curves of biochar and OMF-N reveal that although micropores are present, most are characterized by mesopores with a diameter ranging from 2 to 22 nm (Figure 2b). The results also reveal that because there is a reduction in the biochar-urea proportion, there is a drastic reduction in the pore volume, suggesting that the biochar mesopores were filled with urea. Additionally, the ASE of OMF-N 2:1 (17.6 m2 g−1), 1:2 (13.5 m2 g−1), and 1:4 (10.2 m2 g−1) were reduced by 96.7%, 97.4%, and 98.1% compared to biochar ASE (537 m2 g−1), thus confirming that urea was inserted into the mesopores and exposed external cavities of biochar, corroborating results that showed a 98% ASE reduction in fertilizer prepared from the hydrothermal synthesis of biochar-bentonite-urea [23].

3.3. Scanning Electron Microscopy (SEM) and Energy Dispersive X-ray Spectroscopy (EDS)

The morphological characterization of the biochar surface revealed a porous structure with a planar texture (Figure 3a,b), while the OMF-N surfaces were characterized by filling exposed pores and cavities of the biochar by urea, presenting a heterogeneous, irregular, and rough structure (Figure 3d,e,g,h,j,k). This type of structure can control water permeation and hence nitrogen release.
The irregular heterogeneous textural aspect contributed to form external cavities to the pores, which can result in forming partition zones (mainly hydrophobic) due to the molecular nature of the biochar. Urea was inserted in such external cavities during the OMF-N synthesis process, which in turn would explain the physical interactions observed in FTIR spectroscopic analyses. Although hygroscopic in nature, the urea contained in the hydrophobic biochar zones may have its dissolution flow retarded, making the N release a gradual process.
In addition, a semi-quantitative analysis of the atomic composition of C, N, O, H, and S was simultaneously performed with the morphological characterization analysis of the biochar surface and the OMF-N (Figure 3c,f,i,l). Surface atomic mapping demonstrated N concentrations below the total elemental concentrations determined via the CHNS elemental analyzer. This is due to the N concentrations filled in pore spaces not determined in the surface analysis via EDS. These results clearly show that urea is retained on both the external and internal surfaces of the biochar, reinforcing the presence of physical interactions between the biochar and urea.

3.4. NH4+ and Ntotal Release

The NH4+ release from fertilizers is characterized by kinetics which show higher levels from urea (7755 mg kg−1), while the lowest release came from OMF-N 2:1 (3045 mg kg−1) (Figure 4a). It is known that the aqueous solution adsorption in the biochar follows a combination of physical and chemical processes, decreasing the nutrient release rate [28]. The quantitative delay observed in the release of NH4+ from OMF-N was 60.7%, 54.0%, and 48.3% for the 2:1, 1:2, and 1:4 formulations, respectively, compared to conventional urea. The N based on biochar promotes lower losses by volatilization of NH3+ and N2O.
The adsorption of NH4+ on the acidic functional groups of biochar (-COO-; -OH) would largely explain the delay in its release, as verified in other studies [14,29,30]. Furthermore, interactions can be weak and NH4–N can easily exchange with other cationic species contained in biochar ash [31]. These values are expressive, as NH4+ is one of the first products of the urea reaction in aqueous medium from ((NH4)2CO3), which, given its chemical instability, is a primary source for the synthesis and consequent emission of NH3+ and N2O [32,33,34].
Thus, it is expected that the lower NH4+ release from biochar based OMFs will promote lower losses by NH3+ volatilization and N2O emission. In this sense, we propose a mechanism for controlled N release based on the diffusive flow delay as a function of the chemical and physical adsorption of NH4+ in the OMF-N pellets (Figure 5), which in theory would also delay the subsequent processes, reducing potential NH3+ and N2O losses.
The Weibull kinetic model best expressed the Ntotal release profiles (Figure 4b), thus corroborating the studies for urea-based fertilizers [35]. Although it is considered an empirical model, the Weibull model is currently suitable to apply to dissolution and controlled release processes [36]. In principle, due to the non-physical nature of its parameters, the Weibull model had its use restricted in kinetic applications; however, the constant b of the Weibull equation can also be considered an indication of the transport mechanism in a matrix [36,37].
The “b” values of the Weibull equation seem to demonstrate that the Ntotal release from the OMF-N is partly dependent on diffusion processes (Fickian model), and that it increases with the biochar concentrations in the OMF-N (reduction of b-values). However, one should not consider the constant diffusivity as in the Higuchi model (parabolic diffusion), because biochar’s organic matrix does not seem to provide some events which, in theory, are considered in the parabolic diffusion model, e.g., the diffusion in a single direction, negligible edge effect, perfect dissipation, and electrochemical interaction [38,39].
That said, the “a” parameter of the Weibull model for the kinetic profiles reveals higher and lower Ntotal release from urea and OMF-N 2:1, respectively. The Ntotal release after 120 min was 41% for urea and 30%, 29%, and 16% for the OMF-N 1:2, 1:4, and 2:1 formulations, respectively. This means that the OMF-N of 1:2, 1:4, and 2:1 formulation reduced the Ntotal release by ~27%, 29%, and 60%, respectively, in the first 120 min. It seems evident to us that the N dissolution flow in the biochar organic matrix is anchored in two main effects: i. in the physicochemical interaction between urea and the biochar organic matrix as already reported; and ii. on the physical characteristic of the organic matrix after the formulation process.
The physicochemical interaction of urea with the biochar organic matrix would justify the delay in the Ntotal release from the OMF-N due to the forces of hydrogen bonds and N-C=O electrostatic interactions and functional groups containing oxygen which would delay the urea release into the solution (adsorption) and by the physical protection that the pores (2.6 nm in diameter, located more internally in the biochar organic matrix) exert on the urea. On the other hand, the delay in the Ntotal release from the OMF-N due to the physical characteristic of the biochar organic matrix after the synthesis process is justified by the increase in compaction of the formulations since the reduction was proportional to the increase in the pellet hardness (compaction). There is the formation of empty space in the pores after urea solubility, which in theory could result in cracks in the organic matrix [35]. However, the OMF-N did not undergo a crack propagation process as they are composed of non-expandable organic matrices, which is a common process in expandable organic matrices [40]. The increased compaction of the OMF-N formulations resulted in a smaller contact surface with water, reducing the urea solubility and the nutrient mass transport to the external solvent phase.

3.5. N2O and CO2 Emissions
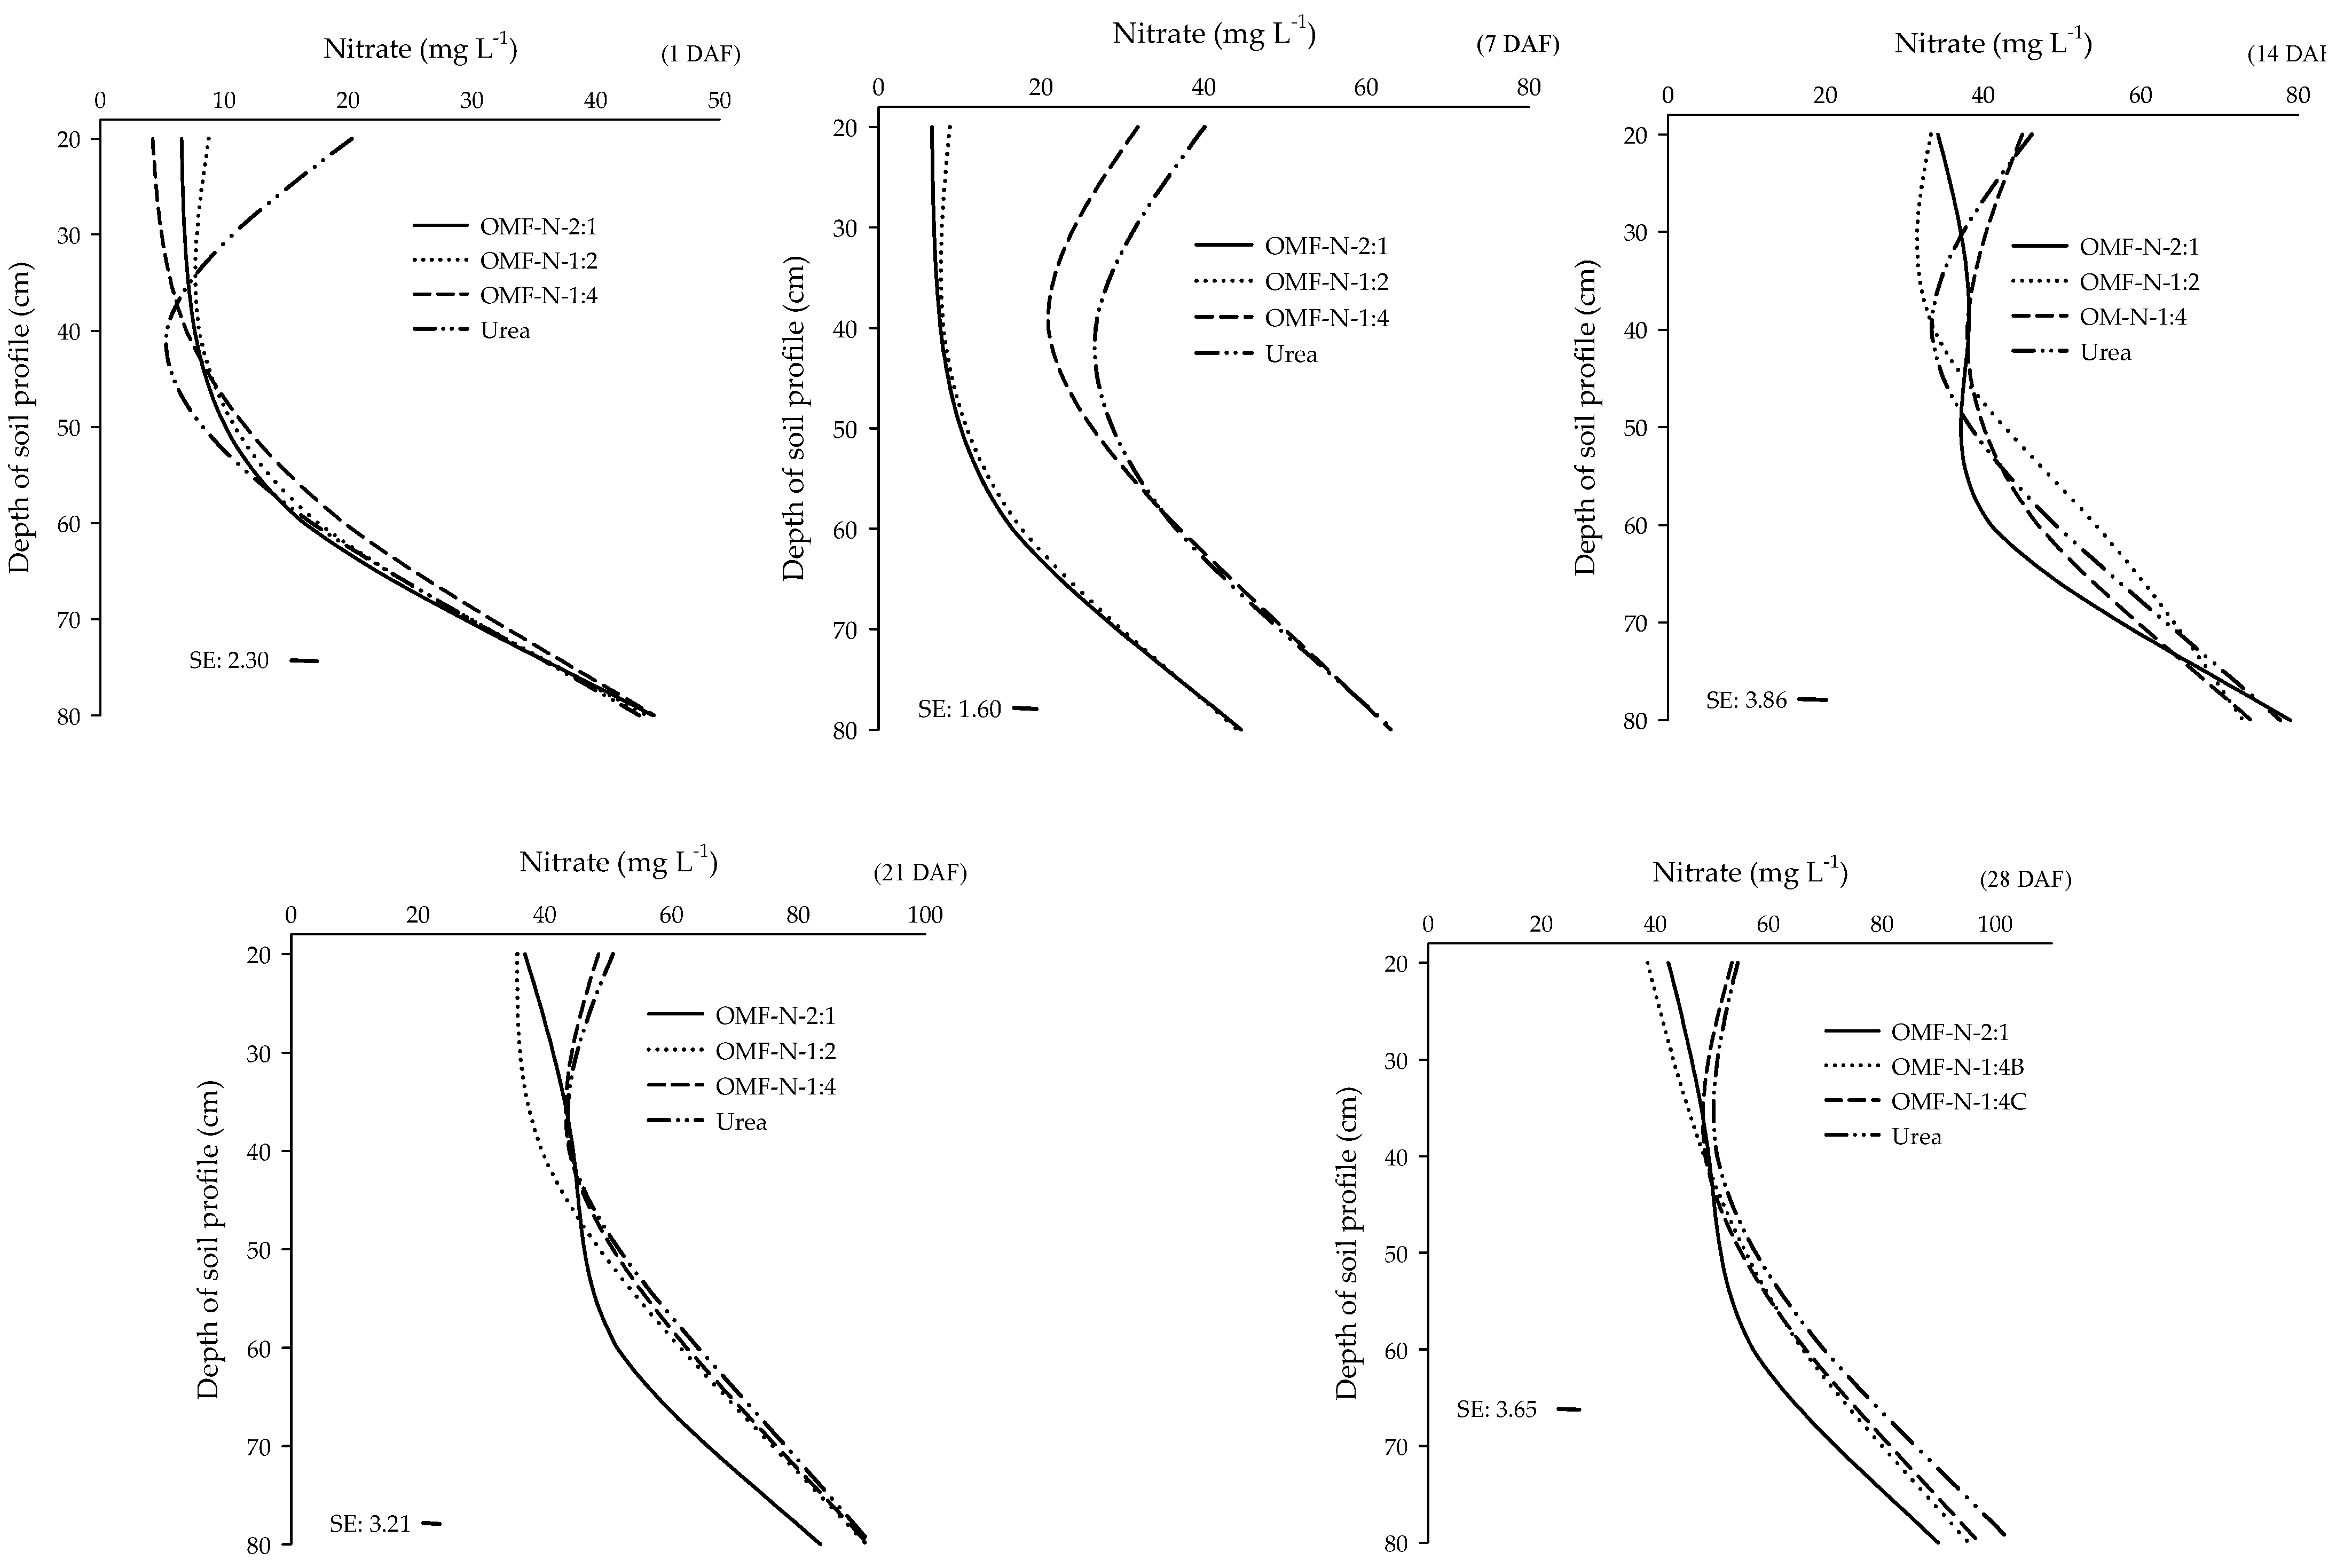
The N2O emissions reveal similar temporal variation patterns in all treatments throughout the experiment (Figure 6). The N2O flows were fitted to the sigmoidal model with two distinct phases which reveal an increase in flows: one after the application of fertilizers, and another at 58 days. The highest flows in the first days after application were verified for the urea treatment, while the highest flows after 58 days were verified in the OMF-N 2:1 treatment. Cumulative N2O emissions from OMF-N 1:4 (0.51 mg kg−1) and 1:2 (0.33 mg kg−1) were significantly lower than treatment with urea (0.98 mg kg−1). This means reductions of 47% and 66% in N2O emissions from these fertilizers, respectively, corroborating other studies in laboratory and field conditions with the use of biochar and nitrogen fertilizer with a biochar base [41,42].
The higher N2O emissions in the first days are related to the higher solubility of urea present in the peripheral spaces of the biochar. This is due to faster penetration of the liquid into these spaces, providing greater displacement of the nutrient mass via diffusion to the solid-liquid interface. On the other hand, the lower N2O emissions from the OMF-N in the first days are possibly related to the lower urea solubility inside the pellets provided by the physicochemical interactions. As already reported, these interactions would result in lower permeability of the aqueous matrix to the interior of the porous structures of the OMF-N biochar, reducing urea dissolution and delaying diffusion of the nutrient mass to the solution caused by the chemical bonds of urea with the biochar contained in the pellets.
The increase in emissions from OMF-N 2:1 from 58 days onwards is possibly due to biological processes influenced by the C:N ratio of the granules. The greater number of pores available in OMF-N with a greater proportion of biochar results in a long-term condition which is favorable to solvent accumulation inside, since the pores are not completely filled with urea. Anaerobic sites intensify N2O emissions under these conditions, as the transformation of urea into N2O is dependent on denitrification processes [39]. The data show that there is an optimal biochar concentration (~26%) in the OMF-N, for which there is reduction, but above this concentration an increase in N2O emissions is observed (Figure 7), whose effects are supported by physicochemical interactions.
Similar to N2O, CO2 emissions reveal similar temporal variation patterns in all treatments throughout the experiment (Figure 8). The CO2 flows fitted the exponential model, revealing that 80% to 89% of emissions occurred up to 58 days. The highest (p < 0.05) accumulated CO2 emissions throughout the study were observed in OMF-N 1:2 (305 mg kg−1), 1:4 (292 mg kg−1), and 2:1 (278 mg kg−1) treatments, while the lowest emissions were observed for urea (220 mg kg−1). These values are ten times lower than those verified in other studies [43].
The higher CO2 emissions from OMF-N are understandable, since these formulations proportionally contained more carbon to urea, and this increase is probably due to the partial mineralization of labile C contained in the biochar. Considering the biochar:urea proportions in the OMF-N, the 2:1, 1:2, and 1:4 formulations contained 57.2%, 38.6%, and 31.2% of C, respectively, while the urea only contained 20%. However, the increase in CO2 emissions did not linearly follow the same proportion of the total C contents of OMF-N, showing that part of the C contained in these fertilizers has high molecular stability. This means that even with an increase in CO2 emissions from OMF-N compared to urea, its use provides C sequestration in the soil, as the final net balance of C is favorable, corroborating other studies [44,45]. Considering an environmental approach, this means that the potential for C sequestration from biochar-based OMF-N would be more than enough to neutralize CO2 emissions from urea, thus meeting the assumptions of a regenerative agriculture.

3.6. NH4+ and NO3 Leaching

The NH4+ concentration profile in the soil solution for 28 days revealed higher levels up to 40 cm depth with the application of OMF-N 2:1 and there was no significant difference for the other fertilizers (Figure 9). The highest NH4+ levels from 21 days after fertilizer application at a depth of 60 cm were verified with the OMF-N application, while there was no difference between the fertilizers at a depth of 80 cm. Higher NH4+ concentrations were also verified when analyzing the leached solution 30 days after applying a fertilizer synthesized from a physical mixture of urea, mineral, and biochar [14].
Higher concentrations considering the NH4+ release kinetics (Figure 4a) were to be expected with the application of urea, which was not verified. A possible explanation for the lower NH4+ levels in the soil profile with the urea application may be theoretically related to the greater N loss by volatilization of NH3+. Although we did not determine NH3+ flows in our studies, there are reports in the literature that report losses of 38% to 44% by NH3+ volatilization from urea [46,47]. On the other hand, there are several studies that report a reduction in NH3+ volatilization and higher NH4+ contents in the presence of biochar, whether incorporated into the soil or in the form of a nitrogen fertilizer based on biochar [48,49]. That said, it seems to us that the greater N loss by volatilization of NH3+ and the greater ability of biochar to retain and gradually make NH4+ available may in fact justify the lower NH4+ concentrations in the solution along the soil profile with the urea application.
The urea and OMF-N 1:4 applications provided the greatest leaching of NO3 in the entire period evaluated, whose greatest differences were verified at 20 cm depth (Figure 10). Only OMF-N 2:1 provided a reduction in NO3 leaching below a depth of 60 cm from 21 days after fertilizer application. It seems evident that the increase in the biochar concentration in the OMF-N permeates in the sense of linearly reducing the leaching of NO3 at 28 days after fertilization, especially in deeper layers. Reduction in nitrate leaching after applying biochar-based nitrogen fertilizers was also observed in other studies [50,51].
The lower NO3 leaching with the OMF-N application is related to higher NH4+ retention in the biochar. Nitrification is a process whose base substrate is NH4+, which converts it into nitrite and nitrate via the catalytic activity of enzymatic complexes (nitrosomona and nitrobacter, respectively). Thus, the reduction in available NH4+ consequently results in a reduced NO3 content. Then, we can logically say that the delay in the NH4+ release is a beneficial process as long as it is low intensity (which does not extrapolate the synchrony of release with crop demand) since in addition to potentially reducing NH3+ and N2O emissions, also reduces the synthesis of NO3, which is the main leachable form of N in soil.

4. Conclusions

Our studies reveal that biochar can be an alternative for the synthesis of controlled-release nitrogen fertilizers from agronomic and environmental points of view. This is possible due to physicochemical interactions between urea and biochar even in a dry mechanical melting pelletizing process. OMF-N were able to significantly retain more ammonium and reduce Ntotal release from urea, as well as reduce nitrous oxide emissions. Although absolute CO2 emissions intensified with OMF-N application, their use provides C sequestration in the soil given the recalcitrance of pyrogenic carbon which results in a positive net C balance. Nitrate concentration profiles revealed that the OMF-N application was able to reduce soil leaching to a depth of 80 cm.
Finally, our studies reveal that biochar from wood industry residues (environmental liabilities) can be used as an organic matrix for N anchoring aiming at the synthesis of controlled-release fertilizers. Moreover, we have presented better understanding of the processes involved in the biochar:urea interaction, and how they govern the dynamics of N release to the system. However, it is not yet known how the N release in these fertilizers affects plant growth and what is the effect on N2O emission in the field, so field trials are imperative to elucidate these issues.

Author Contributions

V.V.P.: Investigation, Methodology and Writing—Original Draft; M.M.M.: Investigation and Writing—Original Draft; D.H.P.: Conceptualization and Investigation; F.A.P.: Funding acquisition, Conceptualization, Methodology, Validation, Formal analysis, Data Curation, and Writing—Review and Editing; F.A.d.R.: Resources; C.A.d.S.M.: Resources and Validation; L.B.d.L.: Supervision; B.H.M.-J.: Conceptualization and Supervision. All authors have read and agreed to the published version of the manuscript.

Funding

The study was partially funded by the Fundação de Amparo à Pesquisa do Estado de Mato Grosso (FAPEMAT; grant no. 0585720/2016) and the Conselho Nacional de Desenvolvimento Cientifico e Tecnológico (CNPq); the third author received a research productivity grant PQ1D no. 304621/2017-0.

Acknowledgments

The authors are thankful for the financial support from the Instituto de Ciências Agrárias e Ambientais do Câmpus Universitário de Sinop (ICAA/CUS/UFMT), the Fundação de Amparo à Pesquisa do Estado de Mato Grosso (FAPEMAT), and the Conselho Nacional de Desenvolvimento Científico e Tecnológico (CNPq).

Conflicts of Interest

The authors declare no conflict of interest, and also confirm that this work is original and has not been published elsewhere, nor is it currently under consideration for publication elsewhere. The funders had no role in the design of the study; in the collection, analyses, or interpretation of data; in the writing of the manuscript; or in the decision to publish the results.

References

  1. Wang, C.; Luo, D.; Zhang, X.; Huang, R.; Cao, Y.; Liu, G.; Zhang, Y.; Wang, H. Biochar-based slow-release of fertilizers for sustainable agriculture: A mini review. Environ Sci. Ecotechnol. 2022, 10, 100167. [Google Scholar] [CrossRef] [PubMed]
  2. Duhan, J.S.; Kumar, R.; Kaur, P.; Nehra, K.; Duhan, S. Nanotechnology_ the new perspective in precision agriculture. Biotechnol. Rep. 2017, 15, 15–23. [Google Scholar] [CrossRef]
  3. Luo, W.; Qian, L.; Liu, W.; Zhang, X.; Wang, Q.; Jiang, H.; Cheng, B.; Ma, H.; Wu, Z. A potential mg-enriched biochar fertilizer: Excellent slow-release performance and release mechanism of nutrients. Sci. Total Environ. 2021, 768, 144454. [Google Scholar] [CrossRef] [PubMed]
  4. Jia, C.; Lu, P.; Zhang, M. Preparation and characterization of environmentally friendly controlled release fertilizers coated by leftovers-based polymer. Processes 2020, 8, 417. [Google Scholar] [CrossRef]
  5. Rozo, G.; Bohorques, L.; Santamaría, J. Controlled release fertilizer encapsulated by a κ-carrageenan hydrogel. Polímeros 2019, 29, 3. [Google Scholar] [CrossRef]
  6. Sun, H.; Shi, W.; Zhou, M.; Ma, X.; Zhang, H. Effect of biochar on nitrogen use efficiency, grain yield and amino acid content of wheat cultivated on saline soil. Plant Soil Environ. 2019, 65, 83–89. [Google Scholar] [CrossRef]
  7. Dai, Y.; Wang, W.; Lu, L.; Yan, L.; Yu, D. Utilization of biochar for the removal of nitrogen and phosphorus. J. Clean. Prod. 2020, 257. [Google Scholar] [CrossRef]
  8. Lehmann, J.; Joseph, S. Biochar for Environmental Management: An Introduction; Routledge: London, UK, 2015. [Google Scholar]
  9. Madari, B.E.; Silva, M.A.; Carvalho, M.T.; Maia, A.H.; Petter, F.A.; Santos, J.L.; Tsai, S.M.; Leal, W.G.; Zeviani, W.M. Properties of a sandy clay loam Haplic Ferralsol and soybean grain yield in a five-year field trial as affected by biochar amendment. Geoderma 2017, 305, 100–112. [Google Scholar] [CrossRef]
  10. Petter, F.A.; Ferreira, T.; Sinhorin, A.; Lima, L.B.; Almeida, F.; Pacheco, L.; Silva, A. Biochar Increases Diuron Sorption and Reduces the Potential Contamination of Subsurface Water with Diuron in a Sandy Soil. Pedosphere 2019, 6, 801–809. [Google Scholar] [CrossRef]
  11. Peres, F.S.C.; Petter, F.A.; Sinhorin, A.P.; de Lima, L.B.; Tavanti, T.R.; da Silva Freddi, O.; Marimon, B.H., Jr. Influence of biochar on the sorption and leaching of thiamethoxan in soil. J. Environ. Sci. Health B 2022, 57, 153–163. [Google Scholar] [CrossRef]
  12. Foroutan, R.; Peighambardoust, S.J.; Mohammadi, R.; Peighambardoust, S.; Ramavandi, B. Cadmium ion removal from aqueous media using banana peel biochar/Fe3O4/ZIF-67. Environ. Res. 2022, 211, 113020. [Google Scholar] [CrossRef] [PubMed]
  13. Petter, F.A.; de Lima, L.B.; Marimon Júnior, B.H.; Alves de Morais, L.; Marimon, B.S. Impact of biochar on nitrous oxide emissions from upland rice. J. Environ. Manage 2016, 169, 27–33. [Google Scholar] [CrossRef] [PubMed]
  14. Shi, W.; Ju, Y.; Bian, R.; Li, L.; Joseph, S.; Mitchell, D.R.G.; Munroe, P.; Taherymoosavi, S.; Pan, G. Biochar bound urea boosts plant growth and reduces nitrogen leaching. Sci. Total Environ. 2020, 701, 134424. [Google Scholar] [CrossRef] [PubMed]
  15. Da Silva, F.C. Manual de Análises Químicas de Solos, Plantas e Fertilizantes; Embrapa Informação Tecnológica: Brasília, Brazil, 2009. [Google Scholar]
  16. Rutland, D.; Frederick, E.; Roth, E. Manual for Determining Physical Properties of Fertilizer; International Fertilizer Development Center: Muscle Shoals, AL, USA, 1986. [Google Scholar]
  17. Brunauer, S.; Emmett, P.H.; Teller, E. Adsorption of gases in multimolecular layers. J. Am. Chem. Soc. 1938, 60, 309–319. [Google Scholar] [CrossRef]
  18. Barrett, E.P.; Joyner, L.G.; Halenda, P.P. The determination of pore volume and area distributions in porous substances. I. Computations from nitrogen isotherms. J. Am. Chem. Soc. 1951, 73, 373–380. [Google Scholar] [CrossRef]
  19. Campos, D.V.B.; Alves, B.J.R.; Teixeira, P.C.; Jantalia, C.P.; Mattos, B.B. Nitrato e Amônio. In Manual de Métodos de Análise de Solo, 3rd ed.; Teixeira, P.C., Donagemma, G.K., Fontana, A., Teixeira, W.G., Eds.; Embrapa Informação Tecnológica: Brasília, Brazil, 2017; Volume 3, pp. 377–392. [Google Scholar]
  20. Shapiro, S.S.; Wilk, M.B. An analysis of variance test for normality (complete samples). Biometrika 1965, 52, 591–611. [Google Scholar] [CrossRef]
  21. dos Santos, A.; Matos, E.S.; Freddi, O.S.; Galbieri, R.; Lal, R. Cotton production systems in the Brazilian Cerrado: The impact of soil attributes on field-scale yield. Eur. J. Agron. 2020, 118, 126090. [Google Scholar] [CrossRef]
  22. Trivedi, M.K.; Patil, S.; Shettigar, H.; Singh, R.; Jana, S. An impact of biofield treatment on spectroscopic characterization of pharmaceutical compounds. Mod. Chem. Appl. 2015, 3, 3. [Google Scholar] [CrossRef]
  23. Liu, X.; Liao, J.; Song, H.; Yang, Y.; Guan, C.; Zhang, Z. A biochar-based route for environmentally friendly controlled release of nitrogen: Urea-loaded biochar and bentonite composite. Sci. Rep. 2019, 9, 9548. [Google Scholar] [CrossRef]
  24. Piasek, Z.; Urbanski, T. The infra-red absorption spectrum and structure of urea. Bulletin de L’ Academie Polonaise des Ciences 1962, 10, 113–120. Available online: https://cdnsciencepub.com/doi/pdf/10.1139/v60-025 (accessed on 10 July 2021).
  25. Sajjadi, B.; Chen, W.-Y.; Egiebor, N. A comprehensive review on physical activation of biochar for energy and environmental applications. Rev. Chem. Eng. 2019, 35, 735–776. [Google Scholar] [CrossRef]
  26. Sorrenti, G.-B.; Masiello, C.A.; Dugan, B.; Toselli, M. Biochar physico-chemical properties as affected by environmental exposure. Sci. Total Environ. 2016, 563–564, 237–246. [Google Scholar] [CrossRef] [PubMed]
  27. Petter, F.A.; Leite, L.F.C.; Machado, D.M.; Marimon-Junior, B.H.; Lima, L.B.; Freddi, O.S.; Araújo, A.S.F. Microbial biomass and organic matter in an oxisol under application of biochar. Bragantia 2019, 78, 109–118. [Google Scholar] [CrossRef]
  28. Mattson, J.S.; Mark, H.B. Activated Carbon: Surface Chemistry and Adsorption from Solution; Marcel Dekker: New York, NY, USA, 1971. [Google Scholar]
  29. Yuan, J.-H.; Xu, R.-K.; Zhang, H. The forms of alkalis in the biochar produced from crop residues at different temperatures. Bioresource Technol. 2011, 102, 3488–3497. [Google Scholar] [CrossRef]
  30. Zheng, H.; Wang, Z.; Deng, X.; Zhao, J.; Luo, Y.; Novak, J.; Herbert, S.; Xing, B. Characteristics and nutrient values of biochars produced from giant reed at different temperatures. Bioresource Technol. 2013, 130, 463–471. [Google Scholar] [CrossRef]
  31. Hale, S.E.; Alling, V.; Martinsen, V.; Mulder, J.; Breedveld, G.D.; Cornelissen, G. The sorption and desorption of phosphate-P, ammonium-N and nitrate-N in cacao shell and corn cob biochars. Chemosphere 2013, 91, 1612–1619. [Google Scholar] [CrossRef]
  32. Rochette, P.; Macdonald, J.D.; Angers, D.A.; Chantigny, M.H.; Gasser, M.-O.; Bertrand, N. Banding urea increased ammonia volatilization in a dry acidic soil. J. Environ. Qual. 2009, 38, 1383–1390. [Google Scholar] [CrossRef]
  33. Qin, S.; Wang, Y.; Hu, C.; Oenema, O.; Li, X.; Zhang, Y.; Dong, W. Yield-scaled N2O emissions in a winter wheat-summer corn double-cropping system. Atmos. Environ. 2012, 55, 240–244. [Google Scholar] [CrossRef]
  34. Dawar, K.; Fahad, S.; Jahangir, M.M.R.; Munir, I.; Alam, S.S.; Khan, S.A.; Mian, I.A.; Datta, R.; Saud, S.; Banout, J.; et al. Biochar and urease inhibitor mitigate NH3 and N2O emissions and improve wheat yield in a urea fertilized alkaline soil. Sci. Rep. 2021, 11, 17413. [Google Scholar] [CrossRef]
  35. Jange, C.G.; Wassgren, C.R.; Kingsly Ambrose, R.P. Disintegration and release kinetics of dry compacted urea composites: A formulation and process design study. EFB Bioeconomy J. 2021, 1, 100020. [Google Scholar] [CrossRef]
  36. Ferreira, M.V.; Pradela Filho, L.A.; Santos, A.L.; Takeuchi, R.M.; Assunção, R.M.N. Evaluation of the ibuprofen delyvery profile in symmetric and asymmetric membranes of cellulose acetate: Effect of morphology. Química Nova 2019, 42, 823–830. [Google Scholar] [CrossRef]
  37. Papadopoulou, V.; Kosmidis, K.; Vlachou, M.; Macheras, P. On the use of the Weibull function for the discernment of drug release mechanisms. Int. J. Pharm. 2006, 309, 44–50. [Google Scholar] [CrossRef] [PubMed]
  38. Bruschi, M.L. Mathematical and Physiochemical Models of Drug Release. In Strategies to Modify the Drug Release from Pharmaceutical Systems; Bruschi, M.L., Ed.; Woodhead Publishing: Sawston, UK, 2015; pp. 63–86. [Google Scholar] [CrossRef]
  39. Lawrence, N.C.; Tenesaca, C.G.; Vanloocke, A.; Hall, S.J. Nitrous oxide emissions from agricultural soils challenge climate sustainability and in the US Corn Belt. Proc. Natl. Acad. USA 2021, 118, e2112108118. [Google Scholar] [CrossRef] [PubMed]
  40. Maclean, A.M.; Smith, N.R.; Ying, L.; Yuanzhou, H.; Hettiyadura, A.P.S.; Crescenzo, G.C.; Shiraiwa, M.; Laskin, A.; Nizkorodov, S.A.; Bertram, A.K. Humidity-dependent viscosity of secondary organic aerosol from ozonolysis of β-caryophyllene: Measurements, predictions, and implications. ACS Earth Space Chem. 2021, 5, 302–318. [Google Scholar] [CrossRef]
  41. Cayuela, M.L.; Van Zwieten, L.; Singh, B.P.; Jeffery, S.; Roig, A.; Sánchez-Monedero, M.A. Biochar’s role in mitigating soil nitrous oxide emissions: A review and meta-analysis. Agr. Ecosyst. Environ. 2014, 191, 5–16. [Google Scholar] [CrossRef]
  42. Bian, Z.; Tian, H.; Yang, Q.; Xu, R.; Pan, S.; Zhang, B. Production and application of manure nitrogen and phosphorus in the United States since 1860. Earth Syst. Sci. Data 2021, 13, 515–527. [Google Scholar] [CrossRef]
  43. Kim, G.W.; Alam, M.A.; Lee, J.J.; Kim, G.Y.; Kim, P.J.; Khan, M.I. Assessment of direct carbon dioxide emission factor from urea fertilizer in temperate upland soil during warm and cold cropping season. Eur. J. Soil Biol. 2017, 83, 76–83. [Google Scholar] [CrossRef]
  44. Puga, A.P.; Queiroz, M.C.A.; Ligo, M.A.V.; Carvalho, C.S.; Pires, A.M.M.; Marcatto, J.O.S.; Andrade, C.A. Nitrogen availability and ammonia volatilization in biochar based fertilizers. Arch. Agron. Soil Sci. 2020, 66, 9921004. [Google Scholar] [CrossRef]
  45. Pramono, A.; Adriany, T.A.; Susilawati, H.L. Mitigation scenario for reducing greenhouse gas emission from rice field by water management and rice cultivars. J. Trop. Soils 2020, 25, 53–60. [Google Scholar] [CrossRef]
  46. Rochette, P.; Angers, D.A.; Chantigny, M.H.; Gasser, M.-O.; MacDonald, J.D.; Pelster, D.E.; Bertrand, N. Ammonia Volatilization and Nitrogen Retention: How Deep to Incorporate Urea? J. Environ. Qual. 2013, 42, 1635–1642. [Google Scholar] [CrossRef]
  47. Selvarajh, G.; Chng, H.Y.; Md Zain, N. Effects of rice husk biochar in minimizing ammonia volatilization from urea fertilizer applied under waterlogged condition. AIMS Agric. Food 2021, 6, 159–171. [Google Scholar] [CrossRef]
  48. Lee, Y.L.; Ahmed, O.H.; Wahid, S.A.; Jalloh, M.B.; Muzah, A.A. Nutrient release and ammonia volatilization from biochar-blended fertilizer with and without densification. Agronomy 2021, 11, 2082. [Google Scholar] [CrossRef]
  49. Sun, H.; Zhang, Y.; Yang, Y.; Chen, Y.; Jeyakumar, P.; Shao, Q.; Zhou, Y.; Ma, M.; Zhu, R.; Qian, Q.; et al. Effect of biofertilizer and wheat straw biochar application on nitrous oxide emission and ammonia volatilization from paddy soil. Environ. Pollut. 2021, 275, 116640. [Google Scholar] [CrossRef] [PubMed]
  50. Li, S.; Wang, S.; Shangguan, Z. Combined biochar and nitrogen fertilization at appropriate rates could balance the leaching and availability of soil inorganic nitrogen. Agr. Ecosyst. Environ. 2019, 276, 21–30. [Google Scholar] [CrossRef]
  51. Jia, Y.; Hu, Z.; Ba, Y.; Qi, W. Application of biochar-coated urea controlled loss of fertilizer nitrogen and increased nitrogen use efficiency. Chem. Biol. Technol. Agric. 2021, 8, 3. [Google Scholar] [CrossRef]
Figure 1. FTIR spectra of biochar, urea and organomineral nitrogen fertilizers based on biochar (biochar:urea) in the proportions of 2:1, 1:2, and 1:4.
Sustainability 14 12388 g001
Figure 2. (a) N2 adsorption-desorption isotherms and (b) pore size distribution of biochar and organomineral nitrogen fertilizers in the proportions 2:1, 1:2, and 1:4.
Sustainability 14 12388 g002
Figure 3. (a) Scanning electron micrograph (SEM) of biochar, (d) OMF-N 2:1, (g) OMF-N 1:2, and (j) OMF-N 1:4. (b) Magnification of the selected red region showing the surface with the greatest homogeneity of the biochar and (e,h,k) the greatest heterogeneity of the OMF-N pellets. (c) On the right are the X-ray dispersive spectra of the selected biochar region, (f) OMF-N 2:1, (i) OMF-N 1:2, and (l) OMF-N 1:4 with the surface concentrations of C, N, and O and total elemental concentrations (in the tables in the graph).
Sustainability 14 12388 g003
Figure 4. (a) Estimates of ammonium (NH4+) release curves and (b) kinetics of cumulative release of total nitrogen (Ntotal) from organomineral nitrogen fertilizer based on biochar (biochar:urea): 2:1, 1:2, 1:4, and conventional fertilizer urea; **: significant at 1% by the Student’s t-test.
Sustainability 14 12388 g004
Figure 5. Proposed mechanism for the controlled release of OMF-N in soil. After the slow hydration of the pellet, the NH4+ resulting from the hydrolysis of urea is adsorbed chemically (functional groups) and physically to the biochar (partition zones) delaying its release and consequently the subsequent processes.
Sustainability 14 12388 g005
Figure 6. Cumulative emission of N2O from organomineral nitrogen fertilizer based on biochar (biochar:urea): 2:1, 1:2, 1:4, and conventional urea fertilizer; **: significant at 1% by the Student’s t-test.
Sustainability 14 12388 g006
Figure 7. Cumulative emission of N2O in 118 days from formulations of organomineral nitrogen fertilizers with different biochar concentrations (BC) having urea as basal control; SE: standard error; *: significant at 5% by the Student’s t-test.
Sustainability 14 12388 g007
Figure 8. Cumulative CO2 emission from organomineral nitrogen fertilizer based on biochar (biochar:urea): 2:1, 1:2, 1:4, and conventional urea fertilizer; * and **: significant at 5% and 1% by the Student’s t-test.
Sustainability 14 12388 g008
Figure 9. Accumulated leaching of ammonium (NH4+) up to 80cm in the soil profile after the application of 160 kg ha−1 of N in the form of an organomineral nitrogen fertilizer based on biochar (biochar:urea): 2:1, 1:2, 1:4, and conventional urea fertilizer; SE: standard error. DAF: days after fertilization.
Sustainability 14 12388 g009
Figure 10. Accumulated nitrate (NO3) leaching up to 80 cm in the soil profile after the application of 160 kg ha−1 of N in the form of an organomineral nitrogen fertilizer based on biochar (biochar:urea): 2:1, 1:2, 1:4, and conventional urea fertilizer; SE: standard error. DAF: days after fertilization.
Sustainability 14 12388 g010
Table 1. Physicochemical composition of activated biochar used in the experiment.
ElementsUnitConcentration
Total Nitrogen (N)g kg−13.30
Phosphorus (P2O5 citric acid)0.44
Phosphorus (P2O5 total)-
K2O0.60
CaO3.78
MgO1.32
Sulfur (S)0.14
Copper (Cu)mg kg−110.0
Zinc (Zn)9.0
Molybdenum (Mo)1.35
Cobalt (Co)1.93
Boron (B)12.0
Total carbon (C)g kg−1760.0
Moisture50.0
C:N ratio230
Specific surface area (BET)m2 g−1537
Actual densityg cm−31.27
Apparent densityg cm−30.31
Porosity%75
Average pore diameterNm2.62
Publisher’s Note: MDPI stays neutral with regard to jurisdictional claims in published maps and institutional affiliations.

