Article

Identification of Structural Damage and Damping Performance of a Mega-Subcontrolled Structural System (MSCSS) Subjected to Seismic Action

by
Muhammad Moman Shahzad
1,2,*,
Xun’an Zhang
1 and
Xinwei Wang
1
1
Department of Civil Engineering, School of Mechanics, Civil Engineering and Architecture, Northwestern Polytechnical University, Xi’an 710072, China
2
Department of Civil Engineering, School of Engineering, University of Management and Technology, Lahore 54700, Pakistan
*
Author to whom correspondence should be addressed.
Sustainability 2022, 14(19), 12390; https://doi.org/10.3390/su141912390
Submission received: 25 August 2022 / Revised: 24 September 2022 / Accepted: 26 September 2022 / Published: 29 September 2022

Abstract

:
Due to multiple degrees of freedom, evaluating high-rise buildings’ seismic safety under unpredictable seismic excitations is difficult. To address the issue that the damage mechanism of a mega-subcontrolled structural system (MSCSS) has not yet been studied, this paper employs ABAQUS software with strong nonlinear analysis capabilities to analyze the nonlinear elastic—plastic time history of an MSCSS, analyze structural damage to the MSCSS structure, reveal the internal energy dissipation mechanism of the MSCSS, and evaluate the damping performance of the MSCSS structure. This work presents a novel and optimized MSCSS structure equipped with SPSW that improves the system’s seismic performance. First, a refined finite element model of the MSCSS is established, and the impact of vigorous seismic excitations on the damage to the MSCSS structure is considered. The MSCSS structure’s vulnerable parts are then summarized using stress nephograms and residual stresses. Finally, the favorable damping performance of the structure reveals that the newly proposed structure has good shock absorption performance based on an analysis of the energy dissipation, time history, and interstory drift of the MSCSS. This paper’s research findings elaborate the structural damage trend in MSCSS structures, which can serve as a theoretical foundation for MSCSS structure damage identification.

1. Introduction

A city’s skyline reflects a country’s economic and technological strength. High-rise buildings are an important aspect of a skyline; as economies grow and technology improves, countries become able to beautify their skylines by erecting more and taller structures. Due to urbanization and limited land availability, demand for high-rise buildings has surged. The Council on Tall Structures and Urban Habitat (CTBUH) reports that 368 high-rise buildings over 100 m were built in 2019, and to date, 5129 over 150 m have been built [1,2]. Slenderness and light weight make these buildings subject to random vibrations and excitations; therefore, the design process must consider static and dynamic loading conditions. Increases in energy dissipation capacity and lateral stiffness can safeguard high-rise buildings from lateral loads. Seismic loads depend on the structure’s mass, the soil’s contact with it, the earthquake’s duration, and the distance to the epicenter. Wind loads are proportional to the structure’s height. Random excitations caused by lateral loads reduce the load-bearing capability of structural foundations, shortening the life of the structures they support. Both the soil and the structure determine a building’s fundamental period. Fundamental period shifts in structures are more likely with extended dynamic loads [3,4].
Mega-substructures (MSSs) are utilized in high-rise buildings around the world to regulate seismic and wind loading. MSSs have rigidly connected megaframes and multistory substructures. Feng and Mita developed a mega-subcontrolled passive structure (PMSCS) that has fixed megastructure and substructure end conditions. Substructures in PMSCSs act as tuned mass dampers (TMDs), with a mass ratio of 100% of the megastructure, compared to 1% for a traditional TMD. Chai and Feng improved PMSCSs’ wind response. In their analytical model, the megastructure was represented by a cantilever beam, and the substructure was represented by a lumped mass. Eventually, Lan substituted each substructure of his analytical model with a concentrated mass [5,6,7].
Zhang devised a new PMSCS configuration dubbed the mega-subcontrolled structure system (MSCSS) in the previous decade, which exhibits dominating shearing in the substructures and bending in the megaframe. The relative stiffness ratio (RD) between the substructure and megabending frame affects structural vibration management. When RD is less than 0.477, vibration management is effective; when it is greater, first modal vibrations are not muffled as effectively. This PMSCS design improves energy dissipation and self-control in earthquake-exposed structures. Later, friction and magnetorheological dampers were utilized in MSCSS substructures to evaluate how they affected structural response under wind and seismic loads [8,9,10]. Recent research compared a variety of controlling strategies with MSSs to draw findings. According to prior studies, the MSCSS responds to seismic activity with substantially superior structural control than other systems; it endures reduced structural accelerations and displacements. When added to an MSCSS substructure, friction dampers greatly improve its responses to wind and seismic excitations [11,12]. Recent studies on an MSCSS viscous damper control mechanism included efforts to optimize the locations and parameters of dampers. To diminish the earthquake response of the building, rubber bearings were installed at the tops of additional columns that were placed between the floor megabeams and substructural components. An high-intensity earthquake was predicted to impart moderate damage to an MSCSS while causing an MSS to collapse [13,14]. It has been determined that an MSCSS has a failure probability that is 30% lower than that of an MSS, and that the megastructure has a failure probability that is 50% lower than that of its substructure. During long-period ground motions, an MSCSS demonstrated a response control rate that was greater than 10% and a base shear control rate that was greater than 20% [15,16]. In MSCSSs with various substructure arrangements and numbers, the control effectiveness of the megaframe structural acceleration and displacement at the top varied from 42% to 70%, while the control effectiveness of the substructures ranged from 20% to 65% [17]. With an average structural acceleration response of 49.7% during the El Centro earthquake, MSCSSs have proven to be highly effective at dampening seismically induced structural vibration and demonstrating significant improvements, especially under a service load. Midstory isolation and inverted V-bracing were used to generate these effects (chevron). Due to the enhanced rigidity provided by the chevron bracing, the excessive structural displacement induced by a change in the time period is mitigated. Subsequently, the chevron bracing was replaced with a ring-shaped steel plate shear wall (RS-SPSW), which considerably enhanced the seismic performance of the structure by boosting energy dissipation and lateral stiffness. The RS-SPSW improves the structure’s controllability index by preventing out-of-plane buckling through ring deformation into an ellipse. Because the elongation of the ring during tension causes the diagonal connections to shrink, the web will not droop in a direction perpendicular to the field of tension [18,19,20].
Despite recent advancements in the structural response control of MSCSSs showing substantially improved results, the investigation of structural damage under intense seismic excitations still has not been thoroughly examined and thus demands further attention. This is due to a dearth of research into how different types of earthquakes affect structures.
The structural performance of a proposed novel and optimized MSCSS structure integrated with a ring-shaped steel plate shear wall was evaluated in this work, and it was compared to MSCSSs with and without dampers. The findings of this study are presented in this article. In the first half of this study, a damage analysis was carried out using stress nephograms under the influence of three different types of ground motion records. The purpose of this analysis was to calculate and compare the seismic response in a comparative manner. In the second half, a seismic performance analysis was carried out. This entailed mainly analyzing the acceleration time history response and the interstory drift, both of which are presented to enhance the understanding of how various configurations of MSCSSs behave under various types of earthquakes.

2. Scope

To better understand the seismic response of structures, the performance of different MSCSS designs is evaluated under a range of strong seismic excitations. Dampers and steel plate shear walls (SPSW) affect MSCSS structural response. In damage analysis, the literature lacks a full understanding of the structural response of various MSCSS configurations under various types of earthquakes. Prompt structural damage detection is crucial for efficient postdisaster interventions, as failing to do so might lower structural service life or breach safety regulations [21]. Because tall buildings have multiple degrees of freedom, it is more difficult to identify structural damage caused by unknown seismic excitations. Examination of a classic energy balance reveals that only long-period excitation can transfer sufficient amounts of energy to tall steel moment-frame buildings to bring about their destruction. The shear-beam analogy suggests that these buildings have a typical mode of collapse or a few preferred modes of collapse when subjected to motions lasting such a long period of time. When compared to the natural time period of the structure, the input excitation period is typically much shorter. When this is the case, the structural floor displacement is approximately equivalent to the ground displacement but in the opposite direction, and the total work performed by base shear approaches zero [22,23,24]. The MSCSS, which uses rubber bearings, is emerging as a promising solution for seismic control in high-rise buildings. The structure exhibits high-order statically indeterminate behavior and a variety of failure mechanisms. Reinforcing members that have previously yielded will not improve the MSCSS’s seismic performance using lead rubber bearings (LRBs). Adjusting the damper parameters and LRBs can improve the structure’s seismic performance by optimizing its weakest failure mode [25].
Ductile seismic performance is now common in modern steel buildings, allowing them to withstand design-level main-shocks with minimal or repairable damage. This is especially crucial for steel structures subjected to seismic events, which need a fast assessment of the state of the damaged steel structures following the main shock. In the immediate aftermath of an earthquake, the extent of structural damage that has been caused should be assessed in terms of the margin of safety that remains before the building completely collapses. This is because earthquake-induced fatigue damage is basically defined by the rate of energy dissipation in relationship to time history [26,27]. Weak beam-to-column welded connections in pre-existing steel moment-resistant structures have fractured brittlely in recent major earthquakes. It was discovered that connection fracture plays a critical role in the seismic response of high-rise buildings to prevent the buildings from collapsing or sustaining serious damage. The connections fractured at substantially lower ductility ratios, according to limited study. Fracture propagation in beam-to-column connections with variable molded manufactured components (types of diaphragms and form of weld access hole) reduces strength and stiffness, increasing frame flexibility and column forces to hasten collapse [28,29,30].
According to the findings, the connecting region was the primary site of energy dissipation, accounting for more than 70% of the overall value. The node of the reticulated shell’s center of mass moves as the peak ground acceleration (PGA) increases; the displacement also amplifies and speeds up over time, but the shell’s vibrational state can remain stable. Either the reticulated shell’s displacement will not converge as the PGA climbs over a certain threshold, or the structure will collapse. When the structure has reached the critical failure stage, the members yield over a wide range, whereas the overall yield degree of the joints is low [31,32]. Damage to the structure can be stated as an attribute of an unexpected change in the material or geometric properties that are acting against the functioning of the system and adversely affecting its safety, dependability, and performance. As a result of the structure operating in an elastic–plastic state during seismic events and its dynamic response constantly decaying and fluctuating, structural dynamic responses contain both the structural properties as well as extensive seismic information in the time–frequency domain. As a consequence of this, there is a pressing requirement to devise a precise method for determining the extent to which an earthquake has damaged steel structures [33,34]. Despite the fact that all of these studies shed light on the extent to which MSCSSs are susceptible to excitation caused by earthquakes, it cannot be said that these studies were exhaustive and methodical in their investigation of the progression of damage and the development of the mechanism of collapse. It has not been possible to provide answers that are both exhaustive and unambiguous to questions such as “Where does structural damage occur across the structure’s height?” and “Is it possible that there is more than one region where damage has been localized?” An effort is made here to respond to these questions.
This work was performed with MSCSSs and various models. The MSCSSs were analyzed for damage using nonlinear time-history analysis (NTHA) to map out the structural damage and seismic response under various types of intense seismic time histories. The seismic performance of three MSCSS models was evaluated using a variety of seismic waves to draw a comprehensive conclusion and reduce the research gap.

3. Ground Motion Selection

A nonlinear dynamic analysis is carried out so that the seismic response and performance of various MSCSS configurations can be compared and contrasted. To accomplish this goal, there are three distinct types of seismic time histories, namely, ordinary ground motion and far-fault and near-fault pulse type ground motion. For the purpose of comparative analysis, five seismic time histories are utilized for each of these three distinct types of ground motion. These seismic time histories are chosen from the database maintained by the Pacific Earthquake Engineering Research (PEER), and Table 1 provides further information about them. Time histories considered to be near-fault are those in which the distance to the rupture surface (Rrup) is less than 15 km, whereas all other time histories are considered to be far-fault. The ground motion number is the parameter that is used for nonlinear dynamic analysis in accordance with ASCE 7–16 (nonlinear dynamic procedure, NDP). This number of motions is selected to achieve a balance that results in more accurate estimates of the mean structural responses. If unacceptable responses are found for more than one of the 15 motions, then using this larger number of motions has the advantage of indicating a significant likelihood that the structure does not achieve the 10% target collapse reliability for structures in Risk Categories I and II [35]. The total duration of these ground motions ranges from 20 to 66 s, and the interval between them is defined according to Kawashima and Aizawa as the exceedance of the first and last ground accelerations by more than ±0.1 g [36].
An analysis of the power spectrum is carried out for each of the 15 seismic waves corresponding to each of the three types of ground motions shown in Table 1. The results of the analysis are displayed in Figure 1. The findings indicate the following:
  • In the frequency domain, both the amplitude and the energy distribution of ordinary ground motion are very uniform.
  • The frequency band width of the near-fault ground motion is wider than that of the far-fault ground motion, although the majority of the energy distribution in the near-fault ground motion frequency range is concentrated in the low-frequency range, which corresponds to less than 1 Hz.
  • Both the amplitude and the energy of ground motions caused by far-fault earthquakes are primarily distributed in the low-frequency range, which is defined as having a frequency of less than 0.75 Hz.
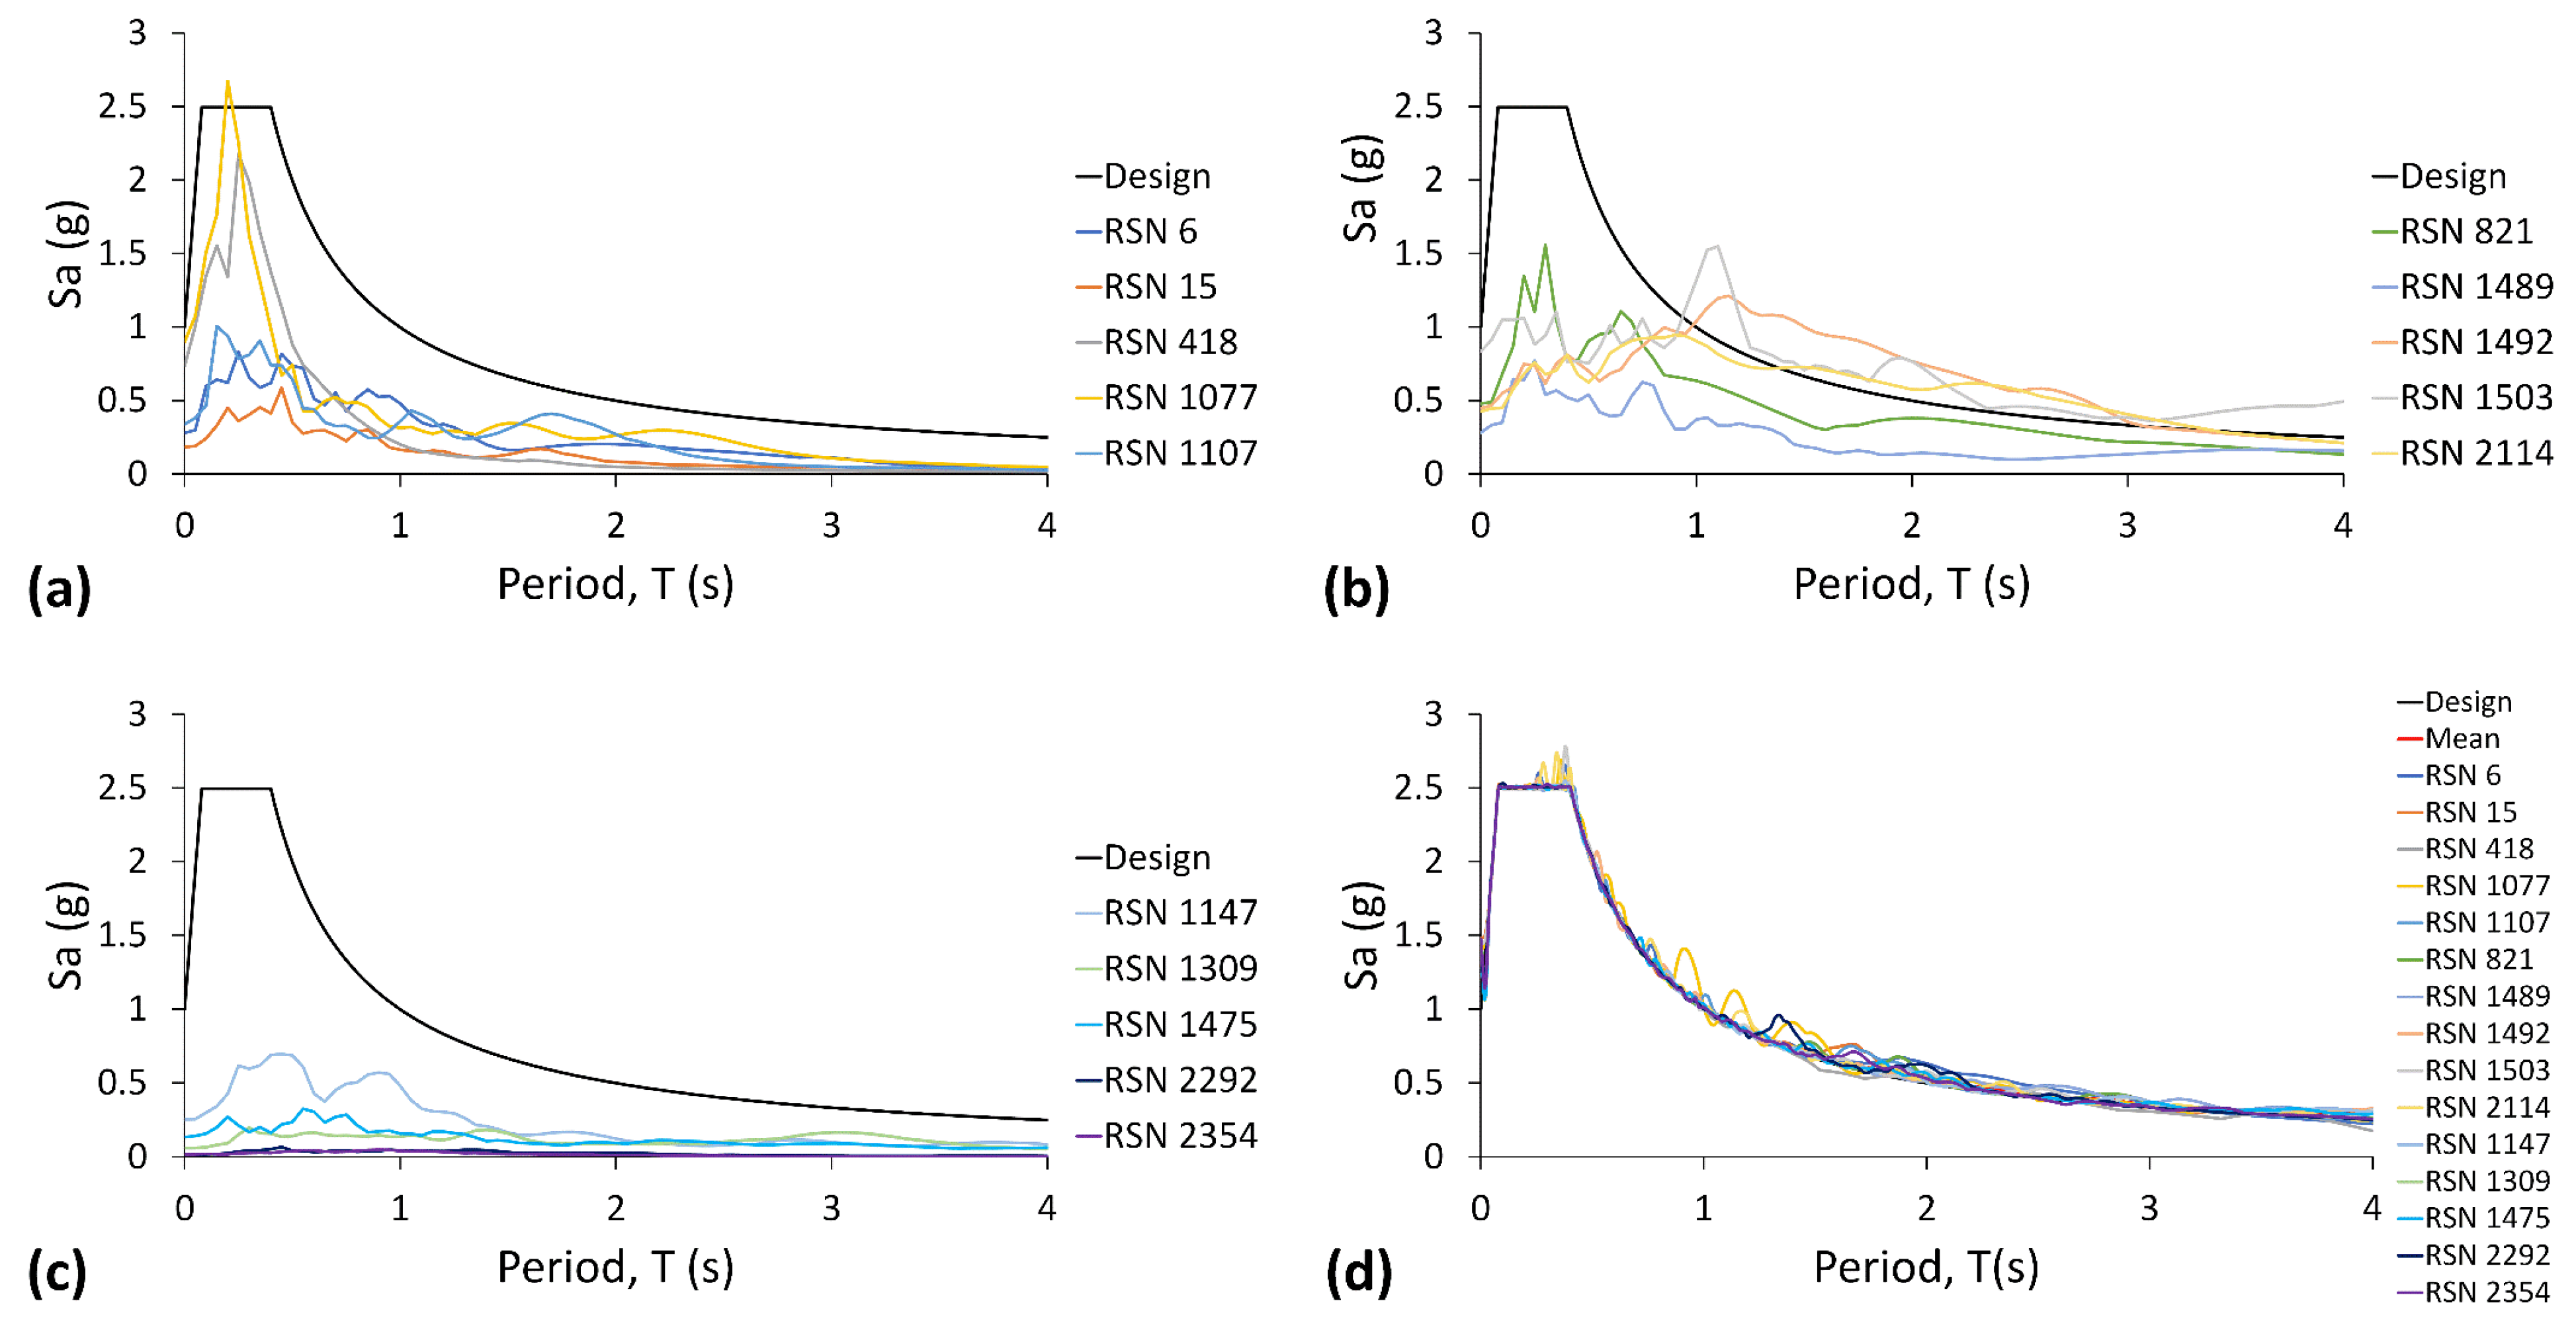
The design spectrum is created for the design-basis earthquake (DBE) using ASCE/SEI 41-17 [37] for soil type D, an 8 s long-period transition, and 5% damping. The spectral acceleration parameters SDS, SD1, and SDL, each with values of 2.5 g, 1 g, and 0.4 g, respectively, are taken into consideration. The maximum considered earthquake (MCE) has spectral acceleration parameters of 3.75 g, 1.5 g, and 0.6 g; these values represent SXS, SX1, and SXL, respectively. Time history scaling is accomplished through the utilization of the spectral matching method, which was principally recommended during the years 1987 and 1988 [38,39]. SesimoMatch is utilized for the purpose of spectral matching. This program was initially developed in 1992 as RSPMatch (a wavelet algorithm), but it was subsequently enhanced in 2006 [40,41]. The design spectrum is depicted in Figure 2, along with spectral matching.

4. Finite Element Model

The use of finite element models allows for the investigation of the structural control response for a variety of different configurations of the MSCSS when subjected to intense seismic excitations. The traditional MSS, which can be found in buildings such as the Bank of China in Hong Kong and the Tokyo Metropolitan Government Building, has been chosen to serve as the basic fundamental design for the various MSCSS configurations. The width of the MSCSS configuration is 40 m, and the structural height of the configuration is 144 m. The building contains a total of four megaframes, and each megaframe has its own eight-story substructure that has a story height of 4 m. Each story is subjected to a 10 kPa floor load, and all substructures have identical geometric characteristics.
The preparation and analysis of the finite element models are both performed with the help of ABAQUS (v6.13, Waltham, MA, USA). Every part of the structure, with the exception of the floors and SPSW infill panels, is fabricated in a 3D-modeling space using deformable wire. Flooring and infill panels are constructed from deformable shells. As a result of its ability to accommodate both axial stretching and biaxial bending, the three-node quadratic beam element, also known as B32, is used to model the deformable wire. Because of the insignificant impact that this approximation has on the findings [42], the finite element models that are used in this investigation do not include a fish plate in the process of connecting infill panels with boundary members. To model the infill panels and floors, shell element S8R5’s eight nodes are utilized, each of which has five degrees of freedom (DoFs), and hourglass control significantly contributes to an increase in convergence. The rotation about the out-of-plane axis is accounted for in the model as a result of the independence that exists between the rotational and translational degrees of freedom. As a direct consequence of this, the transverse shear deformation along the cross section is taken into consideration. For the purpose of analysis, a central difference-based dynamic explicit solver is applied because computation for stress wave propagation is more accurate, small-time increments significantly increase the precision, and convergence is smoother. The various models of MSCSS that are investigated in this study are depicted in Figure 3, which shows both an elevation view and plans for those models.
ASTM A36 steel material properties are assigned to the infill panels, ASTM A992 grade 50 steel material properties are assigned to the section members, and concrete class C30 material properties are allotted to the floor slabs. These materials are modeled to exhibit isotropic elastoplastic behavior with high-level strain reversal due to the Bauschinger effect, which also provokes kinematic hardening during seismic loading. It cannot be refuted that the Johnson-Cook plasticity model, in conjunction with its dynamic failure model, is of high quality and can be relied upon, which is why it is utilized in the simulation process to determine how the material behaves.

4.1. Johnson-Cook Model

In the Johnson-Cook model, the hardening behavior and strain-rate dependence of the yield stress are specified using closed-form analytical equations based on the von Mises plasticity model. The following equation represents the yield stress that can be expected from this model.
σ ¯ = [ X + Y ε ¯ p l ) n 1 + Z l n ε ¯ ˙ p l ε ¯ ˙ 0 1 T n d s r
where σ ¯ is the yield stress at a nonzero strain rate, X is the uniaxial yield strength, Y is the plastic strain hardening coefficient and n represents its exponential, ε ¯ p l is the equivalent plastic strain with rate ε ¯ ˙ p l , ε ¯ ˙ 0 is the reference strain rate, Z and sr represent the strain rate and thermal softening effect, respectively, and Tnd is the nondimensional temperature.
From Equation (1), Tnd is defined as follows:
T n d     0 f o r T < T t r a n s T T t r a n s T m e l t T t r a n s f o r T t r a n s T   T m e l t 1 f o r T > T m e l t
where T and T m e l t are the current and melting temperatures, respectively, and T t r a n s is the transition temperature at or below which the yield stress expression is temperature independent.
Based on the equivalence of plastic strain at the element’s integration points, the Johnson-Cook dynamic failure model can be used to model progressive damage and material failure, which occurs when a damage parameter α exceeds 1 and is expressed as follows:
α = ε ¯ p l ε ¯ f p l
where ε ¯ f p l is the failure strain and is represented as:
ε ¯ f p l = d 1 + d 2 exp d 3 p q 1 + d 4 l n ε ¯ ˙ p l ε ¯ ˙ 0 1 + d 5 T n d
where d1 is the initial failure strain, d2 is the exponential factor, d3 is the triaxiality factor, d4 is the strain rate factor, and d5 is the temperature factor. Here, d1 to d5 are failure parameters at T t r a n s , p/q is the stress triaxiality, and η is the ratio of the mean stress to the von Mises effective stress.
The progressive damage variable, d, is expressed in terms of the displacement type linear softening law, which models progressive damage of the material.
d = x ¯ p l x ¯ f p l
where x ¯ f p l and x ¯ p l are the effective failure plastic displacement and effective plastic displacement, respectively, x ¯ p l is equal to L e ε ¯ ˙ p l , L e is the characteristic length, and element deletion occurs when d equals one, corresponding to damage over the entirety of the element.
Table 2 summarizes the parameters for ASTM A36 and A992 steel used in the Johnson-Cook plasticity model as well as the model for its dynamic failure [43,44,45].

4.2. MSCSS Configurations

In this study, the structural response to seismic excitations is investigated using three distinct MSCSS configurations, and a detailed analysis of structural damage is also conducted. The following is a summary of the highlighted aspects of these configurations:
  • An MSCSS without dampers, which was initially proposed by Zhang et al. [8] and later studied by Wang et al. [15].
  • An MSCSS with dampers, which was proposed by Abdulhadi et al. [13]. Within this configuration, there are 24 viscous dampers, with 8 located within each substructure and situated above the initial megabeam. The viscous damper constant Cv and the damper velocity exponent α are 105 MNsm−1 and 0.3, respectively.
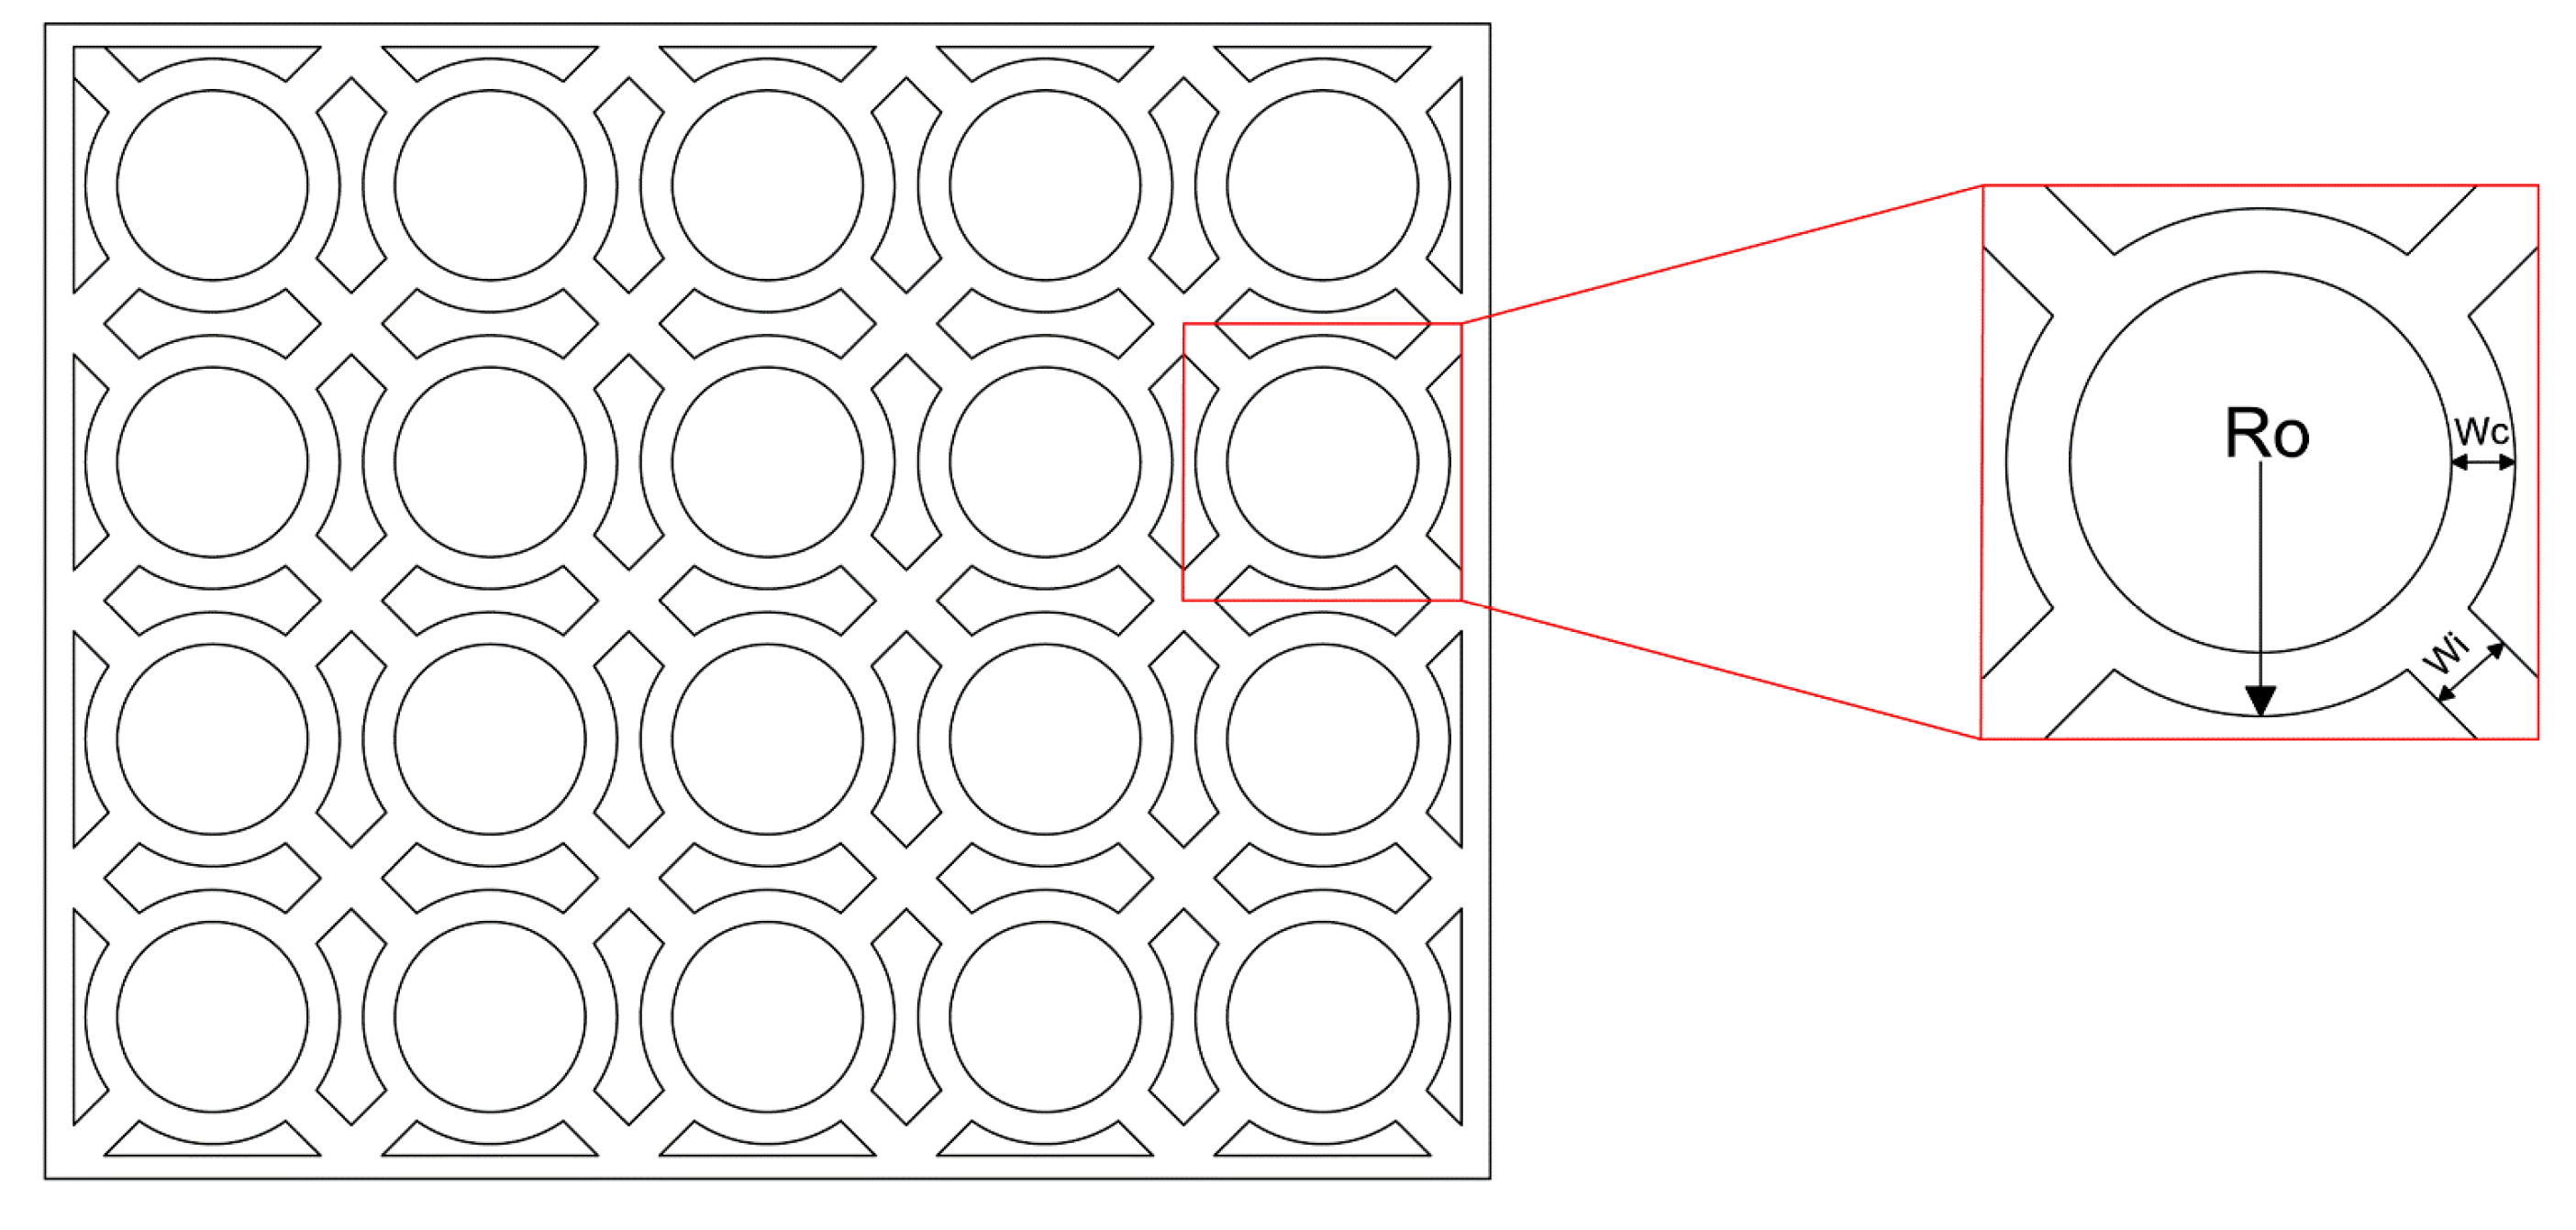
  • An MSCSS with an SPSW has an RS-SPSW in the center of the structure. This model was proposed by Muhammad et al. [19]. Figure A1 and Table A1 of Appendix A both show the infill panels’ details along with the section members listed in Table 3.

4.3. Experimental Verification

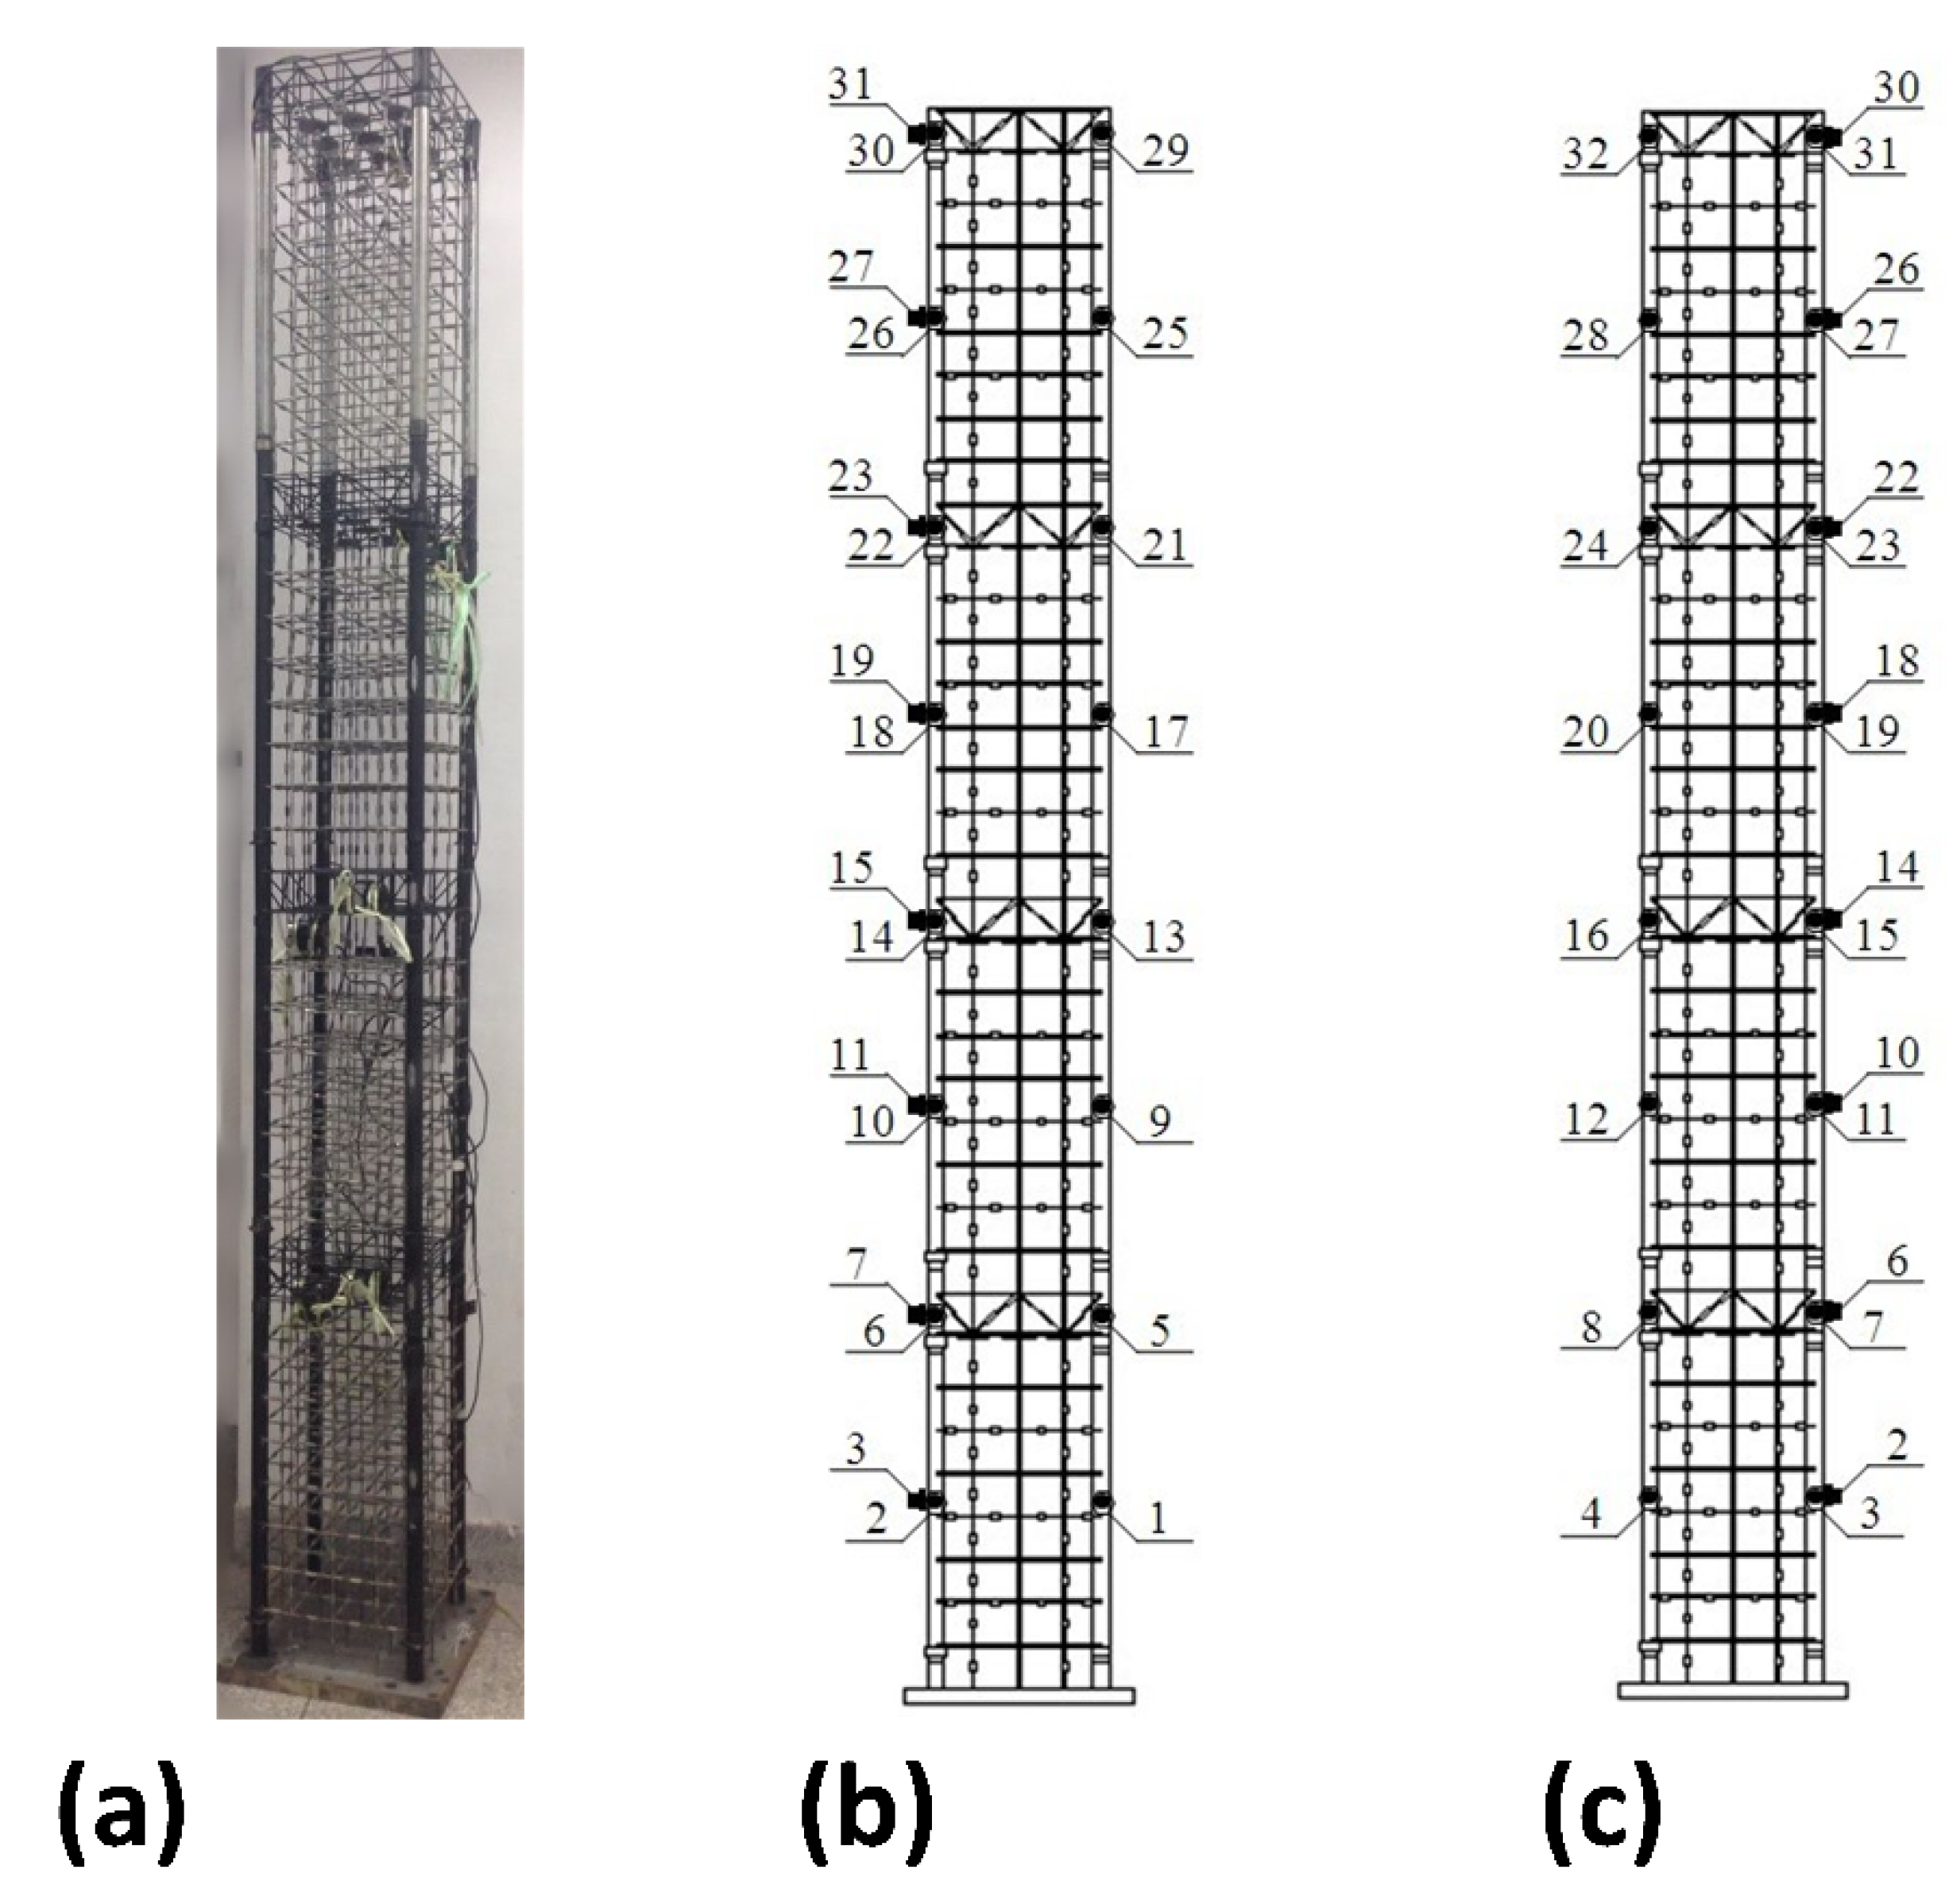
Identifying the natural frequencies of high-rise buildings is vital to various practical applications, such as the design verification and the detection of structural damage. As a result, the research conducted by Zheng et al. [46] was chosen to validate the accuracy of the finite element simulation under seismic loading. As can be seen in Figure 4, MSCSS was made out of Q235 steel in accordance with “GB/T342-1997 Dimension Shape Mass and Tolerance for Cold-Drawn Round Square and Hexagonal steel Wires”. It has 36 floors and may be subdivided into one megastructure, four substructures with eight stories each, and one megastructure. The overall length of the MSCSS frame is 2.96 m, as shown in Figure 4a, because the scale between the natural and designed models is 1:100, and the interfloor space of the substructure is 100 mm while that of the megastructure and the standard ones is 80 mm. Figure 4b,c displays a diagrammatic representation of sensor placement. The MSCSS experimental model was compared to the MSCSS finite element model without a floor and dampers.
The comparisons between the experimental and simulated frequencies, along with the percentages of their respective deviations, are presented in Table 4. Table 4 results show a good agreement between experimental and simulated outcomes. The first two models’ simulated modal frequencies differed by less than 1.5%, whereas the torsional mode (third modal) deviated by 12.642%. This inaccuracy is caused by manually applied torsion forces completed in both the X and Y directions. The coupling impact of those imperfections along the X and Y axes will be enhanced compared to their separate cases. Furthermore, the residual stresses of the frame along these two directions will be different and asymmetric, thus causing an additional mistake in the torsion analysis.
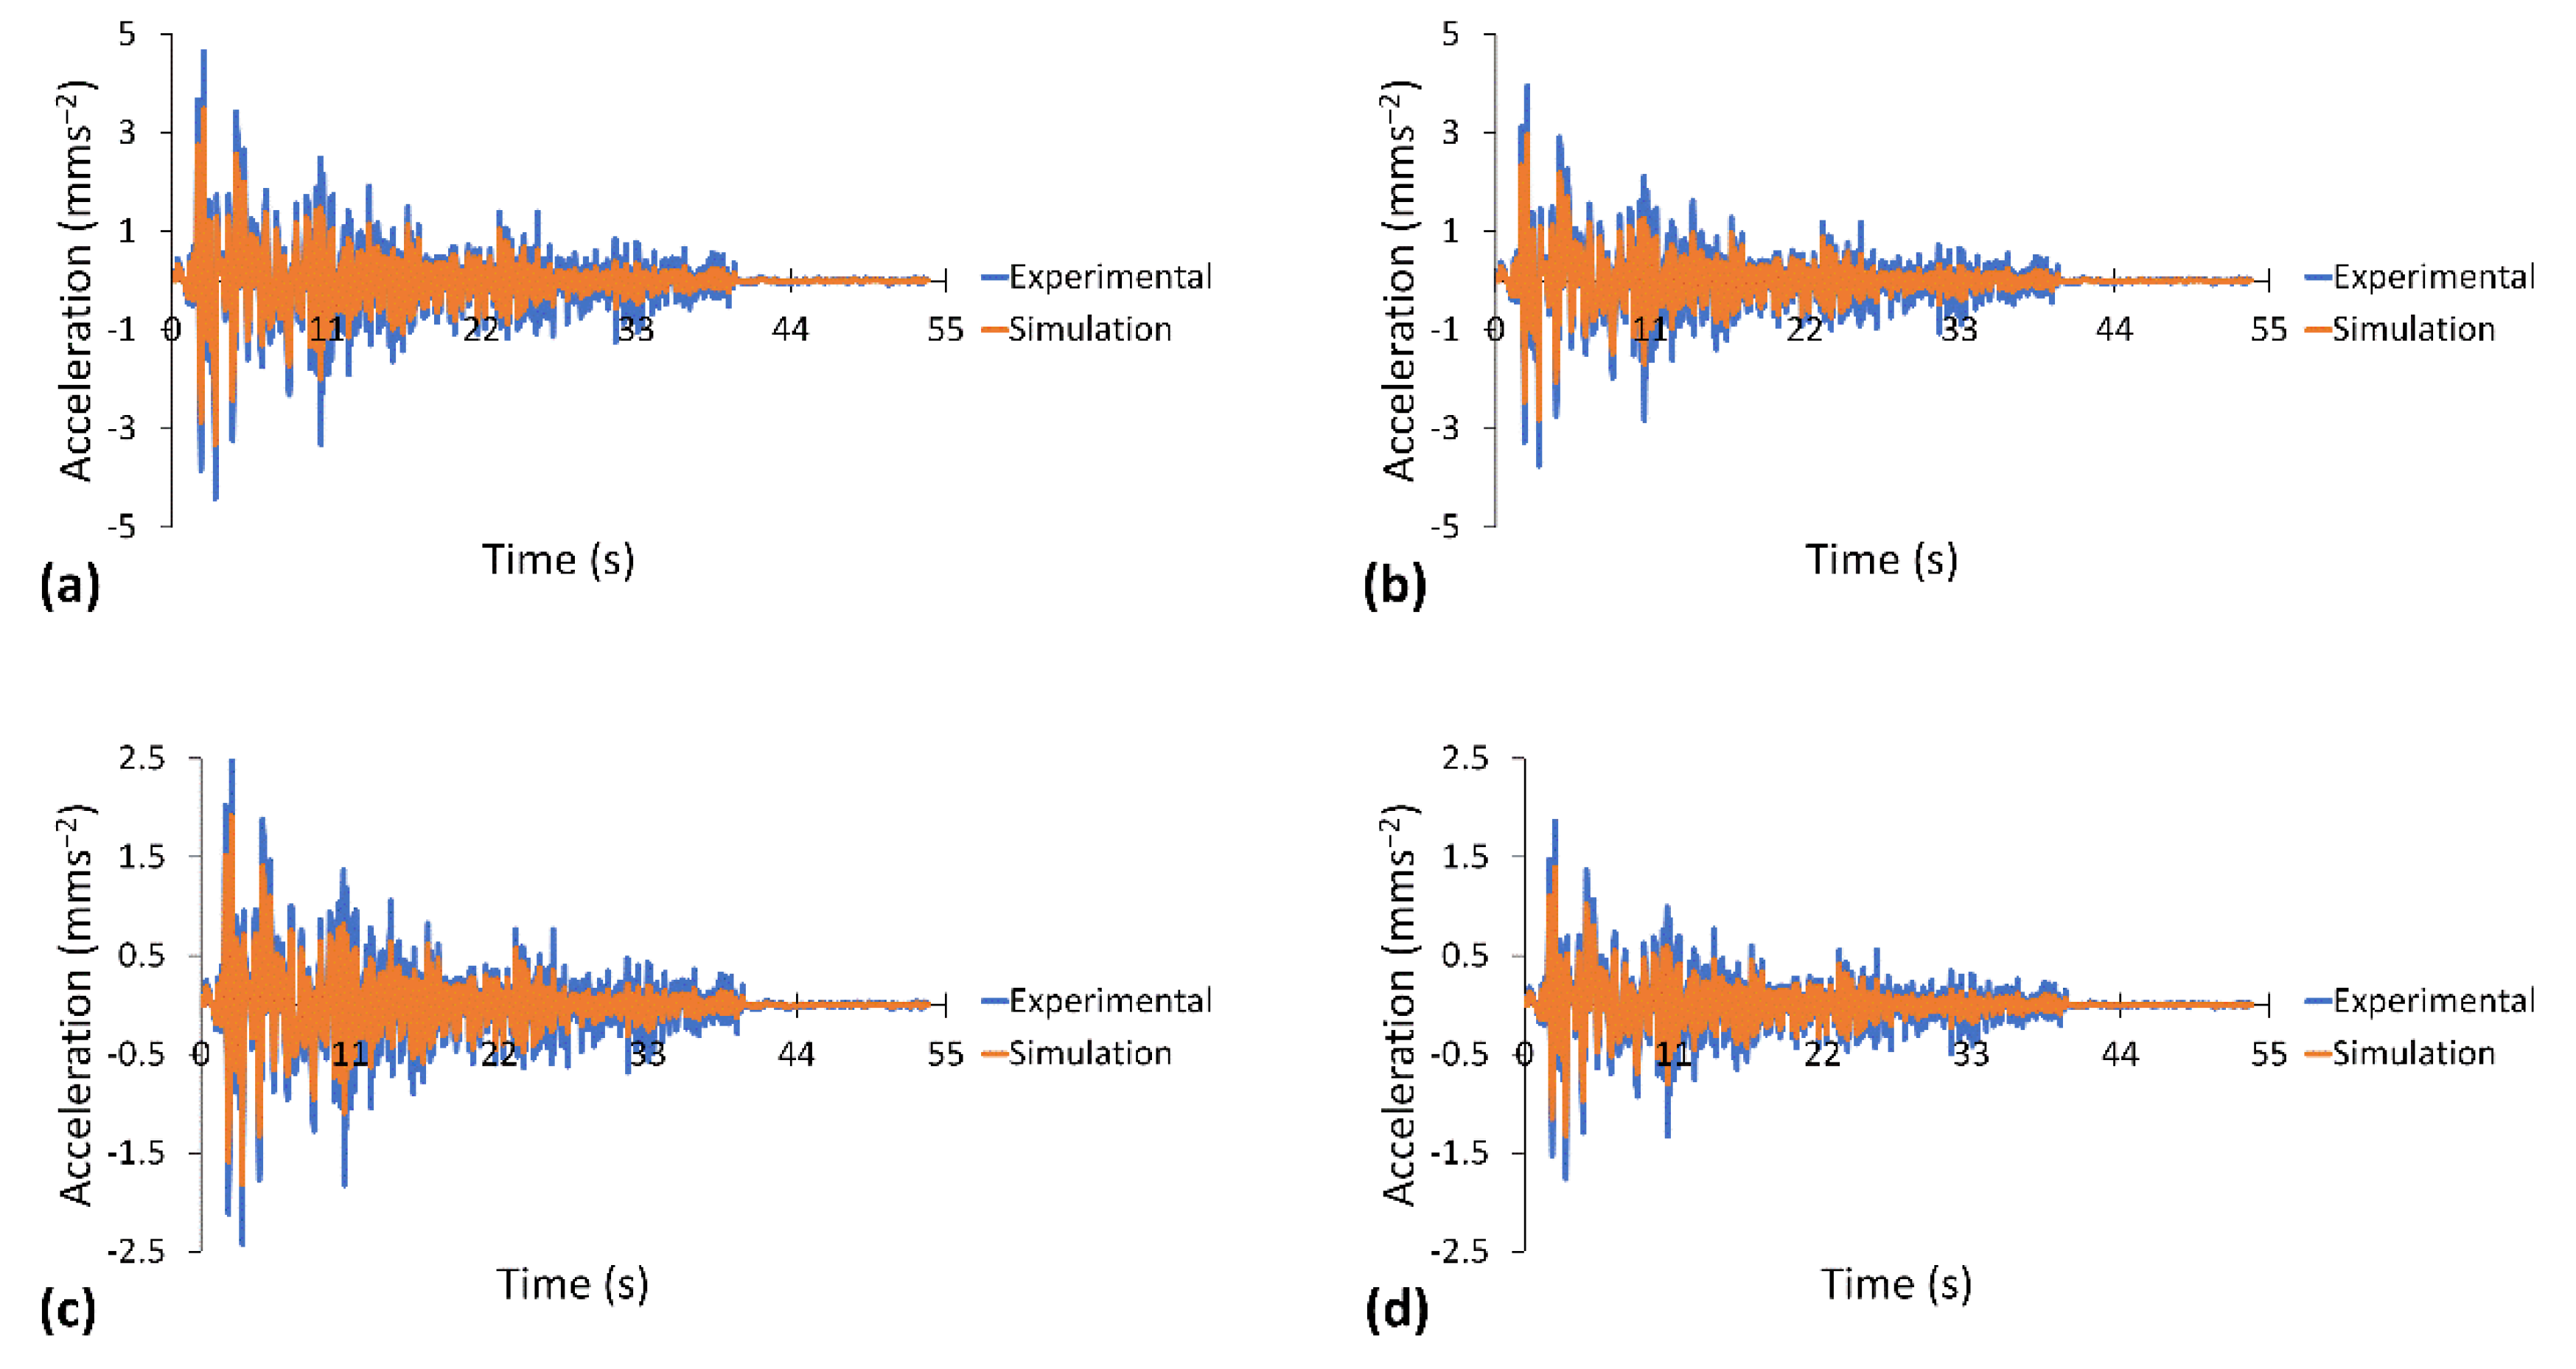
Figure 5 displays a comparison between the structural acceleration response from experimental results and a simulated model under the El Centro (RSN 6) wave. The comparison was carried out in order to investigate how well the simulated model predicted the experimental results. The results of both the experiment and the simulation are consistent with one another, and the precision of both is within a margin of error of ±25%, as shown in Figure 5a–d. At the top of the experimental model, the maximum transient acceleration of 4.647 mms−2 was recorded at 2.25 s, whereas the simulation model indicated a maximum transient acceleration of 3.485 mms−2, as shown in Figure 5a. In light of the fact that the results of structural acceleration response and modal frequencies display strong concordance between them, the simulated models have been altered as a consequence.

4.4. Modal Analysis:

MSCSS modal analysis is performed on all three configurations of the system. According to the findings, the MSCSS without dampers has the maximum fundamental natural period, which is 4.555 s. Since the addition of dampers to the MSCSS has no discernible effect on the modal frequencies, the modal time periods with and without dampers are almost identical [47,48]. On the other hand, the MSCSS with the SPSW has a fundamental natural period that is approximately 27.2% less. This is because the shear wall increases the structural stiffness. The effect of dampers on the fundamental natural period of a structure is insubstantial because the natural period of the structure diminishes by only 0.04%. Modal time periods and frequencies are depicted in Table 5, and the MSCSS’s first three modal shapes with the SPSW are illustrated in Figure 6.

5. Stress Nephogram Analysis

The stress nephogram is able to not only objectively analyze the structural damage in MSCSS configurations, but also provide an intuitive representation of the stress distribution throughout the structure when it is subjected to various types of intense seismic excitation. For that reason, the stress nephogram is utilized in this paper to investigate the structural damage. After conducting the stress nephogram analyses, the following observations are made.

5.1. Under Ordinary Ground Motion

Different behaviors are exhibited by the three MSCSS configurations when subjected to an ordinary set of ground motions, despite a generally similar pattern of stress distribution. On the other hand, the presence of infill panels of the SPSW at the first floor in the megaframe of the MSCSS with the SPSW prevents stress concentrations in the ground floor columns. This is the case even though ground floor columns in the MSCSSs with and without dampers are known to exhibit stress concentrations. The maximum stress is observed in the MSCSS without dampers at the ground floor columns, particularly in the megaframe columns. On the other hand, the MSCSS with the SPSW does not exhibit the maximum stress in its structural integral members because the infill panels have high stress concentrations. This is because the infill panels provide structural resistance against the lateral forces that come from seismic excitations. High stress concentrations can be found in the structure beneath the first megabeam in each of the MSCSS configurations, along with the megaframe and megabeams one through three. When counting from the top, the second and third substructures both show significant signs of high stress concentrations in the MSCSSs with and without dampers. However, in the MSCSS with the SPSW, only the third substructure shows these concentrations of stress. When the seismic excitation reaches its maximum acceleration, the stress in the structure underneath the first megabeam in the MSCSS without dampers reaches or even exceeds the material’s yield strength.
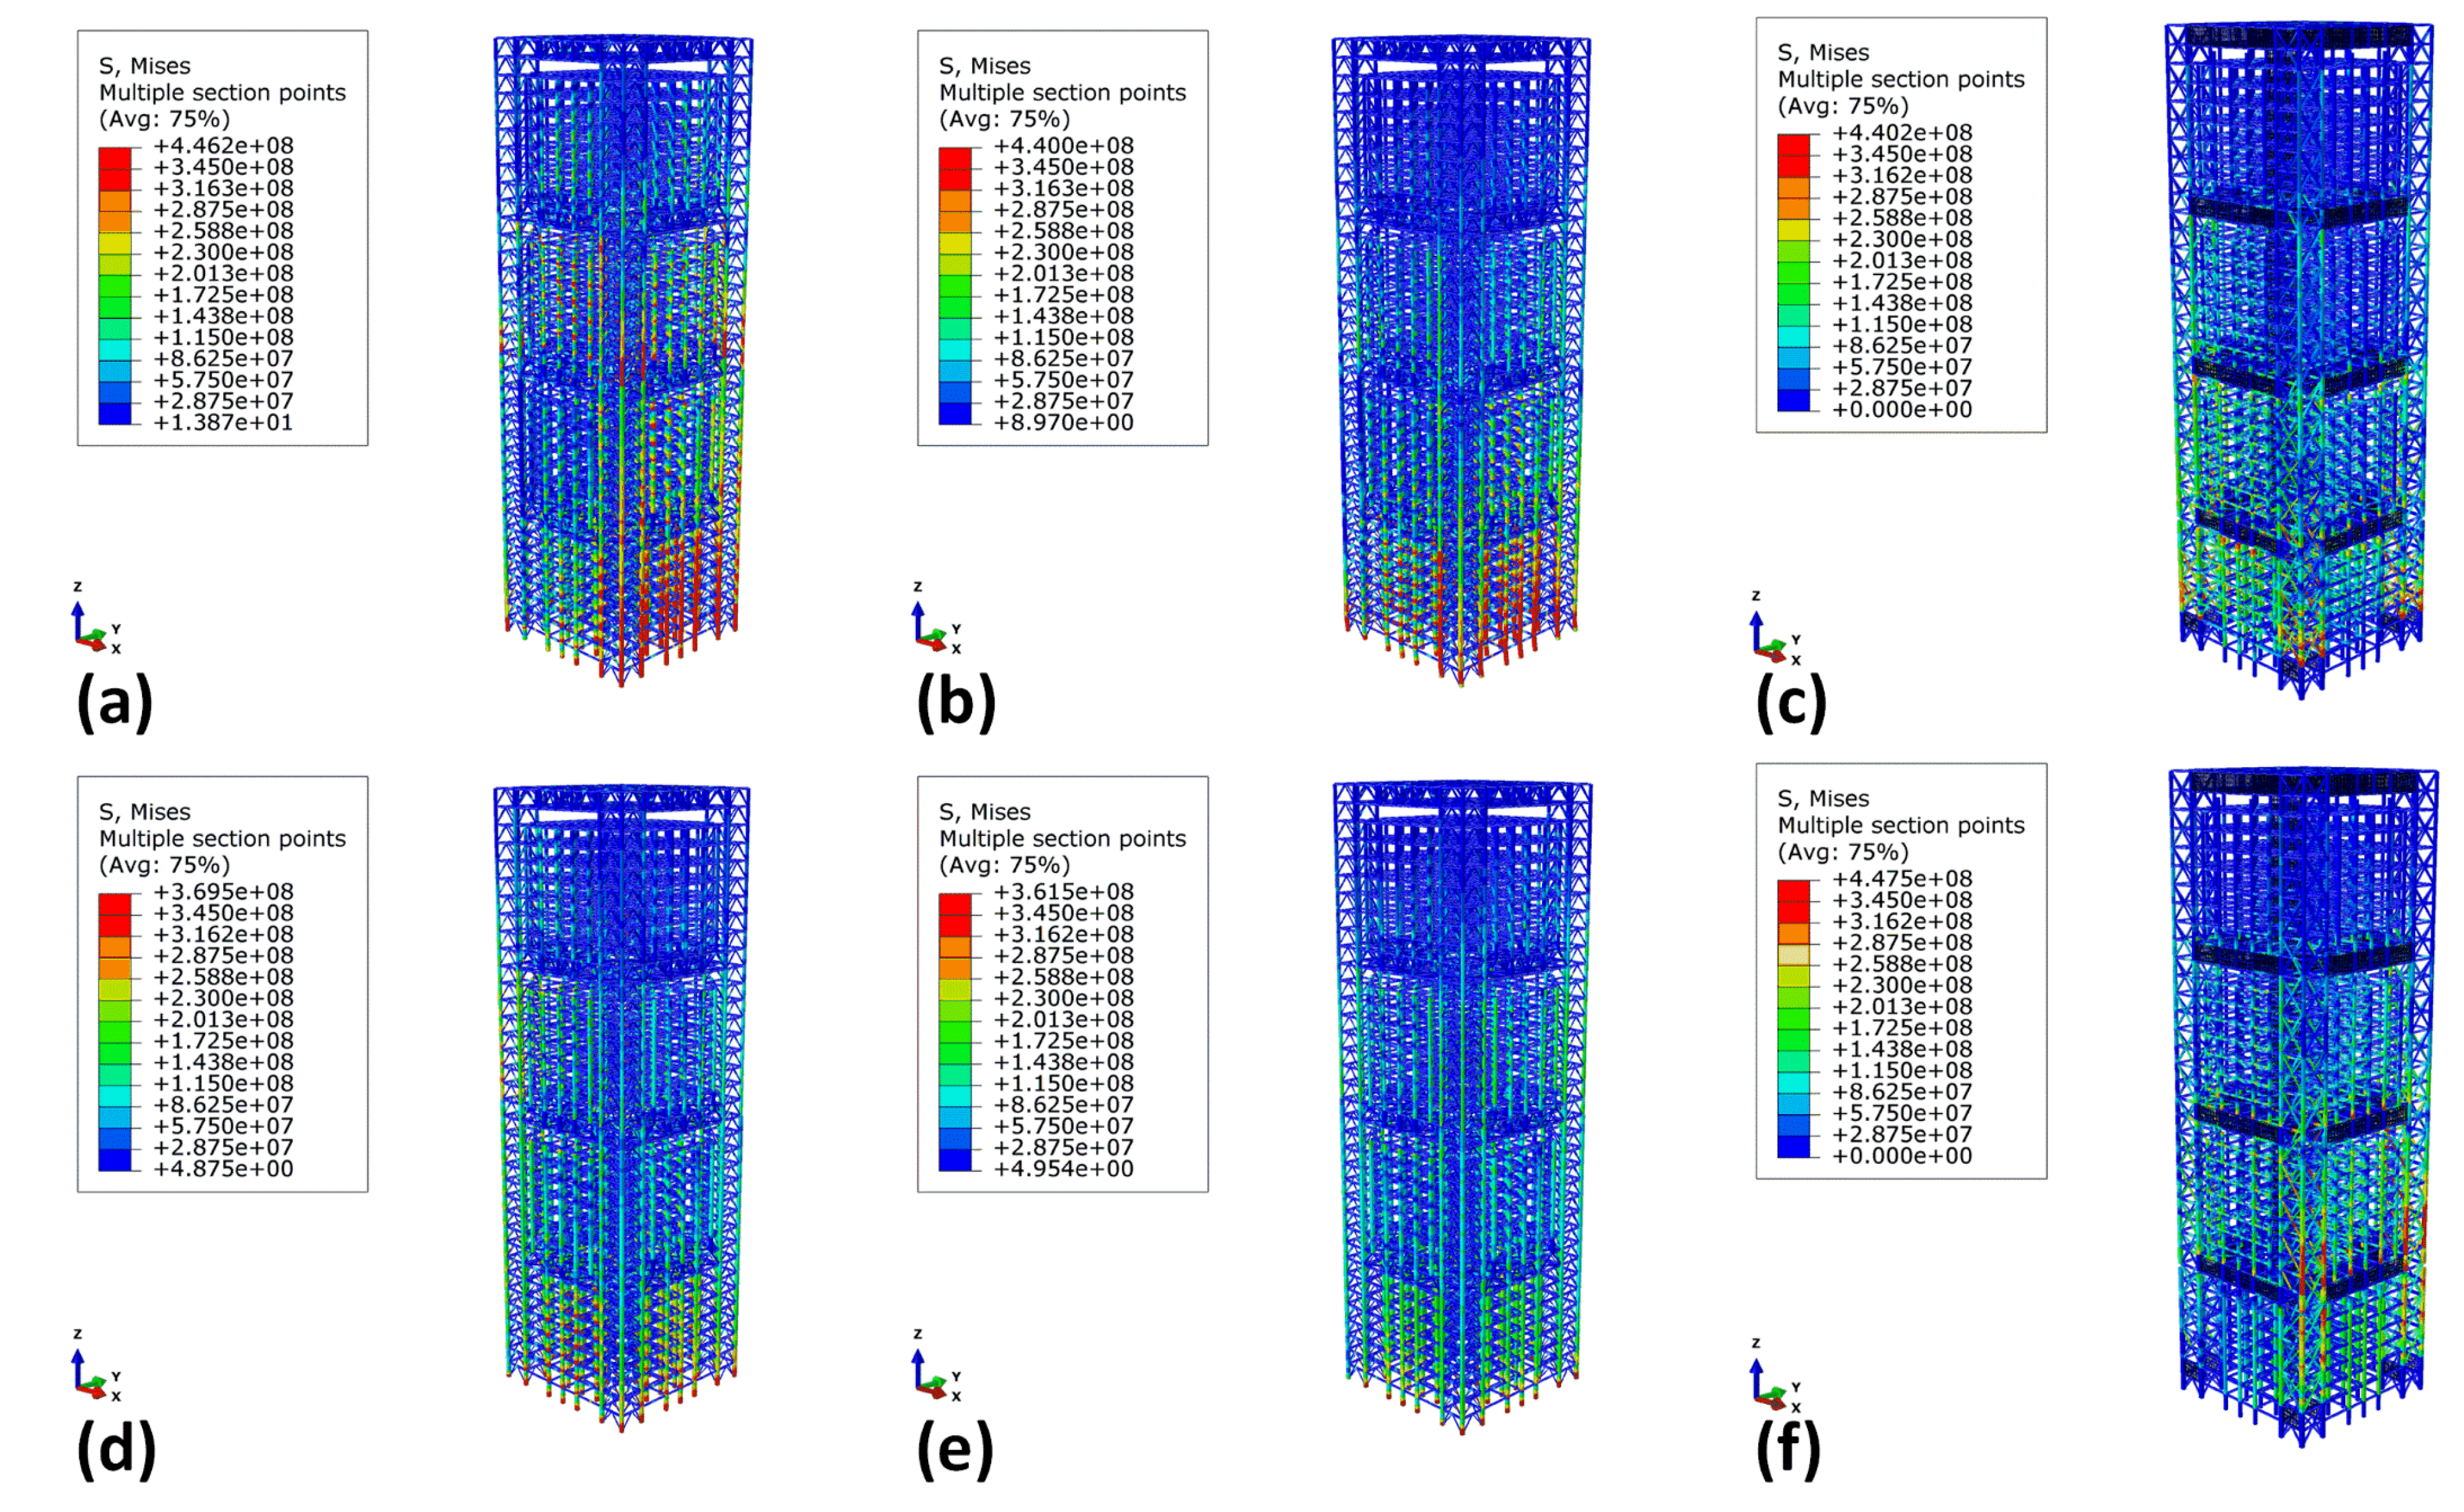
Stress nephograms of MSCSS configurations subjected to the 1940 El Centro earthquake conditions can be found in Figure 7. At the end of the earthquake, the MSCSS without dampers exhibits the maximum von Mises stress. As shown in Figure 7a, a high stress concentration can be observed in the column located on the ground floor. The maximum von Mises stress in the MSCSS with the SPSW is 426 MPa; however, this stress manifests itself only in the infill panels of the shear wall; structural integral members are not subjected to any stresses that are dangerously close to their yield strength, as shown in Figure 7c. The MSCSS configurations with and without dampers display a stress distribution that is analogous throughout their structures. The stress distribution trend in the megaframes of all three MSCSS configurations is very similar, as the majority of the stress concentration can be found in the megacolumns located beneath the third megabeam. When the ground acceleration reaches its peak during the earthquake, the majority of the structure underneath the first megabeam in the MSCSS without dampers is subjected to high von Mises stresses, and these stresses reach the point where the material yields, which is equivalent to 345 MPa. A high stress concentration is also observed in the megacolumn located between the second and third megabeams, as depicted in Figure 7d. The trend of the stress distribution in the MSCSS with dampers is quite similar to that demonstrated by the MSCSS without dampers; however, the stresses in the MSCSS with dampers are not as high as those in the MSCSS without dampers. The substructures of the MSCSS equipped with an SPSW do not experience high stresses during the peak of the ground acceleration, as shown in Figure 7f, and high stresses can be detected in the megacolumns up to the third megabeam; however, these stresses are significantly lower than the material’s yield strength.

5.2. Near-Fault Ground Motion

When compared to ordinary ground motions, the stresses that are imposed on all three MSCSS configurations are significantly higher when they are subjected to near-fault ground motions. The stress distribution trend in the MSCSSs with and without dampers is similar to that in ordinary ground motions, but the MSCSS with the SPSW exhibits stresses near the yield strength or higher in structural integral members other than infill panels. In every MSCSS configuration investigated in this study, there is a significant amount of stress concentration beneath the first megabeam. The MSCSSs with and without dampers exhibit high von Mises stresses, which results in yielding of the structural integral members located underneath the first megabeam. Without dampers, the structural members between the second and third megabeams, particularly the megacolumn members, are subjected to stress that is greater than their yield strength. At the peak of the ground acceleration, the ground floor columns of the MSCSS structures with and without dampers are subjected to stresses that are either higher than or quite close to the point where the structure yields. In the MSCSS equipped with the SPSW, the yielding stress is reached in the structural members of the megacolumn that are located between the first and second megabeams.
Figure 8 displays the stress nephogram of MSCSS configurations under conditions equivalent to those of the 2002 Denali earthquake. At the conclusion of the earthquake, the MSCSS model without dampers exhibits the maximum von Mises stress, which is 446 MPa. This value is the highest among all of the MSCSS models and can be seen in Figure 8a. For all of the MSCSS models, the structure below the first megabeam exhibits the maximum stresses when compared to other parts of the structure, as shown in Figure 8a through Figure 8c. In that region of the MSCSS, the majority of the structural members, whether the system has dampers or not, are subjected to the yielding stress. A number of the staggered structural members in the MSCSS without dampers are, up to the third megabeam, subjected to stresses that are greater than their yield strength. Yielding stresses are also exerted on the structural members of the megacolumn located on the third story of the MSCSS with the SPSW. When the seismic excitation reaches its peak acceleration, yielding stresses are observed in the first story columns in the MSCSSs with and without dampers, while structural damage is also observed in some other members underneath the first megabeam in the MSCSS without dampers, as shown in Figure 8d. The MSCSS with the SPSW depicts yielding stresses in some megacolumn members beneath the second megabeam.

5.3. Under Far-Fault Ground Motion

Despite a generally similar pattern of stress distribution, the three MSCSS configurations exhibit distinct behaviors when subjected to far-field ground motions compared to other types of ground motions. The first story columns in the MSCSSs with and without dampers show signs of structural damage as the stress surpasses the yield stresses, while on the other hand, due to the presence of SPSW infill panels on the first floor of the megaframe of the MSCSS with the SPSW, the corresponding columns show no sign of structural damage. Nevertheless, stress concentrations are known to exist in first-story columns in MSCSSs both with and without dampers, as these columns directly resist the base shear caused by ground movement. Structural damage is observed beneath the first megabeam in all MSCSS configurations, but the MSCSS without dampers shows structural members with maximum yielding, while the minimum damage is found in the MSCSS with the SPSW. Tracking from the top, the second and third substructures both exhibit significant signs of high von Mises stress concentrations in the MSCSSs with and without dampers. However, only the third substructure in the MSCSS with the SPSW shows these stress concentrations. In some instances, when the seismic amplification reaches its peak acceleration, the stress in the structure beneath the first megabeam in the MSCSSs with and without dampers surpasses the material’s yield strength.
Stress nephograms of MSCSS configurations as they were subjected to the conditions of the 1999 Chi-Chi earthquake can be found in Figure 9. The maximum von Mises stress of 447 MPa is observed in the first story column of the MSCSS without dampers, which is what causes the structural damage in those columns. In the MSCSS equipped with dampers, the stresses in some of the integral structural members are also relatively higher than the yielding strength. When the ground acceleration reaches its maximum, as shown in Figure 9d,e, the structural damage that occurs in the first story of the MSCSSs with and without dampers is triggered. On the other hand, in the MSCSS equipped with the SPSW, the stresses in some of the structural members beneath the first megabeam are significantly close to (but do not exceed) the yielding strength, as shown in Figure 9c. Although the MSCSS with the SPSW exhibits stress concentrations throughout its megaframe when the seismic acceleration reaches its peak during its time history, this stress is significantly lower than the yield stress, and structural damage is observed only in the infill panels of the shear wall.

5.4. Equivalent Plastic Strain

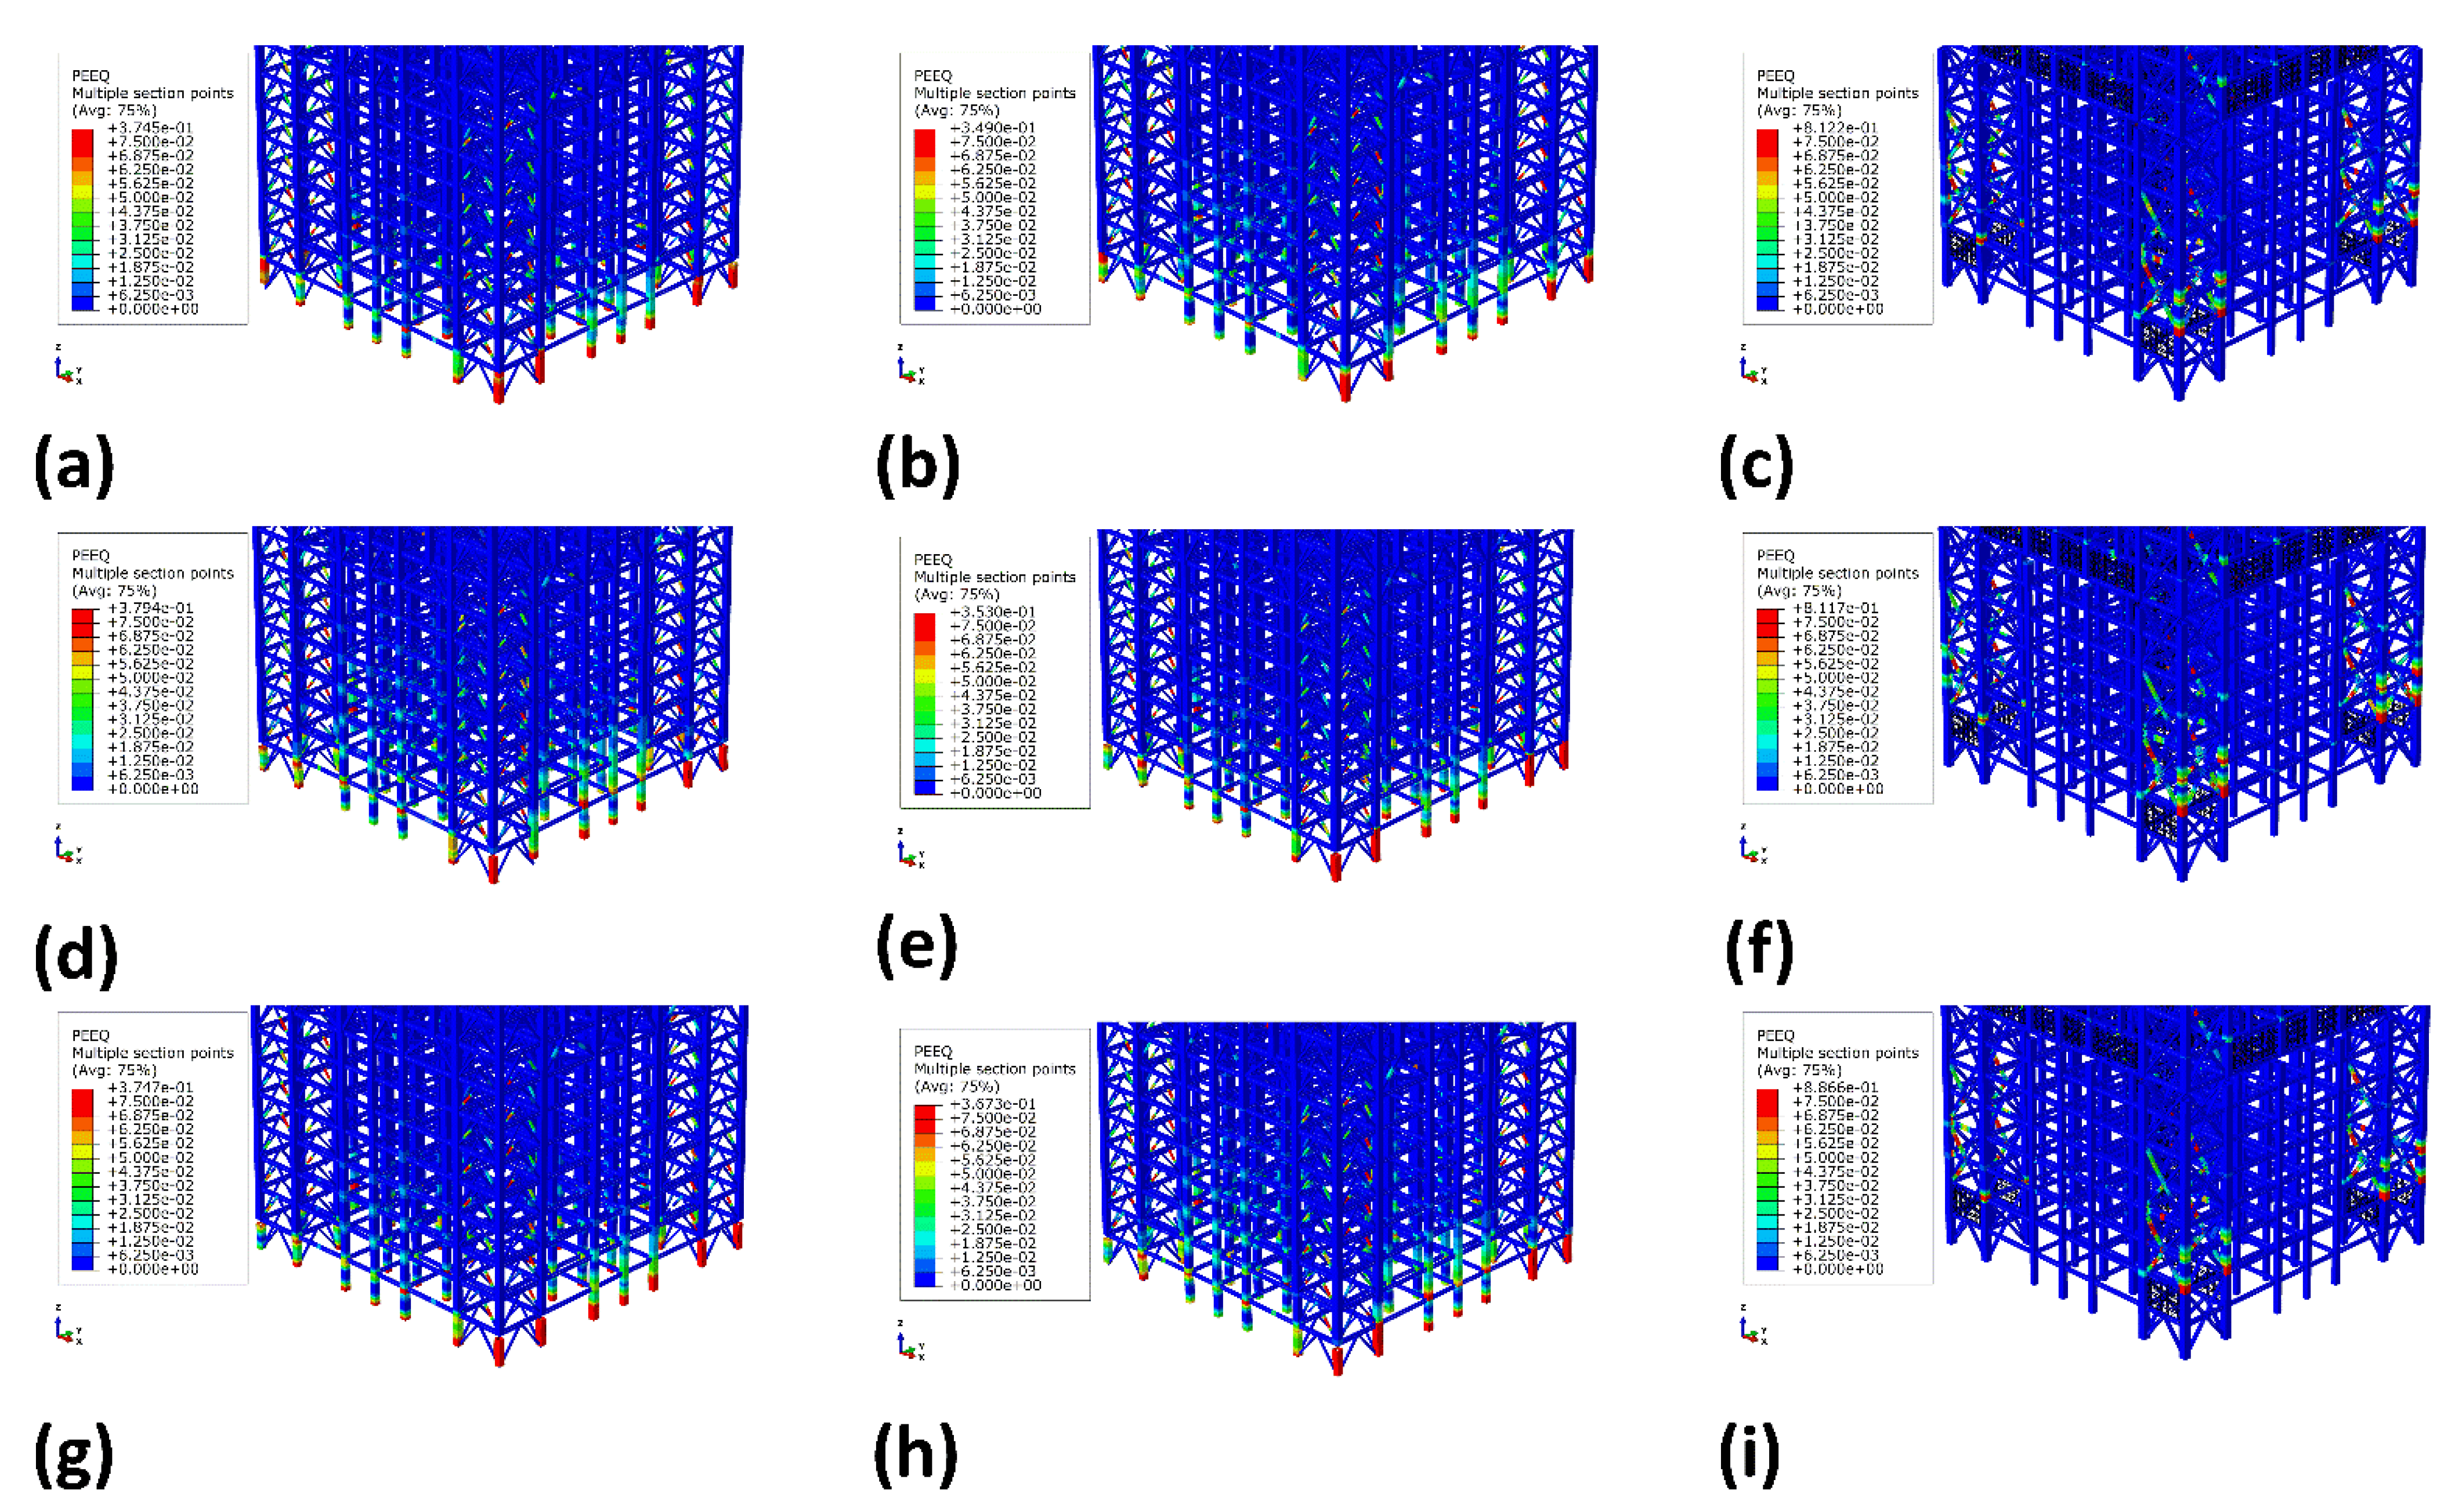
As in ABAQUS, during the loading process, the equivalent plastic strain (PEEQ) is evaluated in the whole structure to investigate the plastic deformation that occurs in the MSCSS configurations. The PEEQ corresponds to the accumulation of the plastic strain that occurs in the elements of the finite element model, and it can represent the final damage that occurs to the structure. According to the results of the analysis as a general trend, the MSCSSs with and without dampers show structural damage in terms of plastic deformation in first-story columns, particularly at the toe of the columns. In addition, plastic deformation takes place in the megacolumn bracings located beneath the first megabeam as well as between the second and third megabeams. In contrast, most of the structural damage in the MSCSS equipped with the SPSW takes place in the infill panels of the shear wall and in the megaframe columns located on the second story of the structure. It is evident from the PEEQ nephogram that under near-fault ground motions, all of the MSCSS configurations undergo more structural damage compared to the structural response under other types of ground motions, as illustrated in Figure 10. In general, the MSCSS with the SPSW displays more structural damage in its infill panels when subjected to a far-fault earthquake. The MSCSS substructures with the SPSW do not exhibit any signs of plastic deformation, which is in contrast to the other two configurations, which do exhibit plastic deformation in the second and fourth substructures.
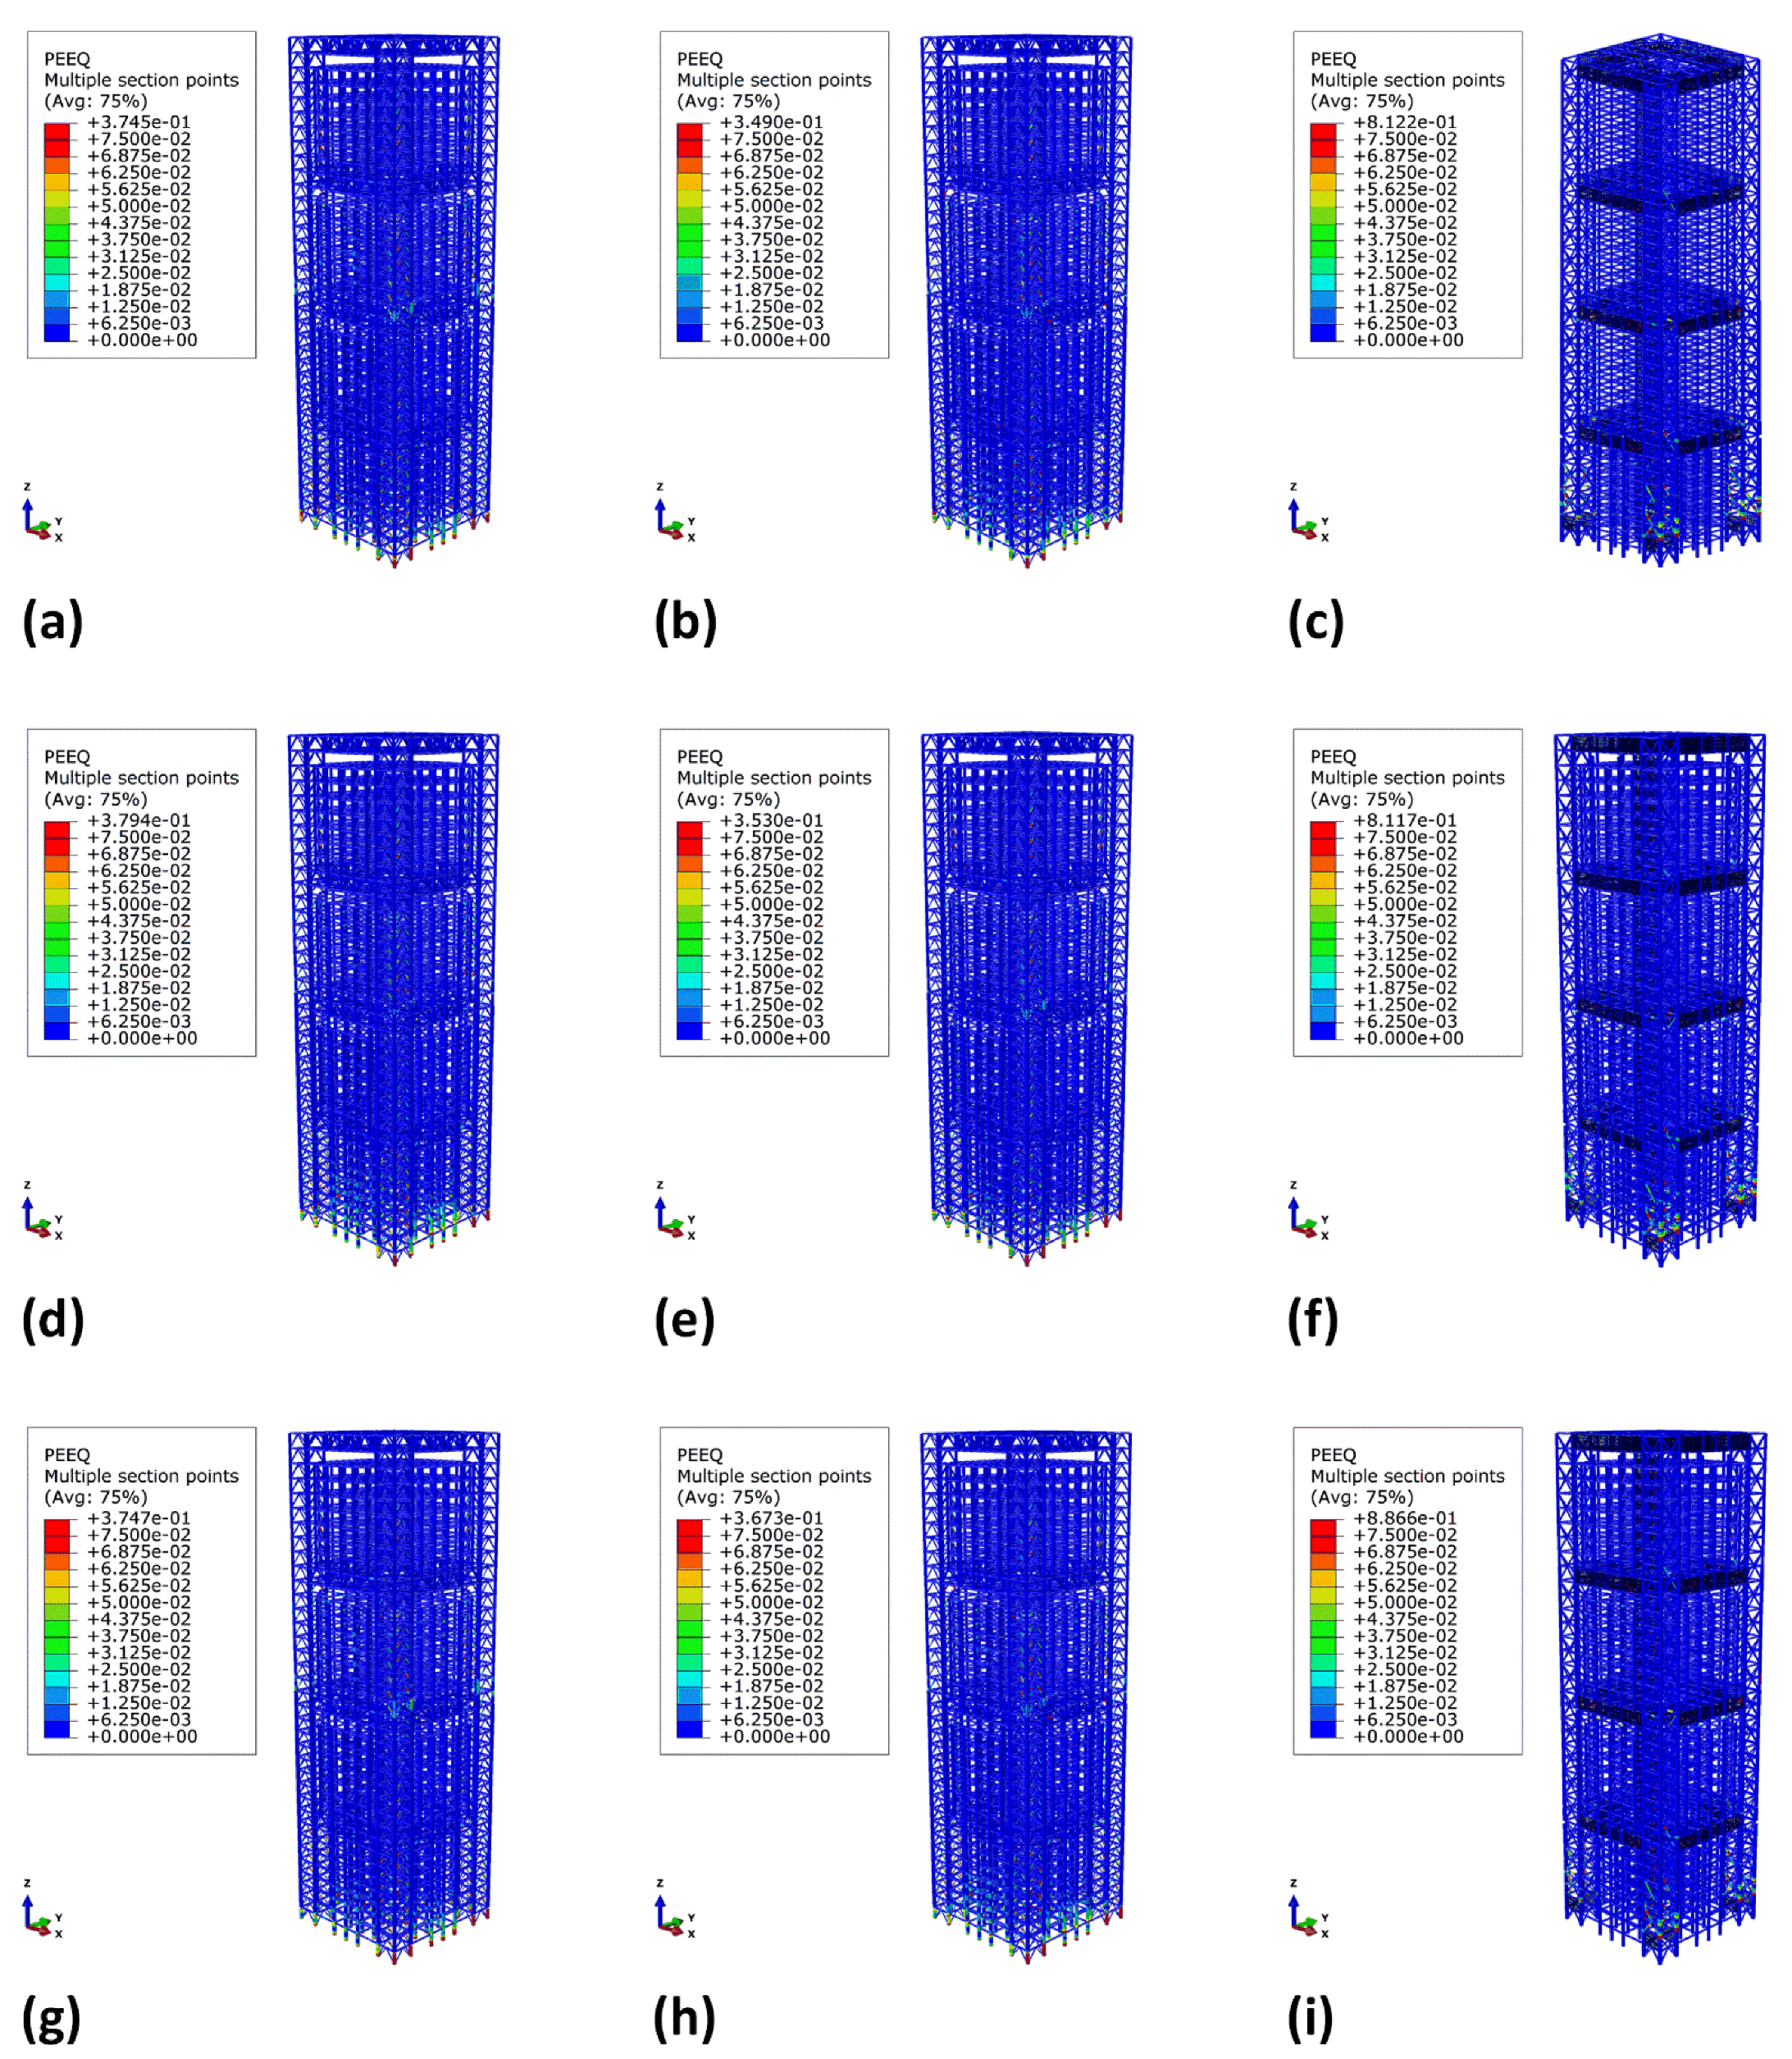
Figure 10 shows the overall trend of structural damage in MSCSS configurations. Figure 10a–c depict the structural response to conditions corresponding to the 1952 Taft earthquake, whose record sequence number (RSN) is 15, whereas Figure 10d–f depict the structural response to conditions corresponding to the 1999 RSN 1489 Chi-Chi earthquake, and Figure 10g–i depict the PEEQ nephogram of the 1999 RSN 2292 Chi-Chi earthquake. Both with and without dampers, the MSCSS first story columns, which directly resist the base shear, show evidence of structural damage. Megacolumn bracings located between the second and third megabeams exhibit plastic strain as a result of the swaying of the structure that occurs during seismic excitation. Figure 10 depicts this phenomenon. The substructures of the MSCSS with the SPSW do not exhibit any signs of structural damage when subjected to any of the three different types of ground motions. Under conditions of ground motions for locations relatively close to the fault, all of the configurations experience high plastic strains in the members of their integral structures, as shown in Figure 10d–f. Under the conditions of a far-field earthquake, the infill panels of the MSCSS with the SPSW show the highest PEEQ values. Figure A2 in Appendix A depicts a visual representation of the PEEQ nephogram for the entire structure.

6. Seismic Performance

An NDP is applied to the MSCSS configurations to analyze the structural seismic performance. This is performed as part of an ongoing investigation. The NDP, which is also known as nonlinear time-history analysis, offers the most accurate representation of the structural inelastic response because it takes into account the elastoplastic behavior of the system.

6.1. Acceleration Response

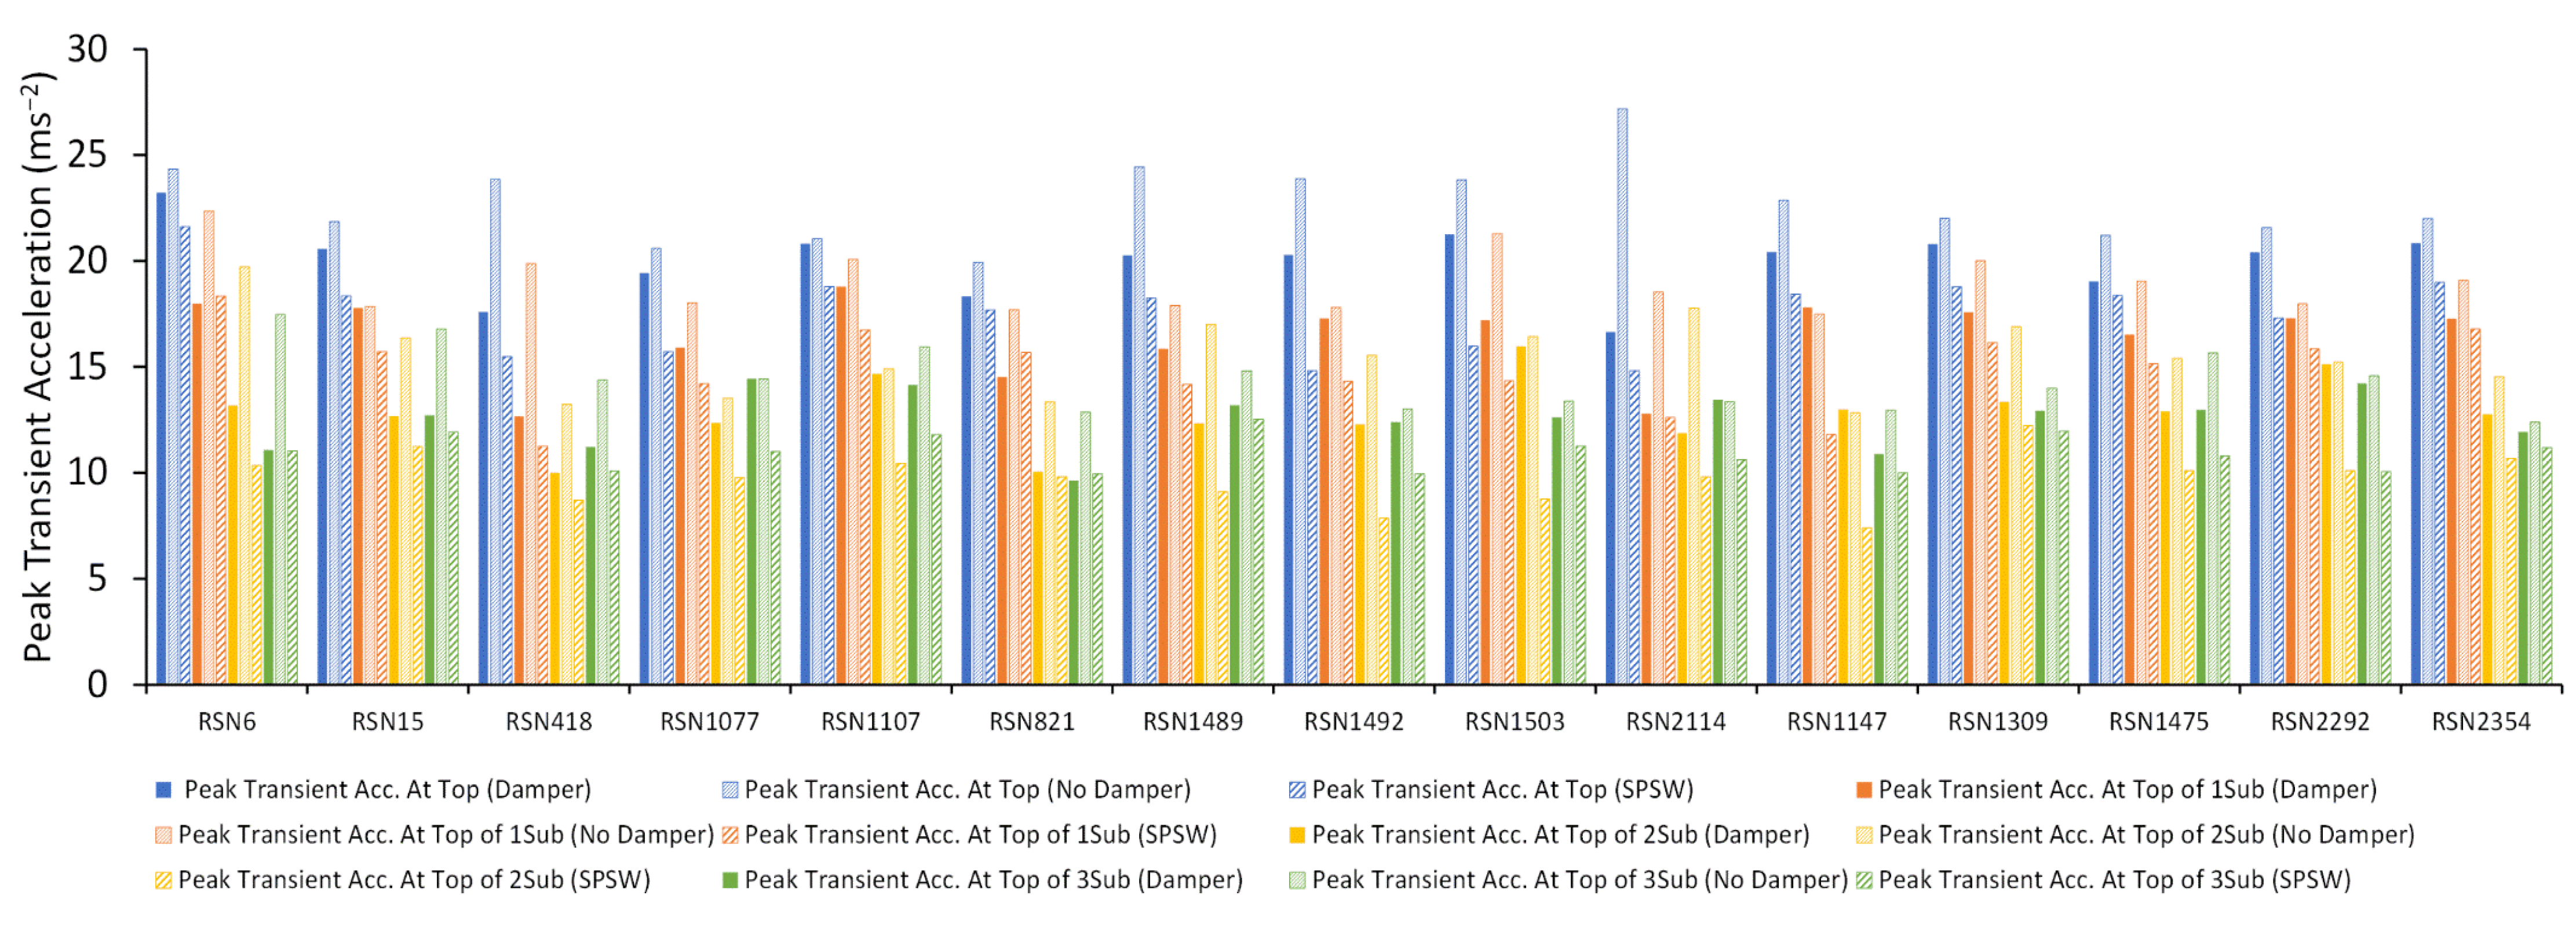
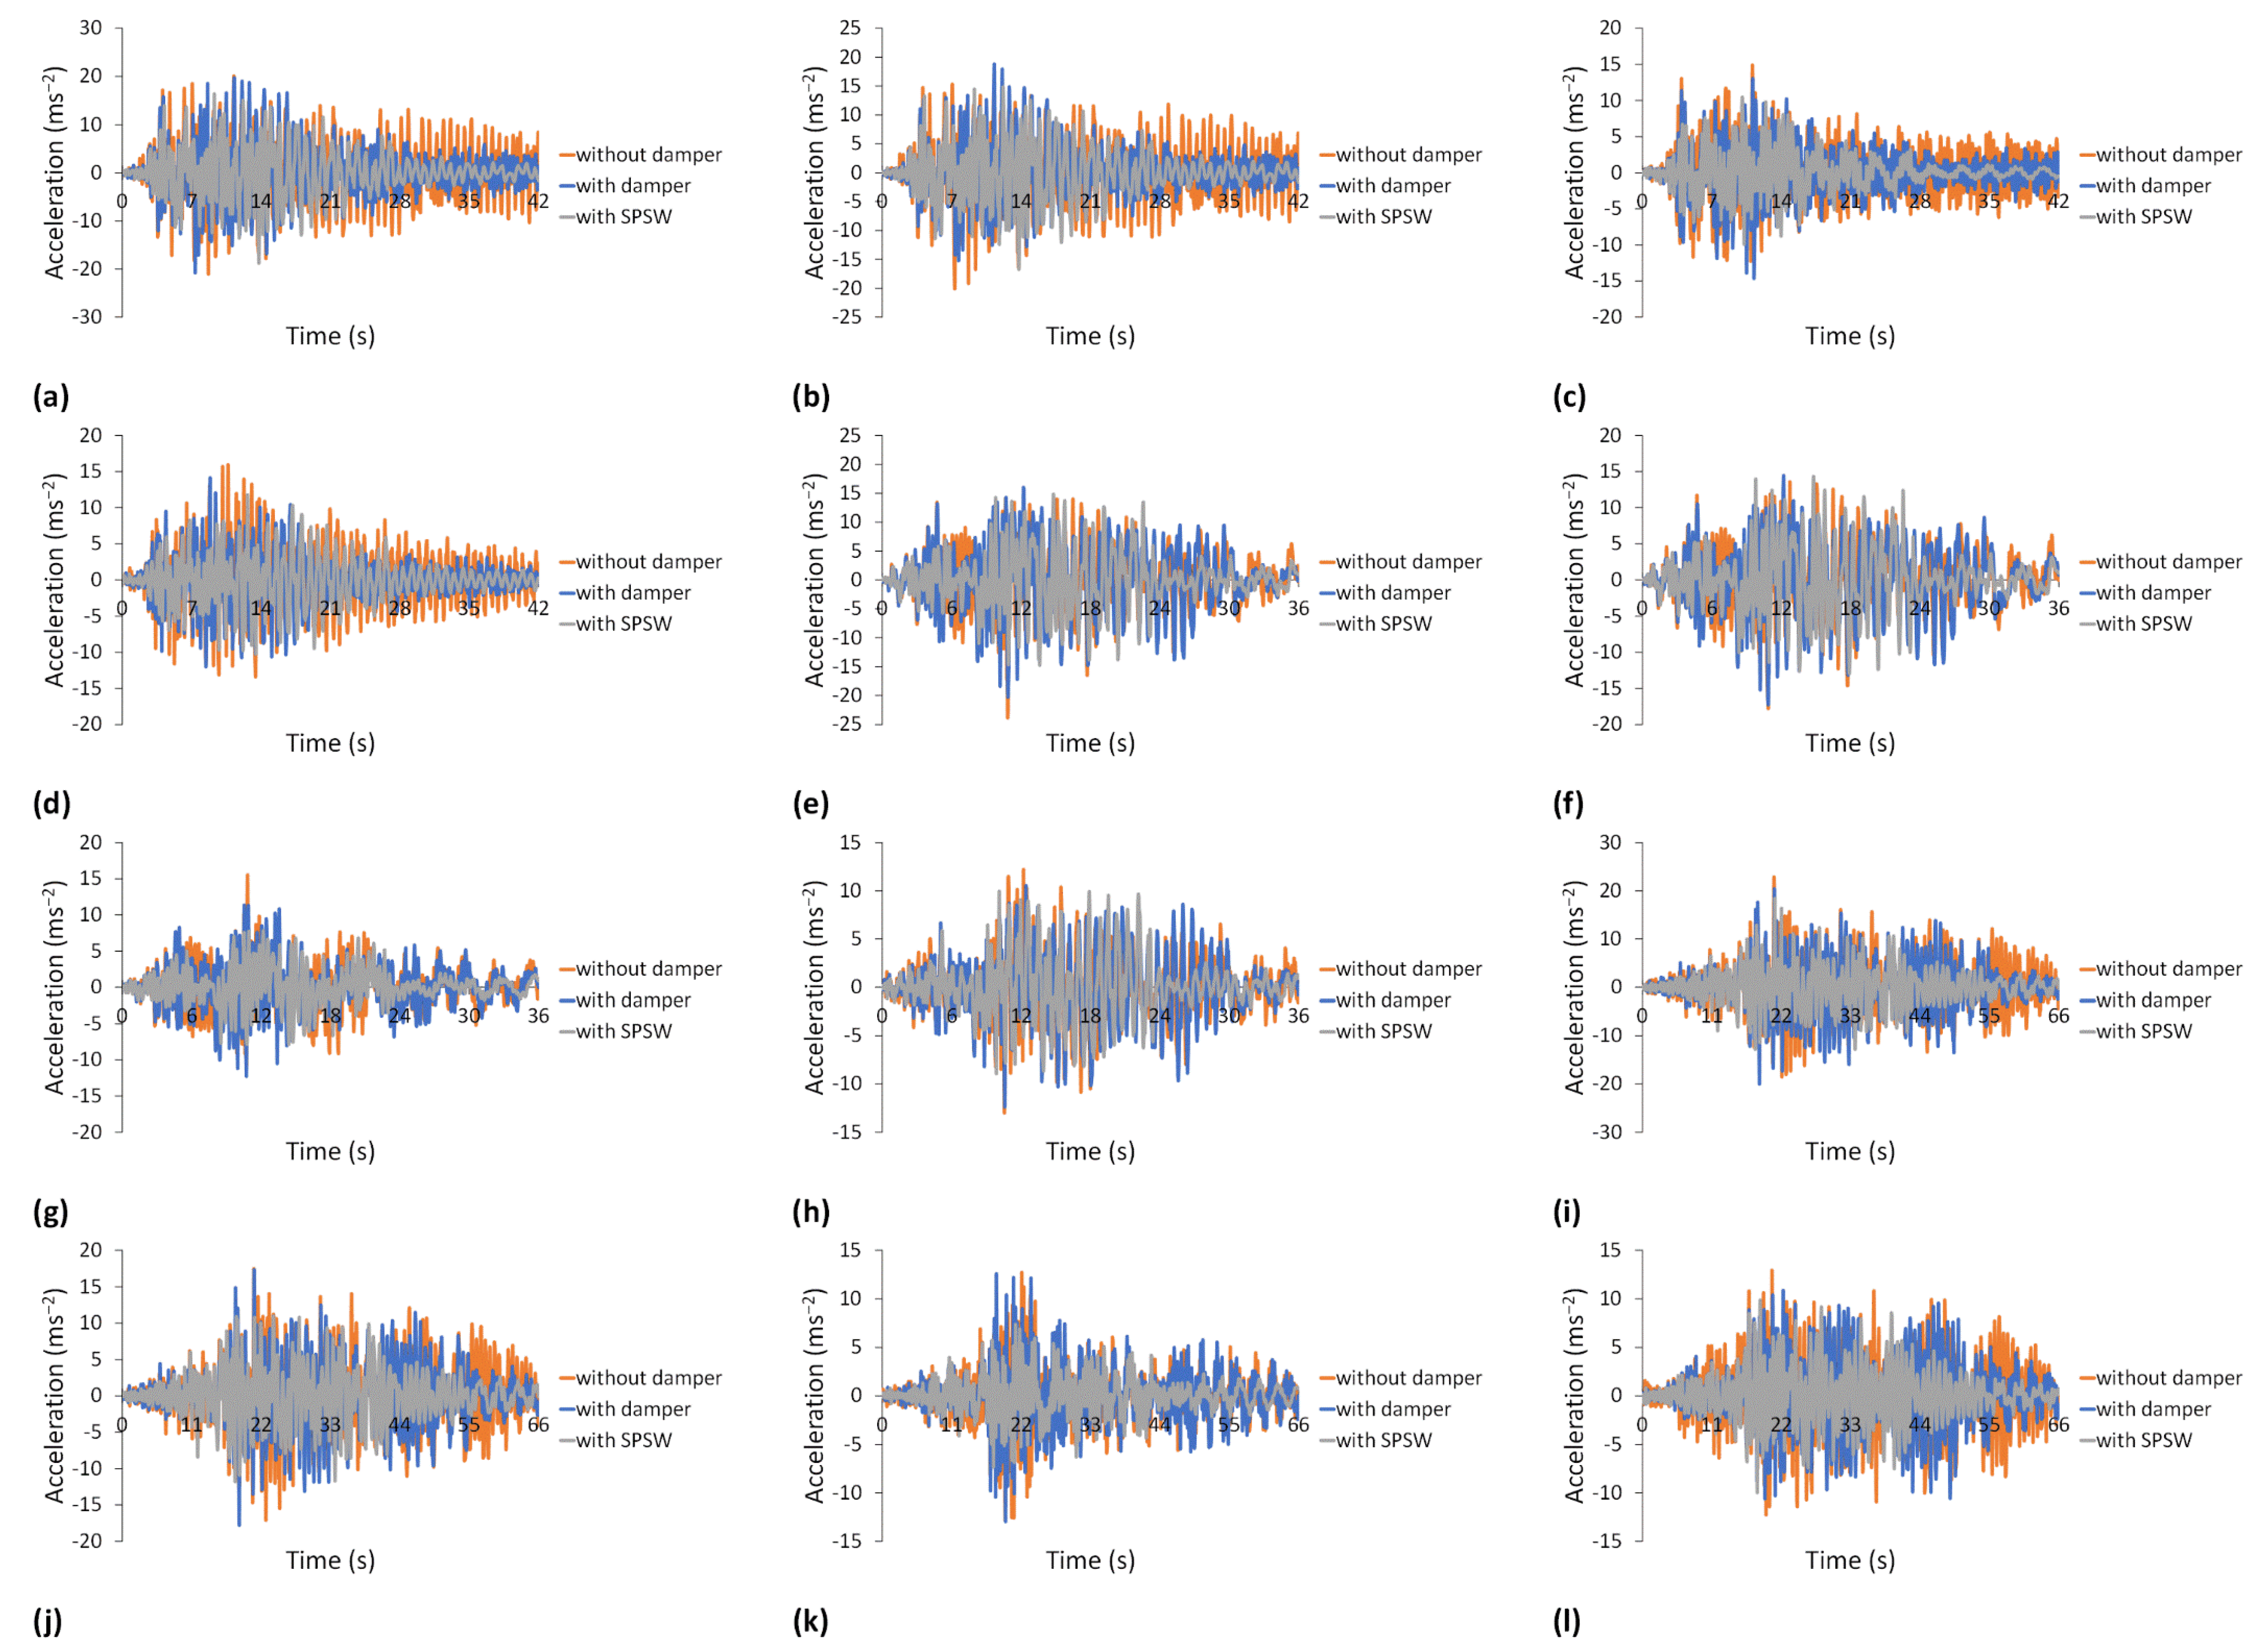
Across all of the configurations that were investigated, the MSCSS without dampers exhibits the highest seismic acceleration response. The top of the structure in the MSCSS configuration without dampers exhibits the highest floor transient acceleration, equal to 27.183 ms−2 under conditions occurring during the 2002 Denali earthquake. On the other hand, the MSCSS configurations with dampers and with an SPSW show floor transient accelerations of 23.217 ms−2 and 21.608 ms−2, respectively, during conditions corresponding to the 1940 El Centro earthquake, as shown in Figure 11. The MSCSS outfitted with the SPSW demonstrates an improved structural resistance against certain earthquakes. This is evidenced by the fact that it exhibits a 12.46% and 22.94% averaged improvement in the response calculated at the top of the structure, in comparison to the MSCSSs with and without dampers, respectively. The average peak transient floor acceleration at the top of the first substructure is 16.475 ms−2 in the MSCSS with dampers, and it is 18.998 ms−2 in the MSCSS without dampers. These values are approximately 7.47% and 27.92% more than those of the MSCSS equipped with the SPSW.
Figure 12 depicts the acceleration time history response of MSCSS configurations when subjected to conditions corresponding to the Kobe, Chi-Chi, and Kocaeli earthquakes. These three earthquakes are representative examples of the ground motions associated with their respective types. Under Kobe, after 28 s, the MSCSS with the SPSW shows damping in structural acceleration, whereas the MSCSS without dampers does not exhibit a significantly dampened acceleration response, as illustrated in Figure 12a–d. Figure 10e shows that the peak transient acceleration response in the MSCSSs with and without dampers occurs at 10.8 s when subjected to Chi-Chi ground motion. In contrast, this peak occurs at 14.8 s for the MSCSS with the SPSW, and the structure begins to damp its acceleration response after 24 s. During the Kocaeli excitation, the MSCSS equipped with the SPSW begins to attenuate its response after 44 s has passed, but prior to that, it reaches its maximum response, which is 18.43 ms−2, at 21 s, as shown in Figure 12i.

6.2. Peak Transient Story Drift

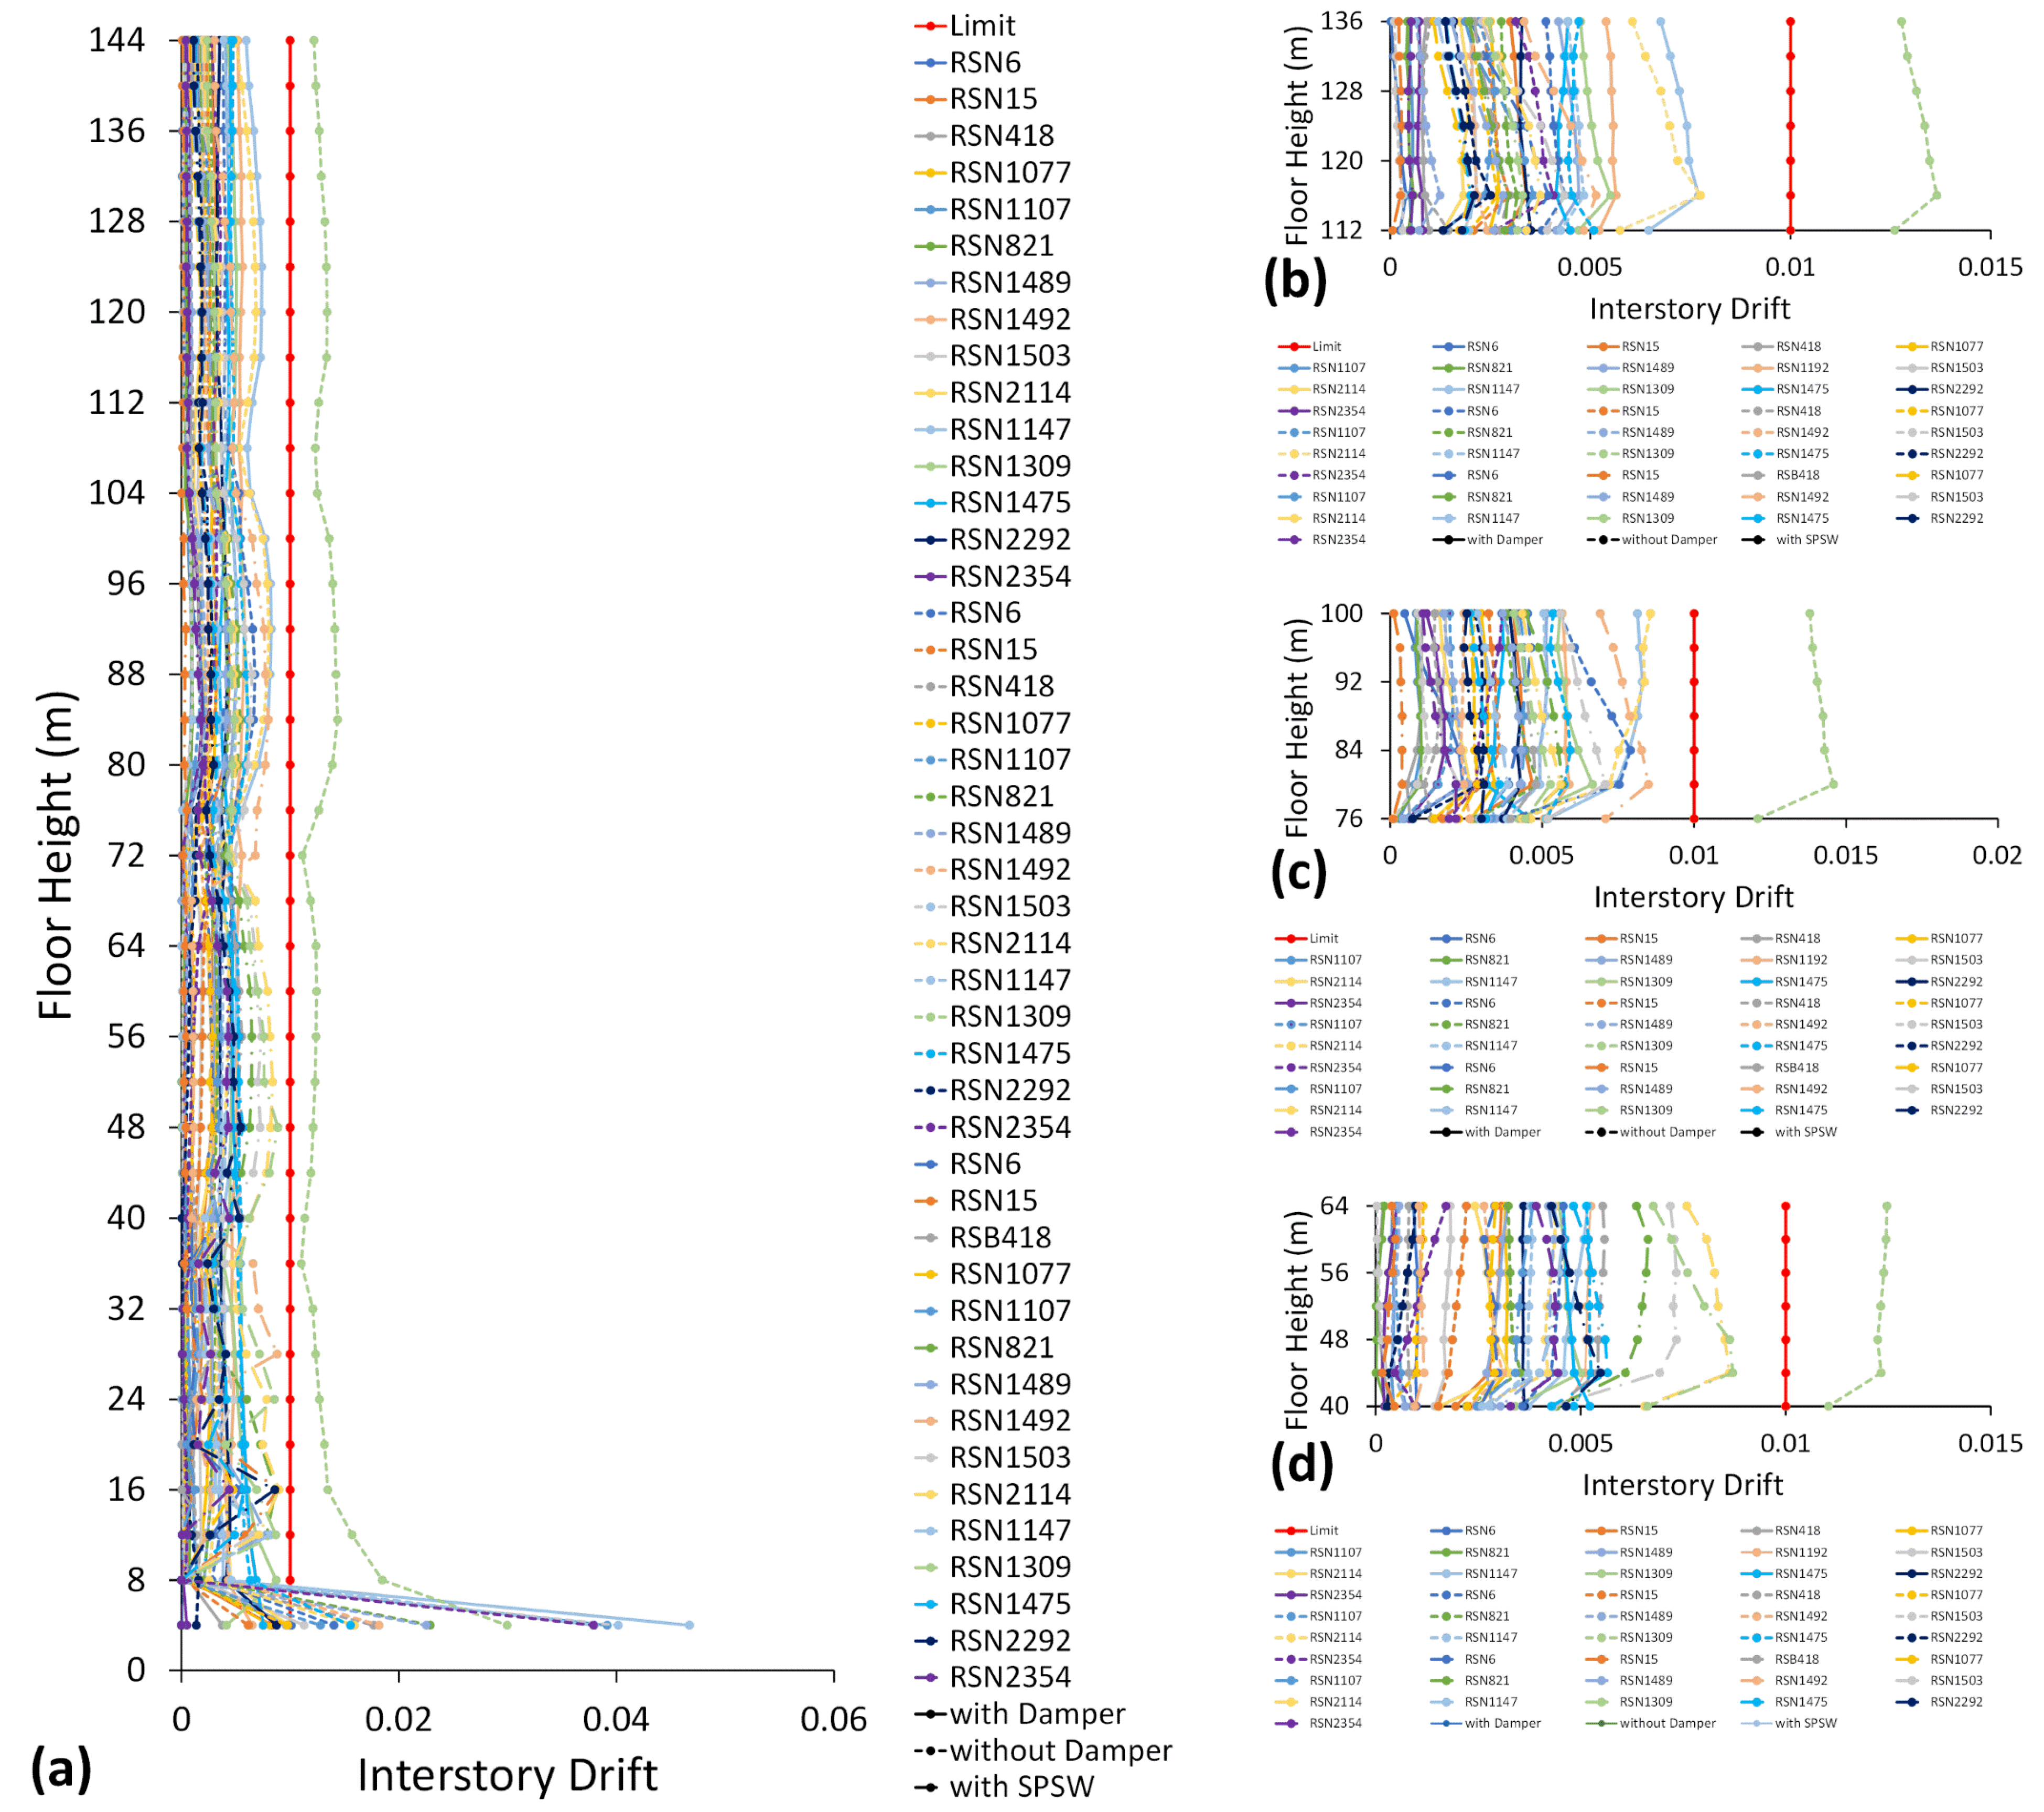
The peak transient story drift is one of the most important indicators of seismic structural response because it reveals when the structure has tilted to such an extreme degree that structural damage occurs. All of the MSCSS configurations are divided into four parts for the purpose of analyzing the peak transient story drift. These parts are the megaframe and the first three substructures in ascending order. In general, all of the configurations stay within the limits throughout the entirety of the height of the structure, with the exception of the MSCSSs with and without dampers at the first story under a couple of earthquakes due to structural damage, as shown in Figure 13a. There is no configuration in which the substructures exceed the limits shown in Figure 13b–d.
The megaframe of the MSCSS equipped with the SPSW remains consistently well within the safety limit under all different types of earthquakes, reaching a maximum of 0.29 at 12 m when subjected to the far-fault Chi-Chi ground motion. Figure 13a shows that the MSCSS with dampers exceeds the structural safety limits when it goes to 0.044 and 0.051 at a height of 4 m when subjected to conditions corresponding to the Kobe and Kocaeli earthquakes, respectively. The megaframe of the MSCSS without dampers exceeds the maximum time of diversion from the structural safety limits. This occurs four times out of five with far-fault earthquakes and three times out of five with near-fault ground motions. At a height of 4 m, the maximum drift recorded is 0.049 under the far-fault Chi-Chi earthquake.
In the first and second substructures, the maximum drift observed in the MSCSS with dampers is 0.0137 and 0.0146 at 116 m and 80 m, respectively, under the far-fault Chi-Chi earthquake with RSN 1309. These values are well within the safety limits. Under conditions of near-fault Chi-Chi ground motion with RSN 1492, the MSCSS equipped with the SPSW shows a maximum drift of 0.0137 at 44 m, as displayed in Figure 13d.

6.3. Residual Story Drift

The information that the residual story drift provides regarding the permanent structural damage that occurred as a result of the earthquake makes it an important parameter for the structural damage detection process. The MSCSS exhibits the worst seismic response in terms of residual story drift when it lacks dampers. This is because its megaframe exceeds the structural safety limits 10 out of 15 times, which indicates that the structure is unsafe for two of three seismic excitations (as shown in Figure 14a). All of the earthquakes near the fault cause the structure to collapse. Figure 14 shows that the entire structure collapses as a result of the far-fault Chi-Chi earthquake with RSN 1309 because it exceeds the structural safety limits. During the Chi-Chi near-fault seismic excitation with RSN 1503, the maximum residual story drift is recorded in the megaframe of the MSCSS without dampers, i.e., 0.0402 at 4 m. During the course of the investigation, a maximum drift of 0.0467 at 4 m is recorded in MSCSS with dampers when subjected to the Kocaeli earthquake, while MSCSS with the SPSW maintains compliance with the structural limits.
Except for the MSCSS without dampers, all substructures remain within structural limits during the far-fault Chi-Chi earthquake with RSN 1309. A general trend in all substructures is that drift increases at the second story of the substructure and then begins to decrease and approaches the drift of the first story of the substructure. Overall, the MSCSS with the SPSW demonstrates the best resistance against all different types of ground motions, particularly under the 1952 Taft earthquake, as the minimum drift in the entire structure is recorded under this earthquake.

6.4. Settlement at the Top of the Structure

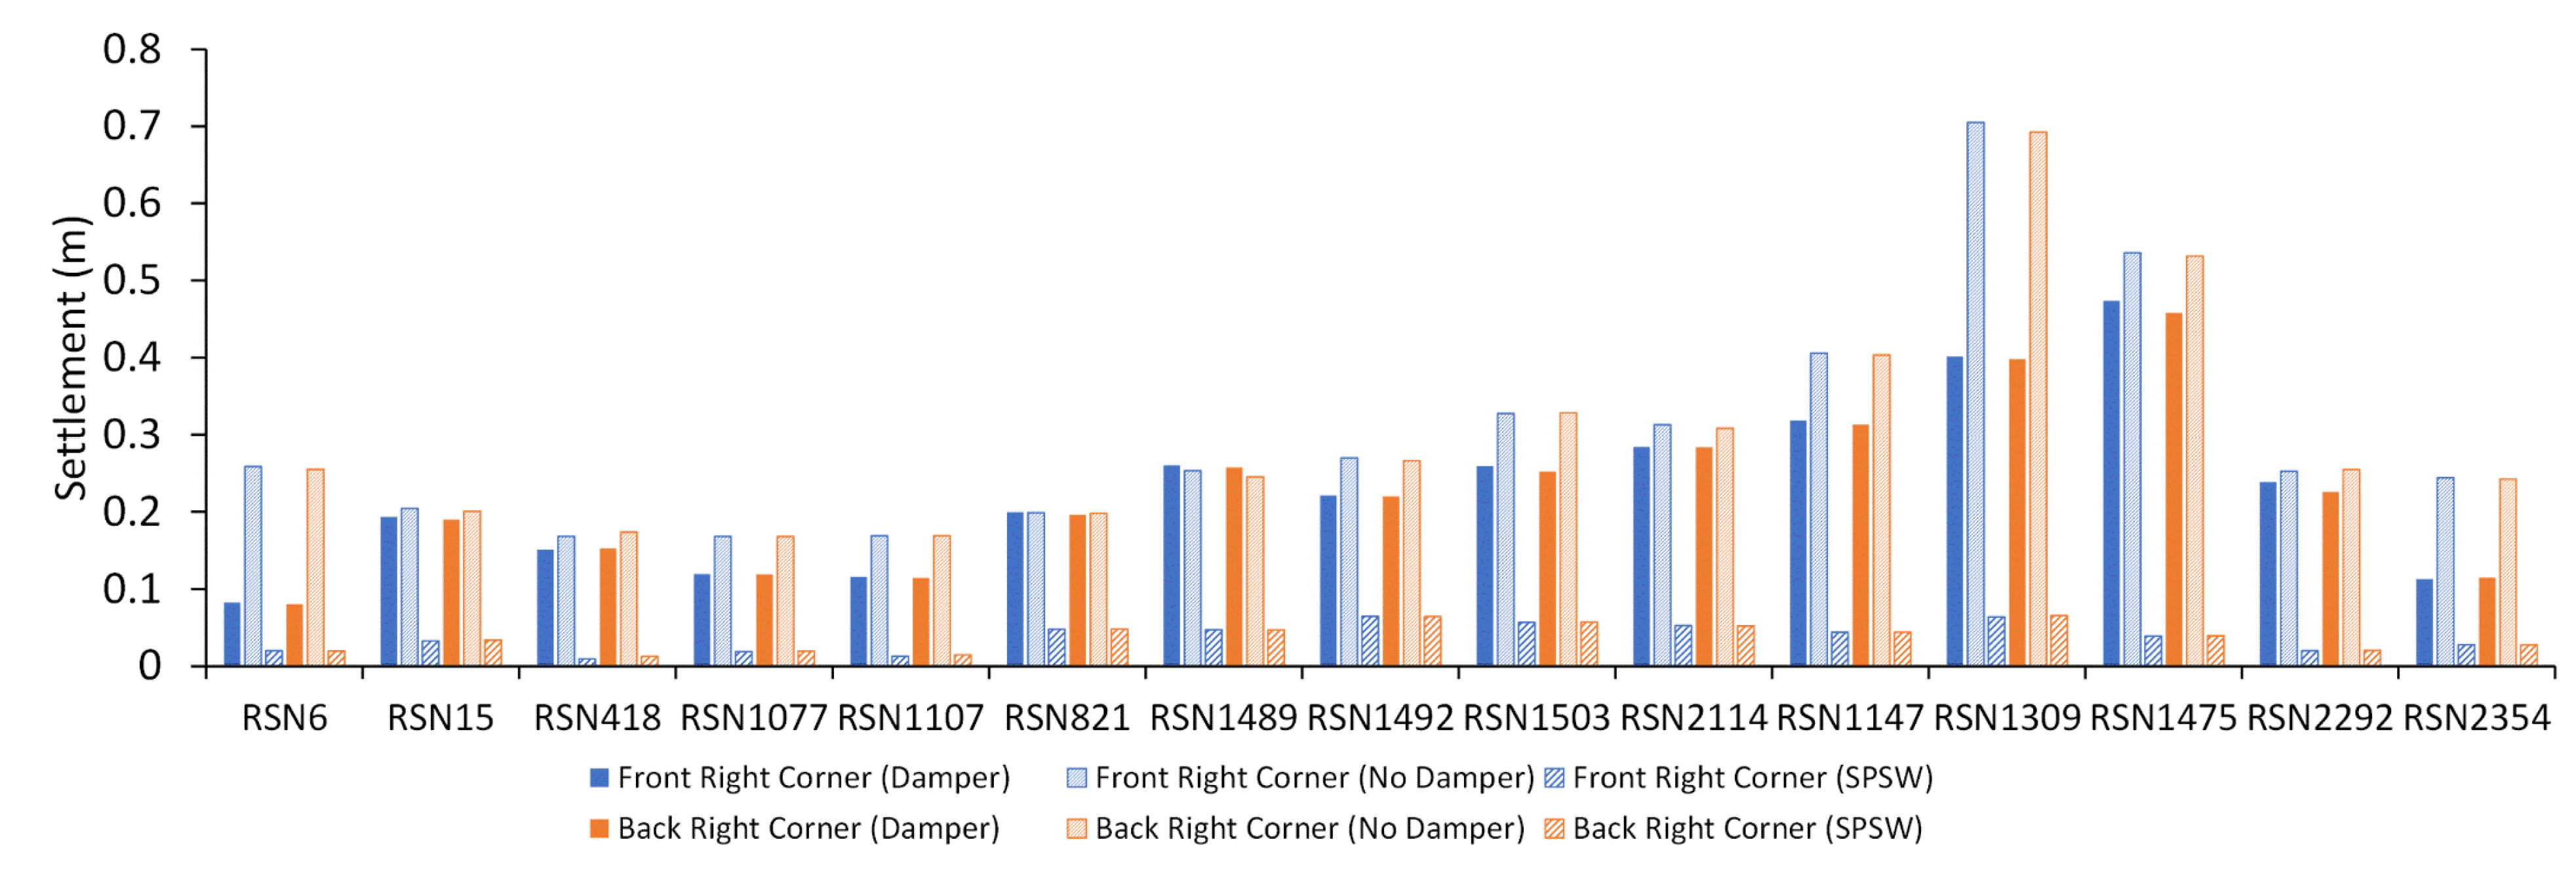
All MSCSS configurations exhibit structural settlement at the structure’s top. This settlement takes place during the structural response while nonlinear dynamic analyses are being performed, as depicted in Figure 15. The plastic deformation at the first story columns along with the structural damage into the megacolumn bracings is the primary cause of this settlement in the MSCSSs with and without dampers. The average amount of settlement that takes place in the MSCSS without dampers is 0.298 m, which is equivalent to approximately 7.45% of the story’s height. However, the average amount of settlement that occurred in the MSCSS with dampers is 0.229 m. When compared to the MSCSS with dampers, the MSCSS with the SPSW demonstrates a significant improvement in seismic response, showing results that are 83.79% improved.
The maximum settlement, which is approximately 17.63% of the height of the story, occurs in the front right corner of the MSCSS without dampers subjected to the far-fault Chi-Chi ground motion with RSN 1309, as shown in Figure 15. The MSCSS with the SPSW also demonstrates its maximum settlement in response to this ground motion in the back right corner. Under conditions of far-fault ground motion with RSN 1475, the MSCSS with dampers shows its maximum settlement, which is 0.474 m. The MSCSS with the SPSW demonstrates the highest settlement average during near-fault ground motions. On the other hand, the MSCSSs with and without dampers have the highest settlement average during far-fault ground motions.

6.5. Energy Dissipation

Dissipation of seismic energy occurs in a structure due to viscous effects as well as plastic effects and damage caused by the occurrence of cracks and plastic deformation in structural elements, with all of these factors working in conjunction. An analysis accounting for plastic and damage effects is performed to determine how much energy is dissipated in each MSCSS configuration during seismic loading of the structure. When compared to other configurations, the MSCSS with the SPSW has the highest damage dissipation average; however, the majority of this dissipation occurs due to the development of cracks in the infill panels of the shear wall. The dissipation has an average value of 304.722 kJ, which is approximately 51.88% more than the next lower value, corresponding to the MSCSS without dampers.
In the MSCSS with the SPSW, 628.56 kJ of energy dissipated due to structural damage occurs across the entire structure under conditions of far-fault ground motion with RSN 1309 with maximum damage dissipation under all ground motions, as shown in Figure 16a. Under seismic loading corresponding to the Coalinga, Northridge, and Erzican earthquakes, the MSCSSs with and without dampers show no structural damage because they dissipate zero energy, whereas under Kobe, the MSCSSs with and without dampers dissipate 8.9 kJ and 21.17 kJ, respectively. Under the conditions of the far-fault Chi-Chi earthquake, the MSCSS without dampers dissipates the maximum amount of energy caused by plastic deformations, which is 798.14 MJ. The MSCSS without dampers has an average plastic dissipation of 524.77 MJ, whereas the MSCSS with the SPSW has a dissipation of only 293.29 MJ, which is a difference of 44.11%. Due to plastic deformation of its integral structural members, the MSCSS with dampers has an average dissipation of 420.16 MJ. In general, the configuration that includes infill panels exhibits a better control response when subjected to seismic excitations.

7. Conclusions

In order to explore structural damage and seismic structural response, a nonlinear dynamic analysis is undertaken in this research on various configurations of MSCSS. The components of the MSCSS structure that are prone to failure are derived by studying the stress nephogram, acceleration response, interstory drift, and damping energy consumption of the MSCSS structure. Additionally, the damping performance of the MSCSS structure is discussed. The following conclusions are reached.
  • Under the effect of high seismic excitations, the stress nephograms of the MSCSSs with and without dampers, as well as the MSCSS fitted with the SPSW, are investigated. This is performed in comparison to the MSCSS without the SPSW. It has been discovered that all MSCSS configurations have a vulnerability in their second and fourth substructures, making them susceptible to failure. In addition, the fourth substructure experiences irreversible plastic strain when subjected to the force of a vibrant earthquake; hence, the MSCSS structure’s section design for the fourth substructure needs to be updated to enhance its seismic response.
  • All of the MSCSS configurations’ acceleration response time histories are examined, and comparisons are made between them. In particular, when the MSCSS is subjected to near-fault pulse ground motion, the SPSW-equipped version displays excellent damping performance.
  • Under a variety of seismic activities, the interstory drift, plasticity, and damage dissipation of the MSCSS structures are examined. When it comes to resisting the structural vibrations that can be caused by earthquakes, the MSCSS that has been equipped with the SPSW delivers exemplary results.
Nonlinear dynamic analysis reveals that the newly proposed and optimized MSCSS equipped with the SPSW improves the seismic performance overall by increasing the lateral stiffness and structural damping. This is a pilot study, and its results open the door to investigations into how MSCSSs fare during severe earthquakes triggered by different processes. In the future, we hope to use an artificial neural network (ANN) based on an algorithm to identify structural damage and conduct experiments, as well as stochastic optimal design control to examine the uncertainty associated with earthquakes and windstorms in order to increase the controllability index.

Author Contributions

M.M.S.: conceptualization (lead); methodology (lead); software (lead); writing—original draft (lead); formal analysis (lead); writing—review and editing (equal). X.Z.: funding; review and editing (equal); conceptualization (supporting); writing—original draft (supporting); writing—review and editing (equal). X.W.: writing—review and editing (supporting); methodology (supporting); software (supporting). All authors have read and agreed to the published version of the manuscript.

Funding

The National Natural Science Foundation of China funded this research under grant number 51878274.

Institutional Review Board Statement

Not applicable.

Informed Consent Statement

Not applicable.

Conflicts of Interest

The authors declare no conflict of interest.

Appendix A

The following is a list of the dimension details of the infill panels of the ring-shaped steel plate shear wall that are utilized in the MSCSS with the SPSW:
Table A1. Ring-Shaped Infill Panel Dimensions.
Parameters5 m × 4 m Infill Panel6.5 m × 4 m Infill Panel5 m × 4 m Infill Panel
Thickness8 mm8 mm8 mm
Ro0.42 m0.4 m0.42 m
Wc0.11 m0.1 m0.11 m
Wi0.15 m0.15 m0.15 m
Broader at the top and bottom0.12 m0.2 m0.2 m
Broader at the right and left sides0.15 m0.1 m0.2 m
Figure A1. Ring-shaped infill panel.
Sustainability 14 12390 g0a1
Figure A2. PEEQ nephograms: (a) the MSCSS without dampers under Taft, (b) the MSCSS with dampers under Taft, (c) the MSCSS with the SPSW under Taft, (d) the MSCSS without dampers under Chi-Chi, (e) the MSCSS with dampers under Chi-Chi, (f) the MSCSS with the SPSW under Chi-Chi, (g) the MSCSS without dampers under Chi-Chi, (h) the MSCSS with dampers under Chi-Chi, and (i) the MSCSS with the SPSW under Chi-Chi.
Sustainability 14 12390 g0a2

References

  1. Ali, M.M.; Moon, K.S. Structural Developments in Tall Buildings: Current Trends and Future Prospects. Arch. Sci. Rev. 2007, 50, 205–223. [Google Scholar] [CrossRef]
  2. CTBUH. The Global Tall Buildings Database of the CTBUH. Available online: http://www.skyscrapercenter.com/ (accessed on 23 March 2020).
  3. Bhattacharya, S.; Adhikari, S. Experimental validation of soil–structure interaction of offshore wind turbines. Soil Dyn. Earthq. Eng. 2011, 31, 805–816. [Google Scholar] [CrossRef]
  4. Zhang, Z.; Nielsen, S.R.K.; Blaabjerg, F.; Zhou, D. Dynamics and Control of Lateral Tower Vibrations in Offshore Wind Turbines by Means of Active Generator Torque. Energies 2014, 7, 7746–7772. [Google Scholar] [CrossRef]
  5. Feng, M.Q.; Mita, A. Vibration Control of Tall Buildings Using Mega SubConfiguration. J. Eng. Mech. 1995, 121, 1082–1088. [Google Scholar] [CrossRef]
  6. Chai, W.; Feng, M.Q. Vibration control of super tall buildings subjected to wind loads. Int. J. Non-linear Mech. 1997, 32, 657–668. [Google Scholar] [CrossRef]
  7. Lan, Z.; Fang, L.; Wang, X. Multifunctional shock-absorption system of RC megaframe structures. Ind. Constr. 2002, 32, 1–4. [Google Scholar]
  8. Xun’An, Z.; Dong, W.; Jiesheng, J. The controlling mechanism and the controlling effectiveness of passive mega-sub-controlled frame subjected to random wind loads. J. Sound Vib. 2005, 283, 543–560. [Google Scholar] [CrossRef]
  9. Zhang, X.; Zhang, J.; Wang, D.; Jiang, J. Controlling Characteristics of Passive Mega-Subcontrolled Frame Subjected to Random Wind Loads. J. Eng. Mech. 2005, 131, 1046–1055. [Google Scholar] [CrossRef]
  10. Lian, Y.; Zhang, X.; Sheldon, C. Damping characteristics of friction damped braced frame and its effectiveness in the mega-sub controlled structure system. Earthq. Eng. Eng. Vib. 2007, 6, 171–181. [Google Scholar] [CrossRef]
  11. Qin, X.; Zhang, X.; Sheldon, C. Study on semi-active control of mega-sub controlled structure by MR damper subject to random wind loads. Earthq. Eng. Eng. Vib. 2008, 7, 285–294. [Google Scholar] [CrossRef]
  12. Zhang, X.; Qin, X.; Cherry, S.; Lian, Y.; Zhang, J.; Jiang, J. A New Proposed Passive Mega-Sub Controlled Structure and Response Control. J. Earthq. Eng. 2009, 13, 252–274. [Google Scholar] [CrossRef]
  13. Abdulhadi, M.; Xun’an, Z.; Fan, B.; Moman, M. Design, Optimization and Nonlinear Response Control Analysis of the Mega Sub-Controlled Structural System (MSCSS) Under Earthquake Action. J. Earthq. Tsunami 2020, 14, 2050013. [Google Scholar] [CrossRef]
  14. Abdulhadi, M.; Xun’An, Z.; Fan, B.; Moman, M. Evaluation of Seismic Fragility Analysis of the Mega Sub-Controlled Structural System (MSCSS). J. Earthq. Tsunami 2020, 14, 2050025. [Google Scholar] [CrossRef]
  15. Wang, X.; Zhang, X.; Shahzad, M.M.; Wang, T. Research on dynamic response characteristics and control effect of mega-sub controlled structural system under long-period ground motions. Structures 2021, 29, 225–234. [Google Scholar] [CrossRef]
  16. Wang, X.; Zhang, X.; Shahzad, M.M.; Shi, X. Research on the disaster prevention mechanism of mega-sub controlled structural system by vulnerability analysis. Structures 2021, 33, 4481–4491. [Google Scholar] [CrossRef]
  17. Abdulhadi, M.; Xun’an, Z.; Fan, B.; Moman, M. Substructure design optimization and nonlinear responses control analysis of the mega-sub controlled structural system (MSCSS) under earthquake action. Earthq. Eng. Eng.Vib. 2021, 20, 687–704. [Google Scholar] [CrossRef]
  18. Shahzad, M.M.; Zhang, X.; Wang, X.; Abdulhadi, M.; Wang, T.; Xiao, Y. Response control analysis of a new mega-subcontrolled structural system (MSCSS) under seismic excitation. Struct. Des. Tall Spec. Build. 2022, 31, e1935. [Google Scholar] [CrossRef]
  19. Shahzad, M.M.; Zhang, X.; Wang, X.; Abdulhadi, M.; Xiao, Y.; Fan, B. Plastic Deformation Analysis of a New Mega-Subcontrolled Structural System (MSCSS) Subjected to Seismic Excitation. Buildings 2022, 12, 987. [Google Scholar] [CrossRef]
  20. Shahzad, M.M.; Zhang, X.; Wang, X.; Abdulhadi, M. Comparative response assessment of different steel plate shear walls (SPSWs) under near-field ground motion. J. Constr. Steel Res. 2022, 190, 107147. [Google Scholar] [CrossRef]
  21. Kim, M.; Song, J. Near-Real-Time Identification of Seismic Damage Using Unsupervised Deep Neural Network. J. Eng. Mech. 2022, 148, 04022006. [Google Scholar] [CrossRef]
  22. Krishnan, S.; Muto, M. Mechanism of Collapse of Tall Steel Moment-Frame Buildings under Earthquake Excitation. J. Struct. Eng. 2012, 138, 1361–1387. [Google Scholar] [CrossRef] [Green Version]
  23. Xu, Y.; Wei, S.; Bao, Y.; Li, H. Automatic seismic damage identification of reinforced concrete columns from images by a region-based deep convolutional neural network. Struct. Control Health Monit. 2019, 26, e2313. [Google Scholar] [CrossRef]
  24. Wu, J.; Qi, C.; Zhang, F.; Lei, Y.; Zheng, Z. State-Input System Identification of Tall Buildings under Unknown Seismic Excitations Based on Modal Kalman Filter with Unknown Input. J. Aerosp. Eng. 2021, 34, 04021040. [Google Scholar] [CrossRef]
  25. Fan, B.; Zhang, X.; Xiao, Y.; Abdulhadi, M.; Wang, X.; Shahzad, M.M. Failure Mode and Optimization for MSCSS with LRBs Based on IDA Method. Buildings 2022, 12, 998. [Google Scholar] [CrossRef]
  26. Biondini, F.; Frangopol, D.M. Life-Cycle Performance of Structural Systems under Uncertainty. In Proceedings of the Structures Congress 2014, Boston, MA, USA, 3–5 April 2014. [Google Scholar] [CrossRef]
  27. Bai, Y.; Ma, Y.; Yang, Q.; Florez-Lopez, J.; Li, X.; Biondini, F. Earthquake-induced damage updating for remaining-life assessment of steel frame substructure systems. Mech. Syst. Signal Process. 2021, 159, 107782. [Google Scholar] [CrossRef]
  28. Lignos, D.G.; Krawinkler, H. Deterioration Modeling of Steel Components in Support of Collapse Prediction of Steel Moment Frames under Earthquake Loading. J. Struct. Eng. 2011, 137, 1291–1302. [Google Scholar] [CrossRef]
  29. Saiprasertkit, K.; Hanji, T.; Miki, C. Fatigue strength assessment of load-carrying cruciform joints with material mismatching in low- and high-cycle fatigue regions based on the effective notch concept. Int. J. Fatigue 2012, 40, 120–128. [Google Scholar] [CrossRef]
  30. Bai, Y.; Shi, Y.; Deng, K. Collapse analysis of high-rise steel moment frames incorporating deterioration effects of column axial force–bending moment interaction. Eng. Struct. 2016, 127, 402–415. [Google Scholar] [CrossRef]
  31. Zhang, Z.; Feng, R.; Chen, Y. Theoretical analysis of the mechanical behavior of double-ring joints under pure bending, bending-shear and eccentric loading conditions. Eng. Struct. 2021, 232, 111854. [Google Scholar] [CrossRef]
  32. Ma, H.; Ma, Y.; Fan, F.; Zhang, Y. Failure mechanism and design method of reticulated shells considering joint damage accumulation effect under earthquake load. Structures 2022, 39, 667–678. [Google Scholar] [CrossRef]
  33. Loh, C.-H.; Mao, C.-H.; Huang, J.-R.; Pan, T.-C. System identification and damage evaluation of degrading hysteresis of reinforced concrete frames. Earthq. Eng. Struct. Dyn. 2011, 40, 623–640. [Google Scholar] [CrossRef]
  34. Avci, O.; Abdeljaber, O.; Kiranyaz, S.; Hussein, M.; Gabbouj, M.; Inman, D.J. A review of vibration-based damage detection in civil structures: From traditional methods to Machine Learning and Deep Learning applications. Mech. Syst. Signal Process. 2021, 147, 107077. [Google Scholar] [CrossRef]
  35. ASCE/SEI 7–16; Minimum Design—Loads and Associated Criteria for Buildings and Other Structures. American Society of Civil Engineers: Reston, VA, USA, 2016.
  36. Kawashima, K.; Aizawa, K. Bracketed and normalized durations of earthquake ground acceleration. Earthq. Eng. Struct. Dyn. 1989, 18, 1041–1051. [Google Scholar] [CrossRef]
  37. ASCE/SEI 41-17; Seismic Evaluation and Retrofit of Existing Buildings. American Society of Civil Engineers: Reston, VA, USA, 2017.
  38. Lilhanand, K.; Tseng, W. Generation of synthetic time histories compatible with multiple-damping design response spectra. In Proceedings of the Transactions of the 9th International Conference on Structural Mechanics in Reactor Technology, Lausanne, Switzerland, 17–21 August 1987; Volume K1. [Google Scholar]
  39. Lilhanand, K.; Tseng, W.S. Development and application of realistic earthquake time histories compatible with multiple-damping design spectra. In Proceedings of the 9th World Conference on Earthquake Engineering, Tokyo, Japan, 2–9 August 1988; Volume 2, pp. 819–824. [Google Scholar]
  40. Abrahamson, N. Non-stationary spectral matching. Seismol. Res. Lett. 1992, 63, 30. [Google Scholar]
  41. Hancock, J.; Watson-Lamprey, J.; Abrahamson, N.A.; Bommer, J.J.; Markatis, A.; McCOYH, E.; Mendis, R. An improved method of matching response spectra of recorded earthquake ground motion using wavelets. J. Earthq. Eng. 2006, 10, 67–89. [Google Scholar] [CrossRef]
  42. Driver, R.G. Seismic Behaviour of Steel Plate Shear Walls. Doctoral Thesis, Departement of Civil and Environmental Engineering, University of Alberta, Edmonton, AB, Canada, 1997. [Google Scholar]
  43. Li, X.; Summers, D.; Rupert, G.; Santi, P. Experimental investigation on the breakage of hard rock by the PDC cutters with combined action modes. Tunn. Undergr. Space Technol. 2001, 16, 107–114. [Google Scholar] [CrossRef]
  44. Schwer, L. Optional Strain-Rate Forms for the Johnson Cook Constitutive Model and the Role of the parameter Epsilon_0. In Proceedings of the 6th European LS-DYNA Users’ Conference, Gothenburg, Sweden, 28–30 May 2007; pp. 1–17. [Google Scholar]
  45. Buchely, M.F.; Ganguly, S.; Van Aken, D.C.; Omalley, R.; Lekakh, S.; Chandrashekhara, K. Experimental Development of Johnson–Cook Strength Model for Different Carbon Steel Grades and Application for Single-Pass Hot Rolling. Steel Res. Int. 2020, 91, 1900670. [Google Scholar] [CrossRef]
  46. Wei, Z.; Zhang, X.-A.; Sun, F.; Wang, W.Y. Digital Twin Assistant Active Design and Optimization of Steel Mega-Sub Controlled Structural System under Severe Earthquake Waves. Materials 2022, 15, 6382. [Google Scholar] [CrossRef]
  47. Villarreal, K.; Wilson, C.; Abdullah, M. Effects of MR Damper Placement on Structure Vibration Parameters. 2004. Available online: https://citeseerx.ist.psu.edu/viewdoc/download?doi=10.1.1.507.2724&rep=rep1&type=pdf (accessed on 24 February 2022).
  48. Wilson, C.M.D. Fuzzy Control of Magnetorheological Dampers for Vibration Reduction Of Seismically Excited Structures. Ph.D. Thesis, Department of Civil and Environmental Engineering, The Florida State University, Tallahassee, FL, USA, 2005. [Google Scholar]
Figure 1. PSD: (a) ordinary ground motions, (b) near-fault ground motions, and (c) far-fault ground motions.
Sustainability 14 12390 g001
Figure 2. Spectral acceleration: (a) ordinary ground motion spectra, (b) near-fault ground motion spectra, (c) far-fault ground motion spectra, and (d) ground motion spectra after matching.
Sustainability 14 12390 g002
Figure 3. Configurations: (a) MSCSS without dampers, (b) MSCSS with dampers, and (c) MSCSS with the SPSW.
Sustainability 14 12390 g003
Figure 4. Experimental Setup: (a) experimental model, (b) X-axis sensor placement, and (c) Y-axis sensor placement.
Sustainability 14 12390 g004
Figure 5. Structural acceleration response under El Centro: (a) at the top of the structure, (b) at the top of the 1st substructure, (c) at the top of the 2nd substructure, and (d) at the top of the 3rd substructure.
Sustainability 14 12390 g005
Figure 6. Modal shapes for the MSCSS with the SPSW: (a) mode 1, (b) mode 2, and (c) mode 3.
Sustainability 14 12390 g006
Figure 7. Stress nephogram under El Centro, 1940: (a) the MSCSS without dampers at the end of the earthquake, (b) the MSCSS with dampers at the end of the earthquake, (c) the MSCSS with the SPSW at the end of the earthquake, (d) the MSCSS without dampers at the peak of the earthquake, (e) the MSCSS with dampers at the peak of the earthquake, and (f) the MSCSS with the SPSW at the peak of the earthquake.
Sustainability 14 12390 g007
Figure 8. Stress nephograms corresponding to the 2002 Denali earthquake: (a) the MSCSS without dampers at the end of the earthquake, (b) the MSCSS with dampers at the end of the earthquake, (c) the MSCSS with the SPSW at the end of the earthquake, (d) the MSCSS without damper at the peak of the earthquake, (e) the MSCSS with dampers at the peak of the earthquake, and (f) the MSCSS with the SPSW at the peak of the earthquake.
Sustainability 14 12390 g008
Figure 9. Stress nephogram corresponding to the 1999 Chi-Chi earthquake: (a) the MSCSS without dampers at the end of the earthquake, (b) the MSCSS with dampers at the end of the earthquake, (c) the MSCSS with the SPSW at the end of the earthquake, (d) the MSCSS without dampers at the peak of the earthquake, (e) the MSCSS with dampers at the peak of the earthquake, and (f) the MSCSS with the SPSW at the peak of the earthquake.
Sustainability 14 12390 g009
Figure 10. PEEQ nephograms: (a) the MSCSS without dampers under Taft, (b) the MSCSS with dampers under Taft, (c) the MSCSS with the SPSW under Taft, (d) the MSCSS without dampers under Chi-Chi, (e) the MSCSS with dampers under Chi-Chi, (f) the MSCSS with the SPSW under Chi-Chi, (g) the MSCSS without dampers under Chi-Chi, (h) the MSCSS with dampers under Chi-Chi, and (i) the MSCSS with the SPSW under Chi-Chi.
Sustainability 14 12390 g010
Figure 11. Peak transient acceleration.
Sustainability 14 12390 g011
Figure 12. Acceleration time history: (a) at the top of the structure under Kobe, (b) at the top of the 1st substructure under Kobe, (c) at the top of the 2nd substructure under Kobe, (d) at the top of the 3rd substructure under Kobe, (e) at the top of the structure under Chi-Chi, (f) at the top of the 1st substructure under Chi-Chi, (g) at the top of the 2nd substructure under Chi-Chi, (h) at the top of the 3rd substructure under Chi-Chi, (i) at the top of the structure under Kocaeli, (j) at the top of the 1st substructure under Kocaeli, (k) at the top of the 2nd substructure under Kocaeli, and (l) at the top of the 3rd substructure under Kocaeli. Note: The substructure count starts from the top.
Sustainability 14 12390 g012
Figure 13. Peak transient story drift: (a) megaframe, (b) 1st substructure, (c) 2nd substructure, and (d) 3rd substructure.
Sustainability 14 12390 g013
Figure 14. Residual story drift: (a) megaframe, (b) 1st substructure (c) 2nd substructure, and (d) 3rd substructure.
Sustainability 14 12390 g014
Figure 15. Settlement at the top of the structure.
Sustainability 14 12390 g015
Figure 16. Energy dissipation in the whole structure: (a) damage dissipation and (b) plastic dissipation.
Sustainability 14 12390 g016
Table 1. Selected ground motions.
ClassificationEventYearStationRSNMwMechanismRjb (km)Rrup (km)Arias Intensity (ms−1)Tp (s)
OrdinaryImperial Valley-021940El Centro Array #966.95Strike slip6.096.091.6-
Kern County1952Taft Lincoln School157.36Reverse38.4238.890.6-
Coalinga-071983Coalinga-14th and Elm (Old CHP)4185.21Reverse7.3110.891.4-
Northridge-011994Santa Monica City Hall10776.69Reverse17.2826.452.8-
Kobe1995Kakogawa11076.9Strike slip22.522.51.7-
Near-faultErzican1992Erzincan8216.69Strike slip0.04.381.8-
Chi-Chi1999TCU04914897.62Reverse Oblique3.763.761.410.22
Chi-Chi1999TCU05214927.62Reverse Oblique0.00.662.911.956
Chi-Chi1999TCU06515037.62Reverse Oblique0.570.577.75.74
Denali2002TAPS Pump Station #1021147.9Strike slip0.182.741.93.157
Far-faultKocaeli1999Ambarli11477.51Strike slip68.0969.621.2-
Chi-Chi1999ILA00313097.62Reverse Oblique90.6292.810.2-
Chi-Chi1999TCU02614757.62Reverse Oblique56.0356.120.28.372
Chi-Chi1999ILA05622925.9Reverse110.62111.510.0-
Chi-Chi1999TCU01023545.9Reverse108.63108.820.0-
RSN stands for record sequence number, Mw stands for magnitude, and Tp stands for predominant period.
Table 2. Material properties.
SteelX
(MPa)
Y
(MPa)
Zsrnd1d2d3d4d5Tmelt (℃)Ttrans (℃) ε ¯ ˙ 0 ( s 1 )
A 362865000.0170.9170.2280.4031.1070.10.0096101430251
A 99214.426107.4910.24940.68570.38960.3521.8920.003990.14101504.4410000.0399
Table 3. Section member properties.
MemberSection ShapeSection Size (mm)Area (m2)Moment of InertiaSection ModulusRadius of Gyration
Ix (m4)Iy (m4)Wx (m3)Wy (m3)Rgx (m)Rgy (m)
Megacolumns up to the first megabeamSustainability 14 12390 i001900 × 900 × 34 × 340.11780.01470.01470.03280.03280.35380.3538
Megacolumns between the first and second megabeamsSustainability 14 12390 i002800 × 800 × 34 × 340.10420.01020.01020.02550.02550.3130.313
Megacolumns between the second and third megabeamsSustainability 14 12390 i003700 × 700 × 34 × 340.09066.713 × 10−36.713 × 10−30.01920.01920.27220.2722
Megacolumns between the third and fourth megabeamsSustainability 14 12390 i004600 × 600 × 34 × 340.0776.165 × 10−36.165 × 10−30.01370.01370.23150.2315
Substructural columns up to the first megabeamSustainability 14 12390 i005700 × 700 × 34 × 340.09066.713 × 10−36.713 × 10−30.01920.01920.27220.2722
Substructural columns between the first and fourth megabeamsSustainability 14 12390 i006600 × 600 × 34 × 340.0776.165 × 10−36.165 × 10−30.01370.01370.23150.2315
Additional columnsSustainability 14 12390 i007600 × 600 × 34 × 340.0776.165 × 10−36.165 × 10−30.01370.01370.23150.2315
Megabeams 1, 2, and 3H650 × 550 × 30 × 300.05073.687 × 10−38.332 × 10−40.01133.030 × 10−30.26970.1282
Megabeam 4H600 × 300 × 18 × 180.02191.426 × 10−38.13 × 10−54.388 × 10−35.42 × 10−40.25550.061
Beams between the megacolumns up to the second megabeamH582 × 350 × 20 × 200.02481.371 × 10−31.433 × 10−44.712 × 10−38.187 × 10−40.2350.0759
Beams between the megacolumns from the second to 4th megabeamH500 × 300 × 18 × 180.01927.774 × 10−48.123 × 10−53.11 × 10−35.415 × 10−40.20150.0651
Bracing in the megacolumns up to megabeam 1H450 × 350 × 30 × 300.03271.076 × 10−32.153 × 10−44.782 × 10−31.23 × 10−30.18140.0811
Bracing in the megacolumns above megabeam 1H350 × 350 × 25 × 250.0255.193 × 10−41.79 × 10−42.967 × 10−31.023 × 10−30.14410.0846
Substructural beamsH500 × 350 × 25 × 250.02881.178 × 10−31.792 × 10−44.711 × 10−31.024 × 10−30.20240.079
Table 4. Comparisons between the experimental and simulated frequencies of MSCSS.
ModelModal Frequency (Hz)Deviation (%)
ExperimentalSimulated from ABAQUS
15.1305.0571.423
25.3135.2411.355
39.5878.37512.642
413.71613.0484.87
514.16613.8272.393
621.81120.9134.117
Table 5. Fundamental natural period.
Configuration NameModal Time Period (s)Modal Frequency (Hz)
Mode 1Mode 2Mode 3Mode 1Mode 2Mode 3
MSCSS without dampers4.5554.5092.8170.2200.2220.355
MSCSS with dampers4.5534.5082.8140.2200.2220.355
MSCSS with an SPSW3.3163.1291.9380.3020.3200.516
Publisher’s Note: MDPI stays neutral with regard to jurisdictional claims in published maps and institutional affiliations.