Article

Spatio-Temporal Evolution and Influencing Factors of Green Development in the Yellow River Basin of China

1
Research Institute of Regional Economy, Shandong University of Finance and Economics, Jinan 250014, China
2
College of Geography and Environment, Shandong Normal University, Jinan 250014, China
*
Author to whom correspondence should be addressed.
Sustainability 2022, 14(19), 12407; https://doi.org/10.3390/su141912407
Submission received: 14 July 2022 / Revised: 1 September 2022 / Accepted: 26 September 2022 / Published: 29 September 2022

Abstract

:
Globally, nations and regions have pushed for “green development (GD)”, a sustainable development strategy that considers the integrated growth of “economy–environment–society”. As it is an area of China that provides an ecological function and is an important energy base, it is necessary to explore the current situation and factors influencing GD in the Yellow River Basin (YRB). Therefore, first, this paper constructs a GD indicator system from a multi-dimensional perspective, measures the GD of 79 prefecture-level cities in the YRB from 2006 to 2019 by using the entropy method, and analyzes the evolution of time series according to the results. We found that the YRB’s GD showed an overall increase during the study period, rising from 0.1261 to 0.2195, but the level was low. Second, we analyzed the spatial characteristics of the YRB’s GD using a spatial analysis method and concluded that GD varied significantly across cities in the YRB. The YRB presented spatial distribution characteristics with obvious “quad-core pieces”, and there was a high intensity of spatial correlation and agglomeration. The spatial center of gravity of GD moved toward the southeast year by year. Third, we examined the influencing factors of the GD of the YRB through the spatial Durbin model. The study found that the spatial spillover effect on GD in the YRB was obvious, and the reasons affecting the GD of the YRB were heterogeneous. Finally, according to the conclusions of this research, we propose differentiated policies that are suitable for GD in the YRB.

1. Introduction

Since the Industrial Revolution, human production has grown at a rapid pace and material life has been greatly improved. Along with this, the accelerated depletion of natural resources and the great destruction of the ecological environment have put human beings in the dilemma of a double oppression in terms of resources and the environment. Energy security, environmental issues, global climate change, and other green development (GD) issues have also had a profound impact on the shaping of the global order and the direction of the world’s political economy. GD, as a new way of economic growth and social development that is aimed at efficiency, harmony, and sustainability, has become the focal point for countries striving for space for development and the transformation of the international order. The United States is shaping its global leadership in environmental, energy, and climate governance through the implementation of the Green New Deal [1]. The European Union is promoting a comprehensive GD transition led by carbon neutrality through the implementation of the European Green Deal [2]. As the world’s major producer of greenhouse gases and consumer of energy [3,4], the new situation and challenges are forcing China to change its economic development from a “black model” with a high input and low efficiency to a “green model” with low emissions and high efficiency in order to promote the coordinated and sustainable improvement of the economy, resources, environment, and society [5,6,7,8]. China has been dedicated to reaching the “peak carbon” level by 2030 and becoming “carbon neutral” by 2060 in order to overcome the serious challenges posed by global climate change. At the same time, “The 14th Five-Year Plan for National Economic and Social Development of the People’s Republic of China and Outline of the Vision for 2035” clearly emphasizes the strategic position of GD in the overall situation of China’s modernization [9]. As China’s crucial ecological corridor and economic zone, the levels of GD of most provinces in the YRB are generally lower than the national level, and the ecological environment is fragile [10]. Therefore, exploring the path of GD and properly handling the contradictions among regional development, resources, and the environment have become important paths for the YRB in order to realize high-quality development.
British economist David Pierce originally put forth the idea of the green economy with environmental conservation at its center in 1989 in “Blueprint for a Green Economy”, emphasizing the interdependence between the environment and the economy [11]. The concept of GD was first proposed by the United Nations Development Program in 2002 when analyzing the environmental challenges faced by China [12]. Guided by the theory of sustainable development, the concept of GD is driven by innovation, changing the traditional method of resource utilization, and realizing a benign interaction between the economy and ecology. Scholars have generally explored the sustainable development level of each region by quantifying the GD performance [13]. Additionally, in general, the evaluation methods are divided into evaluations of GD efficiency and evaluations with a comprehensive index system. The former type incorporates factors such as resources and environmental pollution sources into the analytical framework of GD [14]; for example, Halkos et al. constructed a comprehensive sustainable efficiency index and used a data envelopment analysis (DEA) model with a two-stage window to assess the comprehensive developmental efficiency of 20 economically developed countries [15]. In addition, the slack-based measure (SBM) model has been widely used because it fully considers the undesired output and the limitations of input factors in the process of economic development [16,17,18]. Compared with the former, the latter type uses a multi-dimensional composite evaluation system based on the “economy–environment–society”, which can better interpret the connotations of GD. For example, Wang et al. constructed a GD index system from five dimensions—the human living environment, pollutant management, ecological efficiency, economic growth, and development and innovation—and measured the GD level of the Pearl River Delta in China by using the entropy method [6]. Huang emphasized the significance of implementing China’s concept of GD in countries participating in the Belt and Road Initiative [19].
Meanwhile, the spatial and temporal characteristics and driving factors of GD have been widely discussed by scholars. Previous scholars mainly analyzed the spatial differences and spatial correlations of GD in different research regions, and the spatial evolution trends were not sufficiently portrayed [20]. Zhang analyzed the spatial and temporal evolutionary trends of GD in the Yunnan–Guizhou plateau, but only data from four periods were considered, and a continuous analysis was lacking [21]. In terms of driver studies, previous scholars mostly used models such as geographically weighted regression (regression methods that can be used to explore spatial heterogeneity among variables), the difference-in-differences model (a policy evaluation method), the partial linear-functional-coefficient model (a method for assessing the nonlinear impact of influencing factors of GD), and the panel Tobit model (a panel regression model) to explore the influences of government regulation, environmental regulation, cross-regional environmental protection mechanisms, and financial development on GD [22,23,24,25]. For example, Zhou used the panel Tobit measurement model to analyze the influencing factors of economic strength and industrial structure on the efficiency of GD in China [17]. However, the spillover effects of GD need to be further considered due to the optimal allocation of resources within the region and the development of linkages between cities [26,27].
A series of constructive results have been achieved in terms of GD connotation, measurement, spatial characteristics, and influencing factors, but there is also room for further expansion and extension. (1) Most of the previous GD evaluations focused on GD efficiency and composite “economy–environment–society”-based evaluation systems, but there was a lack of discussion on GD that included a composite “economy–environment–society–government” system. (2) Previous studies did not go deep enough into the spatial evolution of GD, but the YRB has a complex and diversified geographical and ecological environment, so it is necessary to analyze the spatial and temporal characteristics of GD in the YRB. (3) The empirical analysis of GD is mostly based on traditional econometric analysis, which lacks a geographic spatial perspective and ignores the spatial dependence of GD among regions based on traditional econometric methods, which may lead to erroneous analysis results. Based on this, this paper constructed a composite “economic–environment–society–government” evaluation system for GD and analyzed the spatial and temporal evolution and influencing factors of GD in the YRB based on spatial analysis tools and spatial measurements in order to provide some meaningful insights into the GD of the YRB and provide a reference for similar regions of the world. We have mapped out a flowchart of this article for the reader’s convenience (Figure 1).

2. Study Areas and Data Methods

2.1. Overview of the Study Area

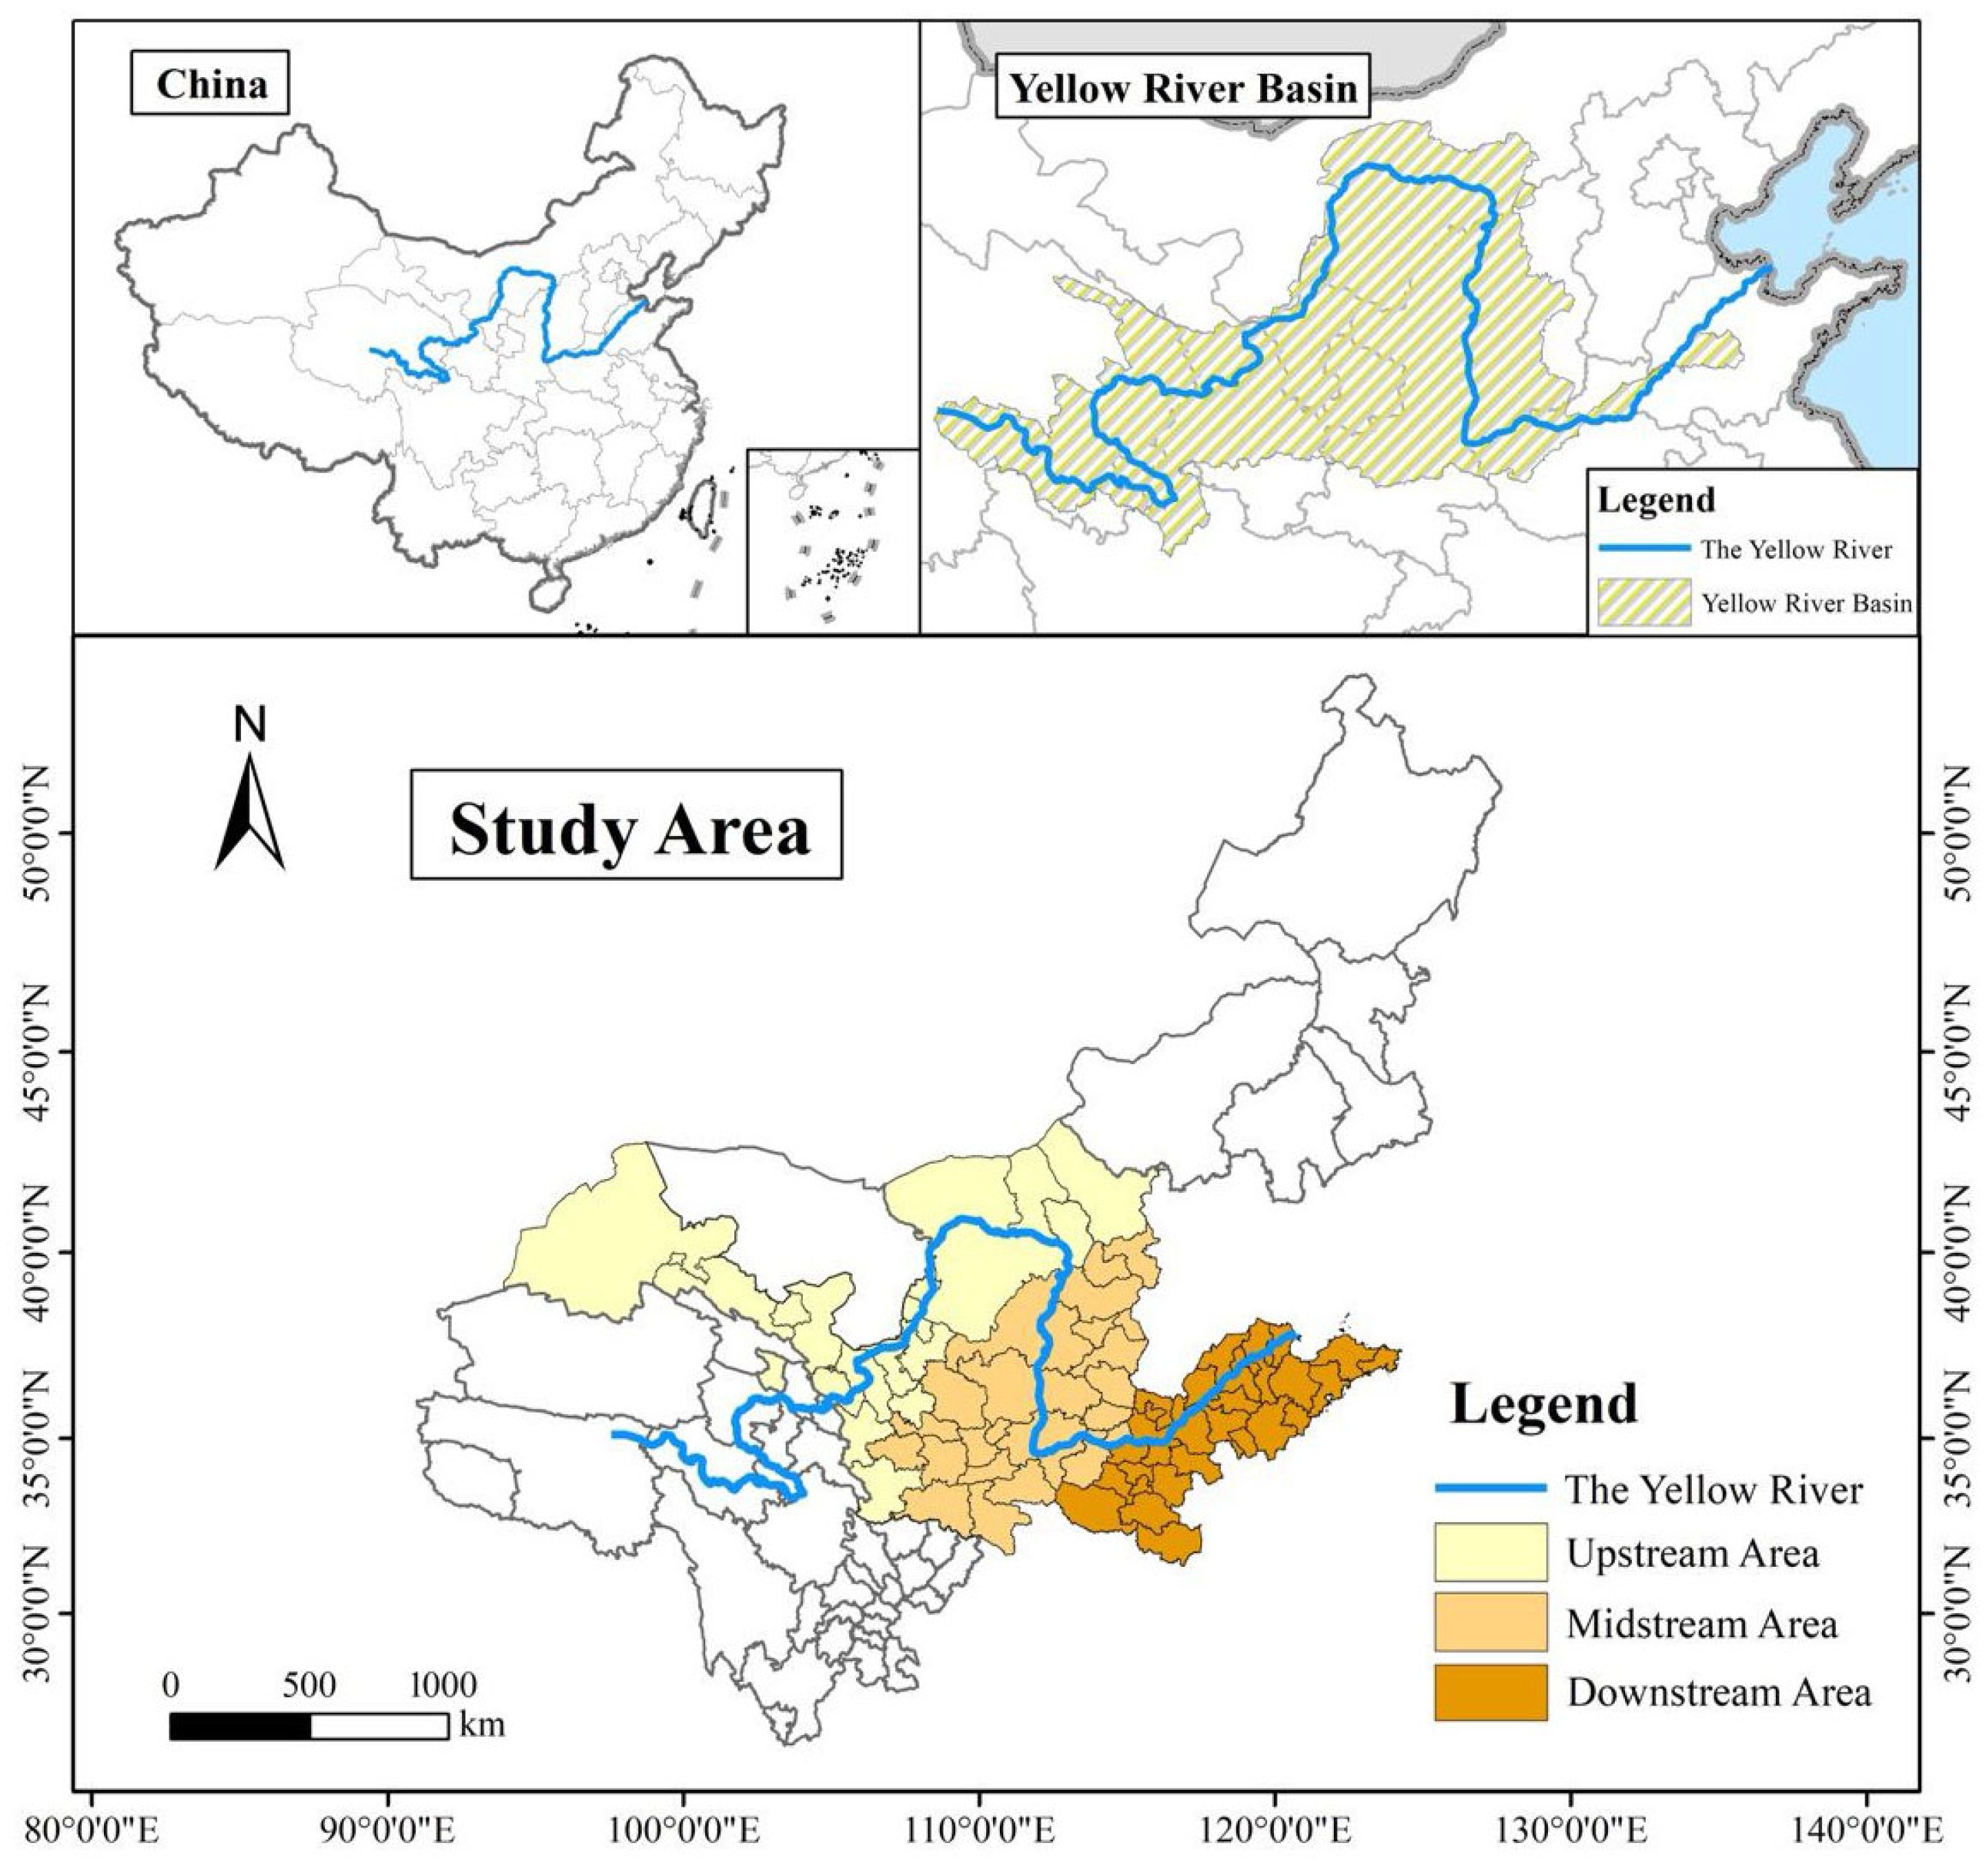
The YRB covers the geographical and ecological areas affected by the Yellow River system from its source to the sea. The Yellow River flows from the west to the east of China; the differences in elevation, landform types, and development levels between the east and west are huge. The YRB’s environmentally sensitive and vulnerable areas are vast in size, type, and depth. The substantial ecological issues in the YRB include salinization of land in some areas in the higher reaches, serious soil erosion in the middle reaches, and an imbalance of water and sand in the lower reaches. In 2019, in order to realize the long-cherished wish of the people along the Yellow River to pursue a better life, the ecological conservation and high-quality development of the YRB (YB Conservation and Development) became a national strategy. The YRB includes nine provinces. In 2021, the gross domestic product (GDP) of the nine provinces under the jurisdiction of the basin reached approximately CNY 28,685.17 billion, accounting for approximately 24.21% of China’s total GDP. Considering the integrity of the administrative divisions and the connection between economic development and ecology in various regions of the basin, this paper took the natural flow of the Yellow River as the main body, excluding Sichuan Province due to its close relationship with the Yangtze River Basin, Chifeng and Tongliao due to their location in the far northeast, and Haidong and Jiyuan due to their poor data. Finally, we selected 79 prefecture-level cities in the YRB as research samples; the numbers of cities in the upstream, middle-stream, and downstream areas were 21, 28, and 30, respectively (Figure 2).

2.2. Construction of the Evaluation Index System

GD covers the three major systems of the economy, ecology, and society. It relies on government and administrative means to promote ecological and environmental protection in order to achieve sustainable development. Not only does it carry the expectation of a better life, but it also considers environmental protection and economic development and meets the current requirements for high-quality development. The feasibility, objectivity, and rationality of the construction of an index system directly affect the measurement results and subsequent research. Therefore, based on studies and the connotations of GD, to highlight the characteristics of the development of the YRB, this paper constructed a GD indicator system from a multi-dimensional perspective. (1) The green economy is the core starting point of GD. We mainly considered the economic benefit brought about by economic activities and the pressure caused by externalities on the ecological environment, which is reflected in the degree of economic development and green output. (2) The green environment is the premise and provides crucial support for GD. Natural resources are, on the one hand, essential to human survival and progress. On the other hand, human activities directly or indirectly affect the ecological environment from various perspectives. Therefore, we comprehensively evaluated the green environment level from the perspectives of resource abundance, environmental pressure, and ecological construction level. (3) Green life is the principal purpose of GD. Green life is reflected in people’s behavior of saving resources and protecting the ecology in their daily lifestyles [28], aiming to achieve green living and travel and to improve the level of GD. (4) Green policy is the institutional guarantee of GD. The government has promulgated various policies to increase scientific and technological innovation, improve environmental governance, and promote industrial optimization in order to promote GD. Based on the above description and the related literature, this paper selected a total of 20 indicators to construct an evaluation index system for GD in the YRB (Table 1).

2.3. Assessment of GD

2.3.1. Entropy Method (EM)

Entropy is a measure of uncertainty that is rooted in physics and was later used in information theory. The entropy value depicts how dispersed an index is. The larger the dispersion of the indicator and the better it reflects the information represented by the data, the lower the entropy value. The EM can be used to solve the homogenization problem of each heterogeneous index, and at the same time, it can avoid the subjective arbitrariness of determining the index weight. Therefore, we applied the EM in order to determine the weight of each index of GD in the YRB to ensure that the evaluation results were more credible and accurate. The specific calculation steps are as follows:
(1)
Construction of the global evaluation matrix: The evaluation object involves m cities, the time span is n periods, and the number of indicators is k . The indicator data of n years are combined into a global evaluation matrix, which is written as
x = x 1 , x 2 , x 3 , , x n = x i j m n × k
(2)
Standardization of indicators: The indicators of the global evaluation matrix are standardized, where x i j represents the item indicators of the i i =   1 , 2 , 3 , , m n row and j j =   1 , 2 , 3 , , k column:
Positive   indicators :   Z i j = x i j min x j max x j min x j
Negative   indicators :   Z i j = max x j x i j max x j min x j
where Z i j is the standardized index value, and max x j and min x j represent the maximum and minimum values of the j-th index, respectively.
(3)
Calculation of the percentage of each indicator:
P i j = Z i j i = 1 m n Z i j 1 i m n , 1 j k
(4)
Calculation of the information entropy value of the j-th indicator:
e j = k i = 1 m n P i j ln P i j , 1 i m n , 1 j k
where k =   1 / ln m n . If P i j = 0 , then we define P i j ln P i j = 0 .
(5)
Calculation of the coefficient of variation of the j-th indicator d j :
d j = 1 e j
(6)
Calculation of the indicator weights W j :
W j = d j j = 1 k d j
(7)
Calculation of the comprehensive evaluation index of GD in the YRB for each year:
G D = j = 1 k W j Z i j

2.3.2. Standard Deviation Ellipse (SDE)

The SDE is a spatial statistical technique used to judge the distribution direction and characteristics of geographical elements, which can accurately indicate the spatial evolution pattern of the YRB’s GD. The specific formula for the horizontal spatial migration and spatial distribution characteristics is shown in [34].

2.3.3. Exploratory Spatial Data Analysis (ESDA)

Tobel’s first law of geography reveals the spatial correlation and agglomeration relationships in a geographical distribution. In addition, the ESDA was developed on the basis of exploratory spatial numbers. Combined with the visualization of geographic information, it can show the spatial correlations of GD and its changes among cities in the YRB. The Global Moran Index can describe the overall spatial correlations of GD in the YRB. The formula is as follows:
I = i = 1 n j = 1 n W i j X i X ¯ X j X ¯ S 2 i = 1 n j = 1 n W i j
In the formula, I is the Global Moran Index, X i and X j represent the GD of cities i and j, respectively, S 2 is the variance of the GD level, and W i j is the spatial weight matrix, in which each element is the reciprocal of the Euclidean distance between cities. Here, I ∈ [–1,1]; when I > 0, this shows that the level of GD of the cities in the YRB shows a positive spatial correlation in the spatial distribution, and when I < 0, this shows that the level of GD of the cities in the YRB shows a negative spatial correlation in the spatial distribution.
The Local Moran Index can be used to test the correlations of the GD between local cities and neighboring cities, and it can effectively reflect the degree of spatial correlation and the agglomeration phenomena of local cities:
I = X i X ¯ S 2 i = 1 n W i j X j X ¯
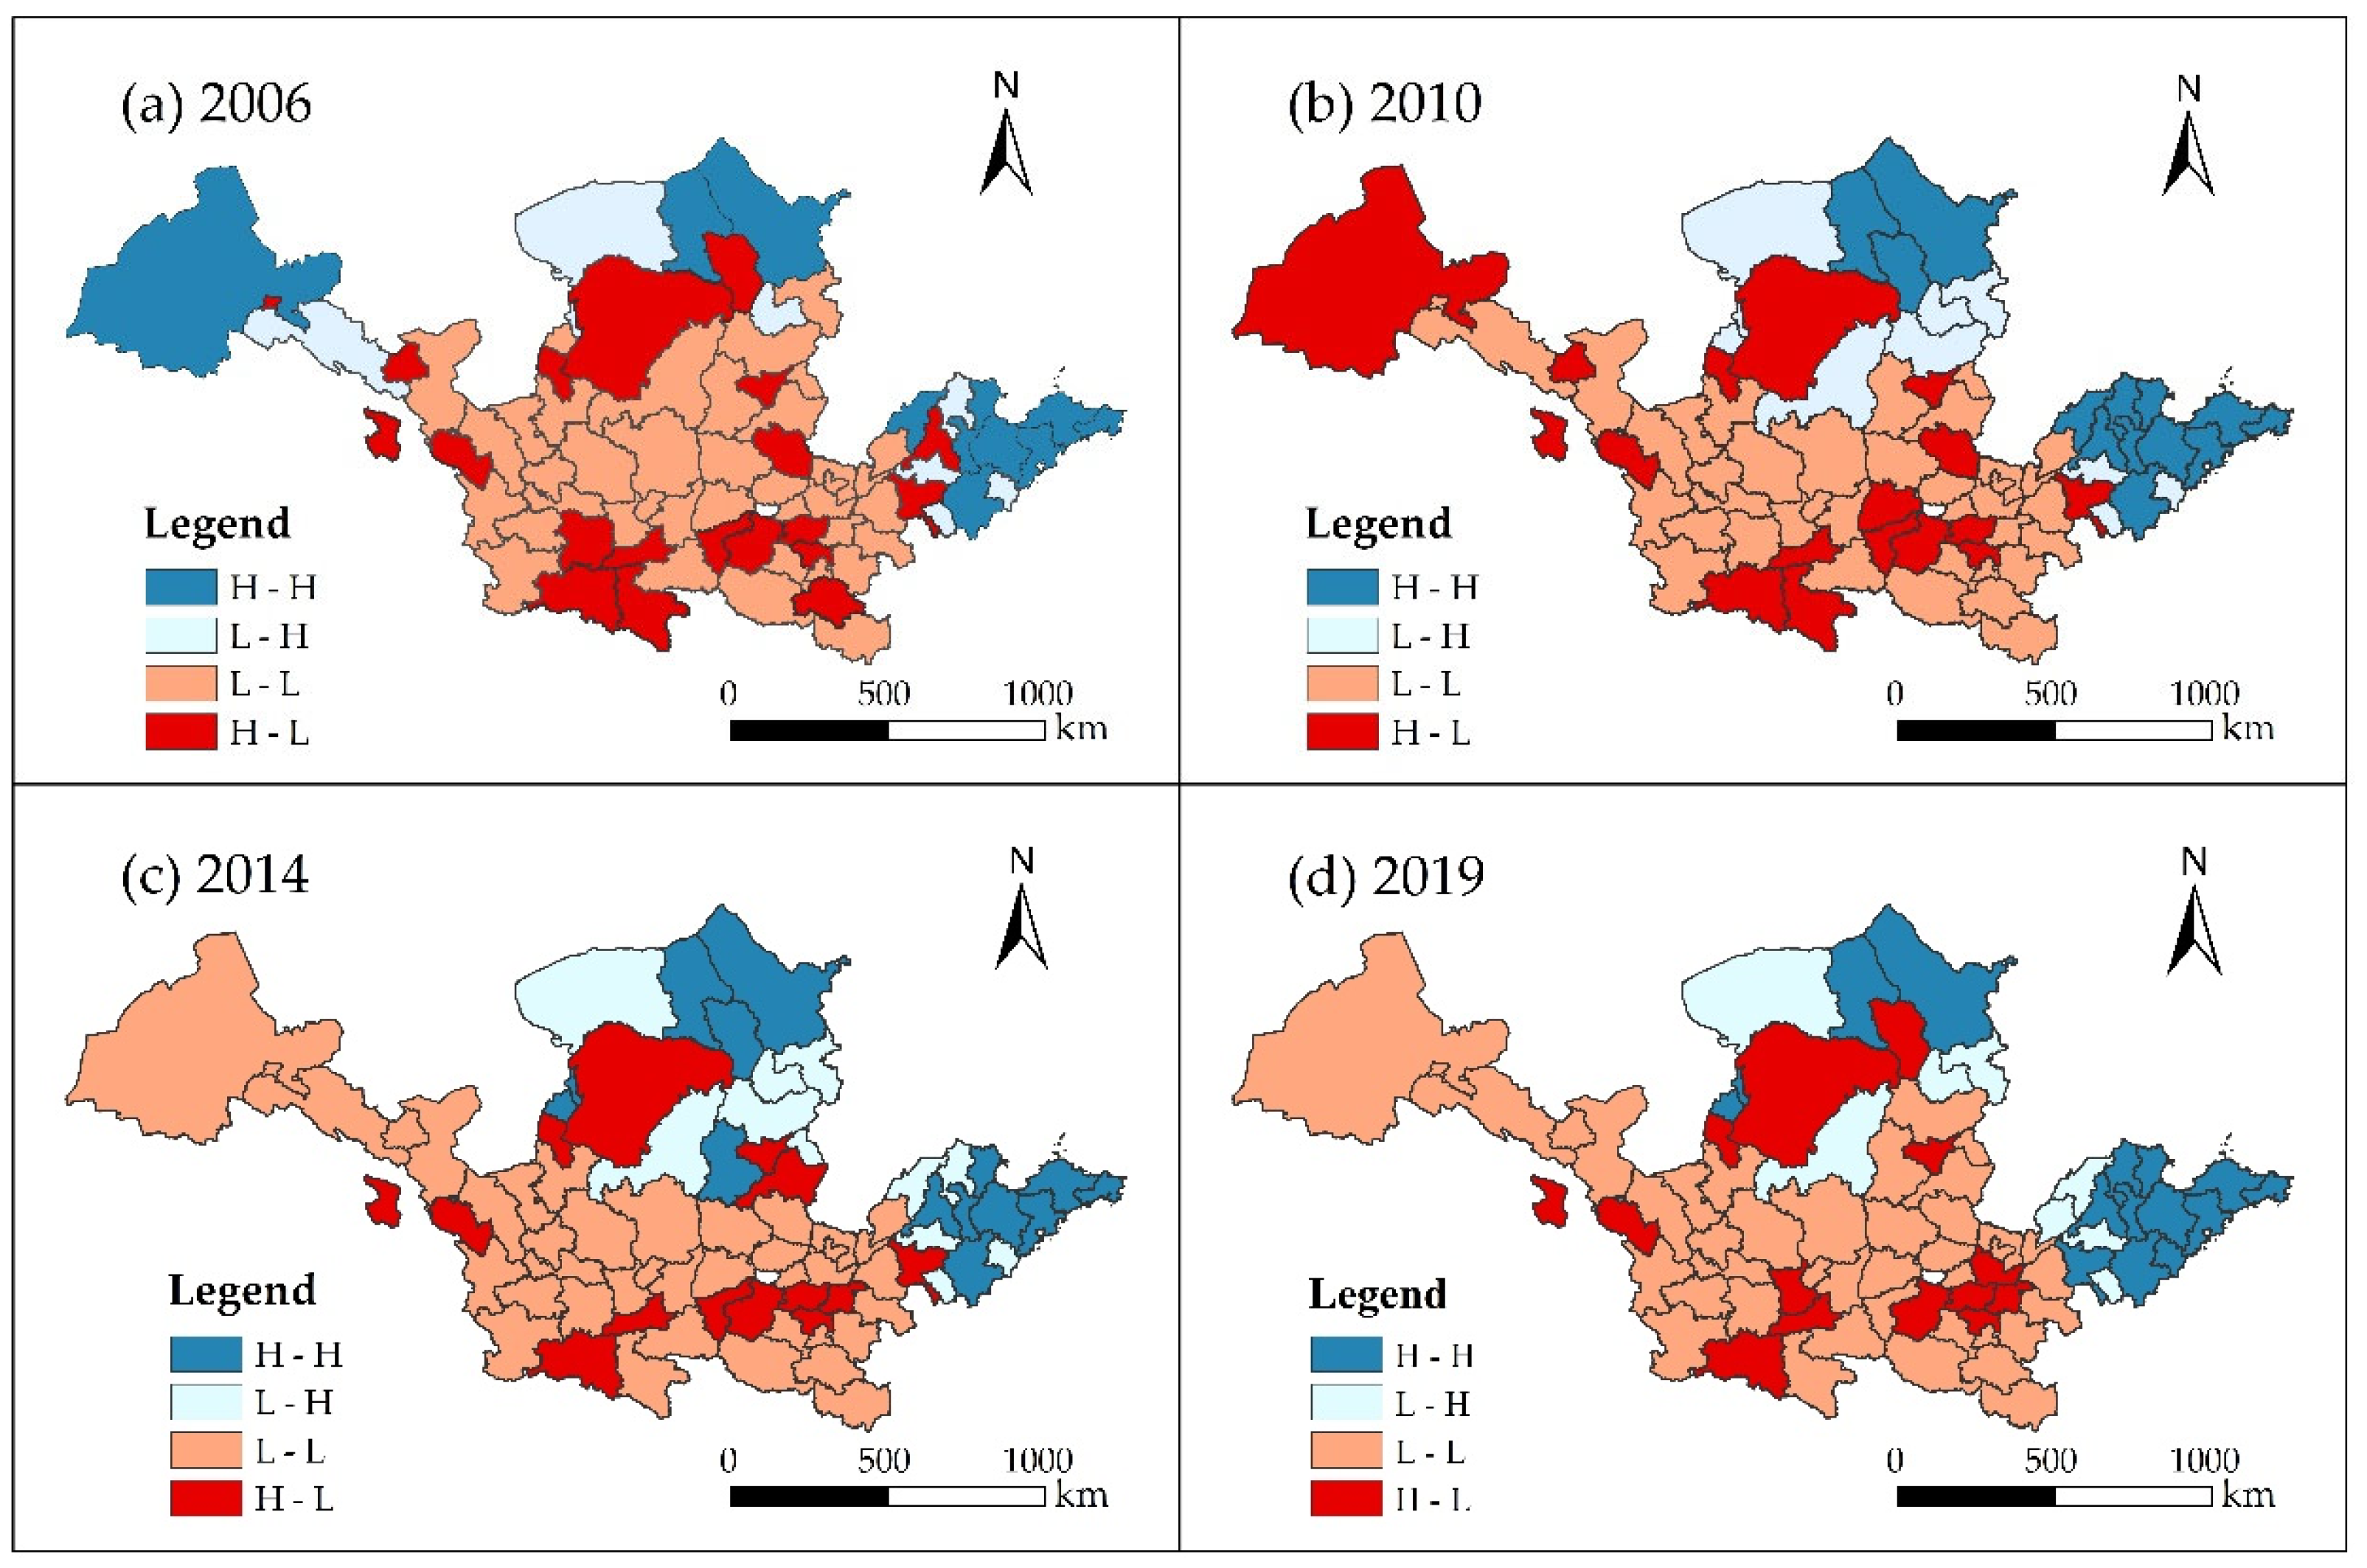
In the formula, I represents the Local Moran Index. Its scatterplot with four quadrants, which was derived using the Stata command, has the following meaning: high–high (H-H) agglomeration, low–high (L-H) agglomeration, low–low (L-L) agglomeration, and high–low (H-L) agglomeration. Taking H-H agglomeration as an example, it indicates that the city and the surrounding cities both have significant levels of GD, and the rest are the same.

2.3.4. Spatial Econometric Model

Compared with the traditional measurement method, the spatial measurement method considers the spatial correlations of the samples, and the YRB’s GD level is clearly spatially dependent, so the effect of spatial influence should be considered when analyzing its influencing factors. Commonly used spatial econometric models include the spatial error model (SEM), the spatial lag model (SLM), and the spatial Durbin model (SDM). Based on the models of Wang Zhenbo [35] and Sun Xiaolu [36], this paper constructed the following spatial econometric models to verify the mechanisms of influence and the spatial spillover effects among the variables.
Y i t = β X i t + φ j = 1 n W X i t + ρ j = 1 n W Y i t + μ i + v t + ε i t
In the formula, i represents the i-th city in the YRB, Y represents the GD measured by the EM, X i t is the influencing factor for the selection, W is the spatial weight matrix, β is the parameter to be estimated for each influencing factor, φ is the coefficient of the spatial lag term of the spatial variables of each influencing factor, ρ is the estimated coefficient of the spatially lagged term of the explanatory variable, which can measure the spatial dependence of the level of GD among cities, and μ i ,   ν t , and ε i t represent the spatial fixed effects, temporal fixed effects, and random error terms, respectively. When φ = 0 and ρ 0 , the above equation represents the SLM model; when φ + ρ β = 0 , the above equation is simplified to the SEM model.

2.4. Data Source and Processing

This study covered the period from 2006 to 2019. The data in the indicator system, except for the PM2.5 data derived from the atmospheric composition analysis group of Dalhousie University and the water resource data derived from the Water Resource Bulletins of the provinces in the YRB, were obtained from the “China Urban Statistical Yearbook” and the “Statistical Yearbooks” of the provinces and cities in the YRB from 2007 to 2020. The indicators affected by price fluctuations, such as regional GDP, total retail sales of consumer goods, and per capita disposable income, were converted using the constant price from 2006 as the base period. Except per capita disposable income, other per capita data were derived from raw data as a percentage of the total population at the year’s end. For example, information on the total water resources per capita was obtained using the total water resources/total population at the end of the year. For specific units, see the indicator system. For the calculation of the industrial advanced coefficient and the private economic development index, see [31].

3. Spatial and Temporal Evolution Characteristics of GD in the YRB

3.1. Temporal Evolution Characteristics of GD in the YRB

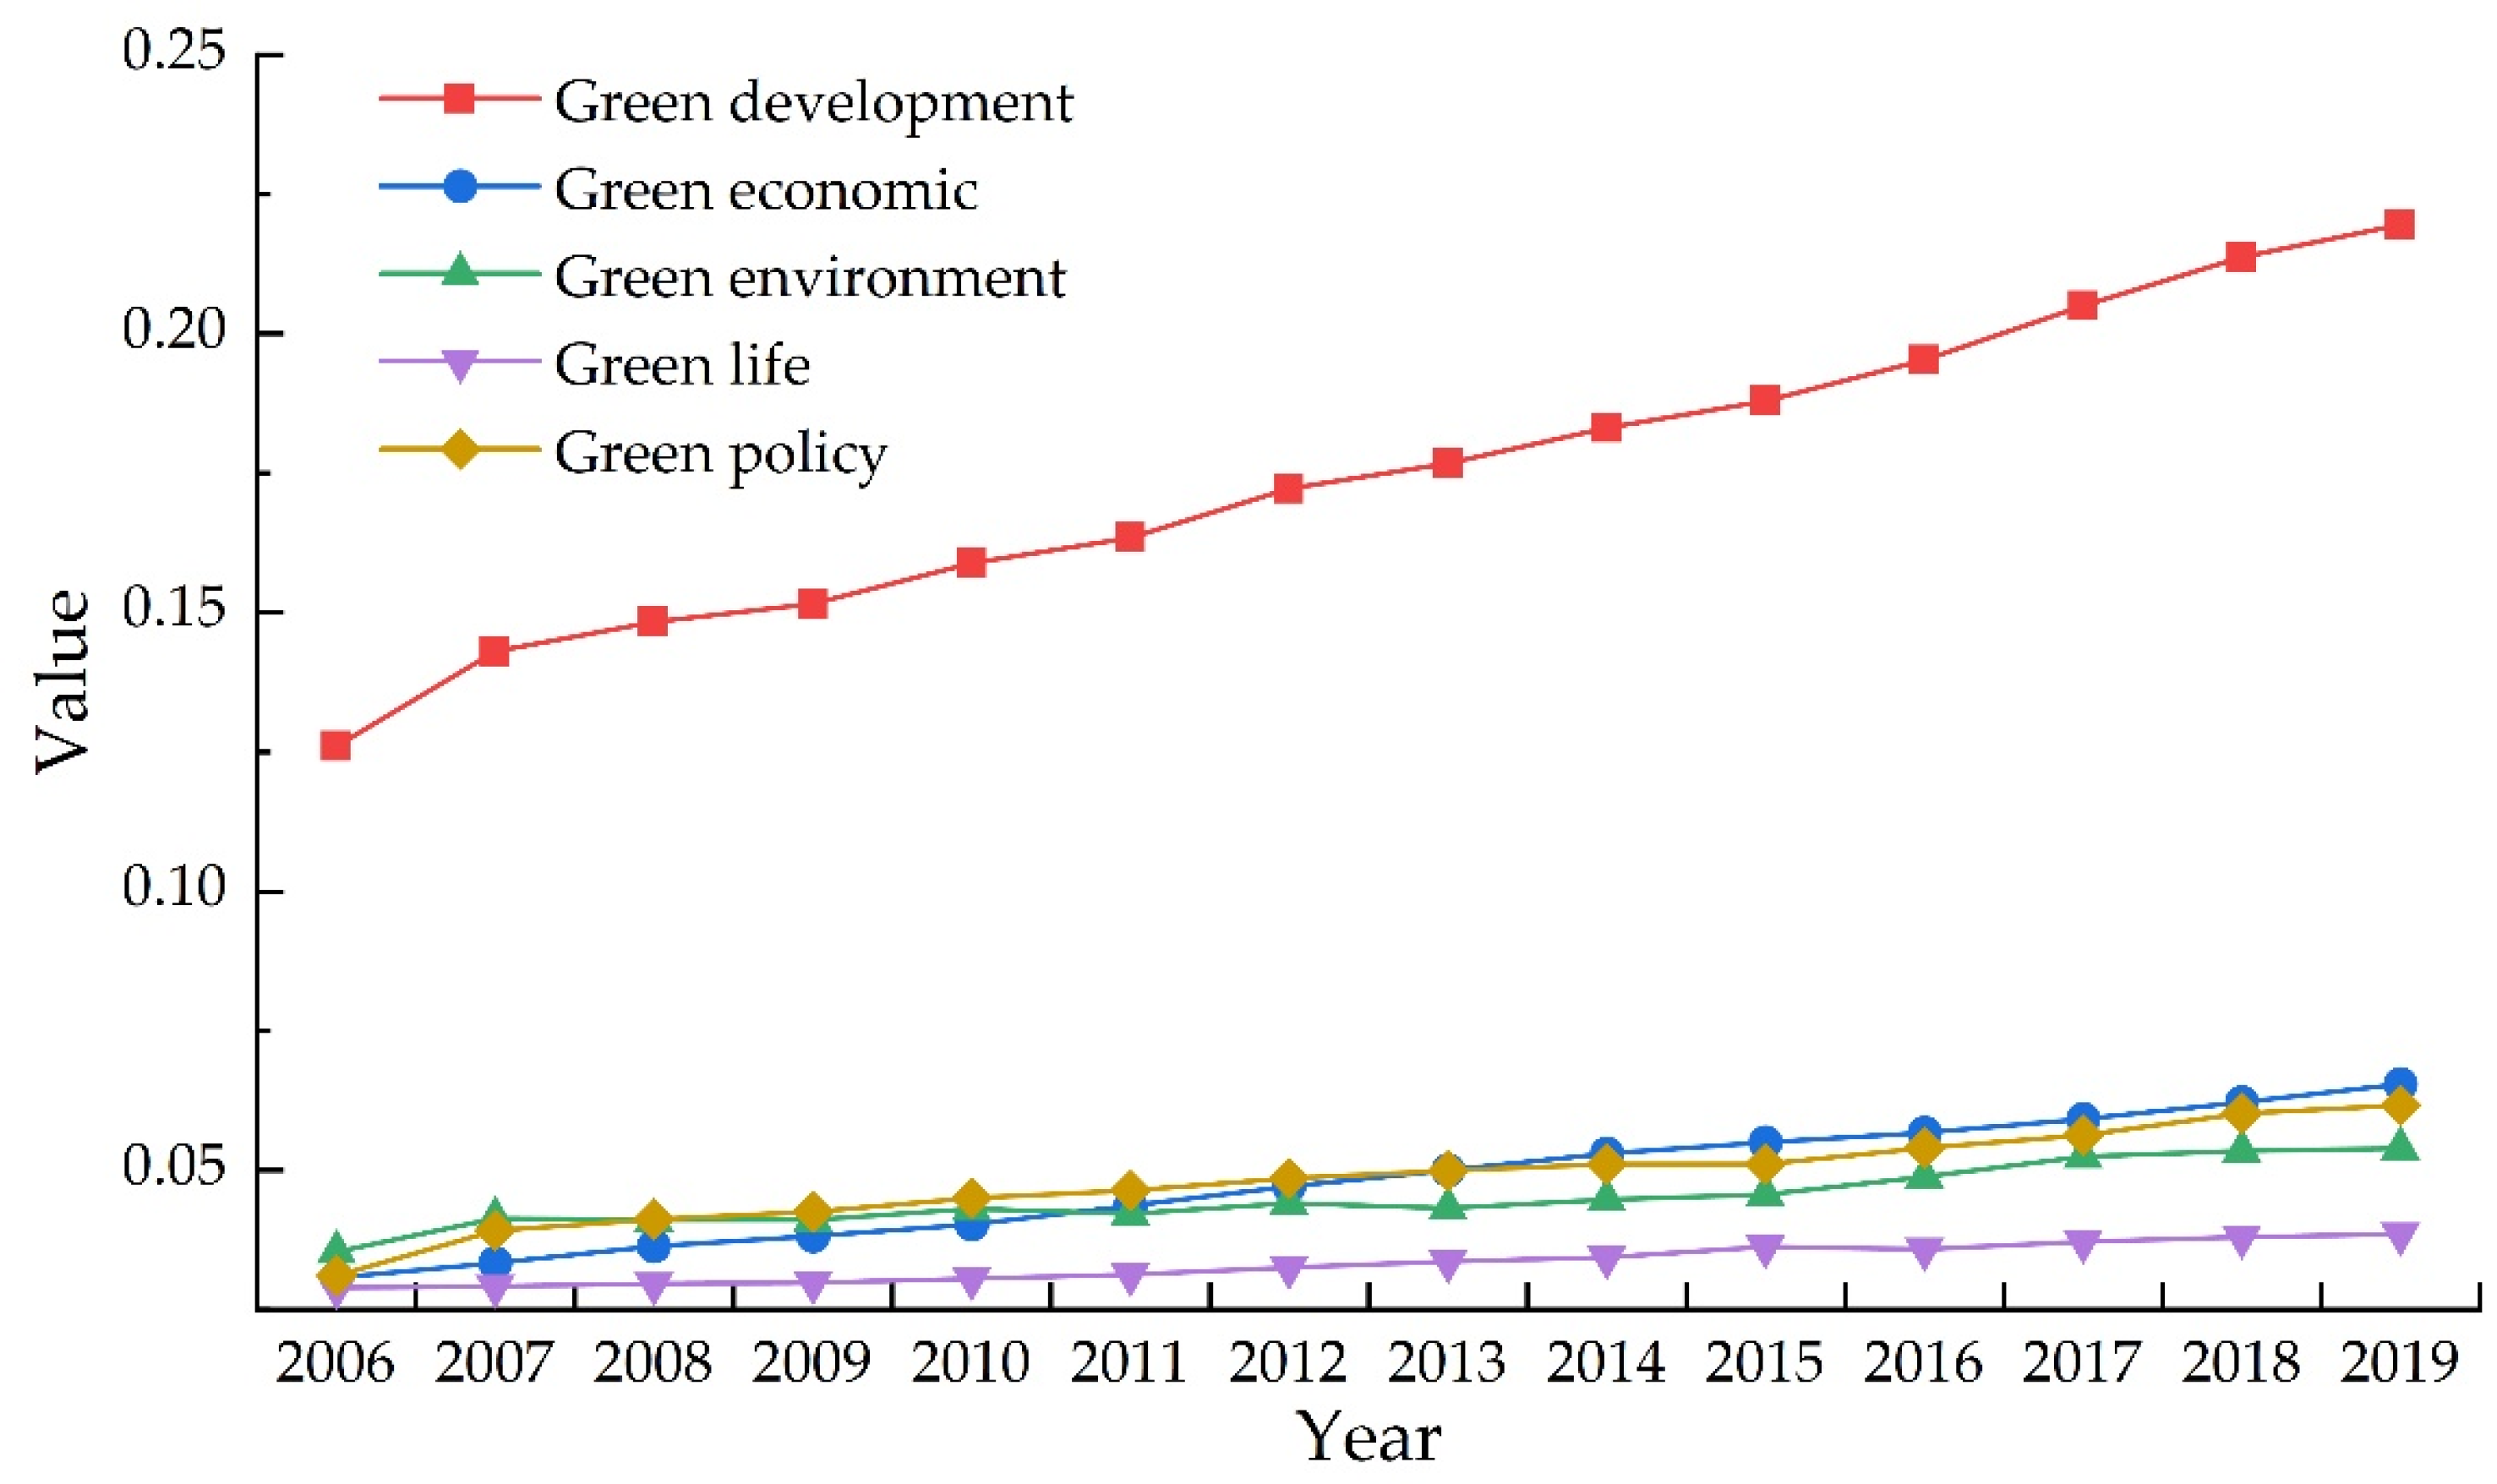
Using the EM, we calculated the GD and its four criterion layers for 79 cities in the YRB from 2006 to 2019, as illustrated in Figure 3. The average GD level in the YRB rose from 0.126 in 2006 to 0.220 in 2019, with a lower overall development level and a slower development process. The GD level was subdivided into four subsystems: green economy, green environment, green life, and green policy. On the whole, the evaluation levels of each subsystem were ranked as “green government > green economy > green environment > green life”. GD was still mainly oriented by the government and economy, while environmental improvement and life changes were relatively slow. (1) The green economy level evaluated from 2006 to 2019 was around 0.048, with the largest average annual growth rate of 6%. With the improvement of economic development, the kinetic energy of development tended to be diversified, the efficiency of resource and environmental utilization was improved, and the green economy became the primary driving force for the improvement of GD. (2) The green environment level increased from 0.035 to 0.054, representing an average annual increase of approximately 3.4%. The reason for this was that the YRB has a unique abundance of resources. (3) The green life level was approximately 0.033, with the slowest average annual growth rate. The reason for this may be that the formation of a green lifestyle is a long and tortuous process [37], and the cultivation of the awareness of ecological environmental protection and the transformation of lifestyle cannot be achieved overnight. (4) The green policy level increased from 0.031 to 0.062, with the highest average level among the subsystems. Government intervention can promote GD in the YRB. Governments at all levels have actively promoted the green transformation of the industrial structure and have increased investment in innovation. The ecological governance of the YRB has achieved initial results, and an initial coordination and linkage mechanism has been established.
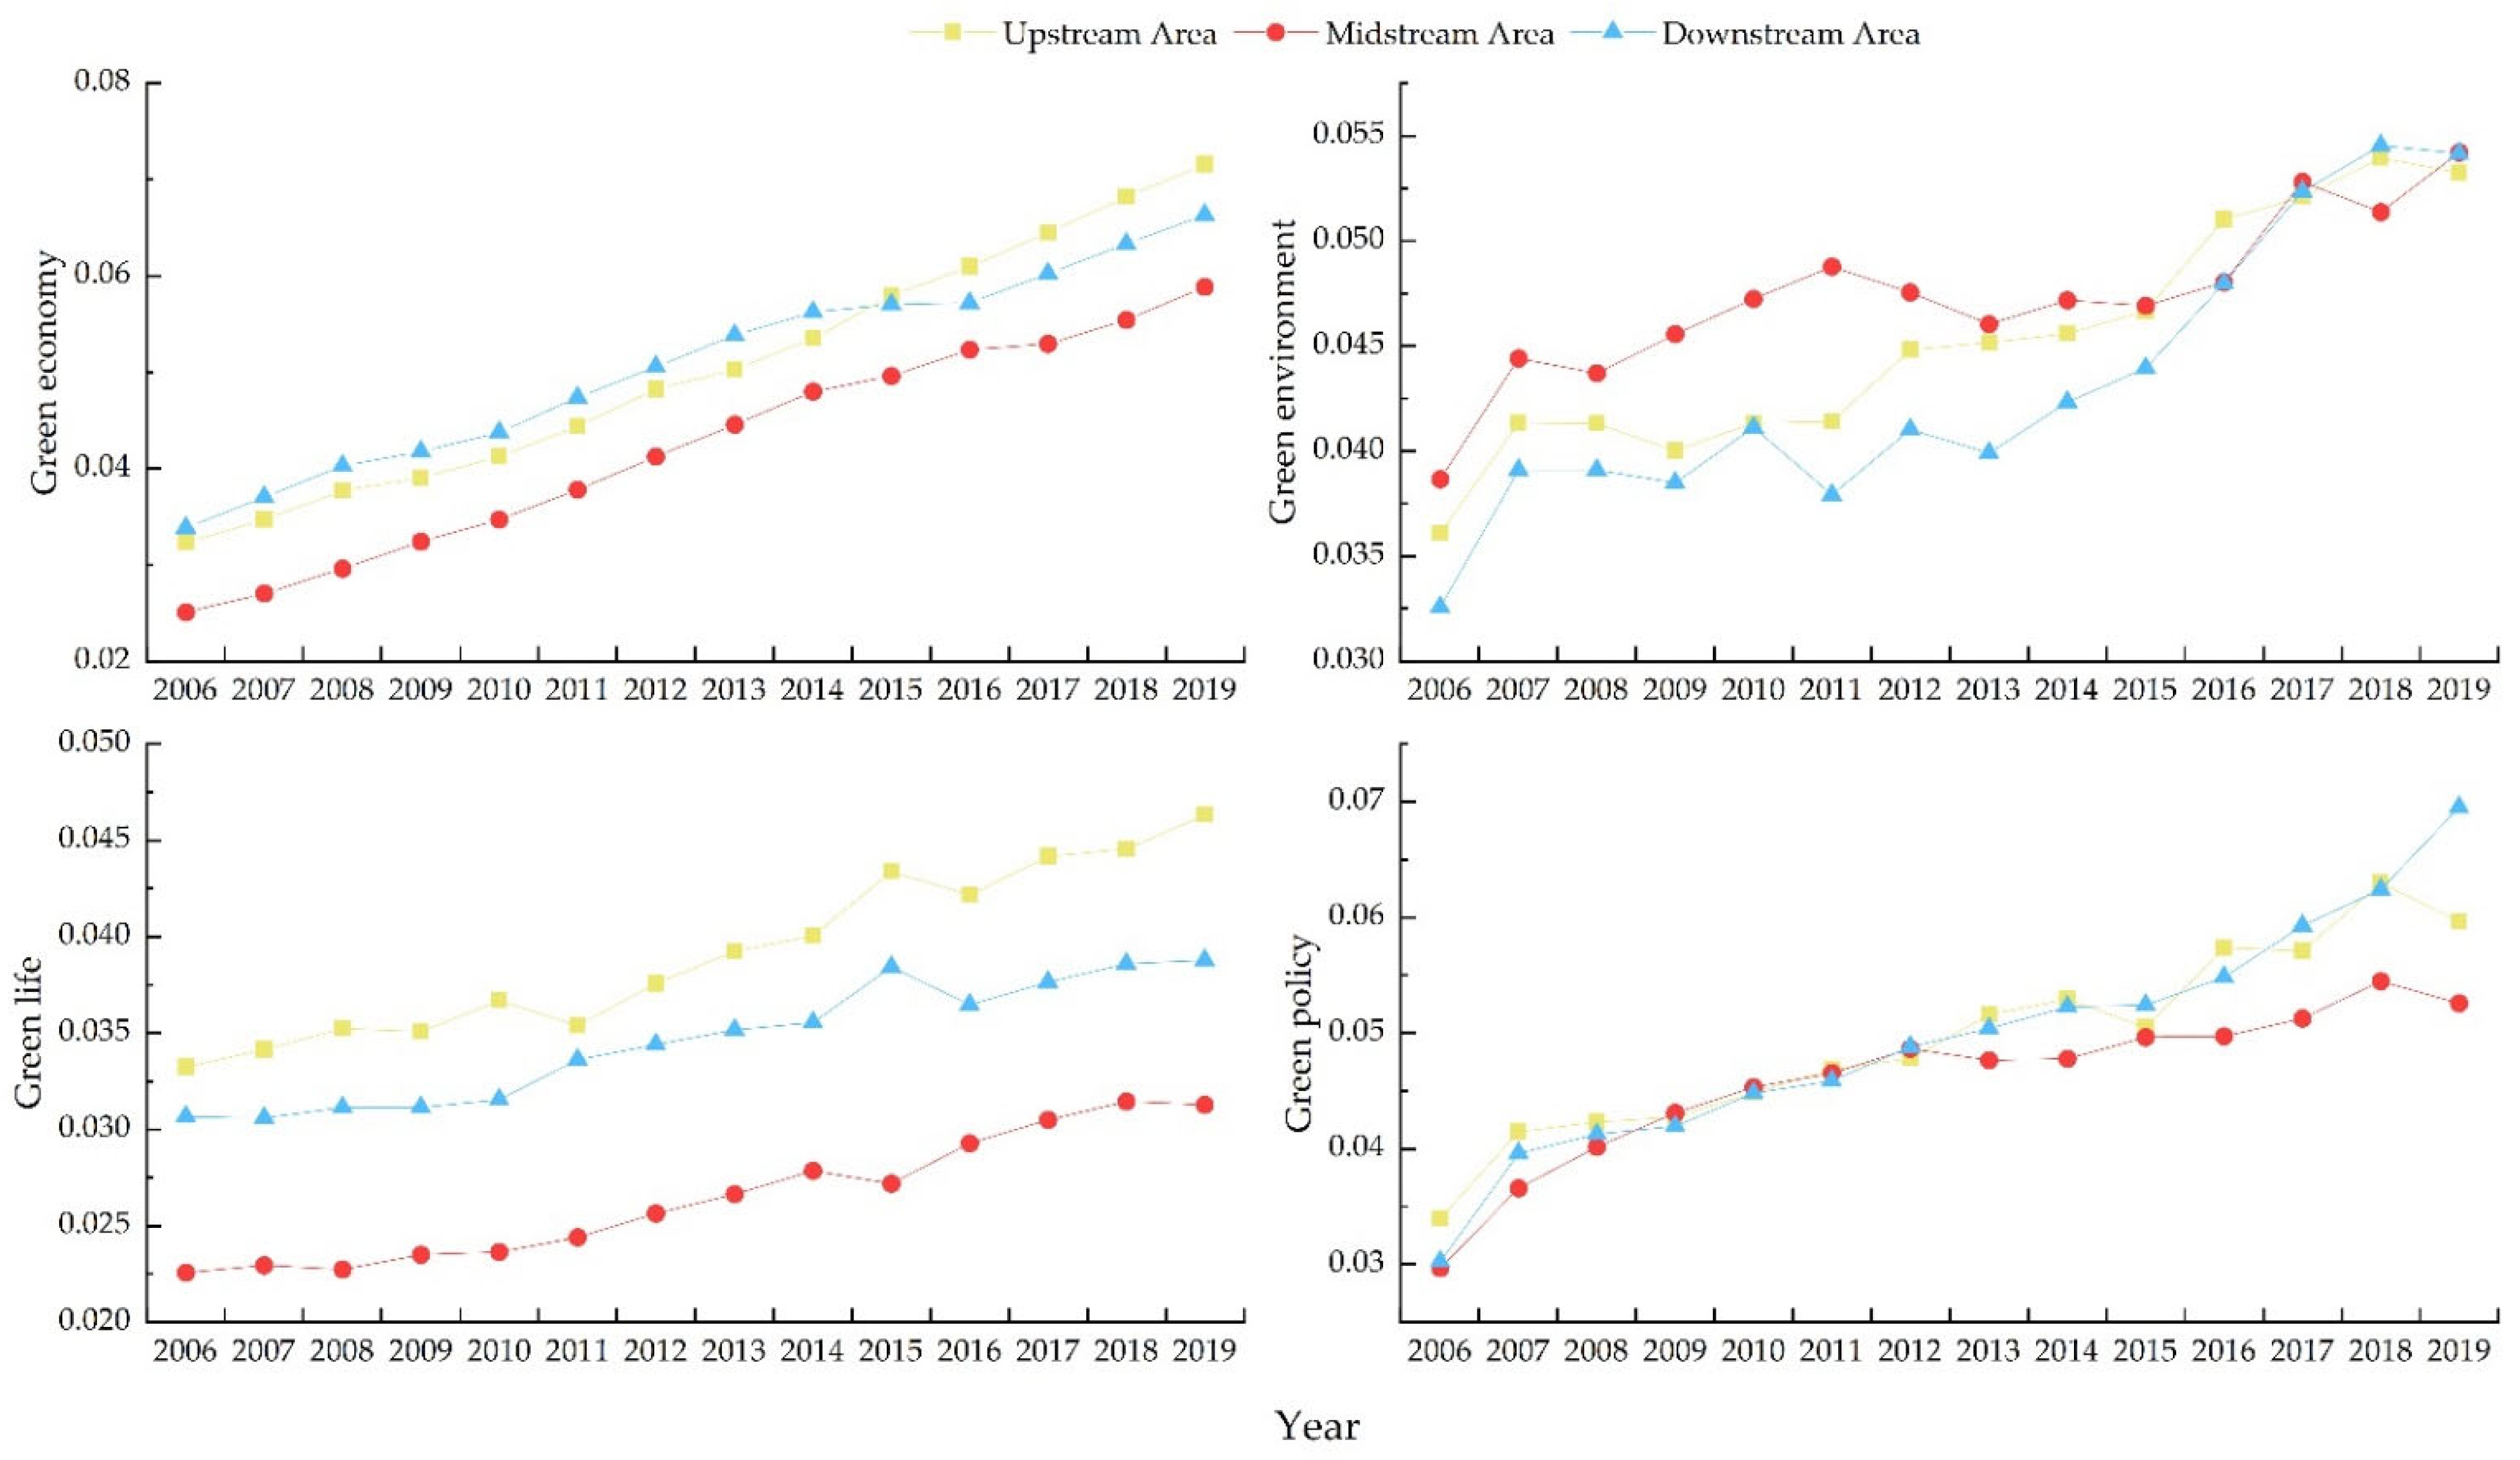
Figure 4 presents the GD of each basin in the YRB; it presents a trend of “upstream area > downstream area > midstream area”. In the analysis of each subsystem, the green economy maintained an upward trend, with a mean value of 0.0506 in the downstream region, which was slightly higher than the value of 0.0503 in the upstream and much larger than the value of 0.0421 in the midstream, and the downstream region showed a slow upward trend during 2013–2016, which was probably because of the stricter requirements for large industrial provinces after the 18th National Congress of China. The green environment showed a fluctuating upward trend, and the gaps between regions gradually narrowed after 2013, which was probably because the country increased the intensity of environmental management and intensified its efforts to combat air pollution since the 18th National Congress. Green life showed a significant difference in terms of the order of “upstream > downstream > midstream”, which was probably because the life of residents in upstream areas changed drastically after the implementation of the Western Development Strategy, and the lower population density and cost of living caused the upstream areas to have a higher level of green living. Green government did not differ much before 2013 and rose significantly in the upstream and downstream regions after 2013, which was mainly due to China’s greater emphasis on the west and the importance of environmental management by governments in Shandong and other regions. Overall, the subsystems of GD in the YRB underwent great development, but the overall score was still low. In the future, under the guidance of the government, we should improve the quality of economic development while improving the environment and realize the transformation of people’s lives to achieve a higher level of green living.

3.2. Spatial Features of GD in the YRB

3.2.1. Spatial Distribution Characteristics of GD in the YRB

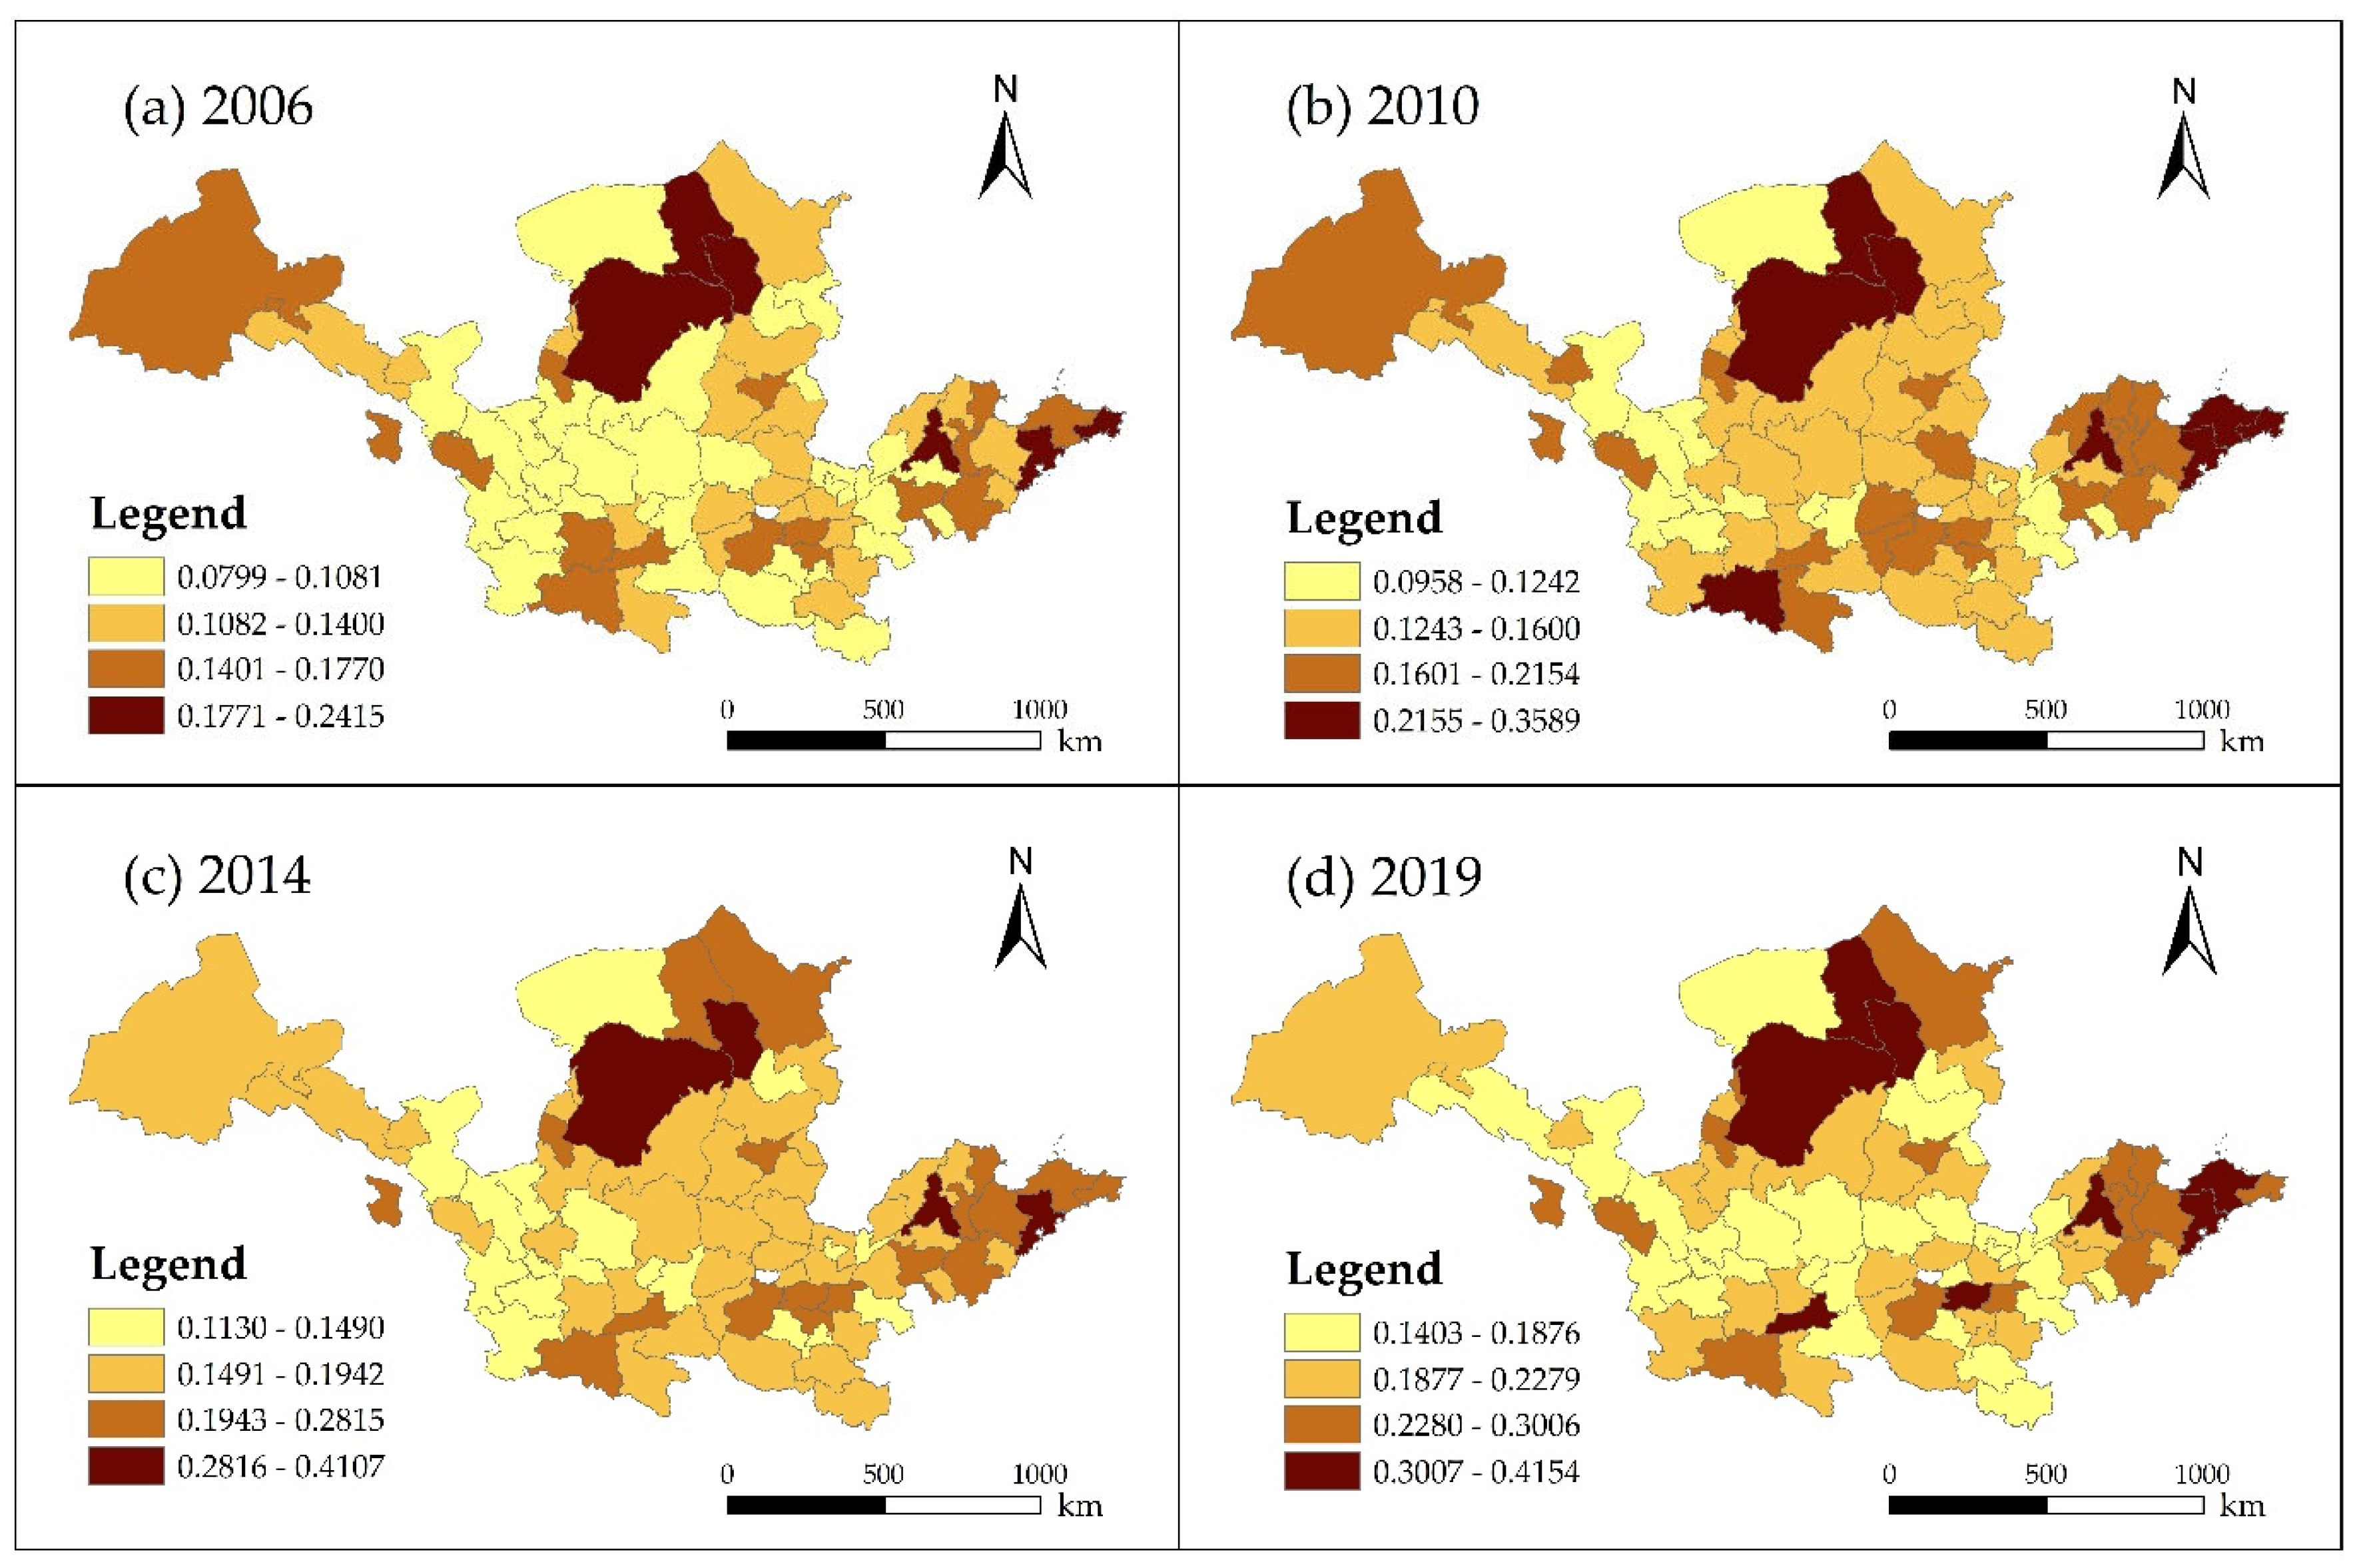
In order to further reveal the spatial distribution characteristics of the GD in the YRB, we used the natural breakpoint method to divide the contrasting consequences into four grades—high, medium, general, and low–and we used ArcGIS 10.7 software to visualize them (Figure 5). Overall, the YRB’s GD showed a clear spatial imbalance, displaying a distribution structure characterized by “quad-core pieces” with the formation of high-value core areas in Inner Mongolia with Ordos, Baotou, and Hohhot as the core, high–mid-value core areas in Shandong Peninsula with Jinan and Qingdao as the core, high–mid-value core areas in the urban agglomeration of the Central Plains with Zhengzhou as the core, and high–medium-value core areas of Shanxi with Xi’an as the core; the areas with general and low-level GD outside the core areas were characterized by a “flaky” distribution. It can be seen that the core areas were mainly concentrated in the provincial capitals and regional centers. The reason for this distribution pattern may be that the GD of the YRB is still in its early stages, and the regional center cities and provincial capital cities are more likely to gather GD resources through “centripetal force” and transfer backward production capacity to the surrounding areas through “decentralization force”. In central cities, more emphasis has been placed on the implementation of the concept of GD; for example, Jinan is committed to green city construction as part of “China’s 13th Five-Year Plan”, and it has now also issued the “14th Five-Year Plan for Green Low-carbon Cycle Development”.

3.2.2. Spatial Evolution Characteristics of GD in the YRB

We used the SDE to reveal the spatial evolution characteristics of GD in the YRB (Figure 6 and Table 2). In terms of the movement of the center of gravity, the YRB’s GD from 2006 to 2019 was between 111.38° and 111.59° E and between 36.54° and 36.60° N, and it was always located in Linfen, Shanxi Province. From 2006 to 2010, the center of gravity shifted 19.89 km to the southeast, indicating a significant improvement in the GD of the lower Yellow River area. From 2010 to 2014, the center of gravity shifted 6.72 km to the southeast, with some cities in Inner Mongolia and Shandong further strengthening their GD. From 2014 to 2019, the center of gravity moved to the southeast again, with the GD in the lower Yellow River area continuing to increase. On the whole, the center of gravity of the GD in the YRB moved to the southeast, with a total moving distance of 24.29 km, showing that the GD of the Zhengzhou Metropolitan Area and Shandong Peninsula Urban Area continued to improve. The reason for this was probably the gradual shift of the strategy of converting Central China from being oriented toward economic growth to being oriented toward GD, on the one hand, with Zhengzhou as the core growth pole at the forefront of development; on the other hand, it benefited from Shandong Province implementing ecological management and protection strategies, such as “Green Shandong” and “Ecological Shandong”. In terms of shape, the spatial distribution of the YRB’s GD was in the “northwest–southeast” direction, and the rotation showed a dynamic decreasing trend, ranging from 97.84° to 98.80°, indicating that the “northwest–southeast” direction tended upward. The standard deviation on the Y-axis of the SDE tended to decline, and the standard deviation on the X-axis grew before falling, indicating that the YRB’s GD showed a gradual trend of accumulation in the “northeast–southwest” direction, while it tended to diffuse and then accumulate in the “northwest–southeast” direction.

3.2.3. Spatial Autocorrelation Analysis of GD in the YRB

Using Formula (1) to calculate the Global Moran Index of the GD in the YRB from 2006 to 2019, the results show (Table 3) that all of the years passed the significance test and showed a fluctuating upward trend, demonstrating a strong spatial association of the GD in the YRB and a significant positive spatial correlation.
The spatial agglomeration map of the GD level in the YRB was drawn using the Local Moran Index (Figure 7). The local spatial agglomeration of the GD in the YRB from 2006 to 2019 mainly shifted from an L-L agglomeration and H-L agglomeration to an L-L agglomeration and H-H agglomeration, and the number of cities displaying L-L and H-H agglomerations increased, reaching 41 and 15, respectively, in 2019, with a total accounting for 71.8%, indicating that the level of GD in the YRB tended to be strengthened in terms of spatial agglomeration. Specifically, the H-H area agglomeration was mainly located in the urban agglomeration in the Shandong Peninsula and the cities of Ordos and Baotou in Inner Mongolia. The reason for this is that these areas had better economic development and had formed a more comprehensive collaborative governance and development mechanism; the L-L agglomeration area was mainly located in most cities located in the Loess Plateau because these cities were relatively backward in economic development, over-reliant on traditional industries, and had the most fragile ecological environment, which poses a challenge to the improvement of GD; H-L agglomerations were mainly concentrated in Xi’an, Zhengzhou, and other provincial capital cities and surrounding cities because the “siphon effect” may occur in the development of these cities without taking into account the development of the surrounding cities.

4. Analysis of the Influencing Factors of GD in the YRB

4.1. Selection of the Influencing Factors of GD in the YRB

The study’s results show that economic development increased the direct impetus for cities to implement a GD strategy and that high-quality urbanization was a significant factor in the enhancement of the GD of cities. The optimization and adjustment of the industrial structure, the impact of science and technology as demonstrators, the government’s regulation mechanisms, and globalization all have significant impacts on GD [38,39,40]. Therefore, this paper examined the impacts of different factors on the GD of the YRB from six perspectives: economic development (ED), government regulation (GR), urbanization level (Urb), industrial structure (IS), science and technology (S&T), and opening up to the outside world (Open) (Table 4).

4.2. Model Suitability Check

In order to ensure the scientificity and rigor of the model selection, we tested the applicability of the spatial econometric model. As shown in Table 5, first, the spatial effect was tested. Although the Global Moran Index indicated the existence of spatial correlation, it did not play the role of selecting a spatial econometric model. We used the LM test to select the spatial econometric model, and all tests showed significant results, which indicated that there was a significant spatial correlation of GD levels among cities in the YRB and that choosing a more general SDM was better than the SLM and SEM. Second, before testing the estimates, it was necessary to apply the Hausman test to decide whether it was a fixed-effect model or a random-effect model. As the Hausman statistic was negative (−27.94), the spatial Durbin random-effect model was selected for the test estimation. In addition, the LR and the Wald tests were used to determine the optimal combination of spatial econometric models. The results showed that the SDM could not be transformed into the SLM and SEM, which was in harmony with the LM test results. Therefore, the random-effect SDM was chosen to discuss the influence mechanism and spatial effect of each influencing factor.

4.3. Analysis of the Results

The SDM analysis was performed with the help of Stata 14. It can be seen from the first two columns of Table 6 that the spatial autoregressive coefficient ρ of GD in the whole basin was significantly greater than 0, indicating that the spillover effect of the YRB’s GD was significant. There are two possible reasons for this spatial overflow: The first is the demonstration effect. Regional concentrations and high levels of GD can provide practical experience and technical support for “backward” areas through the “demonstration effect”, and the “backward” areas can further strengthen their speed of catching up through imitation and learning. The second is the competition effect. Since the 18th National Congress of the Communist Party of China, the awareness of ecological governance has been strengthened and GD has become a goal at all levels of governance. In addition, the estimation results of the SDM are not suitable for directly explaining the impacts of various factors on GD. LeSage and Pace [41] argued that when ρ is significantly different from 0, the regression coefficients cannot be used directly to explain the extent of the effect of each influencing factor on GD, but need to be analyzed by decomposing the regression coefficients into direct and indirect effects with the help of partial differentiation. Specifically, in this paper, the direct effect is the average effect of the influencing factors of a region on GD, and the average impact of the surrounding regions’ influencing factors on that region’s GD is known as the indirect effect.
From the decomposition of the effects in columns 3 and 4 of Table 6, first, the direct effect of ED was statistically significantly positive at the 1% level, demonstrating that ED had a favorable effect on the region’s GD, that is, ED provided the driving force for the GD of cities, and economically developed regions also had greater advantages in attracting innovative talents and environmental governance. The indirect effect of economic development was not yet obvious, which showed that the potential of neighboring regions’ economic development to drive GD in a region had not yet been fully realized.
The impacts of GR, both direct and indirect, were not yet substantial, which may have been due to the lagging effect of eco-environmental governance and the ambiguity of performance identification, which, coupled with the mobility of officials and the competition between governments, led to a significant impact on GD.
The indirect effect of Urb was considerably beneficial at the 5% level, while the direct effect was not significant. This suggests that the urbanization process promoted the GD of neighboring areas. The urbanization process shifted the population and resources of neighboring cities to the region, which, to some extent, reduced the pressure on neighboring cities. Meanwhile, with the improvement of the urban environmental governance capacity, the synergistic management capacity between cities was also enhanced, which promoted the GD of neighboring cities.
The direct effect of IS was significantly negative, which hindered the GD of the region. The reason for this may have been that, as an important industrial belt for energy development, the YRB has an unreasonable energy consumption structure, serious and heavy industrialization, and a slow industrial transformation, meaning that the emission-reducing effect of industrial restructuring was not yet obvious.
The direct effect and indirect effect of S&T were both positive, and they passed the significance test at the 5% and 10% levels, respectively. S&T provided intrinsic motivation to enhance GD. On the one hand, S&T can reduce the disturbance and damage of regional development to resources and the environment, and it can overcome the bottleneck constraints of resources and the environment through improvements in the resource utilization efficiency, clean production process control, and improvements in the end pollutant management level; on the other hand, it can also indirectly promote regional GD by enhancing the scientific and technological innovation capacities of neighboring regions through technological spillover.
At the 1% level, Open had a considerably positive direct effect. The impact of foreign investment on cities in the YRB confirmed the “pollution paradise” hypothesis, which was probably because, along with the constant optimization of China’s foreign investment and the national ecological protection in the YRB, the YRB was considering the introduction of foreign investment to meet the needs of both economic development and ecological protection; however, the indirect effect was not yet significant.

5. Discussions

GD has received much attention from scholars in recent years, and the GD of other river basins has been widely studied [42]; the YRB should receive more attention because of its special characteristics.

5.1. Discussion of the Specificities and Generality of the YRB

The YRB has special characteristics compared to other large river basins. First, the Yellow River does not have navigable conditions, which means that, in the YRB, shipping cannot be used for the construction of city clusters, mutual regional cooperation, industrial agglomeration, etc. Due to this, the YRB differs significantly from the Mississippi River in the United States, the Rhine River in Europe, and the Yangtze River Basin in China [43]. In addition, although the Yellow River is the fifth largest river in the world, its runoff is much lower than that of other large rivers, making its water resources even more stressful. Meanwhile, the overall water quality of the Yellow River is worse than China’s average. As a result, little change has been observed in the degree of locational advantage in different areas of the YRB, and the region’s GD faces a special dilemma. It can also be seen from China’s regional development strategy that the conservation and development of the YRB are carried out simultaneously, rather than as integrated regional development. We also believe that ecological protection and economic development are complementary; ecological protection is a prerequisite for economic development, and environmental protection cannot be separated from the economic base. It is this specificity that is the reason for choosing the YRB as our study area. At the same time, the YRB is also general in nature and faces the same ecological problems as other large river basins. For example, the Yellow River and the Rhine River both have the problems of cross-regional rivers, and both have the commonality of cross-regional collaborative management [44]. Compared with the Rhine River, which needs to deal with transnational coordination, the Yellow River needs to deal with domestic cross-administrative coordination, which is obviously easier. Therefore, we also hope that we can provide a reference for studying the GD of other regions, and our subsequent research will go deeper into other large river basins.

5.2. Discussion on GD in the YRB

This study provides some empirical evidence for the achievement of the conservation and development of the YRB. We found that the GD level of the YRB showed a pattern of “upstream > downstream > midstream”, which is not consistent with the economic development pattern of “downstream > midstream > upstream” and is consistent with Guo’s results when using the GD efficiency measure [45]. Combined with the negative impact of IS, the possible reason is that the downstream socioeconomic development still relies on the black development model of industrial-scale expansion and total growth, so this situation must be profoundly changed. The GD in the YRB is currently at a low-level stage, and fewer developed cities in the YRB have achieved balanced economic and environmental development; however, the environmental Kuznets hypothesis still exists in most cities [46]. The “core piece” distribution of GD in the YRB is very different from that in the Yangtze River Basin, where most of the GD is at a high level [42], but is similar to that of the Cairo region [47], which is probably because the core cities’ “siphon effect” outweighs their “radiation effect”. We also found a significant positive spillover effect on the YRB’s GD, which is consistent with Zhou’s nationwide study [17], so the leading role of the central cities must be considered. Simultaneously, we must pay attention to the significant negative direct effect of the IS and quickly change the backward IS of the YRB.

6. Conclusions and Policy Implications

6.1. Conclusions

We scientifically constructed a GD indicator system for the YRB from a multi-dimensional perspective, objectively evaluated the GD of 79 prefecture-level cities in the YRB during the examination period using the EM, and analyzed the time-series changes in the YRB based on the measurement results. We then discussed the spatial characteristics of the YRB’s GD using the SDE and ESDA and explored the impact mechanism by using spatial econometric models. The conclusions drawn are as follows:
(1)
The overall GD of the YRB showed an increasing trend from 2006 to 2018, but the level was low. Additionally, GD is still mainly oriented by the government and economy, while environmental improvement and life changes are relatively slow. The hierarchical characteristics of GD are prominent, showing the pattern of “upstream area > downstream area > midstream area”.
(2)
From the perspective of the spatial distribution characteristics, the spatial differentiation of GD in the YRB was obvious, showing a distribution structure with “quad-core pieces”, which reflected the cumulative causal effect of GD space in the YRB, which increased the degree of uneven development between regions. In terms of the spatial evolution characteristics, the center of gravity of GD in the YRB shifted to the southeast, and the locational distribution was stable in the “northwest–southeast” direction. The change in the long and short axes of the ellipse showed that the YRB’s GD showed a trend of gradual accumulation in the “northeast–southwest” direction, while it tended to diffuse and then accumulate in the “northwest–southeast” direction. At the same time, the YRB’s GD had a significant positive correlation, and the degree of spatial correlation tended to increase.
(3)
The spillover effect on GD in the YRB is obvious. The direct effects of ED, ST, and Open and the indirect effects of Urb and ST were positive; however, IS had a significant negative direct effect, and it is urgent to change the backward IS in the YRB.

6.2. Policy Implications

Due to the obvious differences in GD in the YRB, efforts should be made to form a collaborative development and governance mechanism within the basin with ecological governance as its core based on the consideration of administrative divisions. We hope that the following policy insights are instructive. Specifically, they are as follows:
(1)
For the upstream areas in the YRB, the “Hulunbeier–Baotou–Erdos” GD growth pole in Inner Mongolia has taken initial shape, and it can provide a reference experience for other regions. The GD of cities along the Yellow River in Ningxia Province should take Yinchuan as the core and Shizuishan, Wuzhong, and Zhongwei as the pivot points in order to enhance the radiation-driven effect by linking and upgrading infrastructure, jointly managing the ecological environment, undertaking industries in the eastern region, etc. Meanwhile, the transportation hub function and city primacy of Yinchuan should be enhanced to realize the linkages of urban clusters along the Yellow River in Ningxia with Inner Mongolia, Shanxi, and Gansu. Gansu and Qinghai provinces should take Lanzhou and Xining as their core to enhance GD with their neighbors by building green transportation networks, developing new industries, etc. Meanwhile, they should expand by opening up to the West and strengthening ties with Eurasia to narrow the regional gap through cooperation.
(2)
For the midstream areas in the YRB, the ecological fragility of the Loess Plateau region cannot be ignored, and government policy is a powerful means of changing ecological problems. First, we must increase the implementation of the policy of turning farmland back into forests, improve post-maintenance work, and improve the ecological compensation mechanism to reduce soil erosion; second, we must also strengthen the supervision of polluting enterprises and implement more stringent standards for controlling pollution emissions. Energy cities in the midstream region can perform the effective green mining of fossil energy, promote changes in coal-mining methods, and build a diversified clean energy supply system; at the same time, they ought to hasten the destruction of the outdated production capacity, bolster the green transformation of established businesses, and hasten the development of new, critical industries.
(3)
For the downstream areas in the YRB, Zhengzhou’s GD presents H-L clustering, and Zhengzhou’s radiation role needs to be strengthened. Zhengzhou should improve its urban functions, use its transportation and geopolitical advantages, and form green industry clusters in cities in the Central Plains through regional cooperation; Henan Province should also consolidate the status of Luoyang as a sub-center city and play a supporting role. The Shandong Peninsula city cluster should accelerate the green transformation of the economy, vigorously develop the green economy, and continue to play a significant role in driving the YRB towards GD.

Author Contributions

Conceptualization, S.Z. and Y.L.; methodology, Y.L.; software, Y.L. and B.Z.; validation, S.Z. and B.Z.; formal analysis, Y.L.; investigation, S.Z.; writing—original draft preparation, Y.L.; writing—review and editing, S.Z.; visualization, Y.L. and B.Z.; project administration, S.Z. All authors have read and agreed to the published version of the manuscript.

Funding

This research was funded by the National Social Science Foundation of China, grant number No. 18BJY086.

Institutional Review Board Statement

Not applicable.

Informed Consent Statement

Not applicable.

Data Availability Statement

Not applicable.

Conflicts of Interest

The authors declare no conflict of interest.

References

  1. Rao, S.; Teixeira, S. The Green New Deal: Social Work’s Role in Environmental Justice Policy. Soc. Work 2020, 65, 197–200. [Google Scholar] [CrossRef] [PubMed]
  2. Eckert, E.; Kovalevska, O. Sustainability in the European Union: Analyzing the Discourse of the European Green Deal. J. Risk Financ. Manag. 2021, 14, 80. [Google Scholar] [CrossRef]
  3. Shi, X.J. Inequality of opportunity in energy consumption in China. Energy Policy 2019, 124, 371–382. [Google Scholar] [CrossRef]
  4. bp Statistical Review of World Energy 2020. Available online: https://www.bp.com/content/dam/bp/business-sites/en/global/corporate/pdfs/energy-economics/statistical-review/bp-stats-review-2020-full-report.pdf (accessed on 31 May 2022).
  5. Sun, C.Z.; Tong, Y.L.; Zou, W. The evolution and a temporal-spatial difference analysis of green development in China. Sustain. Cities Soc. 2018, 41, 52–61. [Google Scholar] [CrossRef]
  6. Wang, M.X.; Zhao, H.H.; Cui, J.X.; Fan, D.; Lv, B.; Wang, G.; Li, Z.H.; Zhou, G.J. Evaluating green development level of nine cities within the Pearl River Delta, China. J. Clean. Prod. 2018, 174, 315–323. [Google Scholar] [CrossRef]
  7. Ye, T.F.; Xiang, X.L.; Ge, X.Y.; Yang, K.L. Research on Green Finance and Green Development Based Eco-Efficiency and Spatial Econometric Analysis. Sustainability 2022, 14, 2825. [Google Scholar] [CrossRef]
  8. Zeng, T.; Wu, Z.L. Research progress and analysis of international green development. Environ. Sustain. Dev. 2020, 45, 5–15. [Google Scholar]
  9. Li, Z.R.; Zheng, K.H.; Zhong, Q.K. Comprehensive Evaluation and Spatial-Temporal Pattern of Green Development in Hunan Province, China. Sustainability 2022, 14, 6819. [Google Scholar] [CrossRef]
  10. Zhang, X.; Wei, F.L.; Yuan, X.M. Evaluation and evolution of provincial high-quality green development in China. Econ. Geogr. 2020, 40, 108–116. [Google Scholar]
  11. Pearce, D.; Markandya, A.; Barbier, E. Blueprint for a Green Economy; Earthscan: London, UK, 1989. [Google Scholar]
  12. Zhu, B.Z.; Zhang, M.F.; Zhou, Y.H.; Wang, P.; Sheng, J.C.; He, K.J.; Wei, Y.M.; Xie, R. Exploring the effect of industrial structure adjustment on interprovincial green development efficiency in China: A novel integrated approach. Energy Policy 2019, 134, 110946. [Google Scholar] [CrossRef]
  13. Fan, W.G.; Zhang, P.Y.; Tong, L.J.; Li, C.G.; Li, X.; Li, J.; Ma, Z.P. Green Development for Supporting Sustainability of Northeast China: Performance Quantification, Spatio-temporal Dynamics and Implications. Chin. Geogr. Sci. 2022, 32, 467–479. [Google Scholar] [CrossRef]
  14. Li, L.; Lei, Y.L.; Pan, D.Y.; Si, C.Y. Research on Sustainable Development of Resource-Based Cities Based on the DEA Approach: A Case Study of Jiaozuo, China. Math. Probl. Eng. 2016, 2016, 5024837. [Google Scholar] [CrossRef] [Green Version]
  15. Halkos, G.; Tzeremes, N.; Kourtzidis, S. Measuring Sustainability Efficiency Using a Two-Stage Data Envelopment Analysis Approach. J. Ind. Ecol. 2016, 20, 1159–1175. [Google Scholar] [CrossRef]
  16. Li, G.; Zhou, Y.; Liu, F.; Wang, T. Regional Differences of Manufacturing Green Development Efficiency Considering Undesirable Outputs in the Yangtze River Economic Belt Based on Super-SBM and WSR System Methodology. Front. Environ. Sci. 2021, 8, 631911. [Google Scholar] [CrossRef]
  17. Zhou, L.; Che, L.; Zhou, C.H. Spatio-temporal evolution and influencing factors of urban green development efficiency in China. Acta Geogr. Sin. 2019, 74, 2027–2044. [Google Scholar] [CrossRef]
  18. Li, Y.; Chen, Y.Y.; Li, Q. Assessment analysis of green development level based on S-type cloud model of Beijing-Tianjin-Hebei, China. Renew. Sustain. Energy Rev. 2020, 133, 110245. [Google Scholar] [CrossRef]
  19. Huang, M.X.; Li, S.Y. The analysis of the impact of the Belt and Road initiative on the green development of participating countries. Sci. Total Environ. 2020, 722, 137869. [Google Scholar] [CrossRef]
  20. Li, C.; Song, L.R. Regional Differences and Spatial Convergence of Green Development in China. Sustainability 2022, 14, 8511. [Google Scholar] [CrossRef]
  21. Zhang, Z.Y.; Hu, Z.N.; Zhong, F.L.; Cheng, Q.P.; Wu, M.Z. Spatio-Temporal Evolution and Influencing Factors of High Quality Development in the Yunnan & Guizhou, Region Based on the Perspective of a Beautiful China and SDGs. Land 2022, 11, 821. [Google Scholar]
  22. Qiu, F.D.; Chen, Y.; Tan, J.T.; Liu, J.B.; Zheng, Z.Y.; Zhang, X.L. Spatial-temporal Heterogeneity of Green Development Efficiency and Its Influencing Factors in Growing Metropolitan Area: A Case Study for the Xuzhou Metropolitan Area. Chin. Geogr. Sci. 2020, 30, 352–365. [Google Scholar] [CrossRef]
  23. Zhuo, C.F.; Xie, Y.P.; Mao, Y.H.; Chen, P.Q.; Li, Y.Q. Can cross-regional environmental protection promote urban green development: Zero-sum game or win-win choice? Energy Econ. 2022, 106, 105803. [Google Scholar] [CrossRef]
  24. Yang, L.S.; Ni, M.Y. Is financial development beneficial to improve the efficiency of green development? Evidence from the “Belt and Road” countries. Energy Econ. 2022, 105, 105734. [Google Scholar] [CrossRef]
  25. Qian, Z.M.; Liu, X.C. Regional differences in China’s green economic efficiency and their determinants. China Popul. Resour. Environ. 2013, 23, 104–109. [Google Scholar]
  26. Rui, Q.; Feng, D.; Long, A.T. Evaluation of green development level in the Yellow River Basin and analysis of obstacle factors. Stat. Decis. 2021, 37, 72–76. [Google Scholar]
  27. Feng, C.; Wang, M.; Liu, G.C.; Huang, J.B. Green development performance and its influencing factors: A global perspective. J. Clean. Prod. 2017, 144, 323–333. [Google Scholar] [CrossRef]
  28. Liu, N. Research on Xi Jinping’s important exposition on green lifestyle. J. Nanjing Univ. Technol. (Soc. Sci. Ed.) 2021, 20, 40–48. [Google Scholar]
  29. Zhang, H.; Geng, Z.R.; Yin, R.S.; Zhang, W. Regional differences and convergence tendency of green development competitiveness in China. J. Clean. Prod. 2020, 254, 119922. [Google Scholar] [CrossRef]
  30. Shu, C.; Zhu, P.Y.; Xu, B. Measurement of green development and its spatial differentiation in Jiangxi province. Econ. Geogr. 2021, 41, 180–186. [Google Scholar]
  31. Guo, F.Y.; Lv, X.; Yu, W.; Ren, J.M.; Chu, N.C. Performance evaluation and driving mechanism of green development in shandong province based on panel data of 17 cities. Geogr. Sci. 2020, 40, 200–210. [Google Scholar]
  32. Jiang, S.G.; Yu, H.L.; Li, Z.H.; Geng, B.; Li, T. Study on the Evolution of the Spatial-Temporal Pattern and the Influencing Mechanism of the Green Development Level of the Shandong Peninsula Urban Agglomeration. Sustainability 2022, 14, 9549. [Google Scholar] [CrossRef]
  33. Fang, G.C.; Wang, Q.L.; Tian, L.X. Green development of Yangtze River Delta in China under Population-Resources-Environment-Development-Satisfaction perspective. Sci. Total Environ. 2020, 727, 138710. [Google Scholar] [CrossRef]
  34. Liu, H.J.; Wang, Y.H.; Lei, M.Y. Spatial agglomeration of strategic emerging industries in China. Quant. Tech. Econ. Res. 2019, 36, 99–116. [Google Scholar]
  35. Wang, Z.B.; Liang, L.W.; Wang, X.J. Spatio-temporal evolution patterns and influencing factors of PM2.5 in Chinese urban agglomerations. Acta Geogr. Sin. 2019, 74, 2614–2630. [Google Scholar]
  36. Sun, X.L.; Yan, D.S. Measurement and decomposition of spatial spillover effects of economic growth in the yangtze river delta. Econ. Geogr. 2021, 41, 66–73. [Google Scholar]
  37. Zhang, S.Y. The construction of green development and green lifestyle. Shandong Soc. Sci. 2018, 3, 18–24. [Google Scholar]
  38. Lu, C.Y.; Cheng, W.; Huang, P.; Liu, X.W.; Tang, X.L. Spatio-temporal comprehensive measurement of China’s industrial green development level and associated influencing factors. Ecol. Econ. 2022, 38, 54–61+69. [Google Scholar]
  39. Xiong, X.; Zhang, T.; Duan, Y.J.; Fang, X.P.; Zhou, J.Y. Measurement and comparison of the level of the green development about urban agglomeration in the middle reaches of the Yangtze River. Econ. Geogr. 2019, 39, 96–102. [Google Scholar]
  40. Che, L.; Bai, Y.P.; Zhou, L.; Wang, F.; Ji, X.P.; Qiao, F.W. Spatial pattern and spillover effects of green development efficiency in China. Sci. Geogr. Sin. 2018, 38, 1788–1798. [Google Scholar]
  41. LeSage, J.P.; Pace, R.K. Introduction to Spatial Econometrics; CRC Press: Boca Raton, FL, USA, 2009. [Google Scholar]
  42. Zhang, R.J.; Dang, H.Z. Measurement of the green development level of cities in the Yangtze River Economic Belt Structural analysis associated with space. Stat. Decis. 2022, 38, 118–123. [Google Scholar]
  43. Ren, B.P. The Yellow River Basin Ecological Protection and High-quality Development Innovation-driven Strategy and its realization path. Ningxia Soc. Sci. 2022, 3, 131–138. [Google Scholar]
  44. Shi, W.J.; Wu, Y.Y.; Sun, X.; Gu, X.Y.; Ji, R.; Li, M. Environmental Governance of Western Europe and Its Enlightenment to China: In Context to Rhine Basin and the Yangtze River Basin. Bull. Environ. Contam. Toxicol. 2021, 106, 819–824. [Google Scholar] [CrossRef]
  45. Guo, F.Y.; Gao, S.Q.; Tong, L.J.; Ren, J.M. Spatio-temporal evolution track and influencing factors of green development efficiency in Yellow River Basin. Geogr. Res. 2022, 41, 167–180. [Google Scholar]
  46. Ji, Y.Y.; Zhang, L.J.; Qin, Y.C.; Chen, J.L.; Wu, S.J. The impact of “four modernizations” on green development in Chinese prefecture-level cities: A spatial econometric analysis. Econ. Geogr. 2020, 40, 184–194. [Google Scholar]
  47. Salem, M.; Tsurusaki, N.; Divigalpitiya, P.; Osman, T.; Hamdy, O.; Kenawy, E. Assessing Progress Towards Sustainable Development in the Urban Periphery: A Case of Greater Cairo, Egypt. Int. J. Sustain. Dev. Plan. 2020, 15, 971–982. [Google Scholar] [CrossRef]
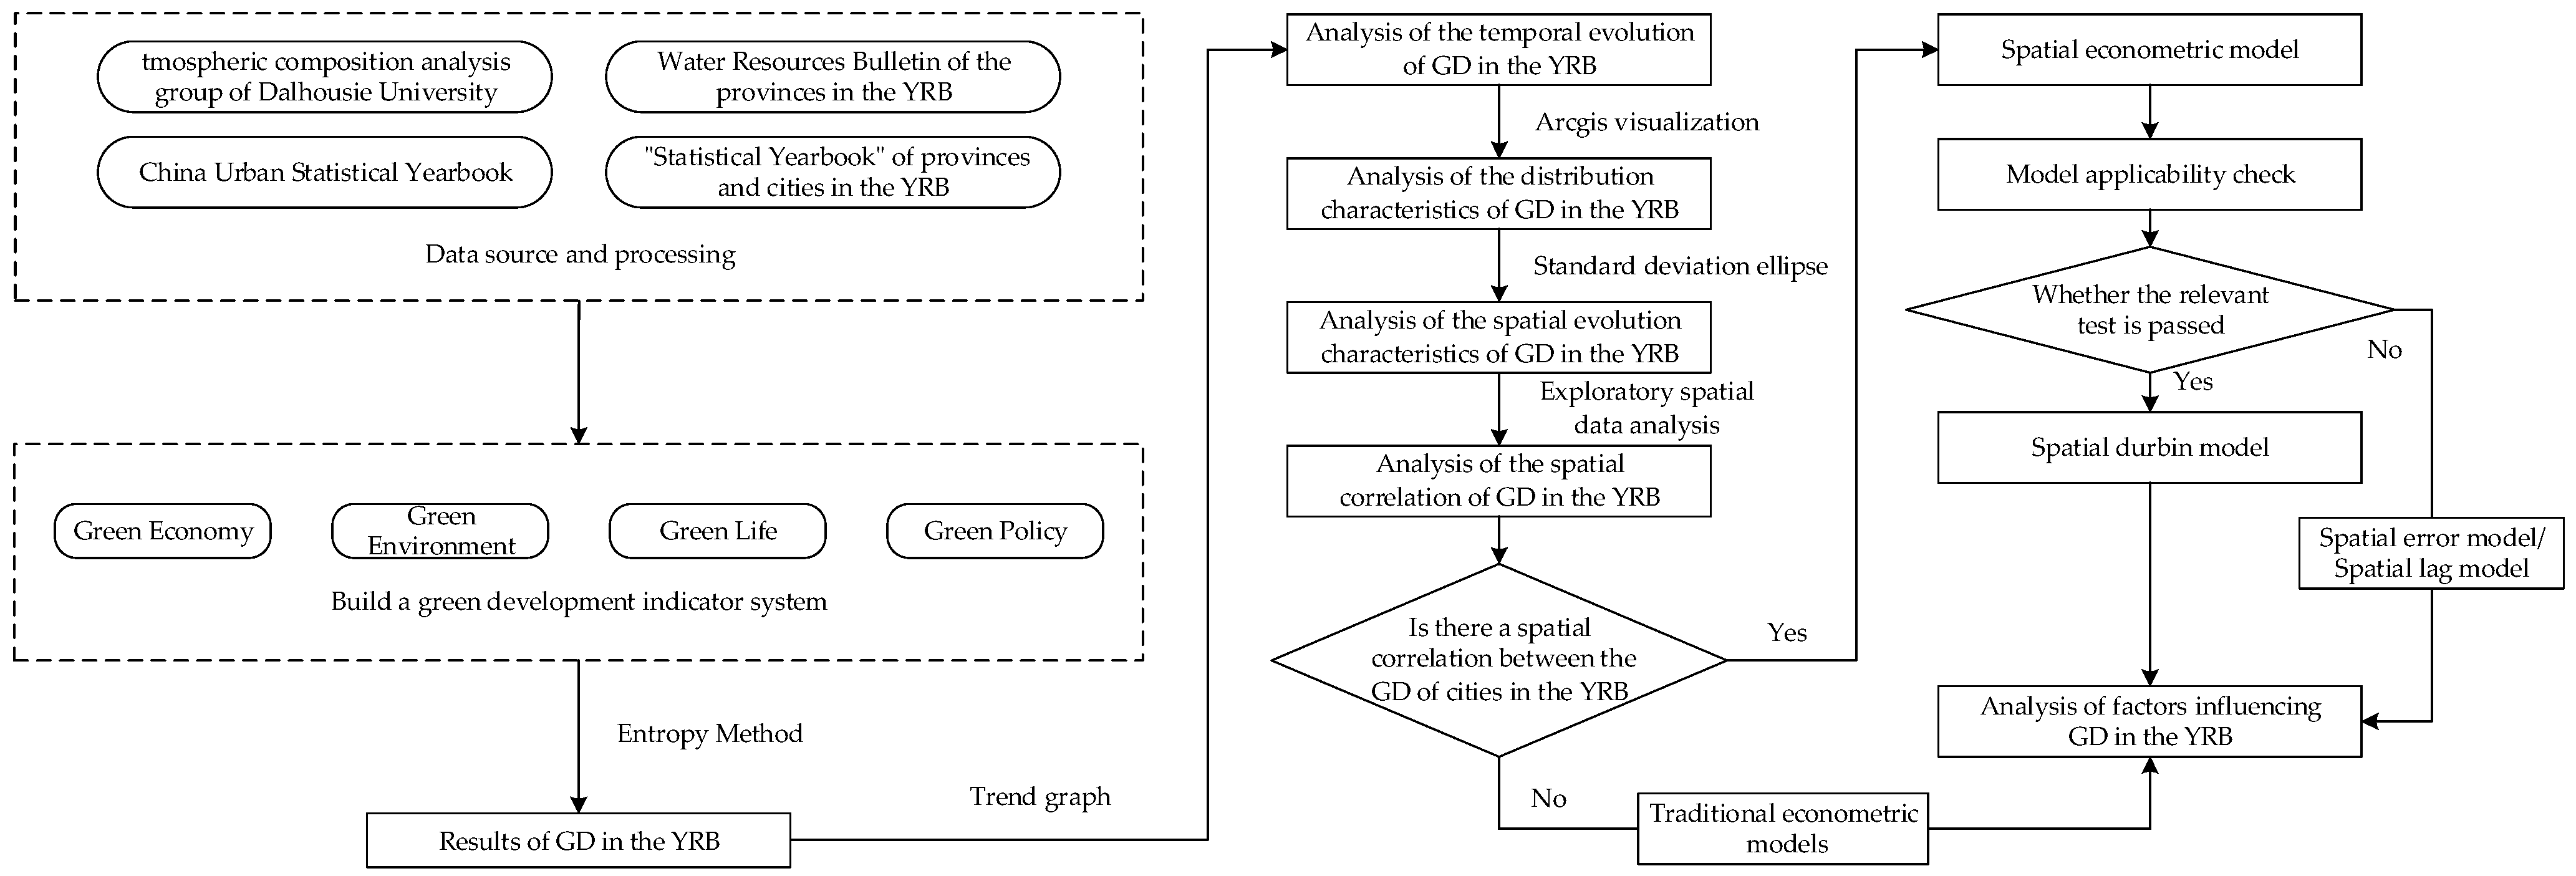
Figure 1. The flowchart of this research.
Sustainability 14 12407 g001
Figure 2. Location of the YRB in China.
Sustainability 14 12407 g002
Figure 3. The trends of changes in GD in the YRB.
Sustainability 14 12407 g003
Figure 4. Trend of the evolution of each subsystem of GD in the YRB.
Sustainability 14 12407 g004
Figure 5. Spatial distribution patterns of GD levels in the YRB.
Sustainability 14 12407 g005
Figure 6. Standard deviation ellipse of the GD in the YRB.
Sustainability 14 12407 g006
Figure 7. Types of agglomerations of GD in the YRB.
Sustainability 14 12407 g007
Table 1. Evaluation index system for GD in the YRB.
Criterion
Layer
Indicator
Layer
Indicator
Description
Indicator
Direction
WeightsSource of
Indicator
Green
Economy
Material living standardPer capita disposable income (yuan)+0.0543[29]
Service levelThe tertiary industry’s share of GDP (%)+0.0176[30]
Resource and environment utilization
efficiency
SO2 emissions per unit of GDP
(t/10,000 yuan)
+0.0014[31]
Economic vitalityTotal retail sales of social consumer goods per capita (yuan/person)+0.0877[31]
Green output Wastewater discharge per unit of GDP (t/10,000 yuan)-0.0015[32]
Green
Environment
Resource abundanceWater resources per capita
(m3/person)
+0.2071[30]
Urban ecological construction levelGreen coverage rate of built-up area (%)+0.0104[32]
Urban living
environment
Landscape area (hectares)+0.1358[30]
Air qualityPM2.5 (µg/m3)-0.0243[29]
Environmental pressureSO2 emissions per capita
(ton/person)
-0.0018[30]
Green
Life
Population densityTotal population/administrative area at the end of the year
(person/km2)
-0.0061[33]
Social water supply security capacityWater supply per capita
(ton/person)
+0.0652[31]
Green travelNumber of public transport vehicles per 10,000 people in the city (vehicles)+0.0711[30]
Residential energy consumptionElectricity consumption per capita in the whole society
(KW·h/person)
-0.0018[30]
City public serviceUrban road area per capita
(m2/person)
+0.0713[30]
Green
Policy
Industrial optimization and transformation effortsIndustrial advanced coefficient (%)+0.0588[31]
Green investmentScience and technology expenditure/general public budget expenditure (%)+0.1026[31]
Market environment supportPrivate economic development index (%)+0.0588[31]
Pollution controlCentralized treatment rate of sewage treatment plants (%)+0.0115[32]
Urban governanceHarmless municipal waste treatment rate (%)+0.0105[32]
Table 2. Parameters related to the standard deviation ellipse of the GD in the YRB.
YearGeographic
Coordinates
X-Axis Standard
Deviation (km)
Y-Axis Standard
Deviation (km)
Rotation
(°)
2005111.38° E, 36.59° N893.18429.9098.80
2010111.55° E, 36.55° N865.31432.3897.84
2014111.58° E, 36.60° N857.52427.0198.42
2019111.59° E, 36.54° N864.54426.1797.97
Table 3. Results of the Global Moran Index of the GD in the YRB from 2006 to 2019.
YearIZYearIZYearIZ
20060.036 ***1.29820110.042 ***2.82820160.045 ***2.739
20070.036 ***1.39020120.048 ***2.07920170.048 ***2.867
20080.042 ***1.91120130.056 ***2.80020180.044 ***3.024
20090.032 ***1.98920140.045 ***3.12920190.048 ***2.443
20100.039 ***2.09920150.036 ***
Note: *** is significant at the 1% level.
Table 4. Influencing factors and their descriptions.
Variable
Full Name
Variable
Abbreviation
Variable Description
Economic
development
EDReal GDP/total population at the end of the year (yuan), take the logarithm
Government
regulation
GRGeneral public budget expenditure/GDP
UrbanizationUrbPermanent urban population/year-end permanent population
Industrial
structure
ISThe added value of the secondary industry as a percentage of GDP
Science and
Technology
S&TTechnology, education spending/general public budget spending
Opening up to the outside worldOpenActual utilization of foreign capital/total population at the end of the year (USD), take the logarithm
Table 5. Model suitability check.
Testing MethodStatisticsTesting MethodStatistics
LM error32.725 ***Wald–spatial error21.41 ***
Robust LM error43.843 ***Wald–spatial lag23.18 ***
LM lag26.579 ***LR–spatial lag22.93 ***
Robust LM lag37.697 ***LR–spatial error31.59 ***
Note: *** is significant at the 1% level.
Table 6. Regression results and effect decomposition of the SDM model.
VariableEstimated
Coefficients
Spatial Lag
Term Coefficient
Direct Effect
Coefficient
Indirect Effect
Coefficient
Total Effect
Coefficient
ED0.0537 ***−0.0403 **0.0534 ***−0.02580.0277
(12.7900)(−2.5639)(12.7400)(−0.7189)(0.7679)
GR−0.0263−0.1315−0.0350−0.3666−0.4016
(−0.5060)(−0.6203)(−0.7670)(−0.6897)(−0.7512)
Urb0.00470.1634 **0.01020.4206 **0.4308 **
(0.3390)(2.1368)(0.6785)(2.4264)(2.4363)
IS−0.0181 **0.0177−0.0172 *0.0157−0.0015
(−2.0778)(0.4044)(−1.7987)(0.1448)(−0.0133)
S&T0.0359 ***0.07710.0362 **0.2399 *0.2761 **
(2.6684)(1.5183)(2.3464)(1.7769)(2.0460)
Open0.0015 ***−0.00280.0015 ***−0.0043−0.0028
(3.2916)(−1.3445)(3.4210)(−0.7759)(−0.5031)
ρ0.5885 ***
(7.3597)
R-squared0.5710.5710.5710.5710.571
Note: ***, **, and * are significant at the 1%, 5%, and 10% levels, respectively, and the z value is in parentheses.
Publisher’s Note: MDPI stays neutral with regard to jurisdictional claims in published maps and institutional affiliations.