Article

Determination of Surfactant Content for Optimum Strength of Multi-Walled Carbon Nanotube Cementitious Composites

by
Mohd O. Mohsen
1,2,*,
Mu’tasim Abdel-Jaber
3,4,
Nasser A. Al-Nuaimi
1,
Ahmed Senouci
5 and
Ramzi A. Taha
6
1
Department of Civil and Architectural Engineering, Qatar University, Doha P.O. Box 2713, Qatar
2
Tajarub for Research and Development, Doha P.O. Box 12627, Qatar
3
Department of Civil Engineering, Al-Ahliyya Amman University, Amman 19328, Jordan
4
Department of Civil Engineering, The University of Jordan, Amman 11942, Jordan
5
Department of Construction Management, University of Houston, Houston, TX 77204-4020, USA
6
Engineering Program, Schreiner University, Kerrville, TX 78028, USA
*
Author to whom correspondence should be addressed.
Sustainability 2022, 14(19), 12433; https://doi.org/10.3390/su141912433
Submission received: 8 September 2022 / Revised: 22 September 2022 / Accepted: 26 September 2022 / Published: 29 September 2022

Abstract

:
This paper proposes a method for the determination of the optimum surfactant amount to achieve the highest strength for carbon nanotubes (CNT) cementitious composites. The method is based on combining the results of a chemical and a mechanical test. The chemical test was used to determine the remaining amount of surfactant after sonication by analyzing solutions containing CNTs, polycarboxylate surfactant, and water. On the other hand, the mechanical test was used to determine the optimum polycarboxylate surfactant amount that achieved the composite’s highest strength by conducting flexural and compressive tests on cement paste specimens prepared using various surfactant concentrations (i.e., 0.03%, 0.08%, 0.12%, 0.15%, 0.32%, and 0.60%). The results show a strong relationship between the paste’s strength and the surfactant’s concentration. The mixes prepared using 0.08% surfactant-to-cement weight fraction achieved the highest flexural and compressive strengths. Increasing the surfactant-to-cement weight fraction beyond 0.08% resulted in a reduction in the flexural and compressive strengths. This shows the importance of the proposed method in determining the remaining amount of free surfactant in the solution after sonication, and in preventing overdosing that will adversely affect the flexural and compressive strengths of CNT–cement composites.

1. Introduction

Chemical surfactants are liquid polymers used to disperse carbon nanotubes (CNTs) in a solution [1]. They provide non-covalent bonds that reduce the solution surface tension and keep the CNTs suspended and unbundled after being dispersed using an ultrasonic mixer. Previous studies reported that the surfactant included in the dispersion process had a major impact on the mechanical properties of CNT–cement mixtures [2]. Because of their incompatibility with the cement, many surfactants may prevent or retard hydration, entrap air in the paste, or endure reactions with the water-reducing admixtures causing nano-filaments’ re-agglomeration [3,4]. Few surfactant types were successful in dispersing CNTs within the aqueous solutions and preserving the cement matrix properties [5,6]. Inam et al. [7] used sodium dodecyl sulfate and Gum Arabic powder as surfactants to disperse CNTs. They reported that the mixture of SDS and GA produced better dispersion as compared to SDS and GA alone, while the strength was slightly affected in most CNT cementitious batches even with the addition of stabilizers, and antifoaming and water-reducing agents. Similarly, the experimental results of Sindu and Sasnal [8] highlighted the effect of the surfactant type (five different types) on the quality of CNTs’ dispersion with various CNT dosages. Among the selected surfactants, Gum Arabic (GA) showed a harmonious positive effect on the various mechanical properties of the cement composite. On the other hand, Xu et al. [9] analyzed the factors influencing the dispersion and stability of nanomaterials in water under various ultrasonic parameters and dispersants. Three different types of CNTs and six types of surfactants were chosen. Sodium dodecyl benzene sulfonate (SDBS) was the best dispersant for CNTs’ inclusions as it added a functionalized group into the carbon structure, thereby improving its dispersion’s stability. Metaxa et al. [10] examined the methodology of multi-walled CNTs’ (MWCNTs) dispersion in white cement mortars using two types of surfactants (sodium dodecyl benzene sulfonate (SDBS) and commercial superplasticizer). The authors reported that the surfactants utilized in the study lowered the mechanical properties by an average of 60% due to their incompatibility with cement. However, the superplasticizer was found to be suitable for efficiently dispersion MWCNTs in a white cement mortar matrix. In a state of art work, Collins et al. [11] reported that only three out of eight tested surfactant types were able to provide an acceptable dispersion level. Moreover, only one of these surfactants, polycarboxylate water-reducing admixture, was able to improve the matrix properties when combined with cement. Similarly, Al-Rub et al. and Tayson et al. [12,13] used a high-range polycarboxylate-based water-reducing admixture, which was also successful in dispersing the CNTs and preserving the matrix properties. The authors of this research conducted several experiments using a polycarboxylate surfactant to disperse CNTs of various weight fractions in cement paste and concrete [14,15,16,17,18,19]. The analysis of the results showed that the mechanical properties of the tested samples were not only affected by the CNTs’ weight fraction, but also other factors such as the free surfactant’s amount in the solution may have an impact on the matrix’s mechanical as well as rheological properties. Using a surfactant to CNTs ratio of 4:1 appeared to be suitable in terms of strength in some cases, such as having a CNT–cement weight fraction of 0.25% or more, while using a ratio of 3:1 appeared suitable in other cases where the CNT–cement weight fraction of 0.08% or less was used. This fact gave rise to the hypothesis that there is an optimum surfactant–CNTs weight fraction based on the CNTs amount used. This finding was clearly identified by Sobolkina et al. [20] in their study of CNTs’ dispersion influence on the mechanical properties of cement. The authors proposed that excessive surfactant particles may affect the overall matrix strength (Figure 1a). The hydrophobic heads of the surfactant are attached to the CNT body, while the hydrophilic radicals are directed towards the water. Surfactant overdosing occurs when the quantity added to the mix is larger than its consumption level, which represents the amount consumed during the CNTs’ dispersion process (Figure 1c). The surfactant’s overdosing lowers the matrix mechanical properties regardless of the CNTs’ dispersion quality. Therefore, it is important to avoid surfactant overdosing, which can be achieved by determining the optimum surfactant amount or consumption level needed for the dispersion of the CNTs.
To date, there is no systematic procedure to correctly determine the optimum surfactant amount or consumption level. The aim of this study is to develop a method for the determination of the optimum surfactant amount needed for CNTs’ dispersion. This is done by creating a formula to determine what is defined as the “effective surfactant” factor, using the results of physical, chemical, and mechanical tests (i.e., compressive, flexural, filtration, centrifugal sedimentation, and UV).

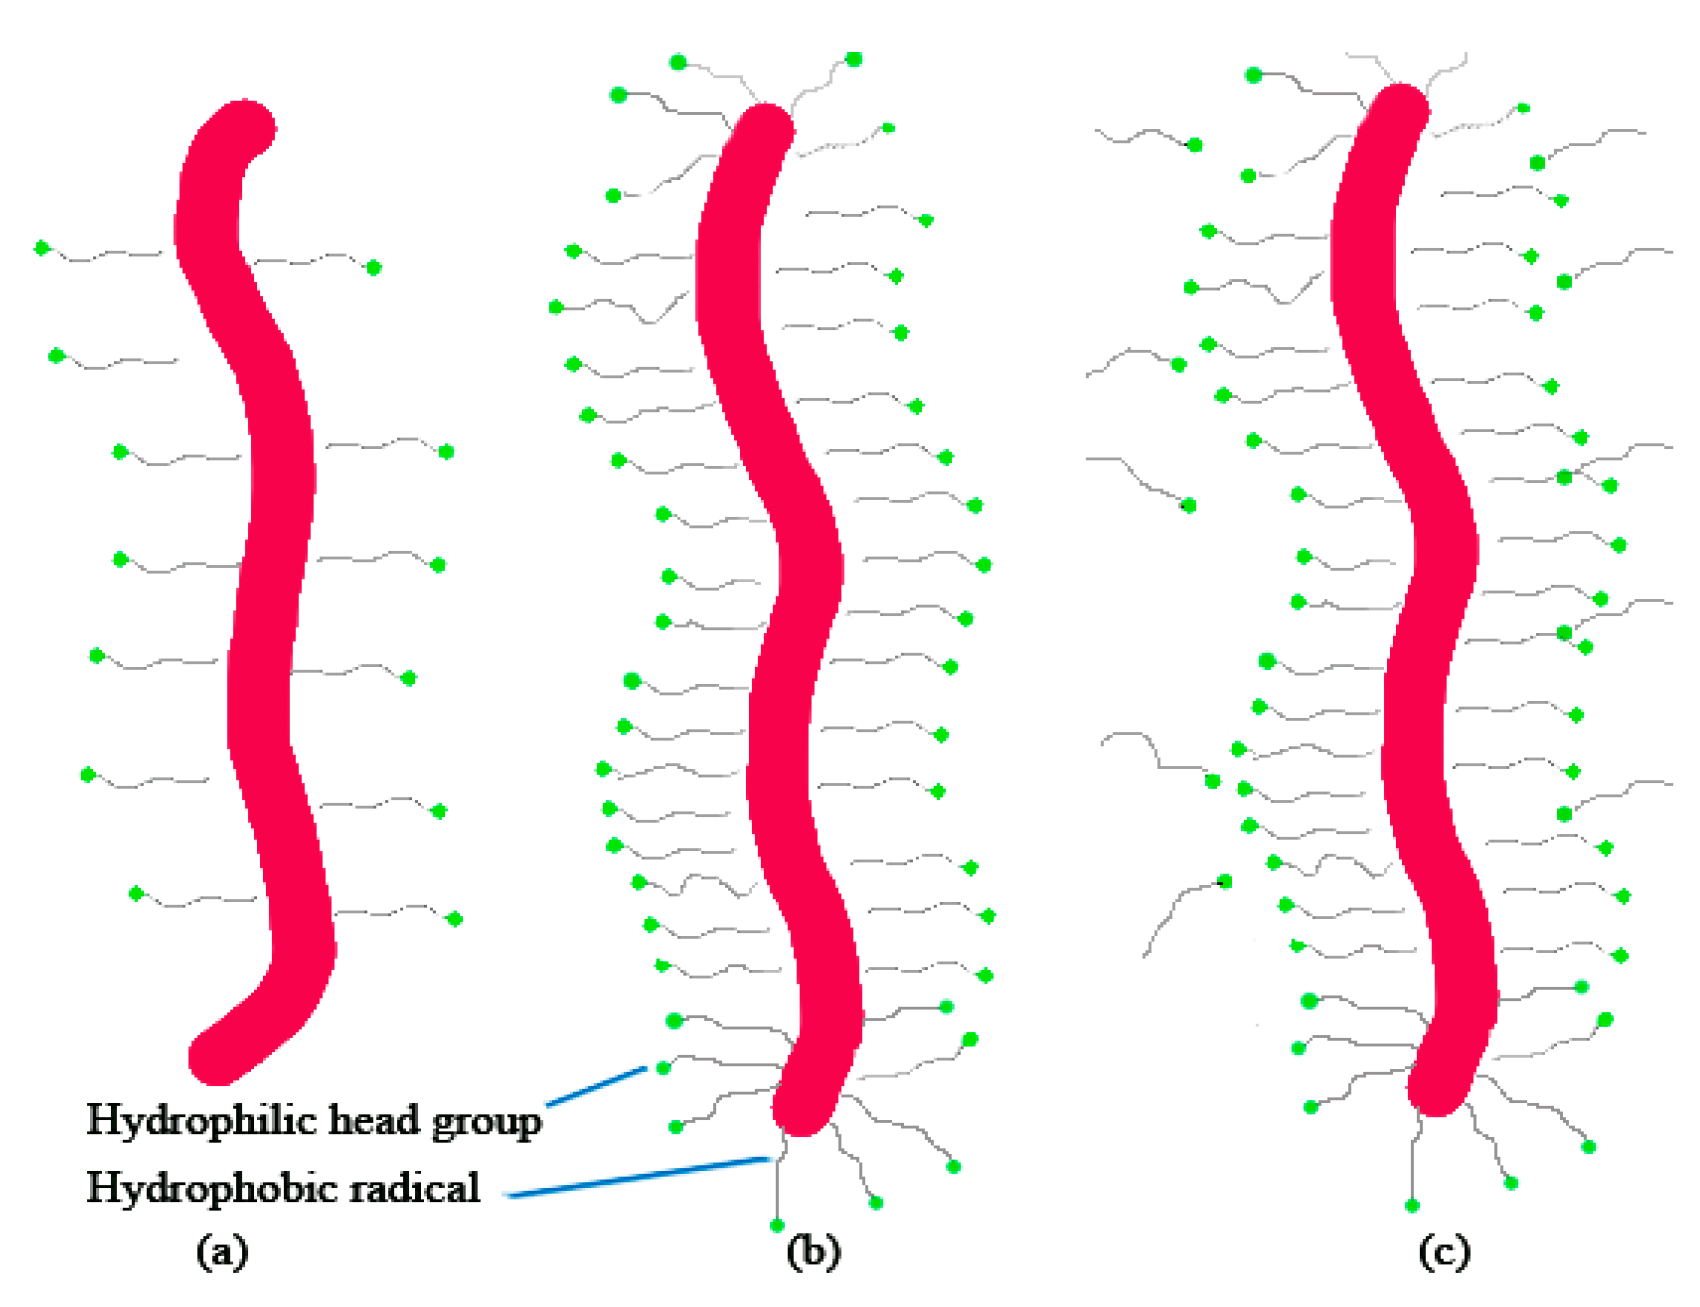
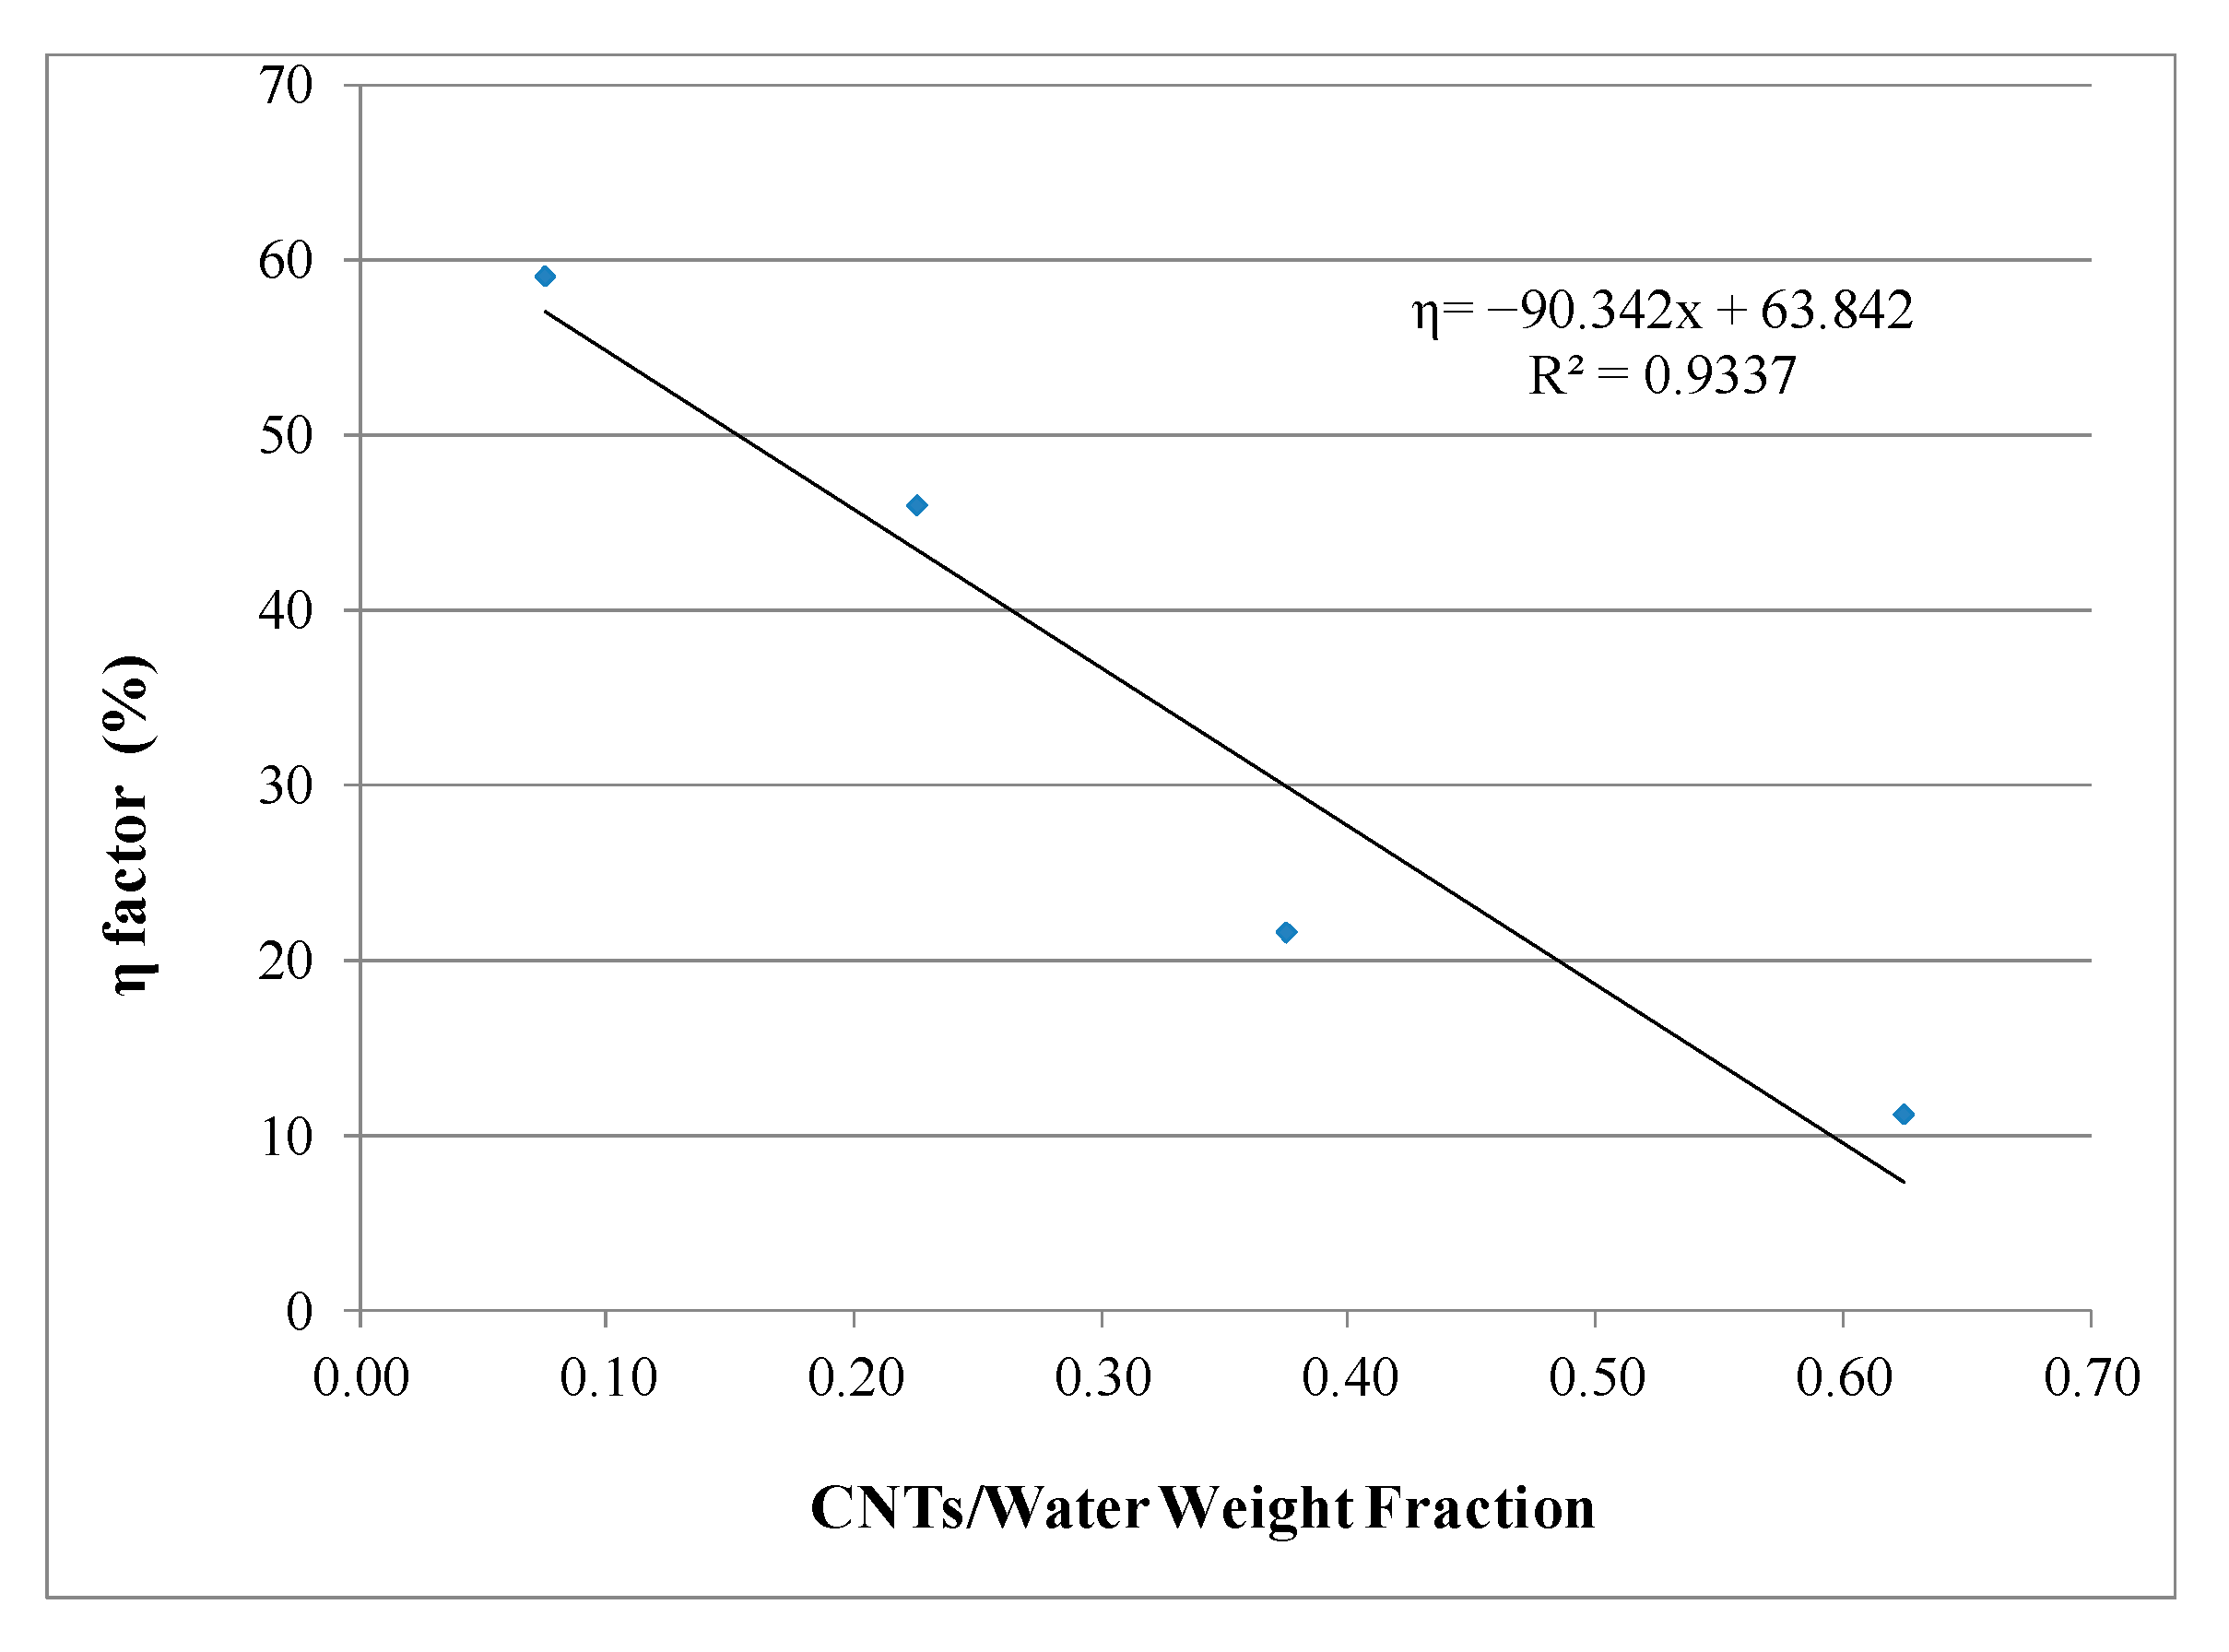
2. Effective Surfactant Factor

The mixing procedure of CNTs cementitious composites includes two major steps. The first one is the dispersion procedure, where the solution containing CNTs, surfactant, and water are sonicated using a specified amount of energy for a certain period of time. The second step consists of mixing the sonicated solution with cement and the preparation of the specimens. A portion of the initial surfactant amount is consumed during the dispersion process. Then, the remaining surfactant content is used during the mixing phase for the workability and hydration of the mix. Therefore, the remaining surfactant amount has a strong impact on the mechanical properties of the CNTs-reinforced cement mix. The remaining surfactant amount should be optimum to achieve the best mechanical properties for the mix. The effective surfactant factor, which represents the optimum surfactant amount needed for CNT dispersion, needs to provide an acceptable CNT dispersion in water solution in order to achieve the best composite mechanical properties. The effective surfactant factor, SUeff, can be estimated using the following equation:
SU eff = SU opt η
where SUopt = optimum surfactant amount that provides the best mix strength and η = percent surfactant reduction during the dispersion phase.
The factor η is computed using the following equation:
η = SU rem SU orig
where SUorig = initial surfactant amount and SUrem = remaining surfactant amount in the solution at the end of the dispersion phase. The remaining surfactant amount SUrem is determined using the Beer–Lambert Law of Absorbance, which states that “the absorbance of a solution is directly proportional to the concentration of their absorbing species and their path lengths” [21]. Consequently, UV/Vis spectroscopy could be implemented to measure the concentration of the absorber in a solution for a fixed path length. Thus, the surfactant concentration in the solution can be determined at selected stages during the dispersion and sonication processes. However, the surfactant concentration measurements cannot be directly determined due to the presence of CNTs, which affect the light absorbance. Thus, the surfactant concentration can be determined only if the CNTs are removed from the solution at selected stages. Figure 2 shows a schematic representation of the absorbance stages. The concentration obtained in stage 3 is assumed to be equivalent to SUrem. The Beer–Lambert Law defines the absorbance using the following equation:
A = C ε L
where A = absorbance, C = concentration of the absorbing species (mol L−1), ε = molar absorptivity or extinction coefficient (L mol−1 cm−1), and L = path length through the sample (cm).
The absorbance of the solution was measured for different surfactant concentrations and wave lengths. The generated data were used to construct calibration curves that represented the relationship between the absorbance and concentration values for various wave lengths. The surfactant absorbance and concentration values were calculated at each stage for the same wave length using the developed calibration curves.

3. Experimental Program

3.1. Materials and Equipment

Portland cement, CEM I 42.5 R, supplied by Qatar National Cement Company (QNCC) was used. It was stored in sealed polyethylene bags and kept in plastic containers to avoid any reaction with air moisture. The surfactant used was a polycarboxylate-based high-range water reducer/superplasticizer supplied by GRACE Concrete Products and termed commercially as ADVA575. The type of CNTs used in this study was multi-walled non-treated carbon nano tubes (MWCNTs) supplied by US Research Nanomaterial’s Inc. They had a high aspect ratio of about 1500. Table 1 summarizes the CNTs’ physical properties. The mechanical properties testing tools and equipment included a Hobart Mixer for blending the solution with cement; 40 mm × 40 mm × 160 mm steel molds for flexure specimens; 50 mm × 50 mm × 50 mm cube molds for compression specimens; and a testing machine supplied by Controls S.r.l. (Figure 3a). The chemical analysis tools and equipment included the following: an ultrasonic wave mixer for CNTs’ dispersion provided by VIBRA-CELL (Figure 3b), a bench top centrifuge device supplied by ROTOFIX (Figure 3c), a UV/Vis spectrophotometer supplied by HACH/LANGE (Figure 3d); and syringe filters (Nylon with 0.2 μm pore size and 25 mm diameter) supplied by SEOH.

3.2. Cement and Surfactant Mixing

The mixing procedure began with weighing cement, water, and surfactant quantities. The water and cement quantities used in each mix were 1000 gm and 2500, respectively (i.e., w/c =0.4). The surfactant was mixed as specified in Table 2 at a water temperature of 22 °C. The cement was combined with the surfactant aqueous solution during mixer operation at a low speed of 140 r/min for 30 s. The mixer was then stopped and operated again at a medium speed of 285 r/min for 60 s. The mix was placed into the molds and compacted as per ASTM C348 using 32 strokes. Finally, the specimens were de-molded after 24 h and placed for curing in a concentrated limewater bath.

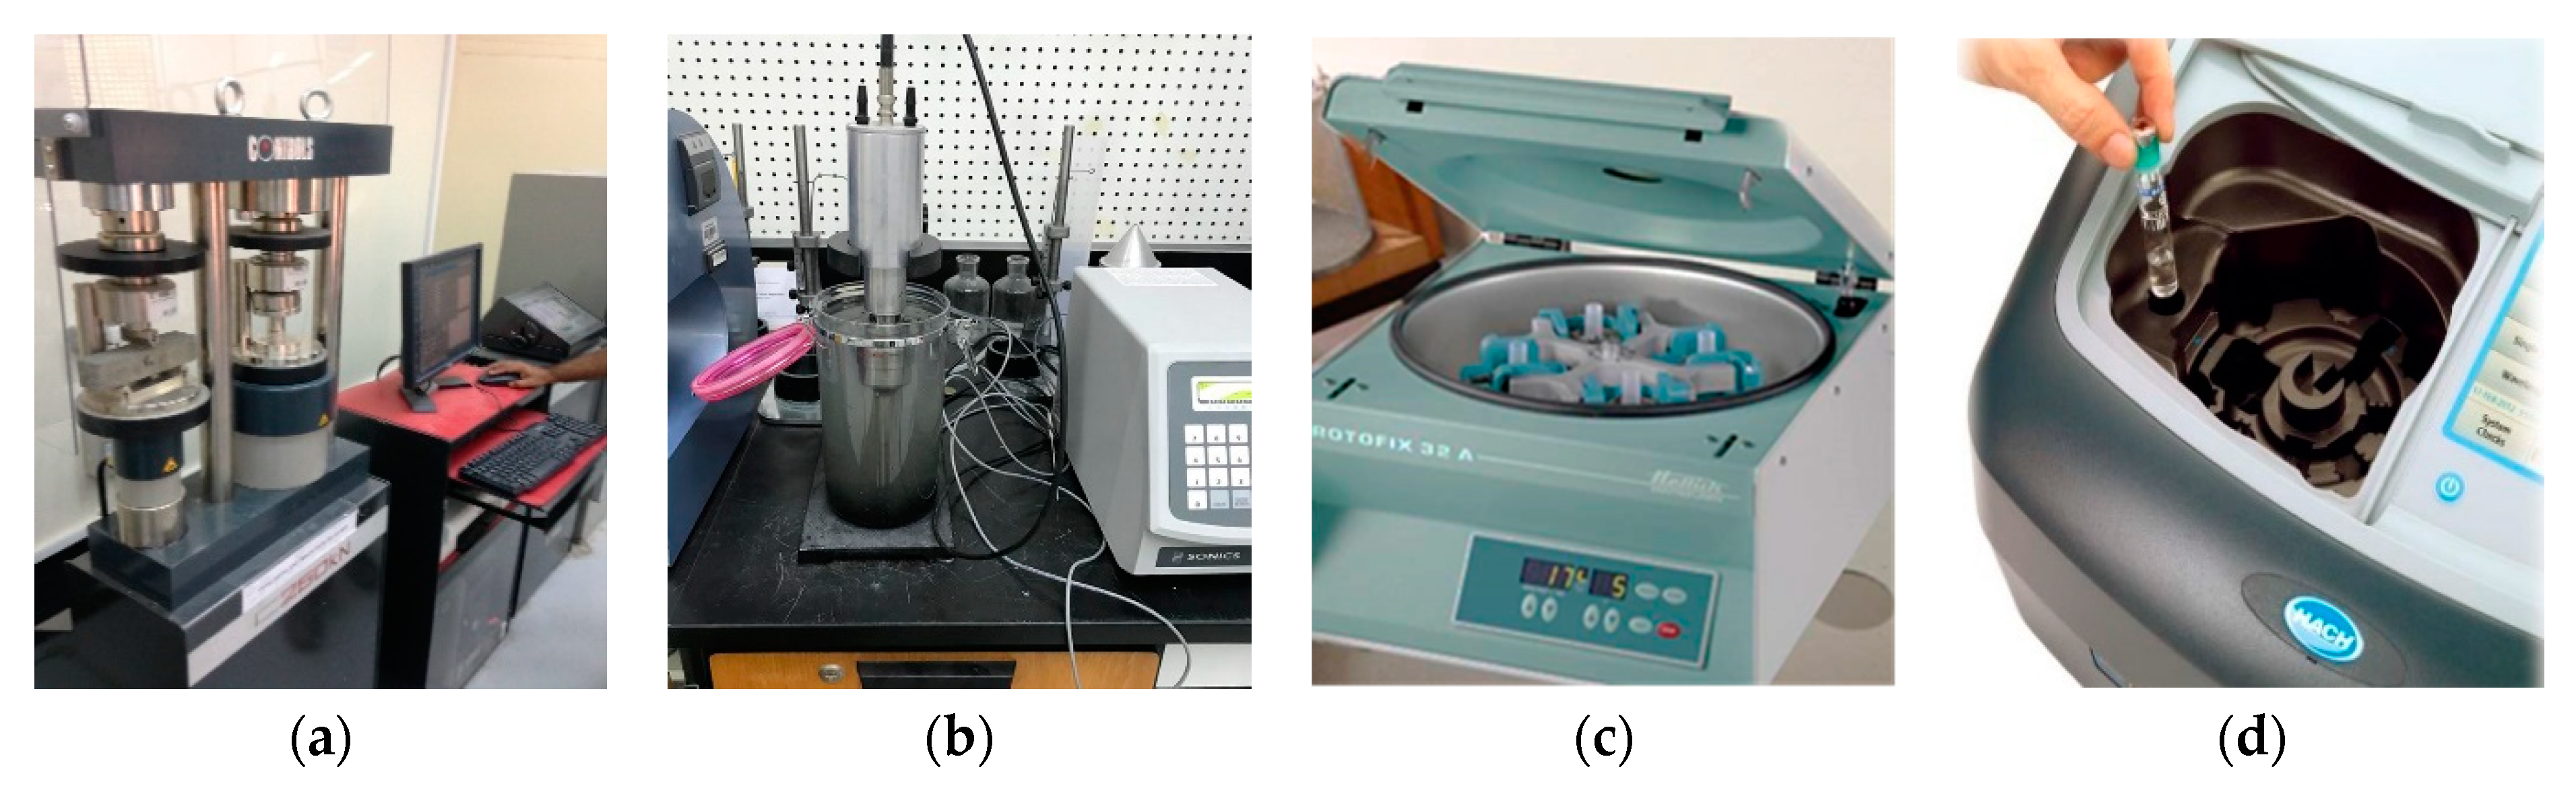
3.3. Mechanical Properties Testing

The mechanical properties of the cement paste were determined for several surfactant concentrations in order to determine the optimum surfactant concentration. The specimens were prepared and tested in compression and flexure. The strength results were used to plot the relationship between mix strength and surfactant concentration. Table 2 presents the mechanical properties testing matrix. The three-point bending tests of the specimens were conducted after 28 days of curing according to ASTM C348 [22]. The implemented loading rate was set at 41 N/second. The flexural strength was calculated using the following equation:
Fs = 0.0028 P
where Fs = flexural strength (MPa), and P = total maximum load (N).
The compression test was conducted according to ASTM C109 [23]. The compressive strength of the specimens was computed using the following equation:
Cs = P/A
where Cs = compressive strength (MPa), P = total maximum load (N), and A = loaded surface area (mm2).

3.4. Chemical Analysis

A chemical test was performed on solutions with various CNTs-to-cement weight fractions to measure the remaining surfactant amounts after the dispersion process. Table 3 summarizes the test data obtained for four solutions. The surfactant content was set equal to four times that of the CNT content based on the optimal CNT-to-surfactant weight fraction that was reported by Konsta-Gdoutos et al. [24]. The water amount was set equal to 1000 gm, which is equal to the one used for the mechanical properties testing. The CNTs’ content was selected based on the CNTs-to-cement weight fraction most commonly used in previous studies. The CNTs amounts used in this test were 0.03%, 0.08%, 0.15% and 0.25% of cement weight with a water/cement ratio of 0.4.

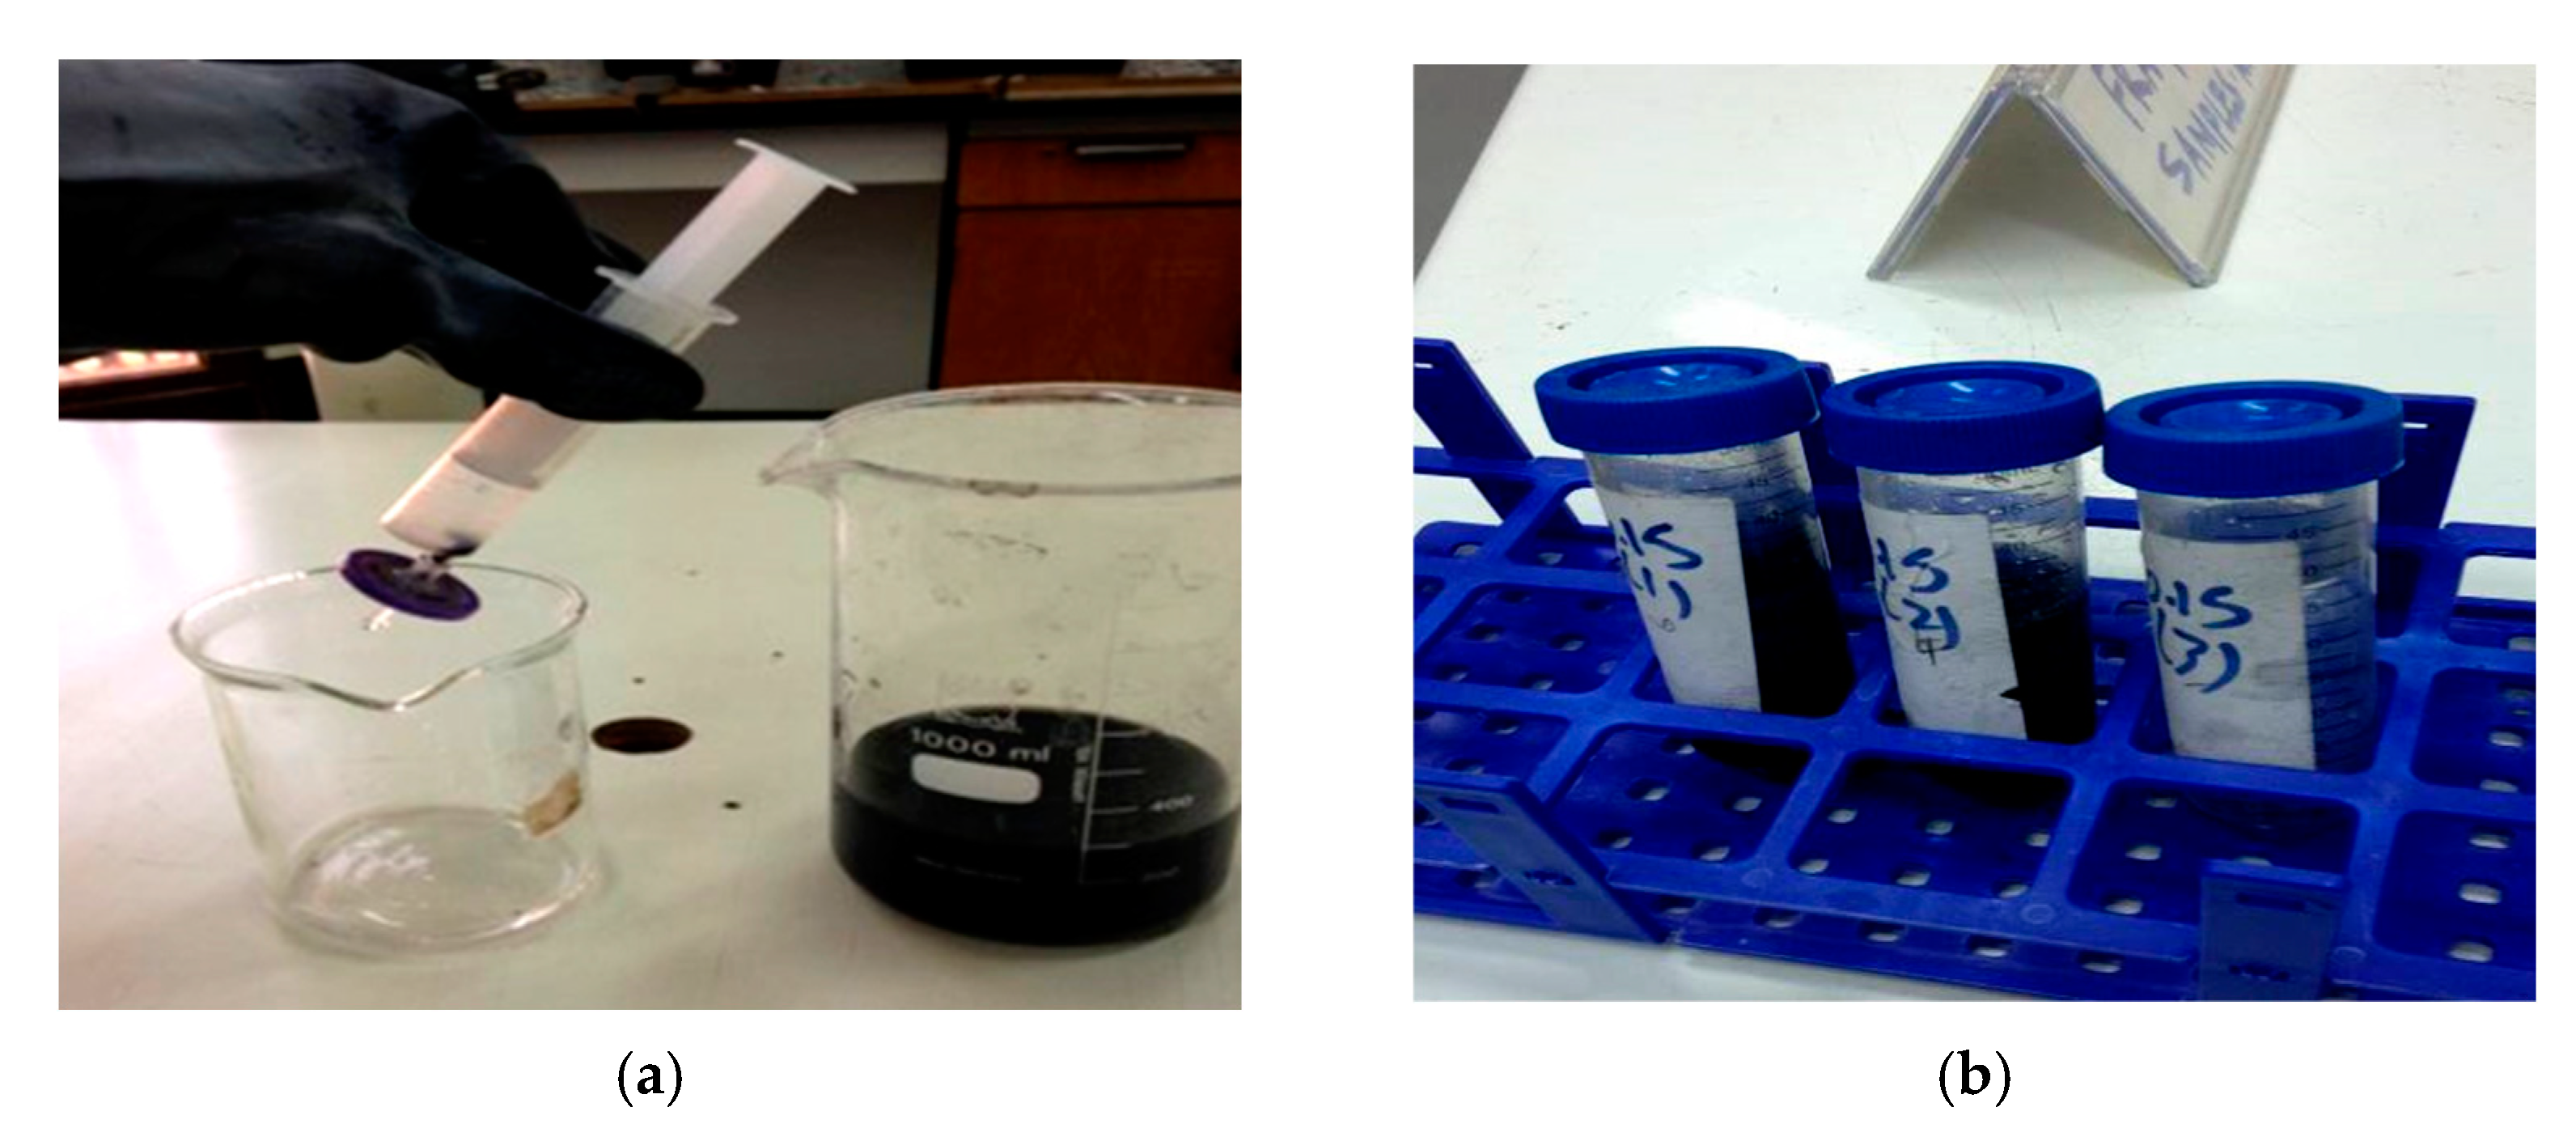
3.4.1. Sonication Process

The dispersion of the CNTs in water containing surfactant was accomplished using an ultrasonic wave mixer. The sonicator was operated for 30 min with an amplitude equal to 20% of the mixer’s permissible value in order to prevent breakage of the tubes. The water temperature was set equal to 23 °C at the start of the process. It is worth noting that the water temperature was kept less than 40 °C during the whole sonication process to minimize the possibility of water evaporation. The sonication device was programmed to stop whenever any of the input limits were reached.

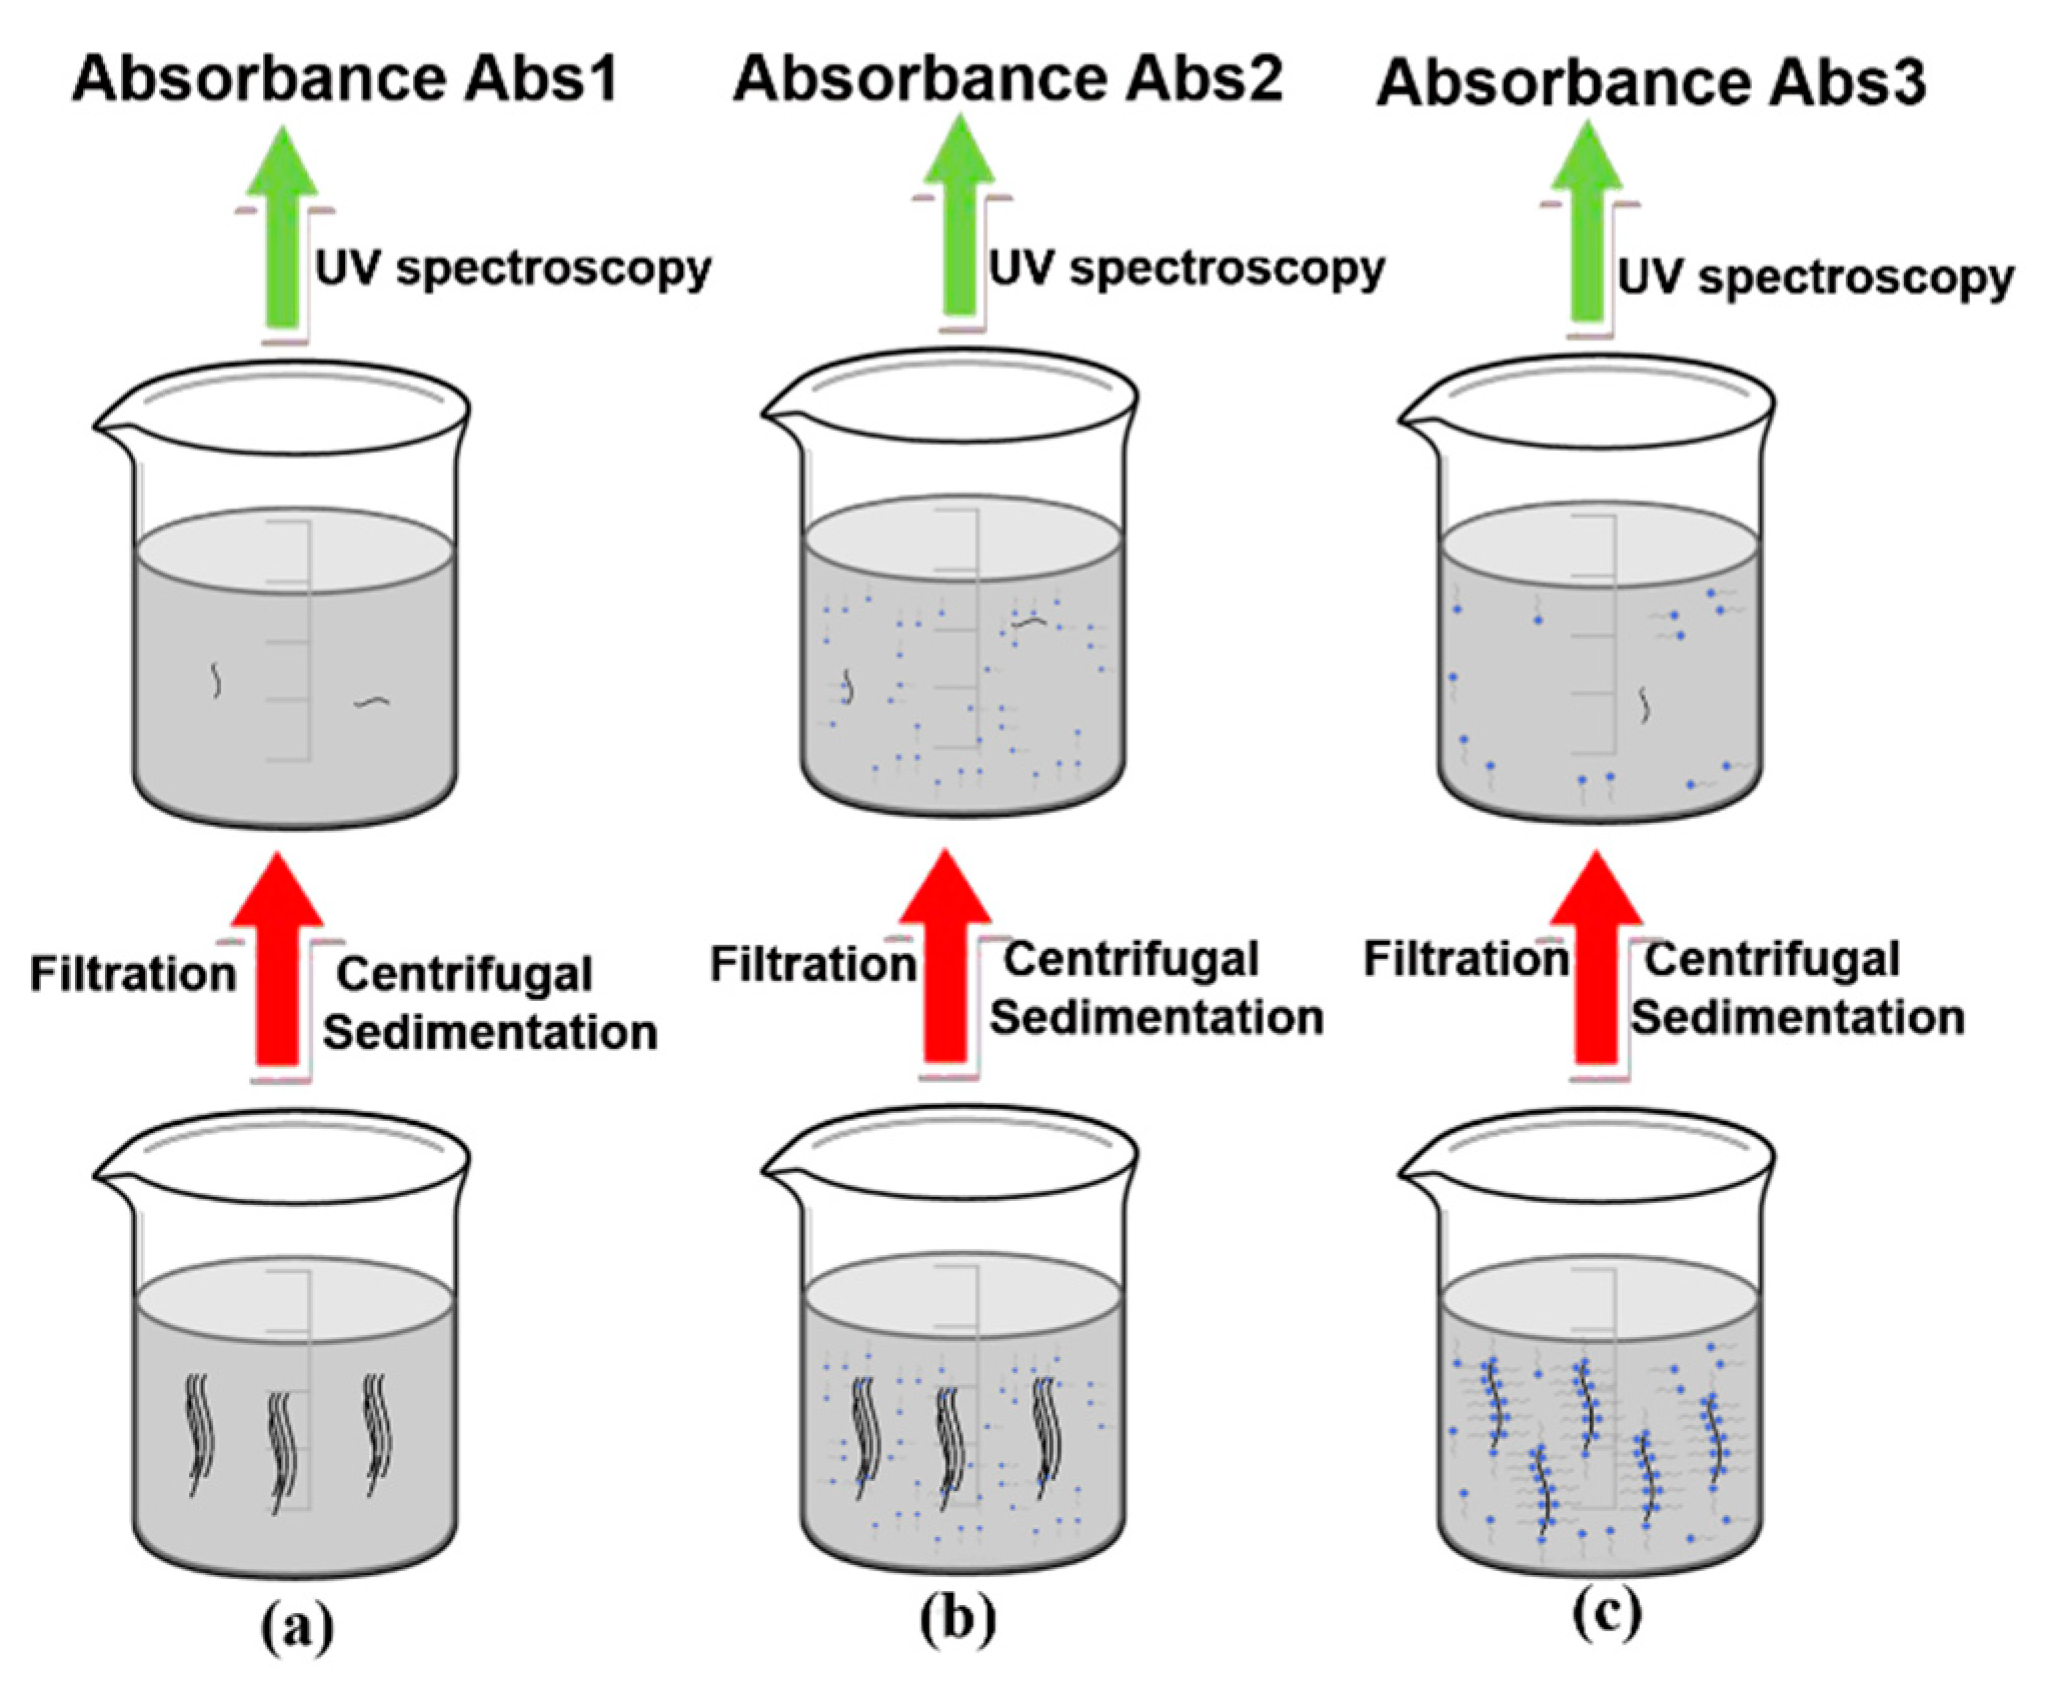
3.4.2. Filtration and Centrifugal Sedimentation Processes

Here, 50 mL samples were taken from each solution before and after adding the surfactant, then later after the sonication process. The CNTs and water samples were analyzed before adding the surfactant to estimate the remaining amount of CNTs in the solution after filtration. As shown in Figure 4a, the samples were filtered two times using syringe filters in order to remove the bulk of CNTs. It should be mentioned that the first filtration stage is a time-consuming task that took up to an hour due to the large amount of CNTs blocking the filter openings. Figure 4b shows a sample solution containing 0.15% CNTs before sonication, after sonication, and after filtration. After performing the filtration step, a centrifugal sedimentation treatment of the samples was carried out for 30 min at a speed of 2000 rpm to separate the remaining CNT particles from the solution.

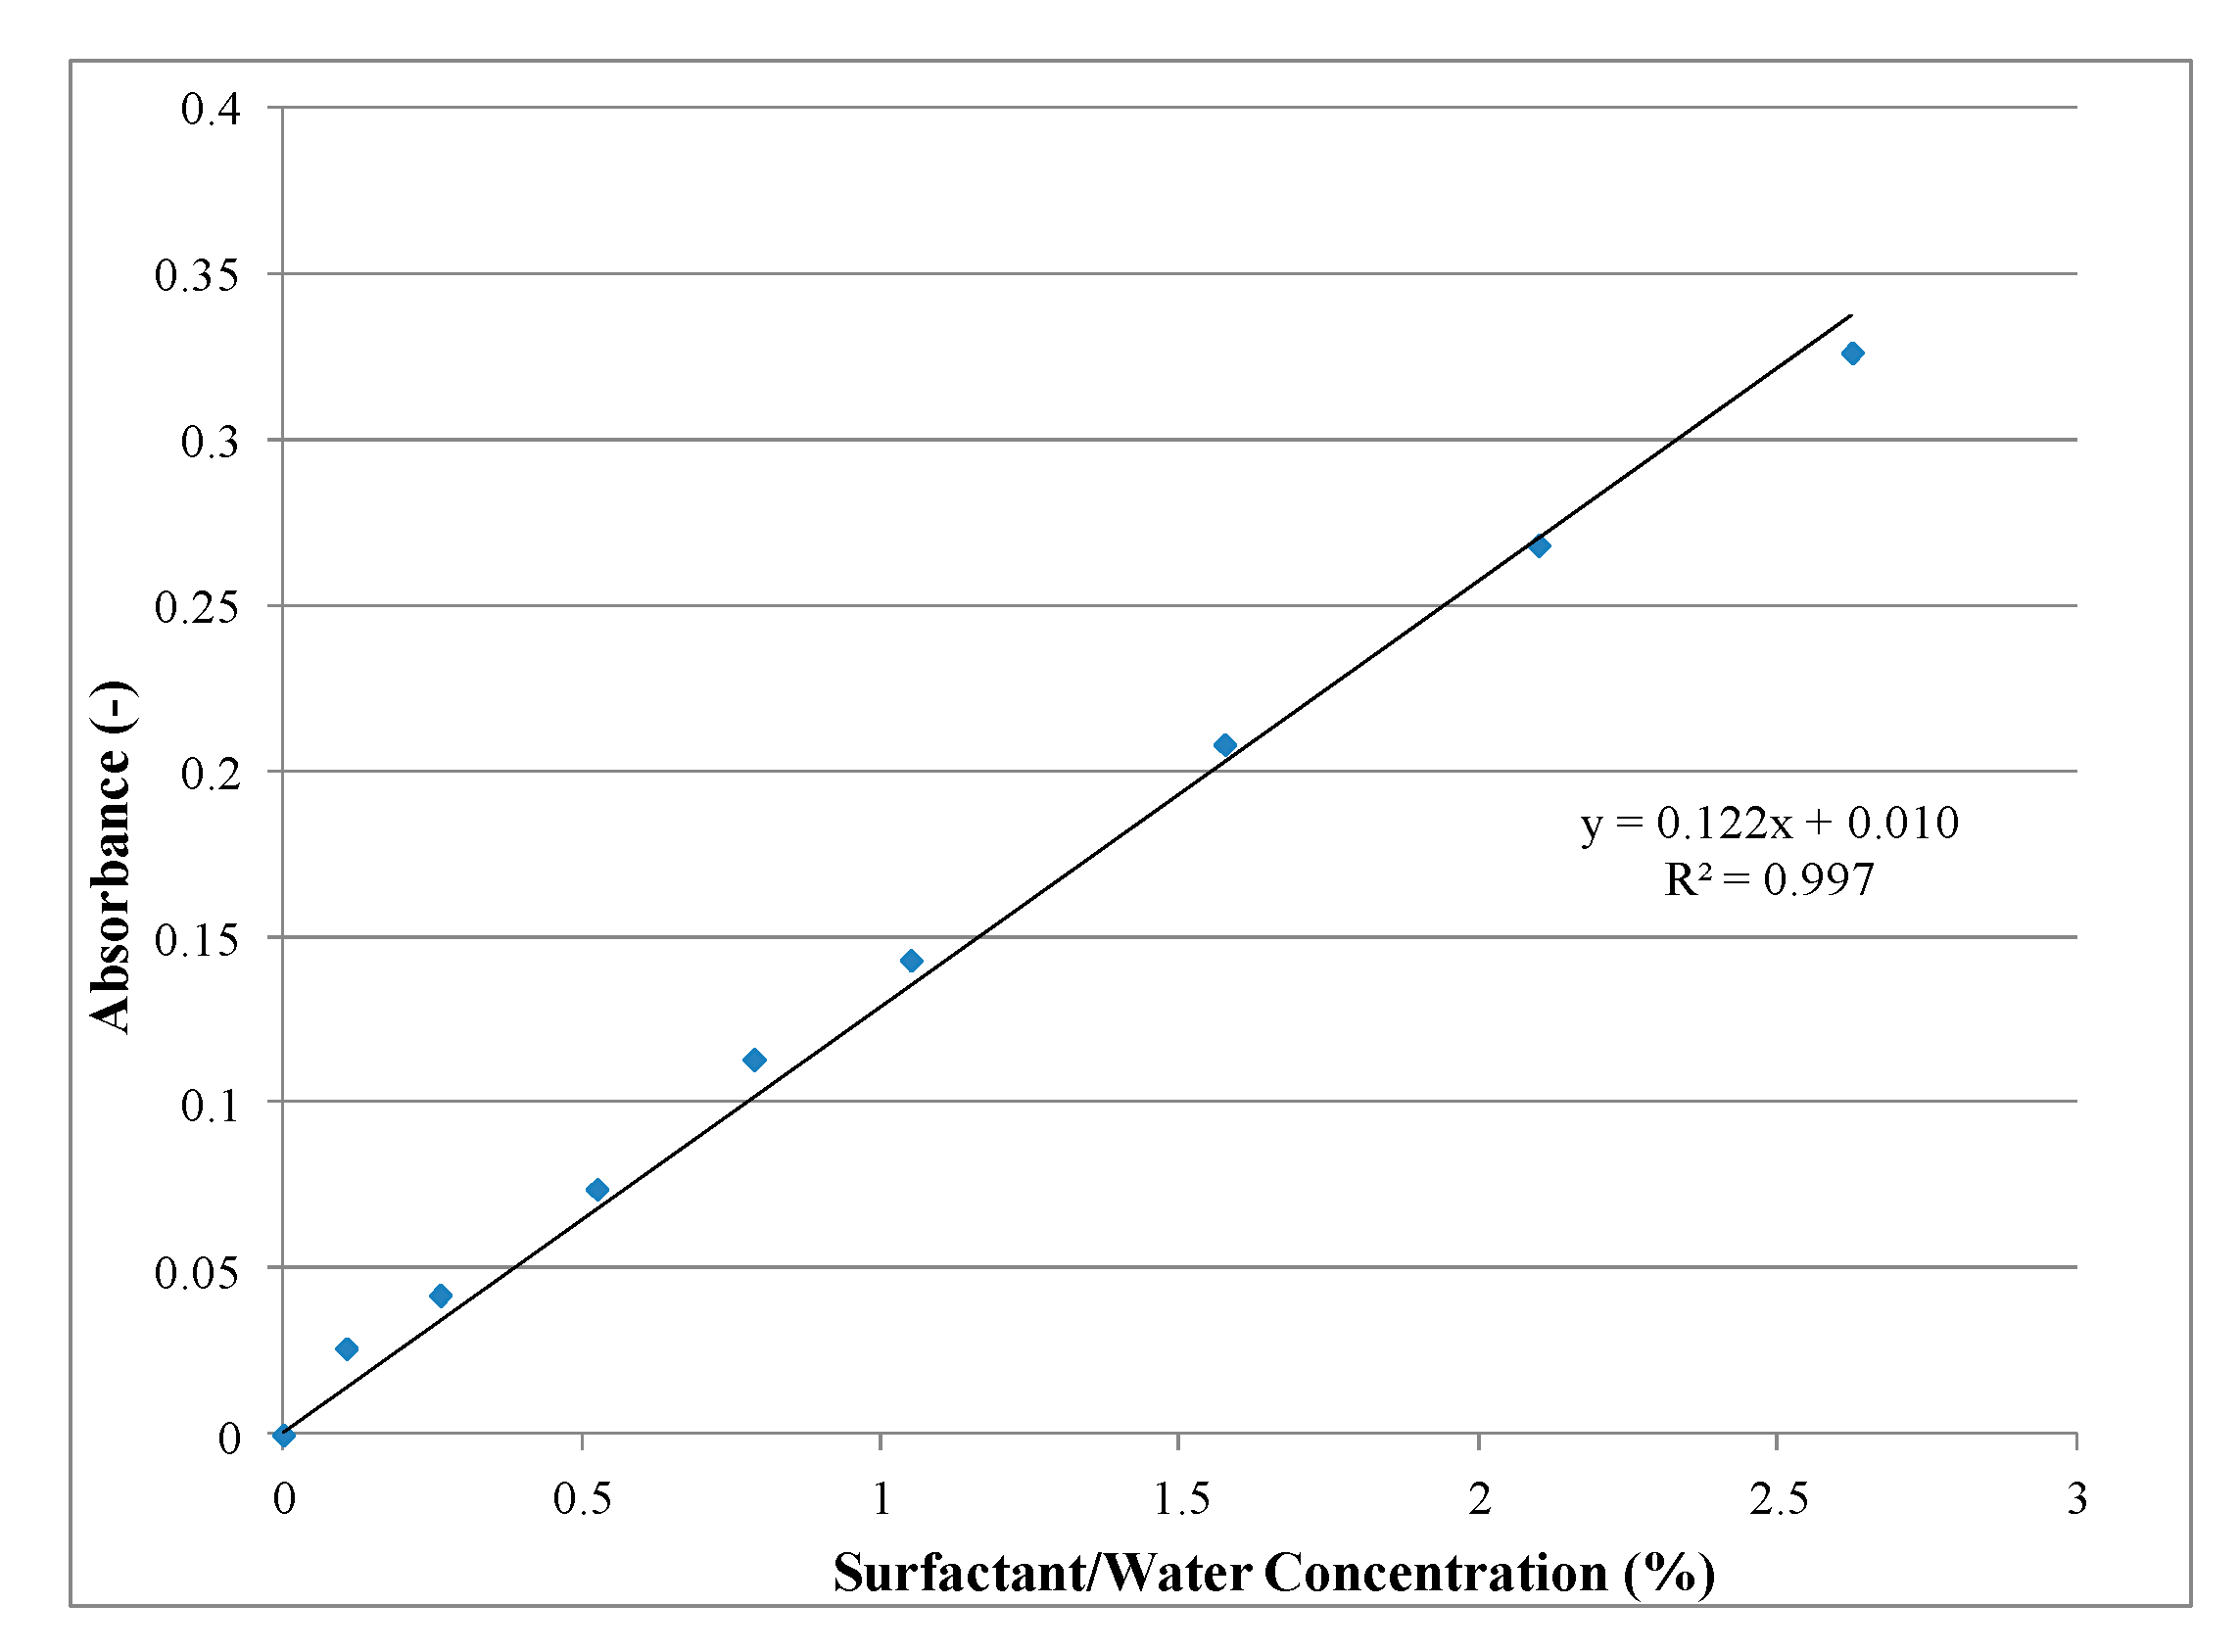
3.4.3. Ultraviolet Spectroscopy

The surfactant concentrations in the solution were evaluated using ultraviolet–visible spectroscopy concepts. First, a calibration curve was developed by measuring the absorbance of solutions containing various known surfactant concentrations using an ultraviolet–visible spectrophotometer. Then, the absorbance of the filtered solutions obtained in the three stages (i.e., CNTs only, before and after sonication) were recorded. The solution concentrations were determined using the calibration curve.

3.5. Microstructural Analysis

Microstructural analysis was performed using a Scanning Electron Microscope (SEM). The fractured specimens were sputtered with acetone to stop the hydration process. After that, they were stored until the testing day. The imaging process started by drying the specimens using a vacuum chamber and covering them with a conductive palladium. This step was done to dissolve excess charges, and hence have clear image products. After that, the specimens were fixed on the machine holder using glue and the scanning process was performed.

4. Results and Discussion

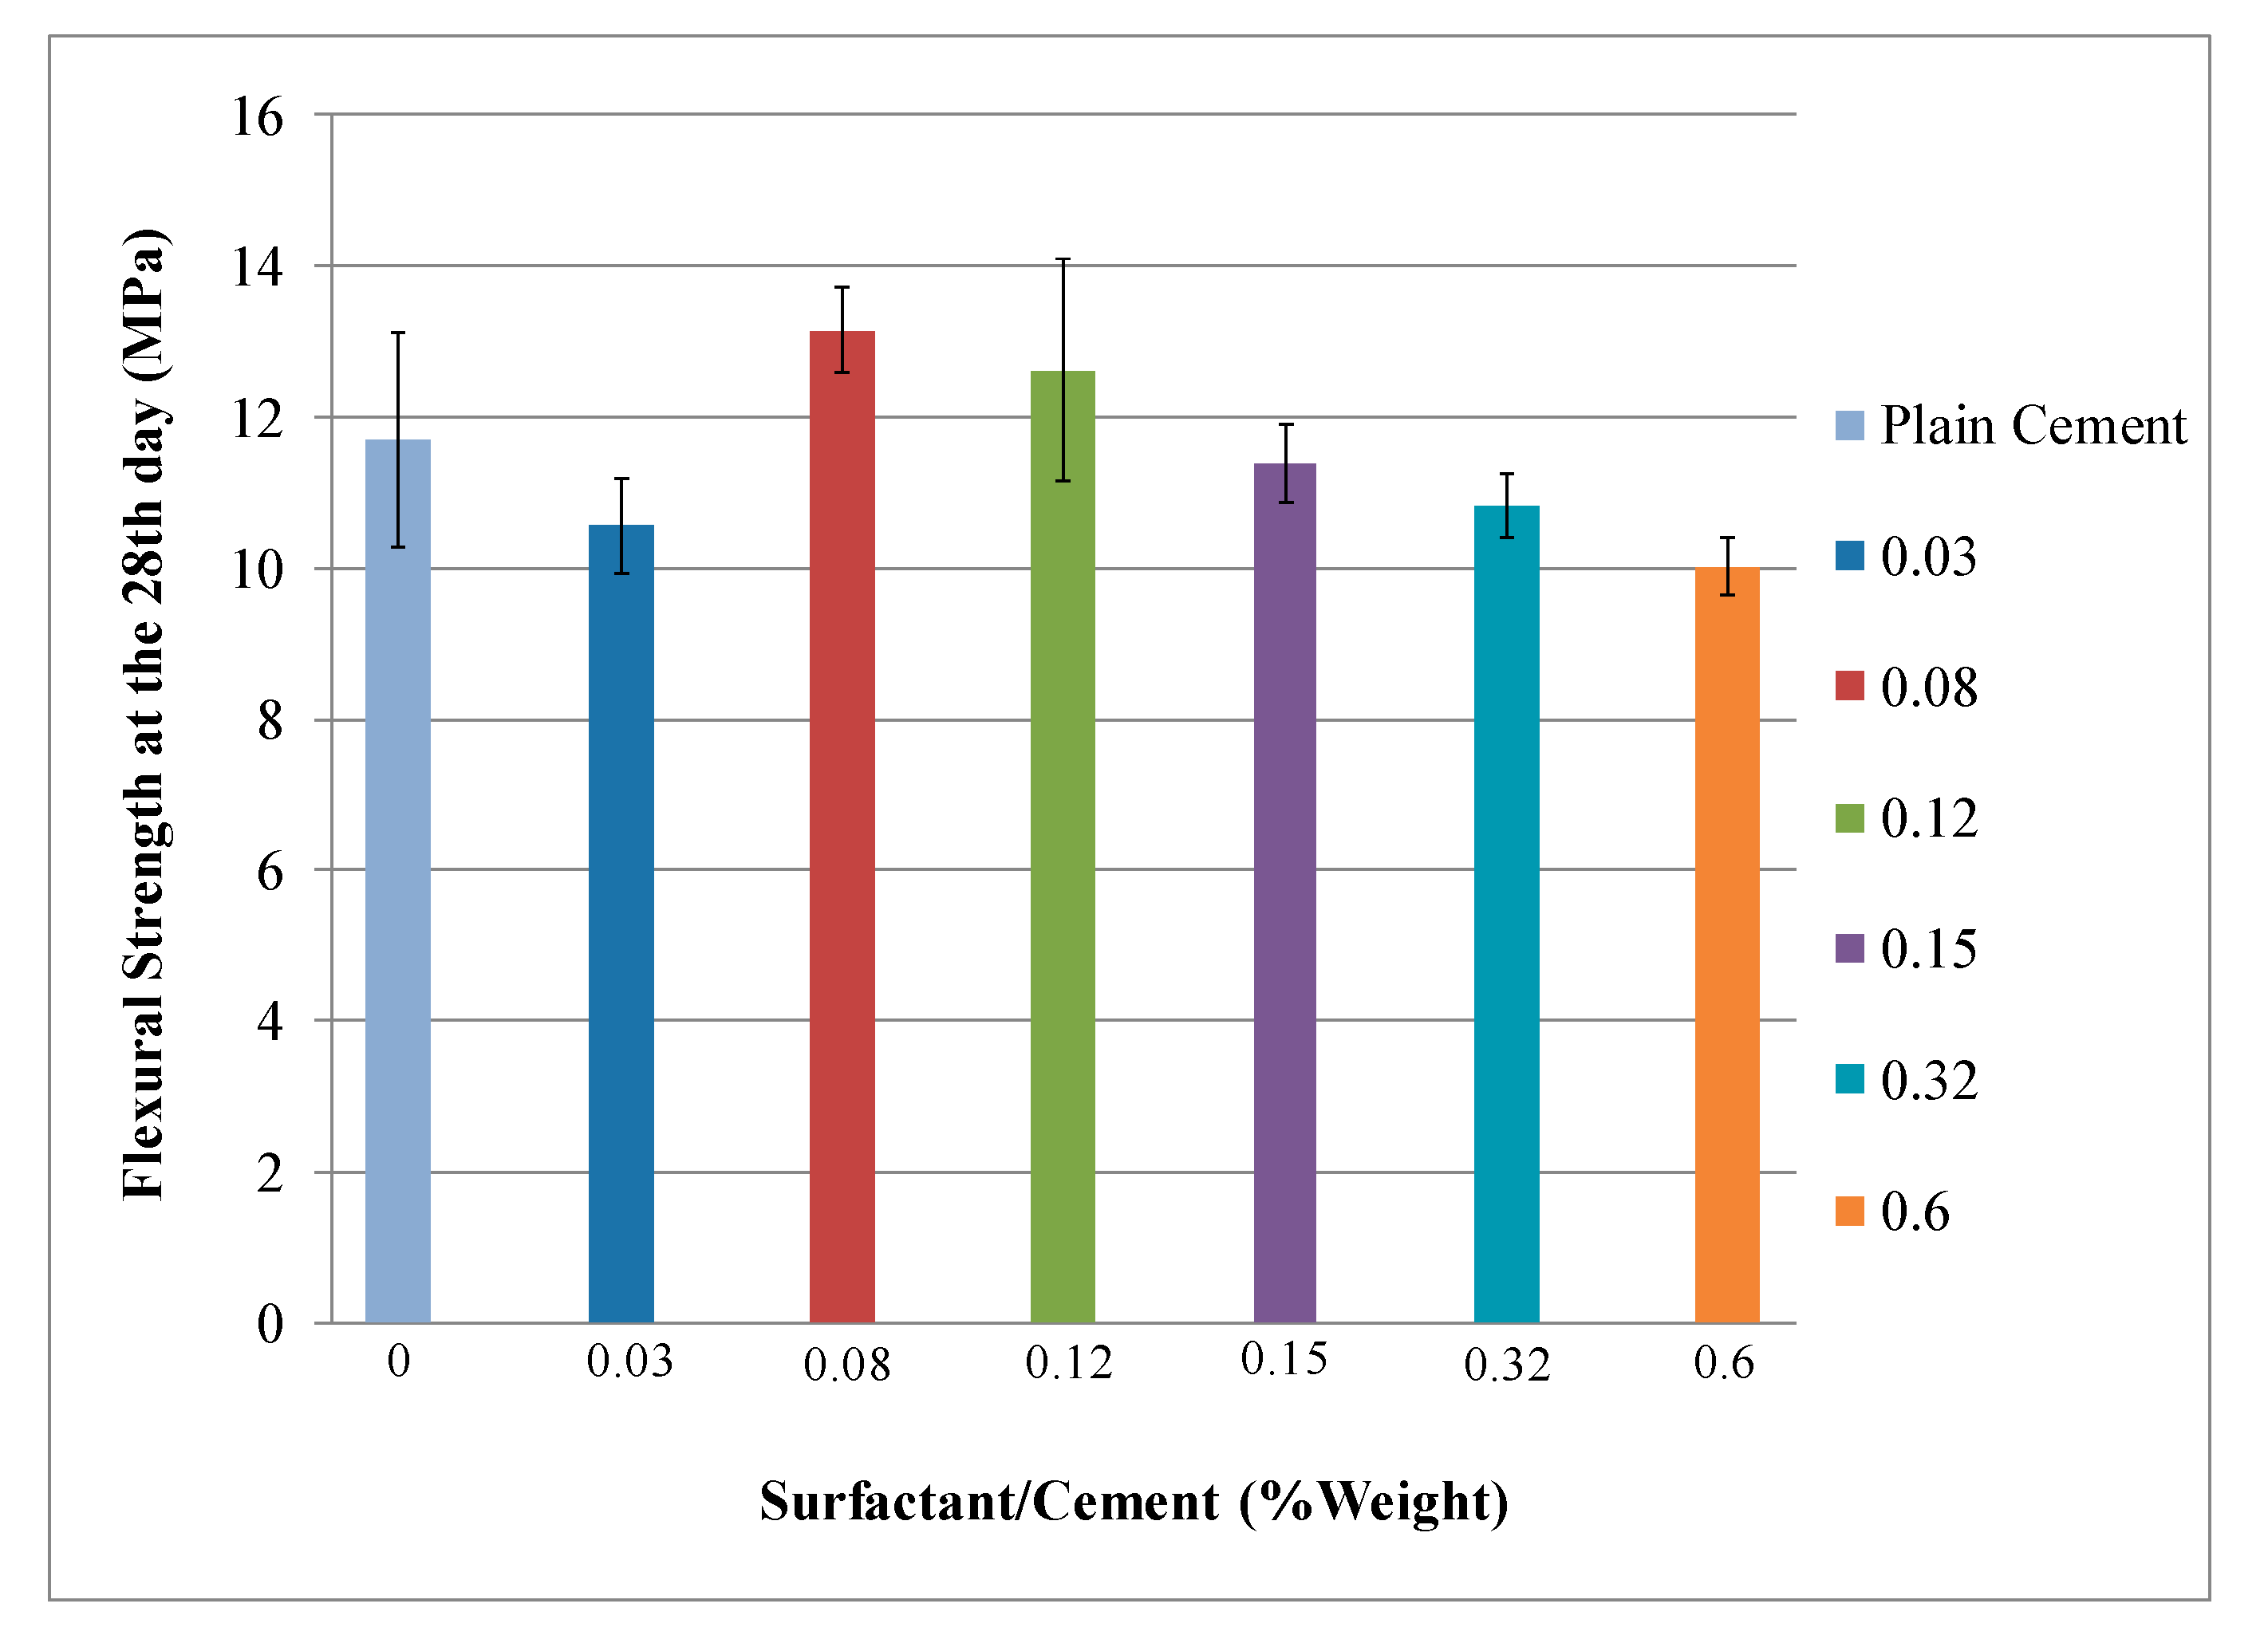
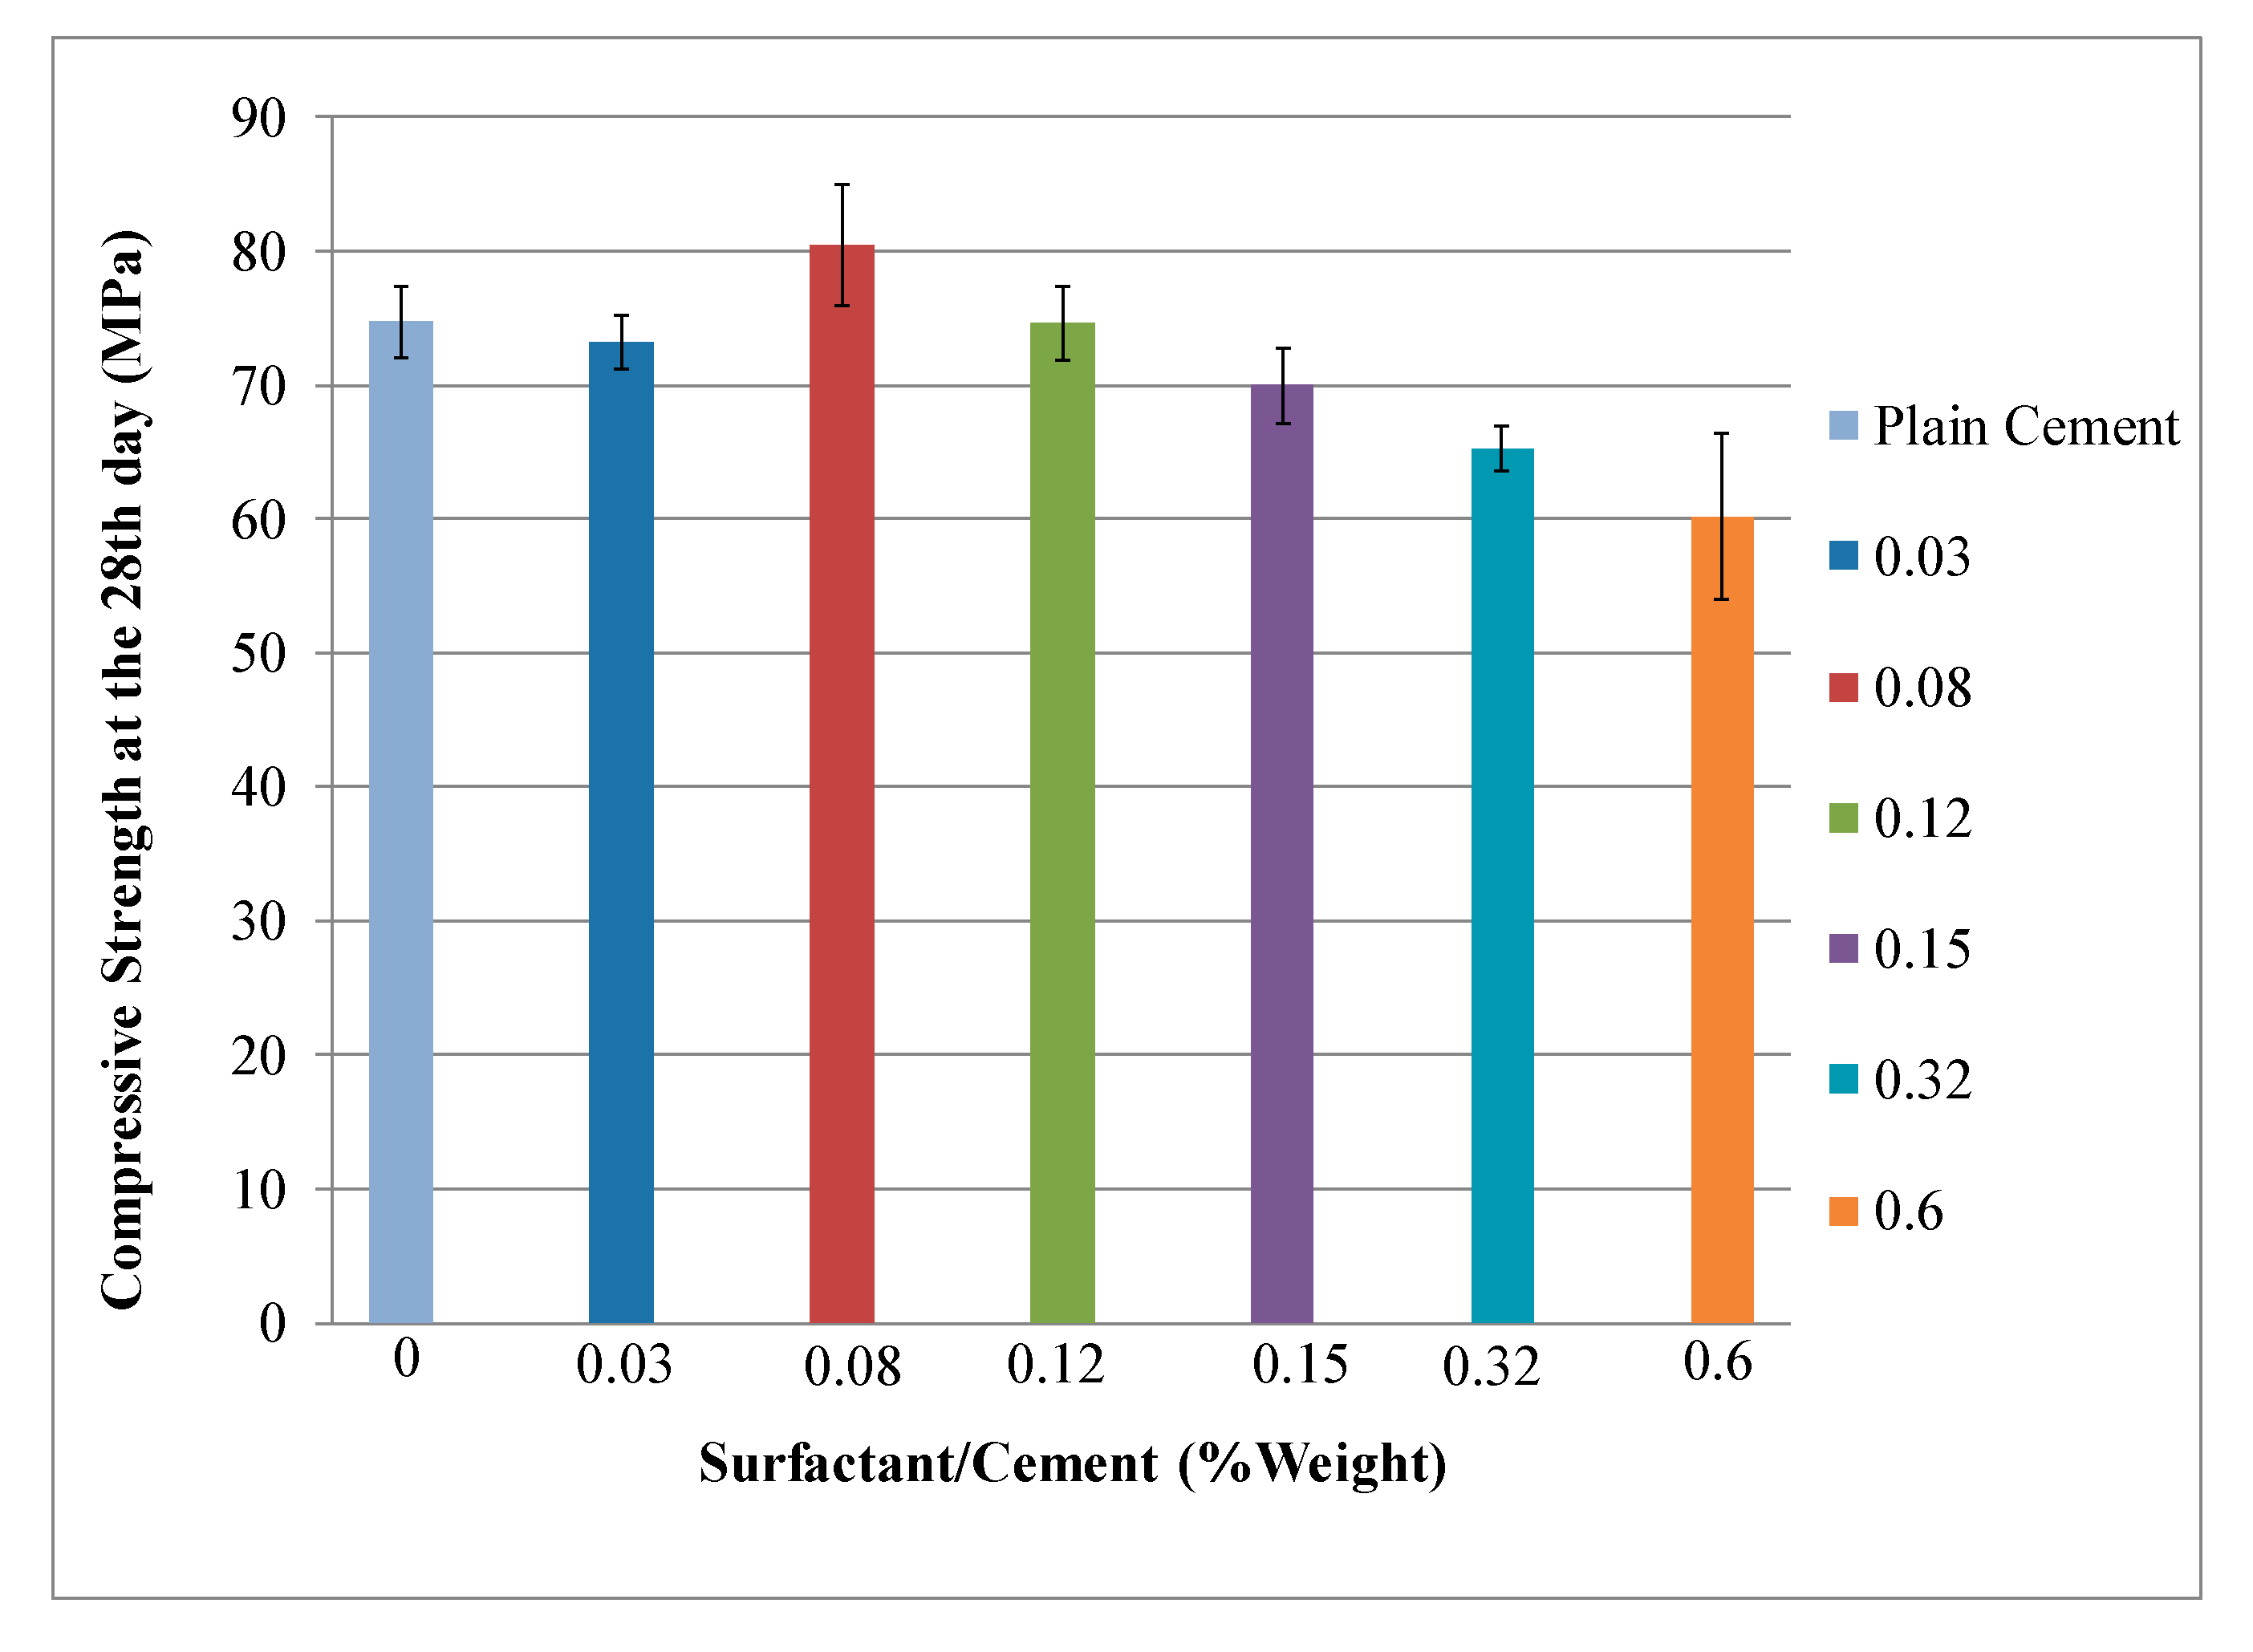
4.1. Mechanical Properties Analysis

Figure 5 and Figure 6 show the average flexural and compression strength results of the batches listed in Table 2. The standard deviations were also determined for each batch. The results show similar variation trends for flexural and compressive strengths with respect to the surfactant weight fraction. There was a strength decrease for the batches prepared using 0.03% surfactant-to-cement content compared to plain cement paste batches. After that, there was a significant strength increase for the batches prepared using 0.08% surfactant content, which represented the highest strength values for all the batches (optimum surfactant amount SUopt). The strength data remained higher than the control batches up to a surfactant content of 0.15%. Beyond a surfactant content of 0.15%, there was a strength reduction when compared with plain cement paste mixes. This may be due to possible entrapped air and/or hydration retardation resulting from surfactant overdosing. Several authors [3,4,25] have reported that increasing the concentration of polycarboxylate superplasticizer in the mix slows the cement hydration rate and increases the amount of entrapped air.

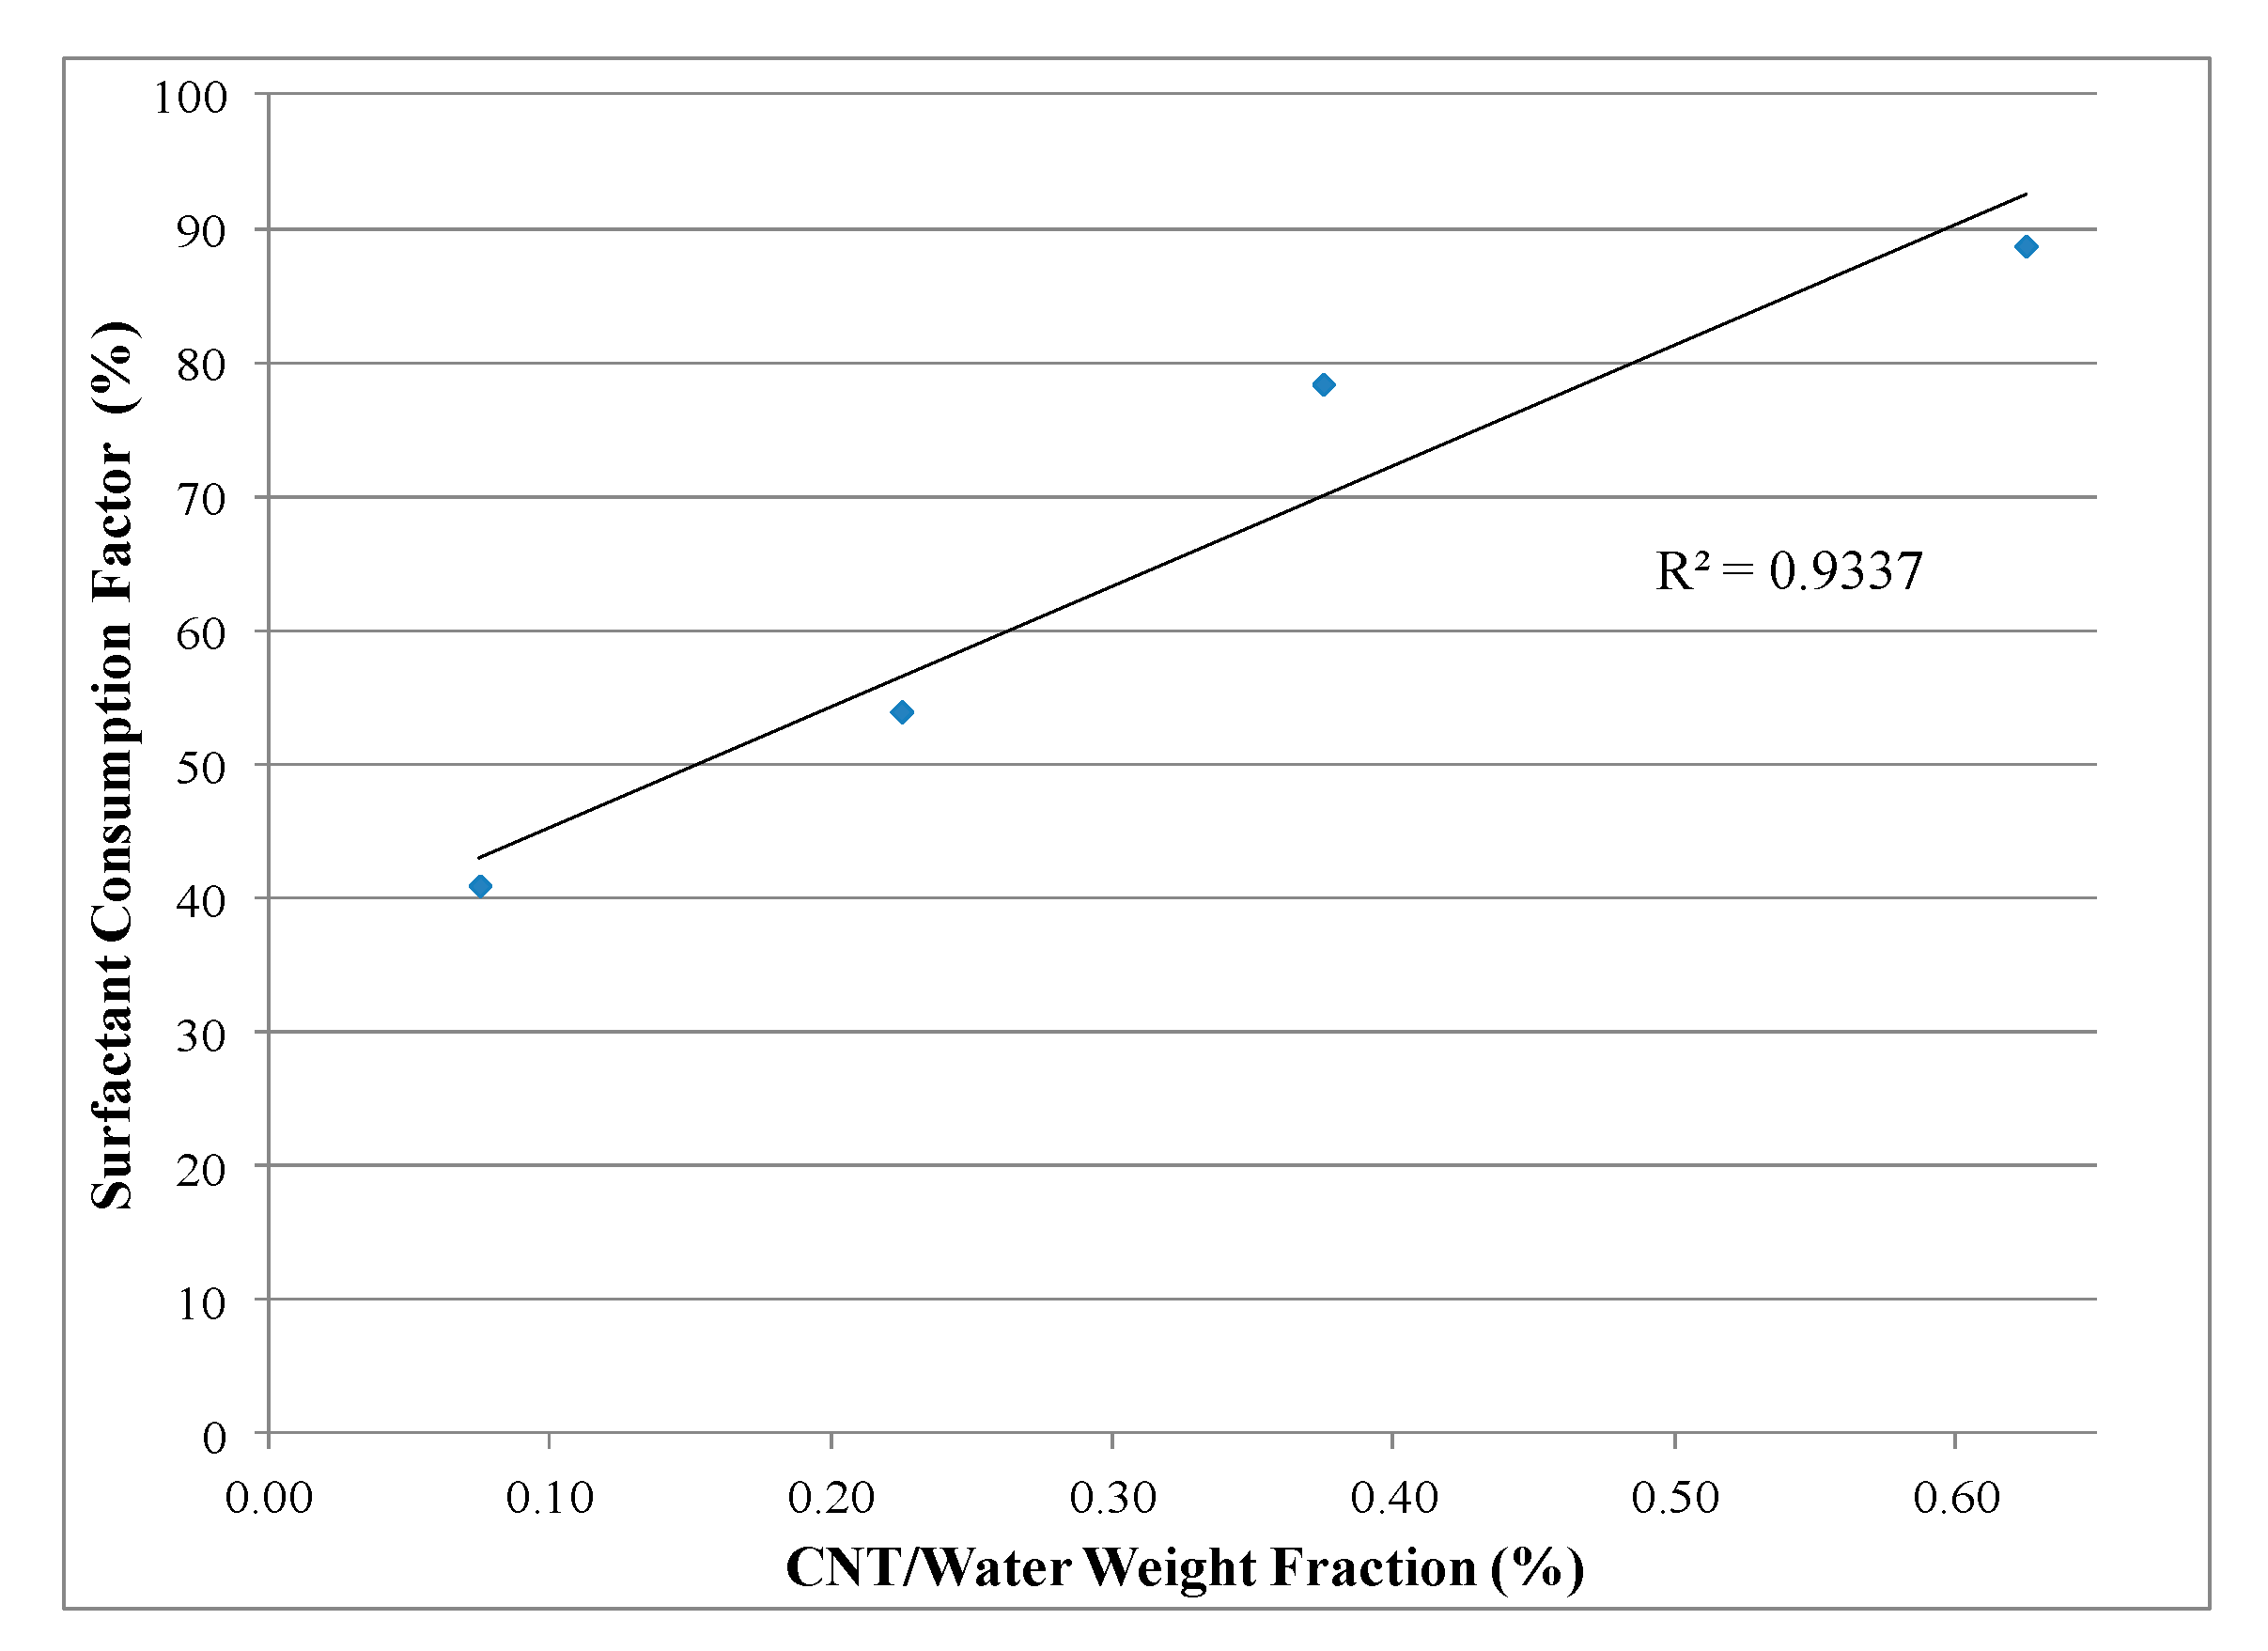
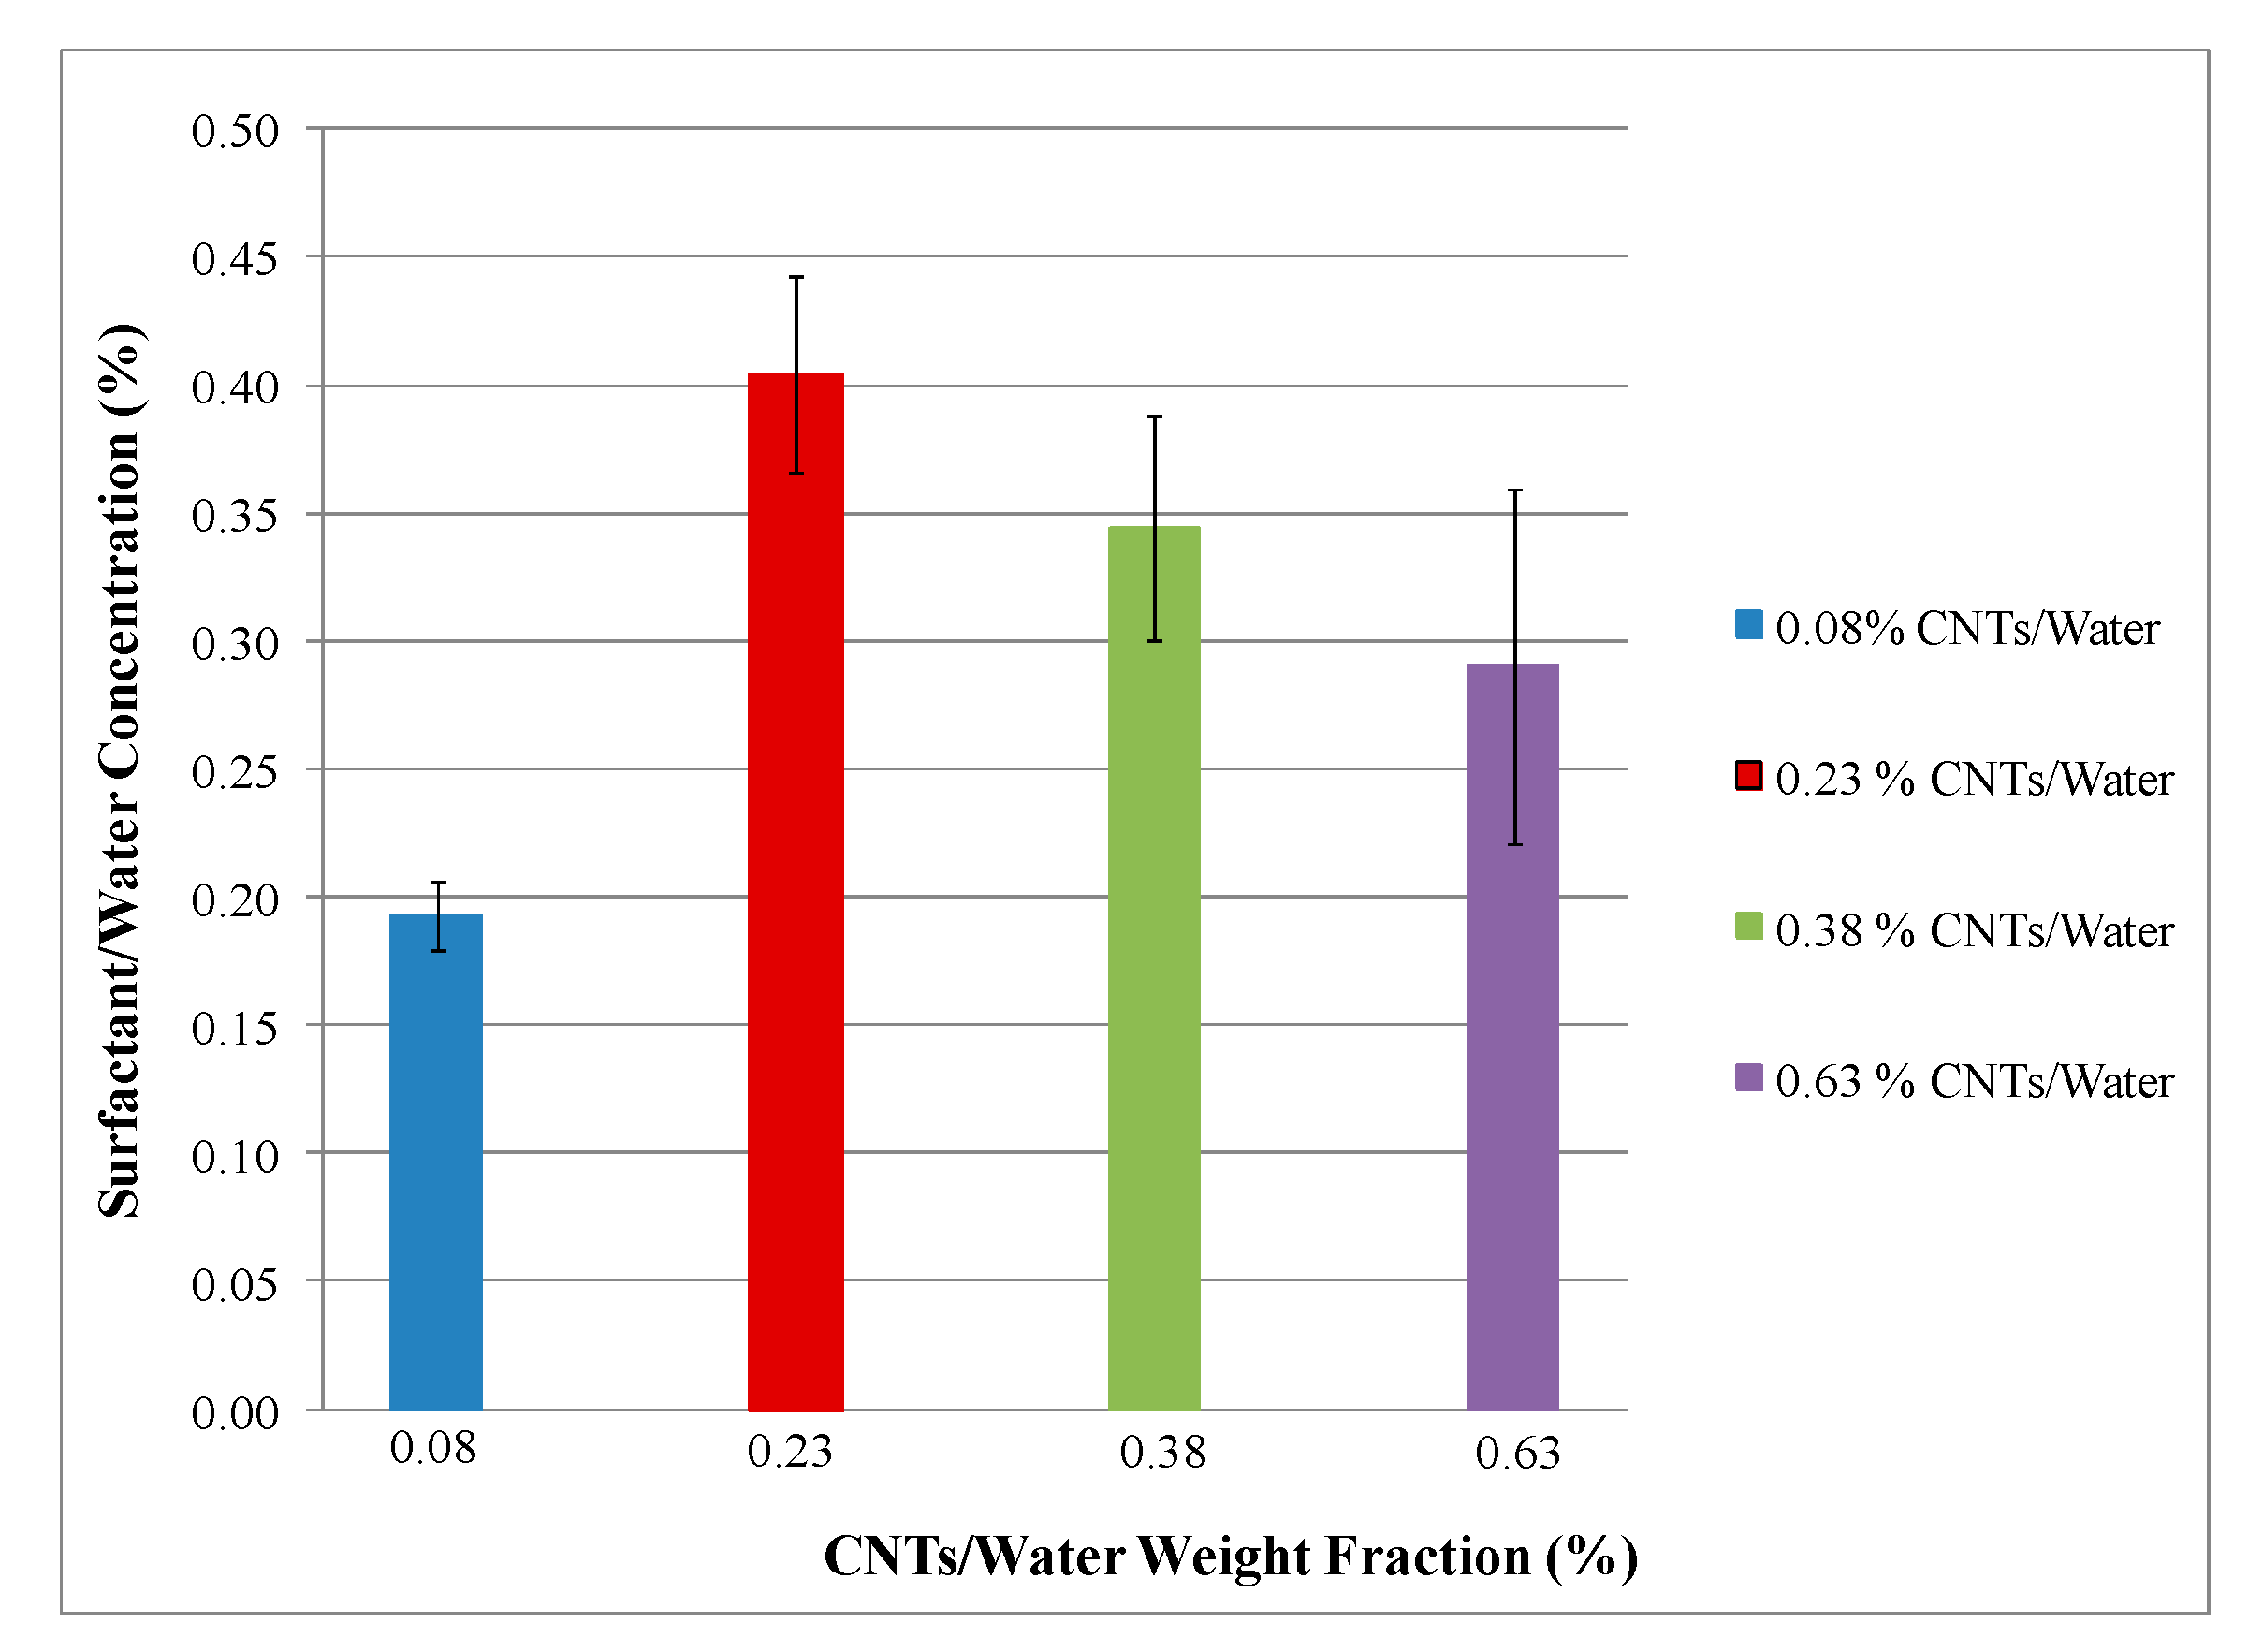
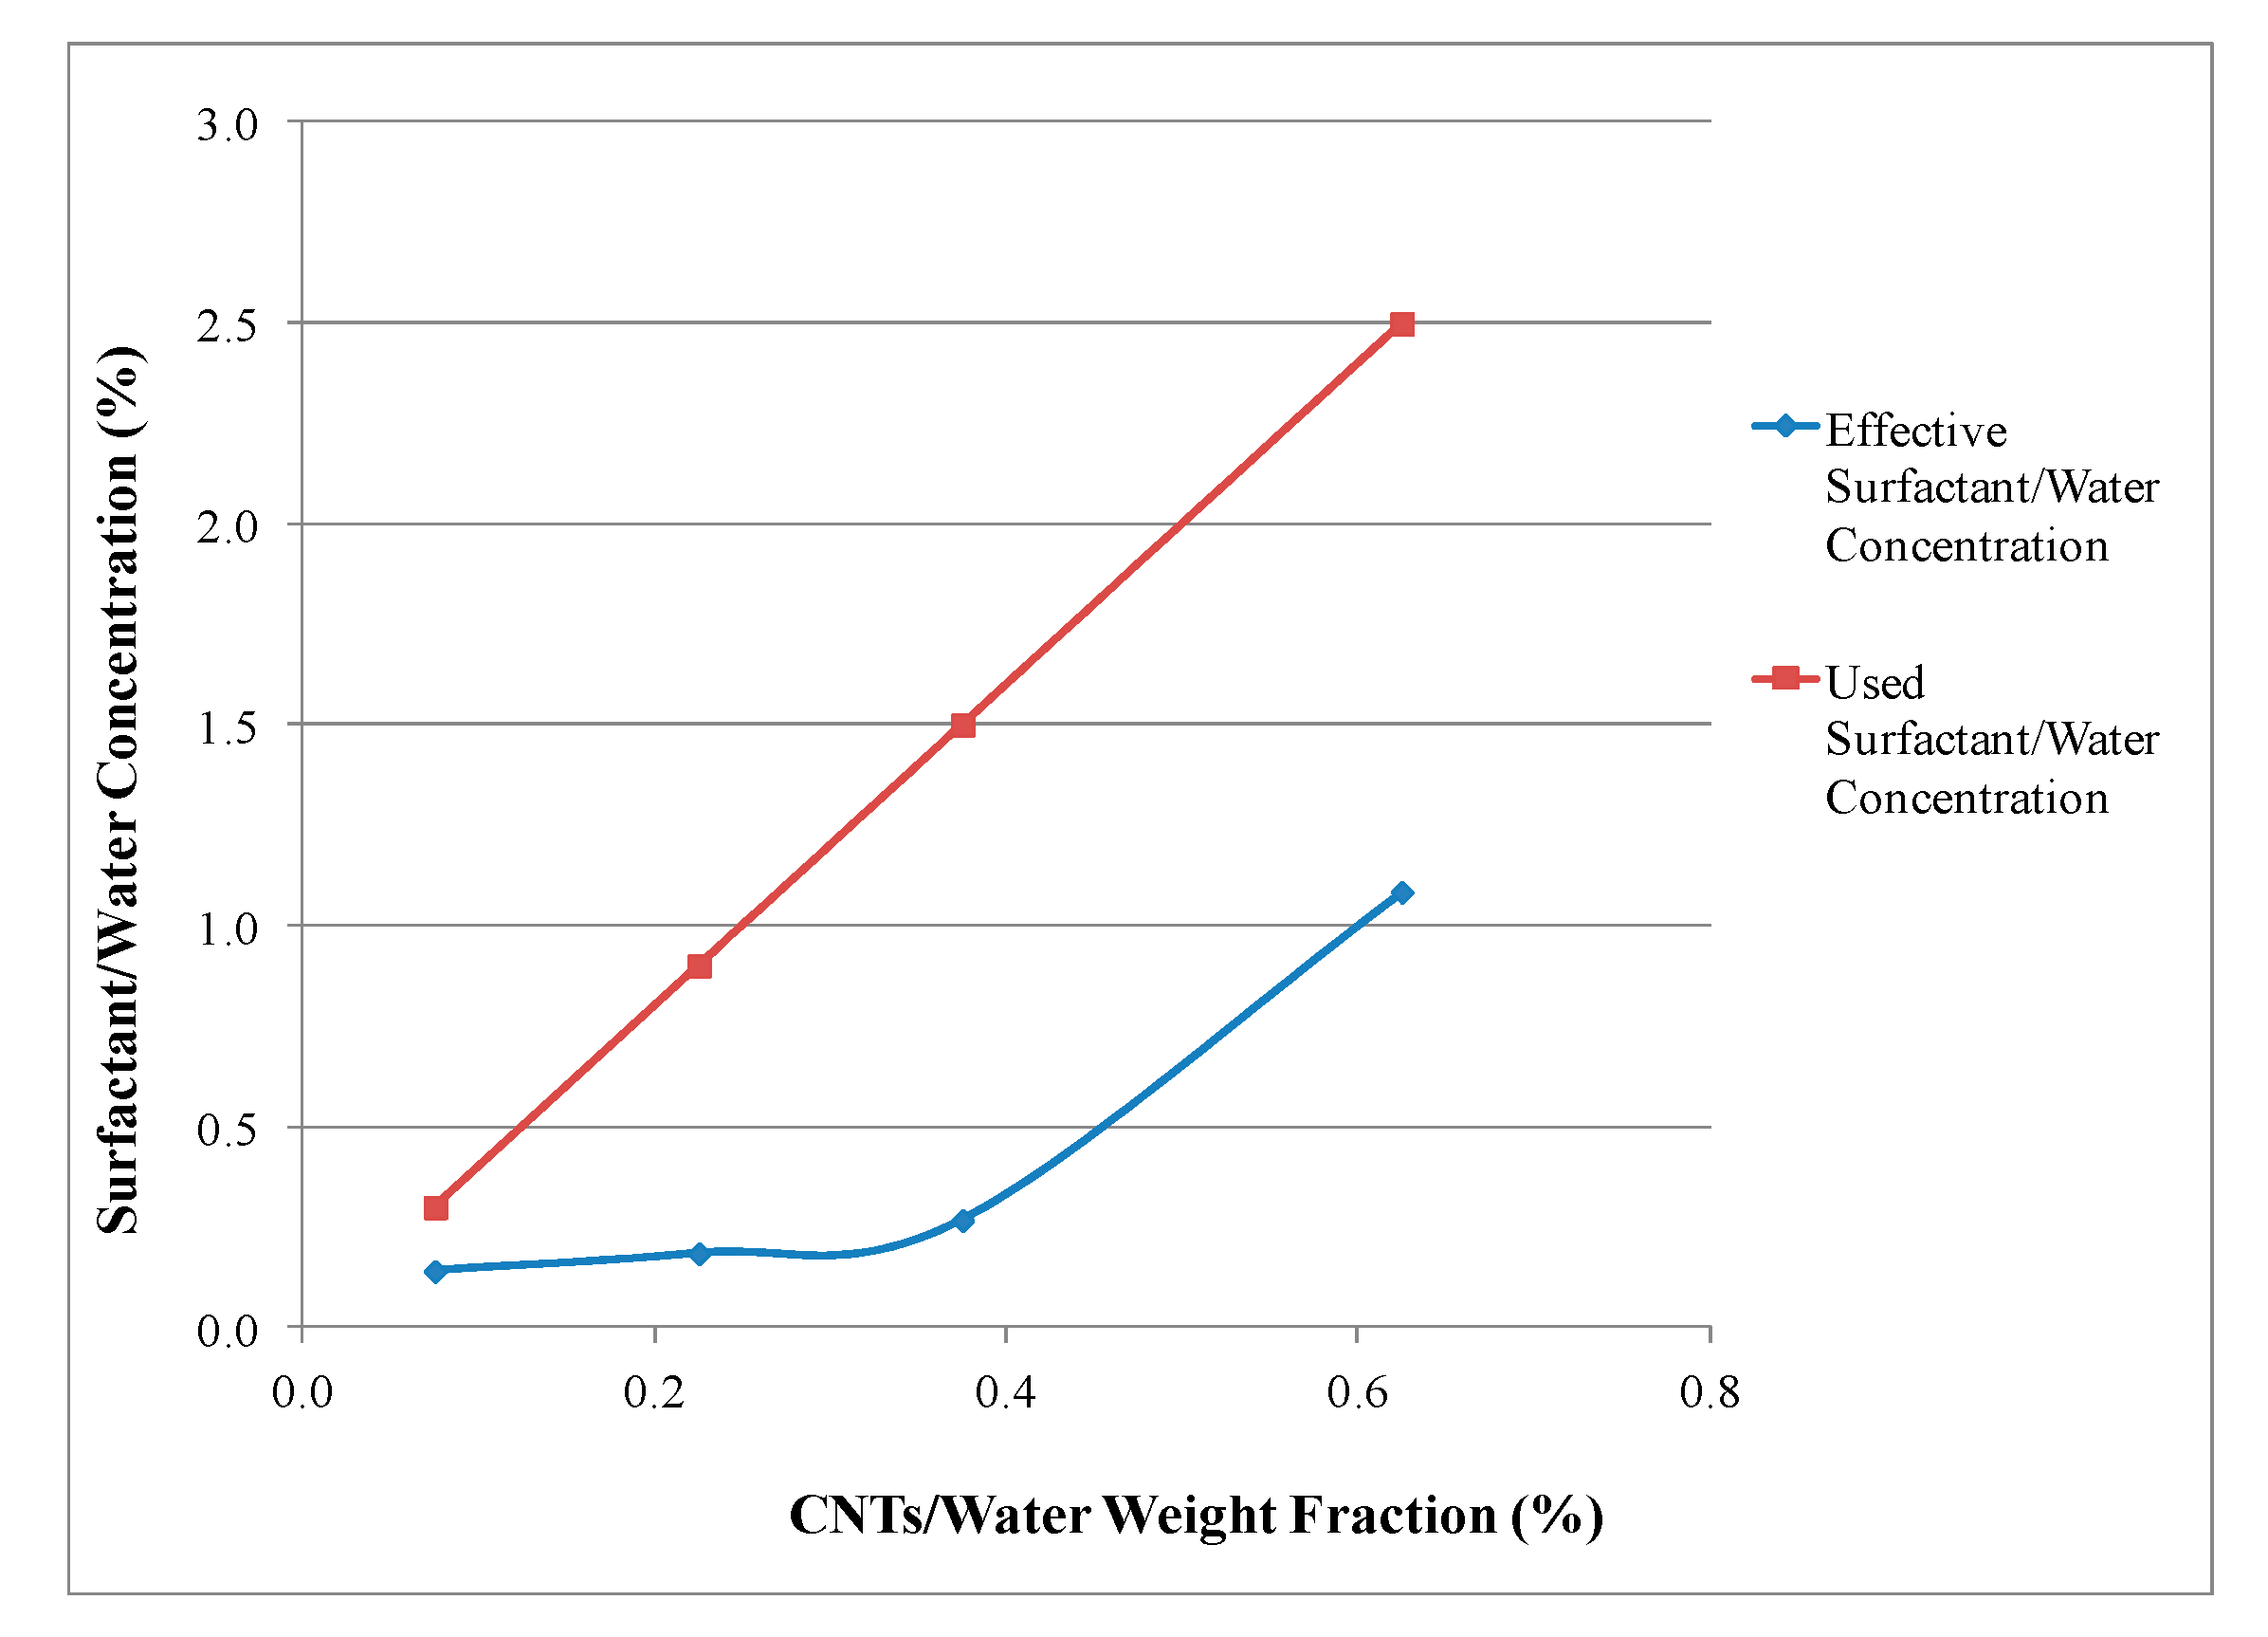
4.2. Chemical Analysis

The chemical analysis via the UV spectroscopy process began with plotting the calibration curve of water and surfactant solutions (Figure 7). The recorded wavelength was 273 nm, and the relationship between the water absorbance and surfactant concentration can be described by the following regression equation:
y = 0.122x + 0.01
where y = absorbance, and x = surfactant/water concentration (% weight).
Using Equation (6) and UV spectroscopy absorbance values, the concentration values for the three solution’s stages in Figure 2 are summarized in Table 4. The computation procedure was validated by comparing the surfactant concentration results that were obtained before sonication with the original ones used at the start of the test. The comparison results that are summarized in Table 5 show a maximum difference of 10% for all solutions.
After obtaining the surfactant concentrations before and after sonication at various CNTs’ weight fractions, the relationships between the remaining surfactant, consumed surfactant, and CNTs’ weight fractions were plotted. Figure 8 shows the surfactant consumption rate curve versus the CNTs’ weight fraction. It shows that surfactant consumption increases with an increase in the CNTs’ weight fraction in the solution. This may be due to the increase in the adsorption of surfactant molecules on the surface of the additional CNTs.
On the other hand, Figure 9 shows the remaining amount of surfactant at the selected CNT s’ weight fractions. The results illustrate that the solutions with the highest CNTs and surfactant contents do not necessarily have the largest remaining surfactant concentrations. This fact underlines the importance of selecting the appropriate surfactant amount at the desired CNTs’ weight fraction. For example, several studies on CNTs cementitious composites reported a CNT-to-water weight fraction of 0.25% (i.e., CNTs/cement weight fraction of 0.1% at a w/c of 0.4) to be an optimum value to obtain an acceptable dispersion and higher mechanical properties [9,12,26,27]. However, Figure 9 shows that the remaining concentration of free surfactant particles in the water solution would be high (0.4%) for the selected CNTs’ weight fraction, using a surfactant-to-CNTs amount of 4:1. The results shown in Figure 5 and Figure 6 indicate that the strengths of CNT–cement batches with surfactant-to-cement weight fractions more than 0.15% (i.e., 0.375 surfactant-to-water weight fraction) were lower than those of the plain cement paste batch.
Figure 10 shows a relationship between the η factor and the CNTs’ weight fraction. The factor is obtained by dividing the remaining surfactant concentration by the original surfactant concentration. The results were then modeled using the following linear regression equation:
η = −90.342CW + 63.842
where CW = CNT/water weight fraction (%).
By substituting the obtained SUopt and η factor values in Equation (1), the effective surfactant values (SUeff) have been plotted (Figure 11) and compared to the original amounts (i.e., surfactant-to-CNT weight fraction of 4:1).

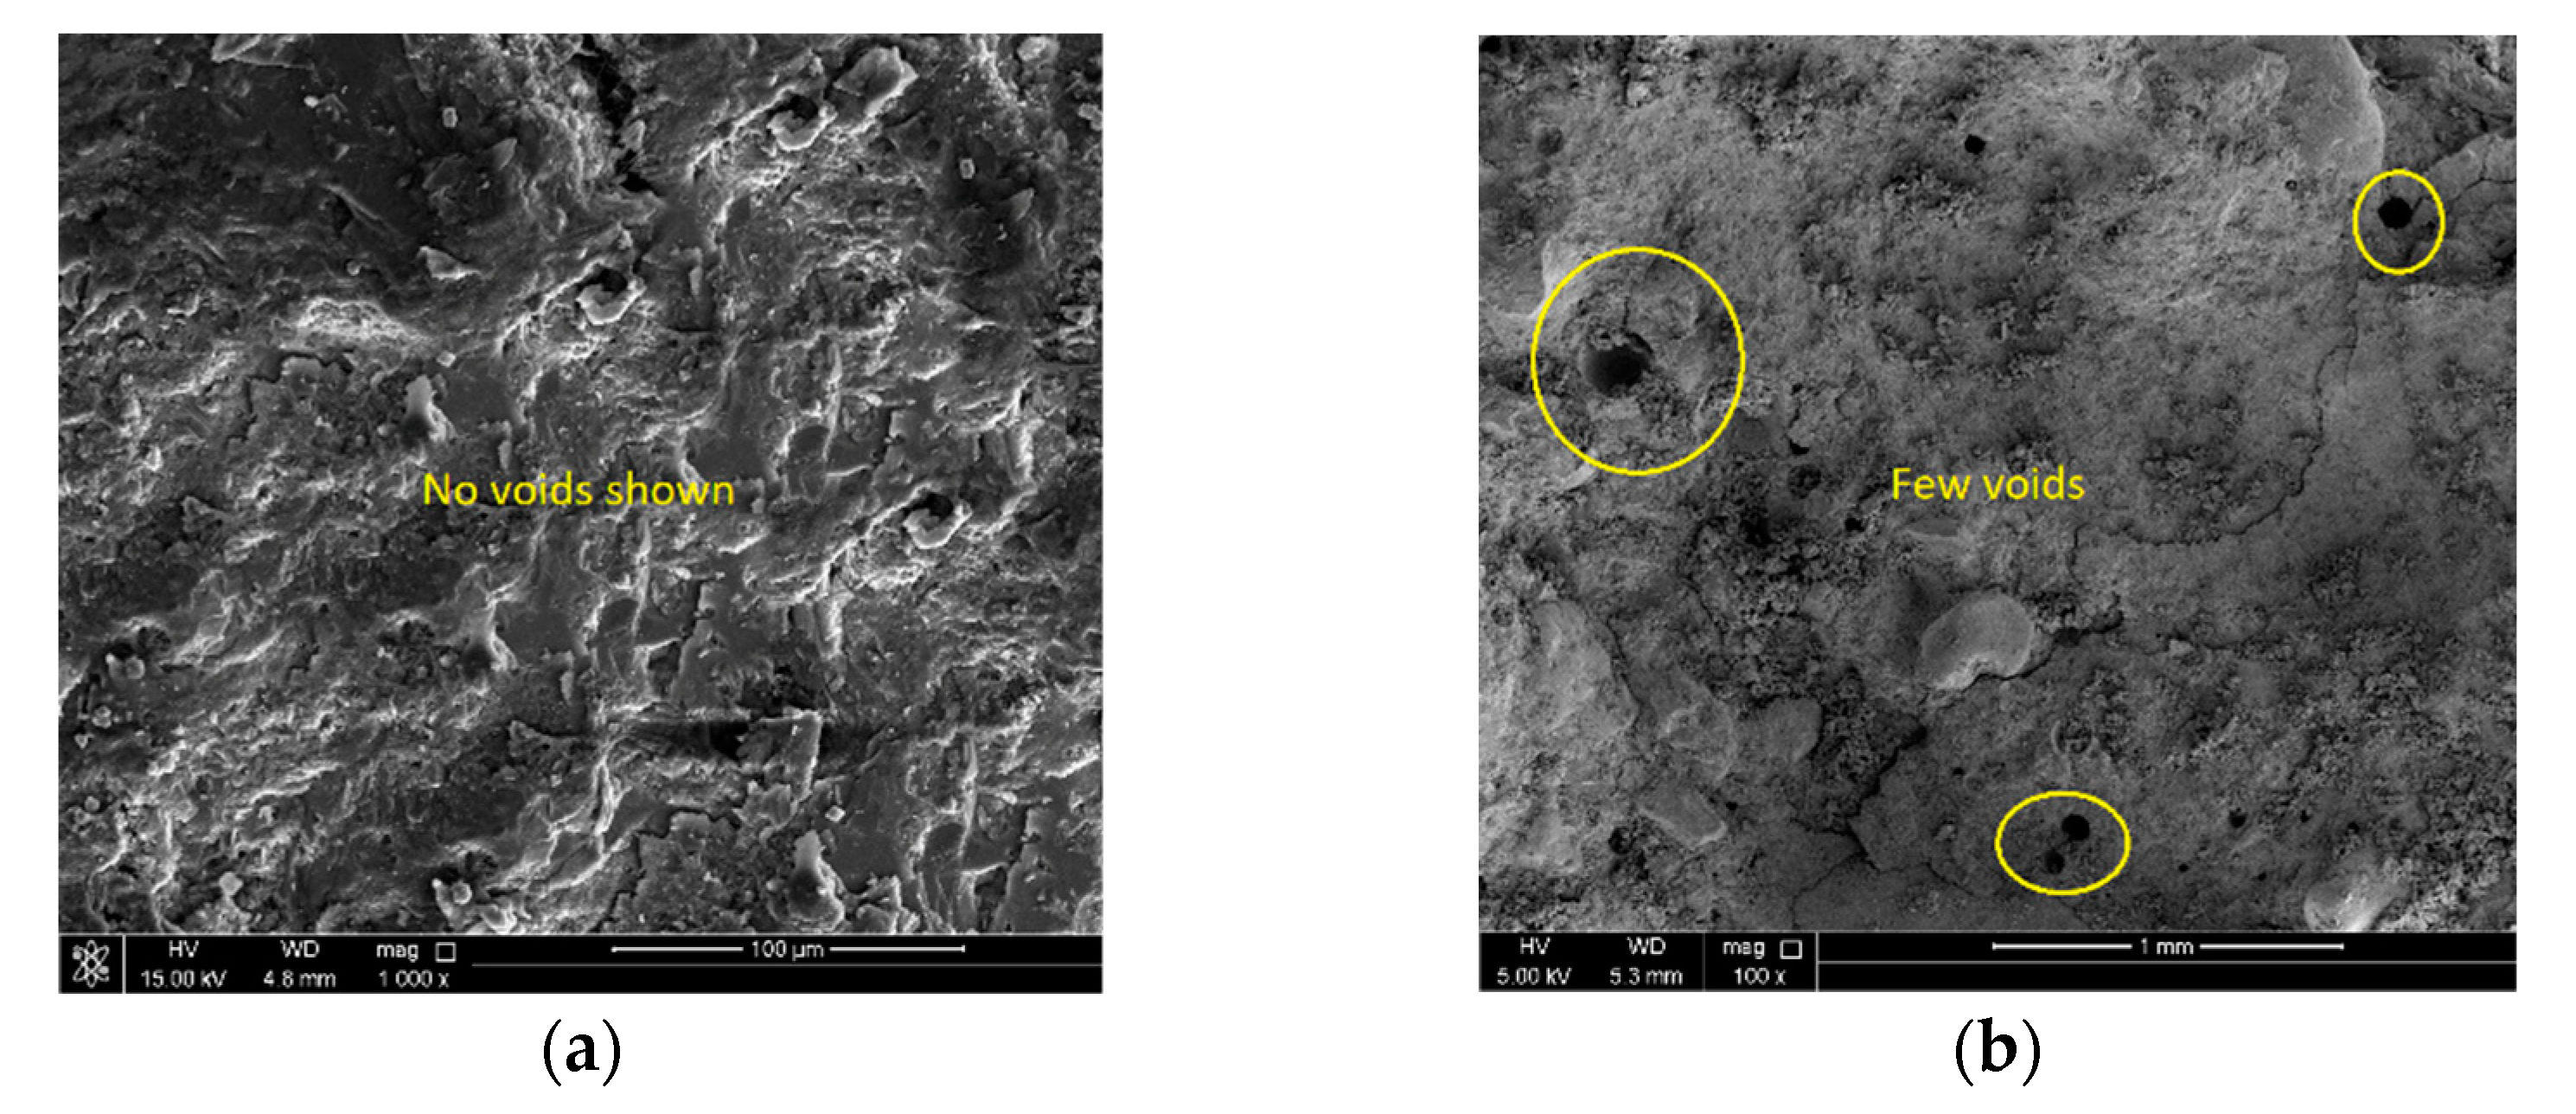
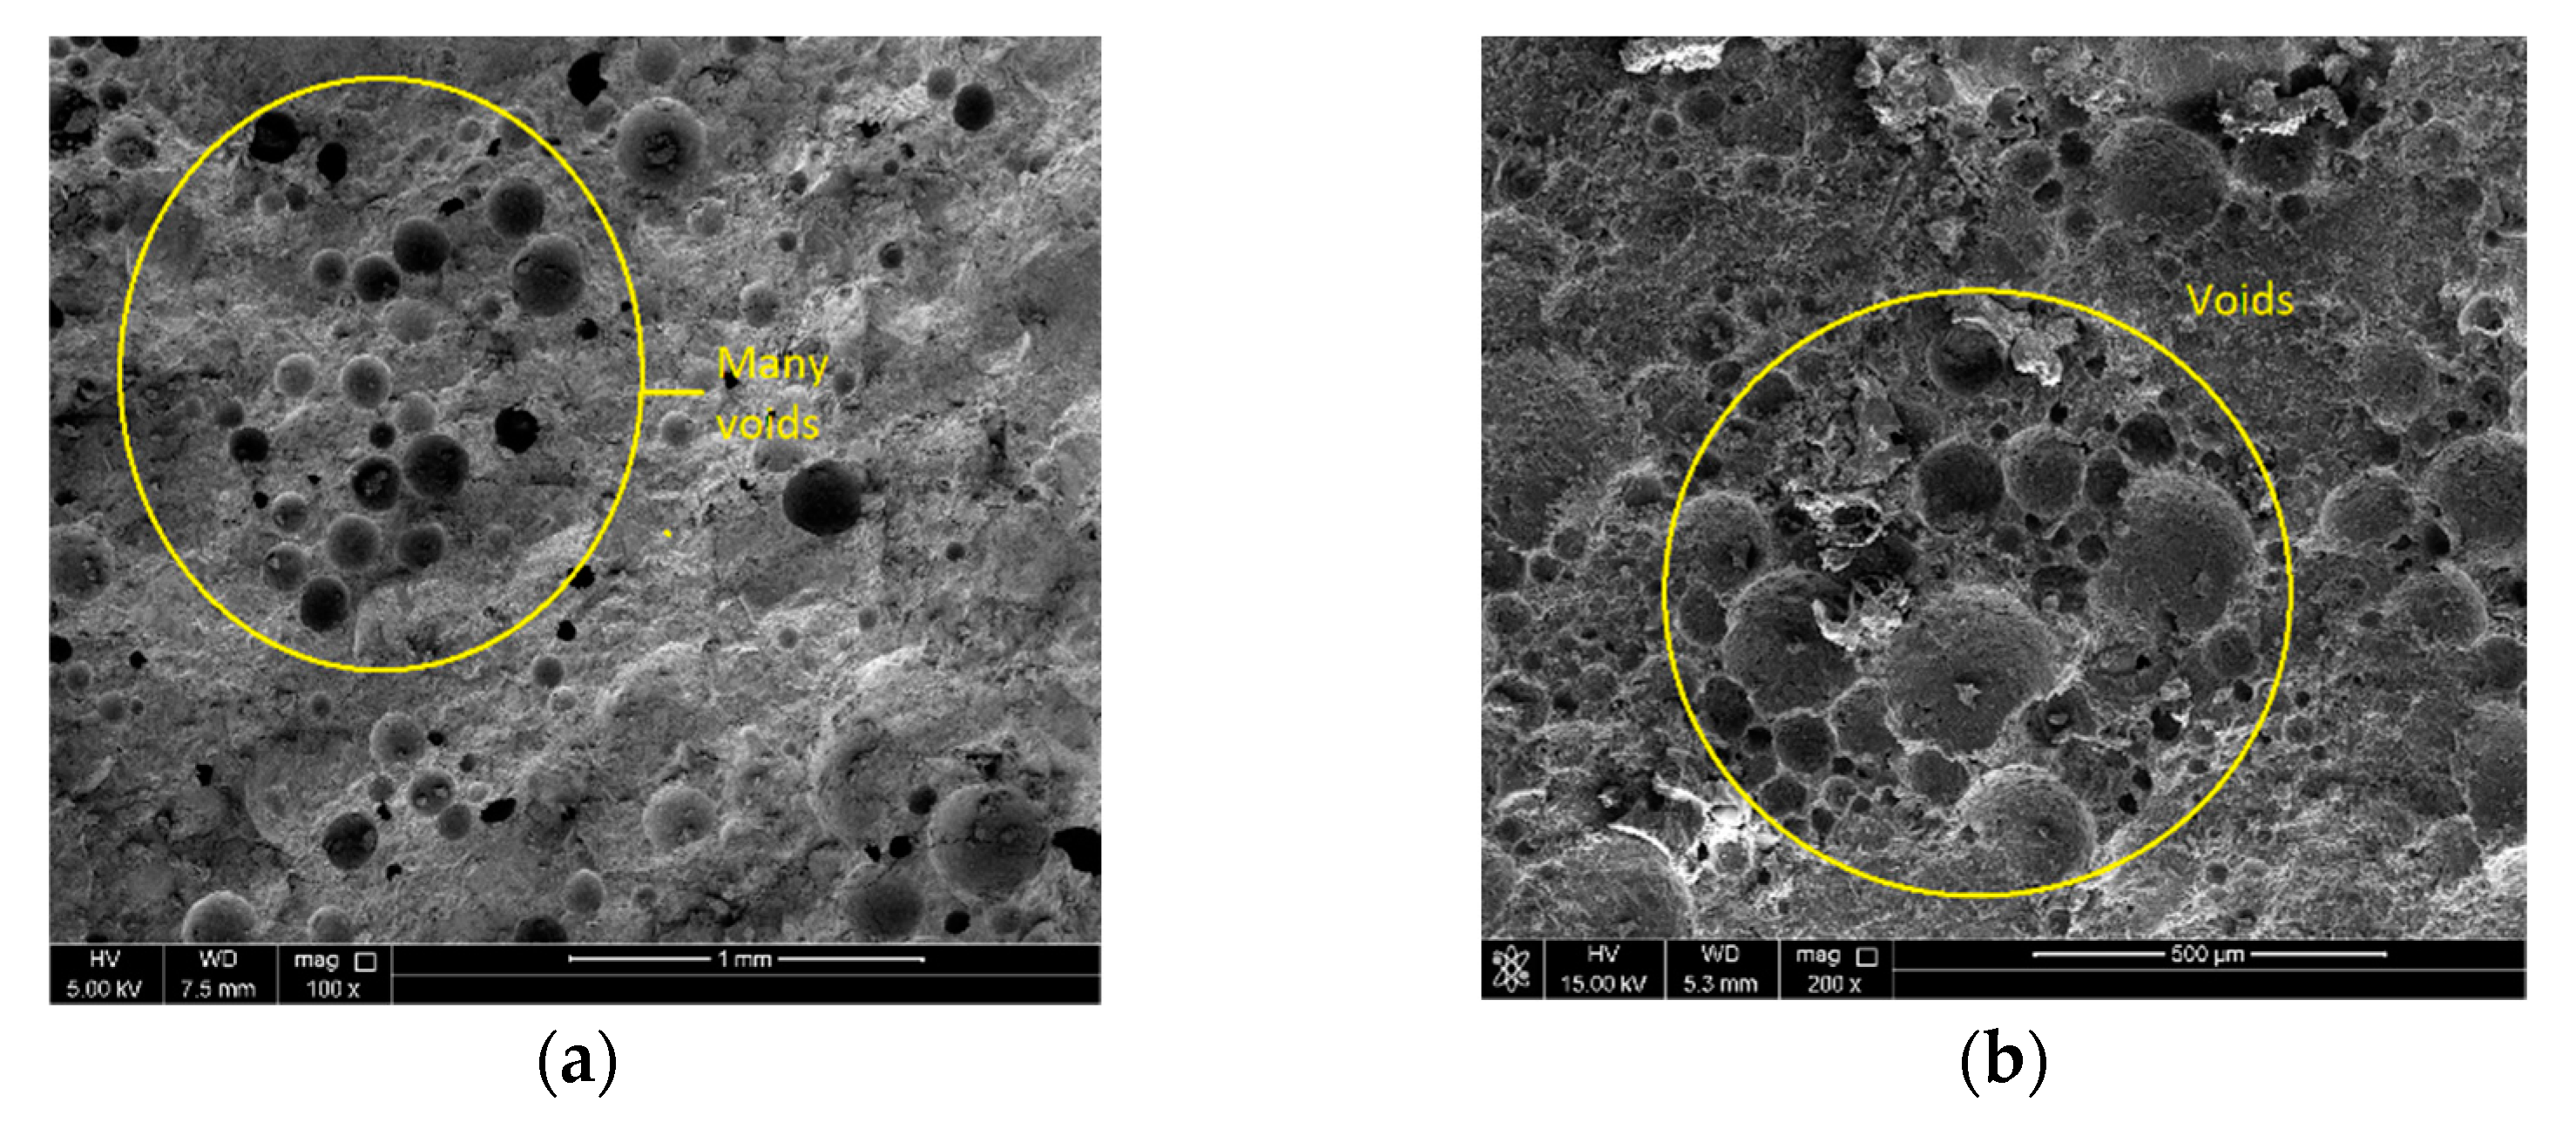
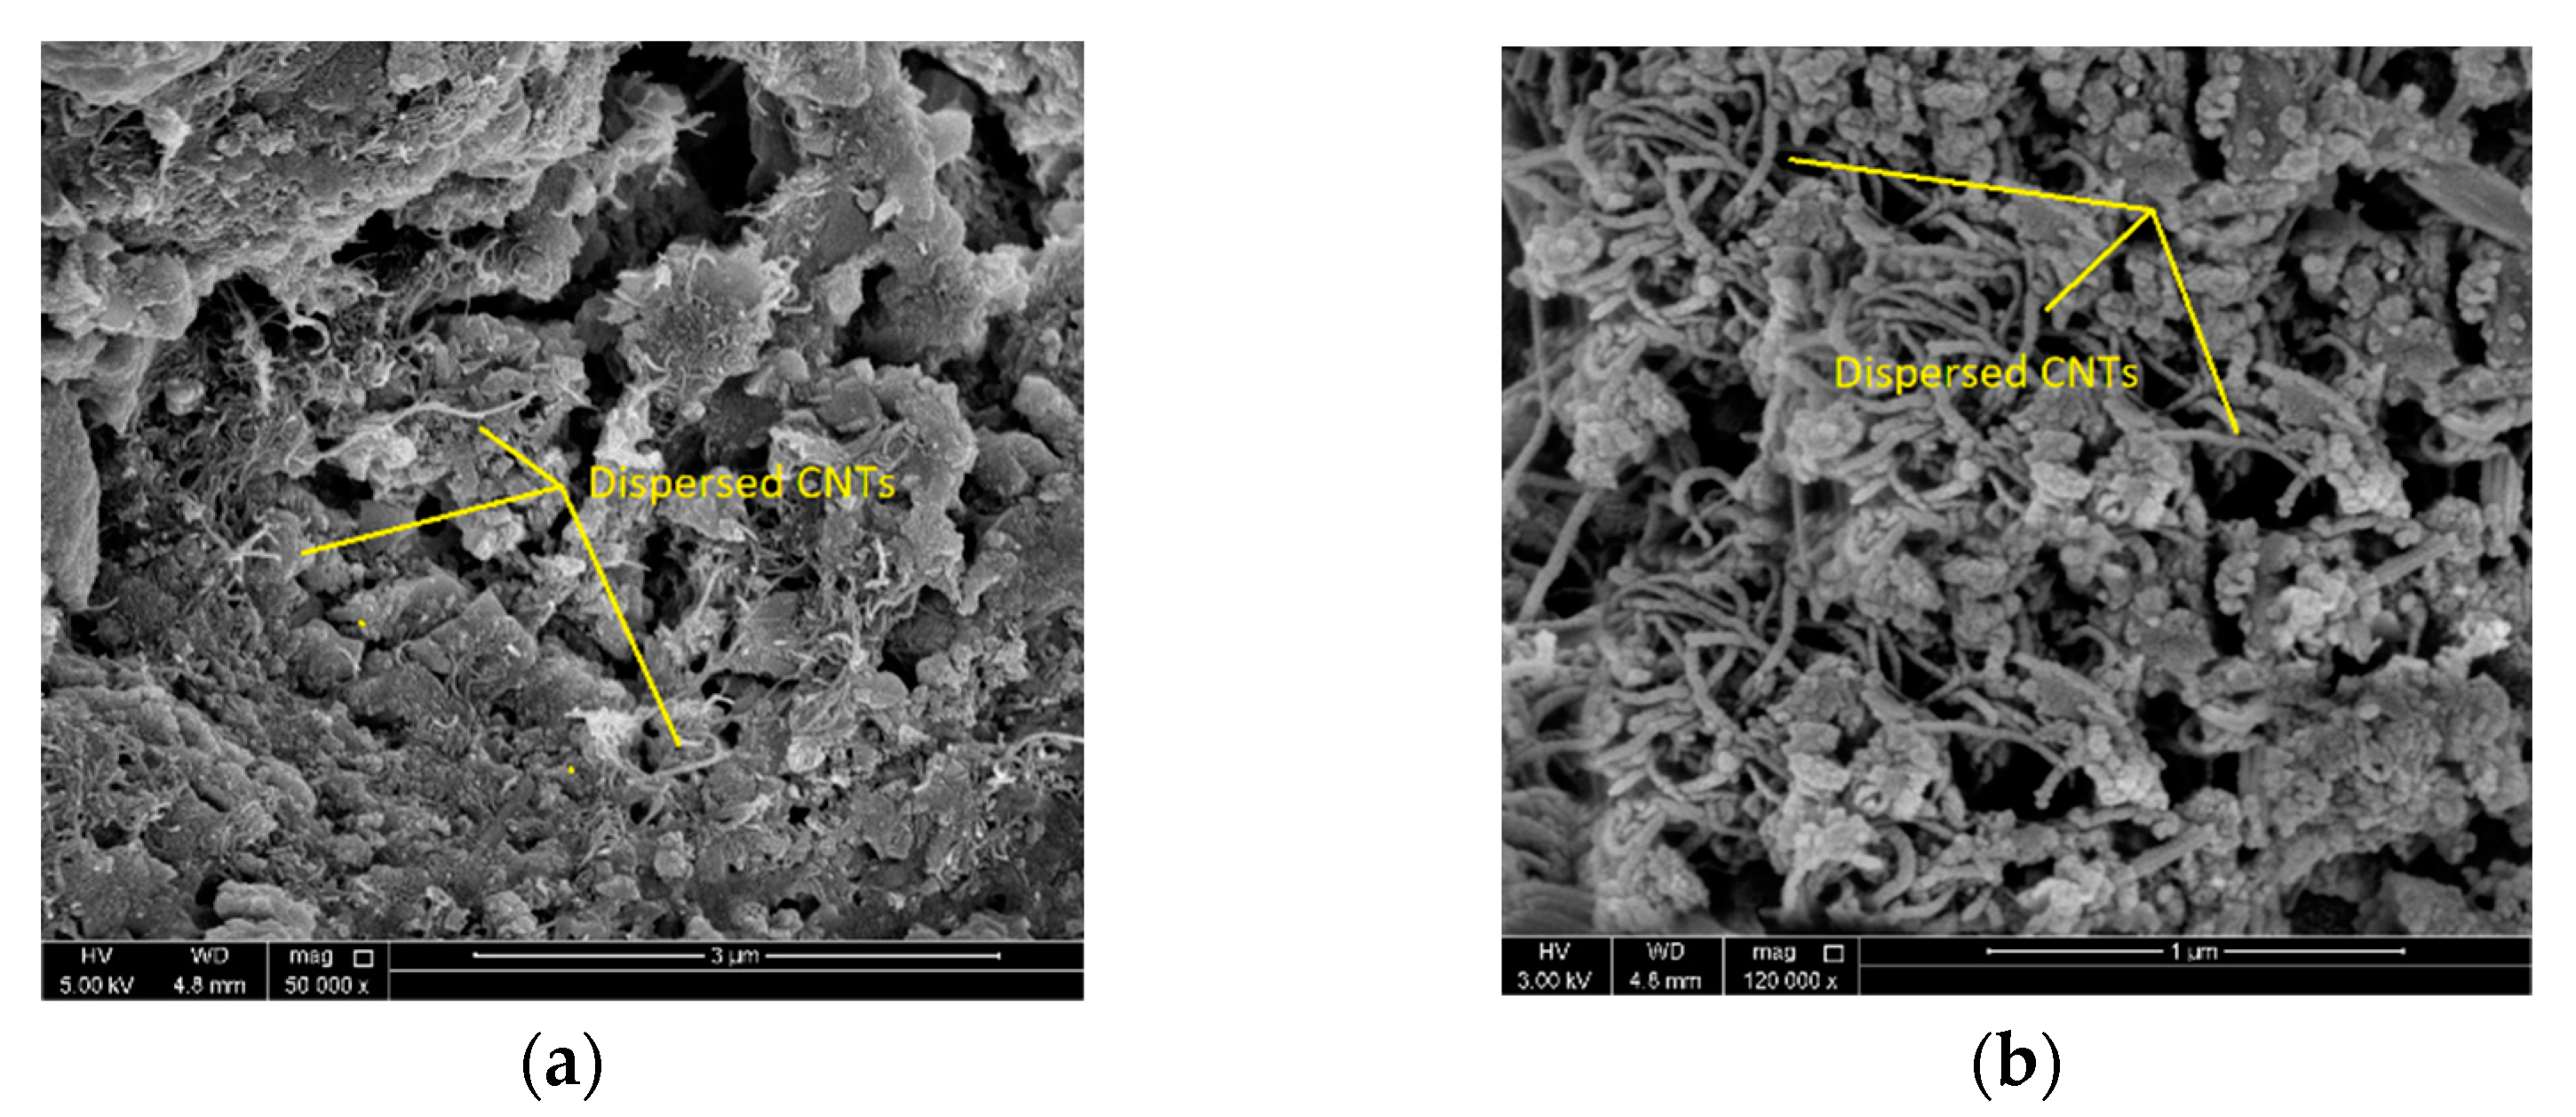
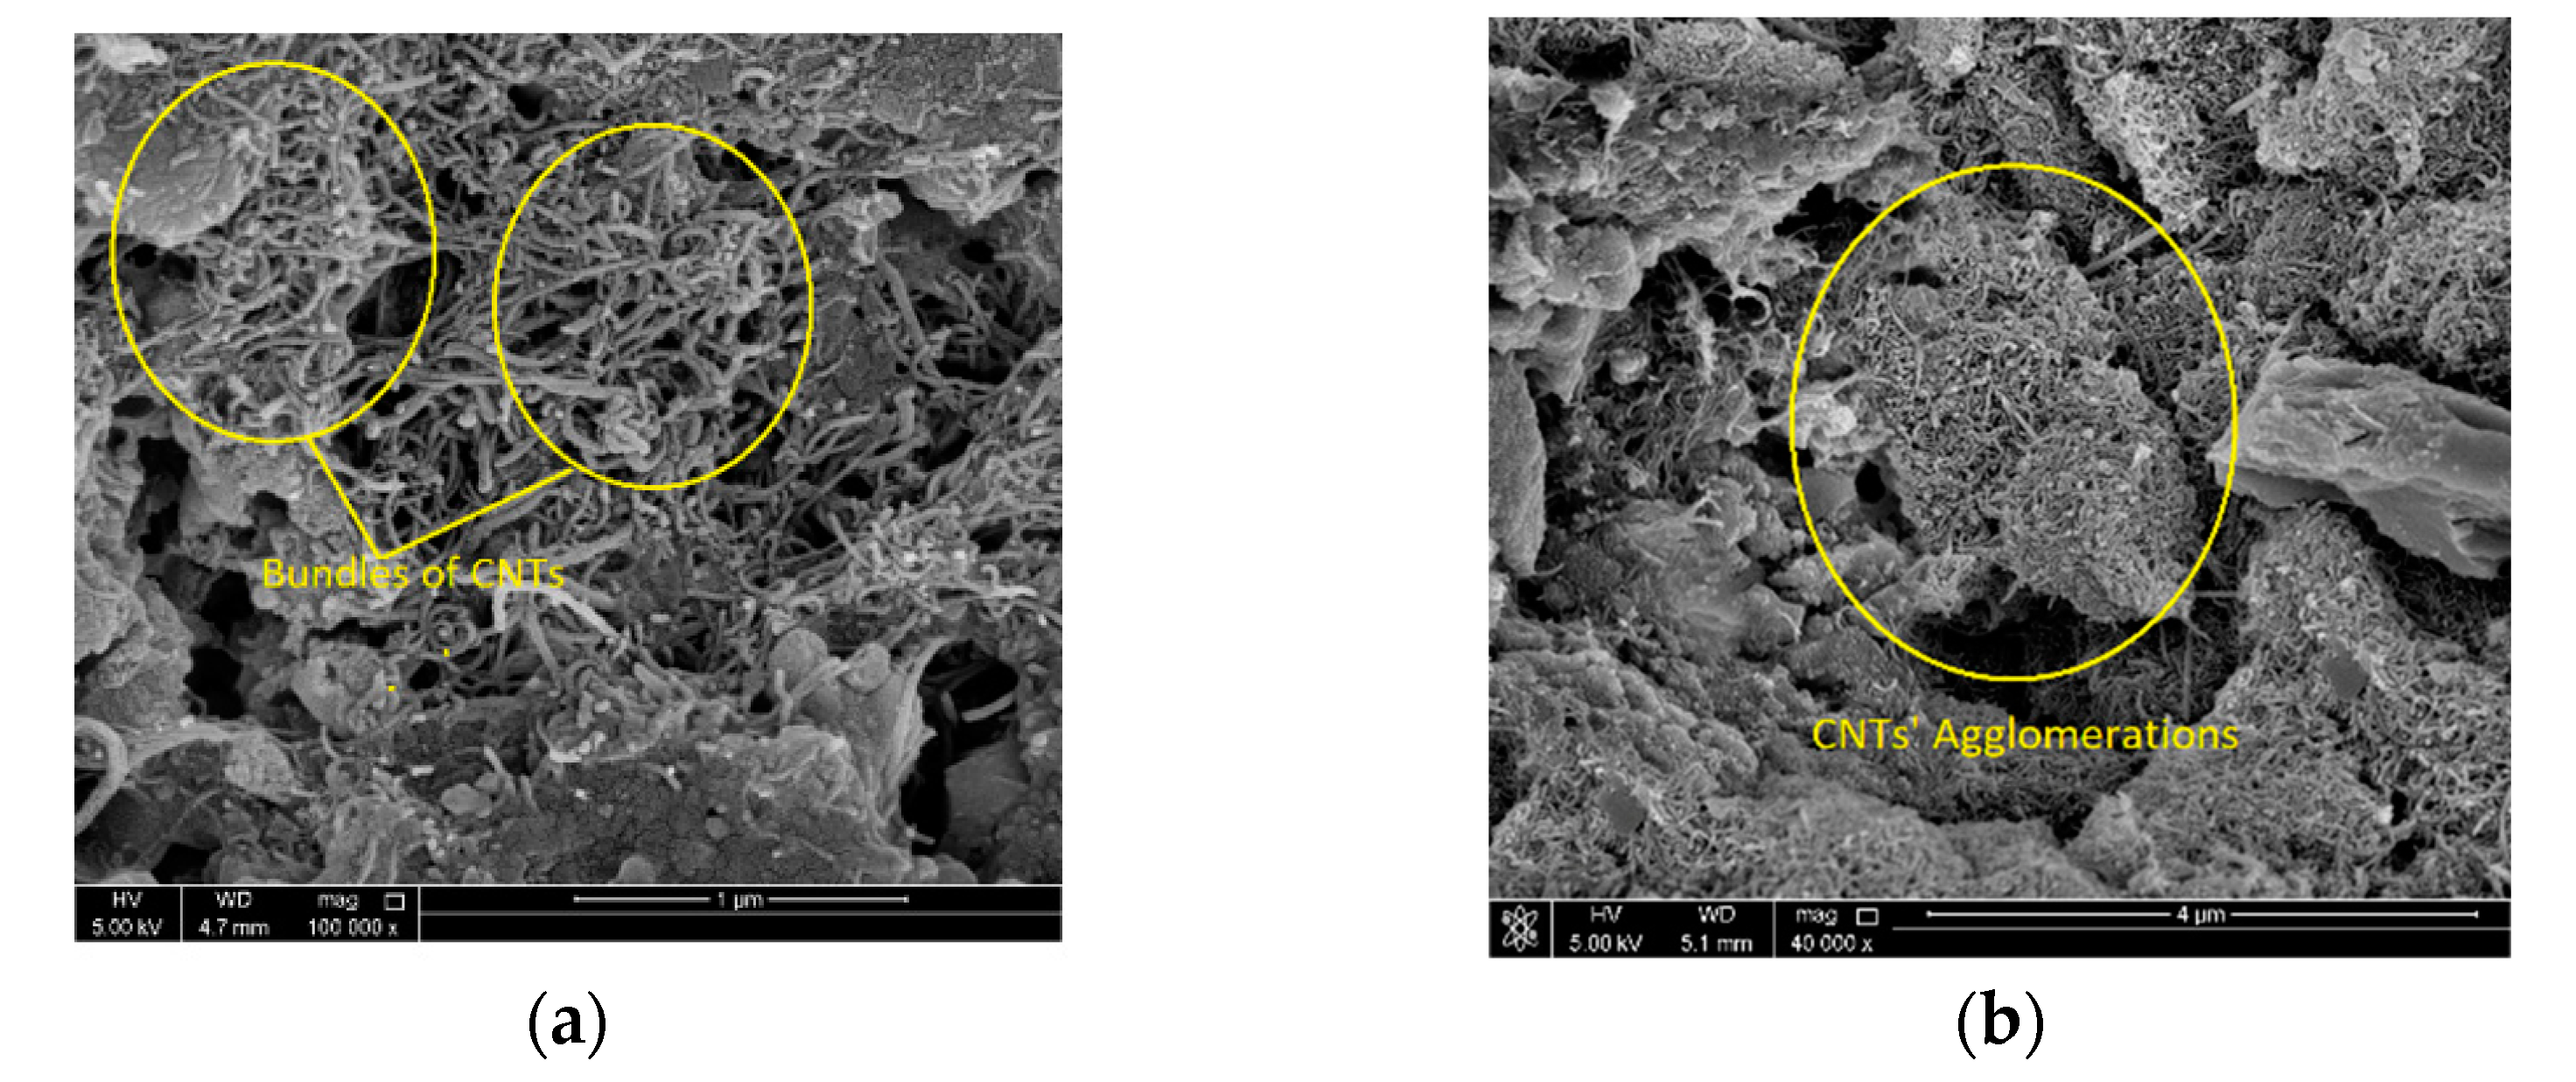
4.3. Microstructure Analysis

A microstructural examination highlighted a few observations about the nanofilaments’ dispersion, as well as the void presence qualities, using different surfactant contents. Figure 12 and Figure 13 illustrate the sample microstructures of the mixes containing 0, 0.08, 0.15 and 0.6 surfactant-to-cement ratios, respectively. It was noted during the imaging process that these mixes with less surfactant-to-cement amounts of 0%, 0.03% and 0.08% have good dispersion qualities and less void presence. No white crystals were spotted in these batches, indicating non-hydrated products. On the other hand, images taken at mixes containing 0.15 and 0.6 surfactant-to-cement ratios showed higher void contents compared to those with less surfactant content. This may be related to the surfactant overdosing in these mixes. This behavior was also observed in previous studies [3,4,16]. The presence of the voids in these mixes appears to be the reason for the strength reduction when the surfactant content was increased beyond a 0.08 surfactant-to-cement ratio. In terms of the CNTs’ weight fraction, the analysis showed that mixes with a lower CNT content of 0.075 and 0.225 wt. % showed good dispersion properties compared to the mixes having higher CNT contents of 0.375 and 0.625 wt. % (Figure 14). This is related to their ability to be dispersed using the performed sonication method. On the other hand, the SEM analysis showed CNT agglomerations at several locations in the mixes having 0.375 and 0.625 wt. % CNT contents (Figure 15). These agglomerations may act as weak points that result in material discontinuity, and hence a lower ability to transfer loads. Furthermore, the non-uniform distribution of the nanofilaments will not form an acceptable and constant network to prevent the expansion of cracks.

5. Conclusions and Recommendations

In this study, a method was developed to determine the optimum amount of surfactant needed to be added to CNTs/water solutions to provide an acceptable dispersion while achieving the highest matrix strength properties. The proposed method is applicable to any surfactant type used for CNTs’ dispersion. The proposed method consists of finding the remaining amount of surfactant in the water solution after the sonication process. It uses a chemical analysis procedure that includes filtration, centrifugal sedimentation, and ultraviolet spectroscopy. An example was presented to illustrate the determination of the effective surfactant needed to disperse long CNTs in cement/water solutions. Flexural and compressive tests were performed on cement paste samples prepared with varying surfactant amounts (i.e., 0.03%, 0.08%, 0.12%, 0.15%, 0.32%, and 0.60%). The results show a strong relationship between the surfactant’s consumption rate and the solution’s CNT weight fraction. The results also indicate that the surfactant’s consumption rate increased with an increase in the solution’s CNT weight fraction. Moreover, the results show that surfactant overdosing reduced the strength, and highlighted the need for using an optimum surfactant amount to preserve the overall matrix properties. Microstructural analysis using SEM showed the effect of the dispersion surfactant on the void percent at the micro- and nanoscale. Furthermore, the analysis highlighted the importance of controlling the amount of nanofilaments used to control the dispersion over the surrounding matrix. Despite of the viability of the proposed method in determining the effective surfactant amount, the chemical analysis results are very sensitive to the efficiency of the filtration process.
The following recommendations are proposed to further improve the proposed method:
  • The amount of surfactant in the CNT dispersion process should be selected carefully to account for the remaining amount in the solution after the sonication process;
  • The performance of UV tests should be done carefully as the absorbance results are very sensitive to the existence of CNTs in the solution at the time of measurement;
  • A practical and faster CNT filtration methodology should be used in order to determine the exact amount of surfactant remaining in the solution.

Author Contributions

Conceptualization, M.O.M.; Data curation, M.O.M.; Formal analysis, M.O.M. and R.A.T.; Funding acquisition, N.A.A.-N.; Investigation, M.O.M.; Methodology, M.O.M. and A.S.; Resources, M.A.-J.; Software, M.O.M.; Supervision, M.A.-J., N.A.A.-N. and R.A.T.; Validation, M.O.M. and A.S.; Writing—original draft, M.O.M.; Writing—review & editing, M.O.M., A.S. and R.A.T. All authors have read and agreed to the published version of the manuscript.

Funding

Qatar National Research Fund (QNRF) funded this work under the National Priority Research Program Award Program [NPRP 4-1142-2-440].

Institutional Review Board Statement

Not applicable.

Informed Consent Statement

Not applicable.

Data Availability Statement

The data used to support the findings of this study are available upon request from the corresponding author.

Acknowledgments

We thank Qatar National Research Fund (QNRF) for funding this work under the National Priority Research Program Award Program [NPRP 4-1142-2-440]. In addition, we thank Qatar National Library (QNL) for their support in publishing this article.

Conflicts of Interest

The authors declare that they have no known competing financial interests or personal relationships that could have appeared to influence the work reported in this paper.

References

  1. Cui, H.; Yan, X.; Monasterio, M.; Xing, F. Effects of Various Surfactants on the Dispersion of MWCNTs–OH in Aqueous Solution. Nanomaterials 2017, 7, 262. [Google Scholar] [CrossRef] [PubMed]
  2. Borode, A.O.; Ahmed, N.A.; Olubambi, P.A. Surfactant-aided dispersion of carbon nanomaterials in aqueous solution. Phys. Fluids 2019, 31, 071301. [Google Scholar] [CrossRef]
  3. Aiad, I. Influence of time addition of superplasticizers on the rheological properties of fresh cement pastes. Cem. Concr. Res. 2003, 33, 1229–1234. [Google Scholar] [CrossRef]
  4. Aiad, I.; El-Aleem, S.A.; El-Didamony, H. Effect of delaying addition of some concrete admixtures on the rheological properties of cement pastes. Cem. Concr. Res. 2002, 32, 1839–1843. [Google Scholar] [CrossRef]
  5. Shahzad, S.; Toumi, A.; Balayssac, J.-P.; Turatsinze, A.; Mazars, V. Cementitious composites incorporating Multi-Walled Carbon Nanotubes (MWCNTs): Effects of annealing and other dispersion methods on the electrical and mechanical properties. Matériaux Tech. 2022, 110, 104. [Google Scholar] [CrossRef]
  6. Shao, H.; Chen, B.; Li, B.; Tang, S.; Li, Z. Influence of dispersants on the properties of CNTs reinforced cement-based mate-rials. Constr. Build. Mater. 2017, 131, 186–194. [Google Scholar] [CrossRef]
  7. Inam, F.; Heaton, A.; Brown, P.; Peijs, T.; Reece, M.J. Effects of dispersion surfactants on the properties of ceramic–carbon nanotube (CNT) nanocomposites. Ceram. Int. 2014, 40, 511–516. [Google Scholar] [CrossRef]
  8. Sindu, B.; Sasmal, S. Properties of carbon nanotube reinforced cement composite synthesized using different types of surfactants. Constr. Build. Mater. 2017, 155, 389–399. [Google Scholar] [CrossRef]
  9. Xu, P.; Shi, L.; Huang, J.; Wang, C.; Zhang, Y.; Xu, H. Methods of dispersion and stabilization of several nanomaterials in water. Ferroelectrics 2018, 527, 133–148. [Google Scholar] [CrossRef]
  10. Metaxa, Z.S.; Boutsioukou, S.; Amenta, M.; Favvas, E.P.; Kourkoulis, S.K.; Alexopoulos, N.D. Dispersion of Multi-Walled Carbon Nanotubes into White Cement Mortars: The Effect of Concentration and Surfactants. Nanomaterials 2022, 12, 1031. [Google Scholar] [CrossRef]
  11. Collins, F.; Lambert, J.; Duan, W.H. The influences of admixtures on the dispersion, workability, and strength of carbon nanotube–OPC paste mixtures. Cem. Concr. Composites 2012, 34, 201–207. [Google Scholar] [CrossRef]
  12. Abu Al-Rub, R.; Tyson, B.M.; Yazdanbakhsh, A.; Grasley, Z. Mechanical Properties of Nanocomposite Cement Incorporating Surface-Treated and Untreated Carbon Nanotubes and Carbon Nanofibers. J. Nanomech. Micromech. 2012, 2, 1–6. [Google Scholar] [CrossRef]
  13. Tyson, B.M.; Abu Al-Rub, R.K.; Yazdanbakhsh, A.; Grasley, Z. Carbon Nanotubes and Carbon Nanofibers for Enhancing the Mechanical Properties of Nanocomposite Cementitious Materials. J. Mater. Civ. Eng. 2011, 23, 1028–1035. [Google Scholar] [CrossRef]
  14. Mohsen, M.O.; Al Ansari, M.S.; Taha, R.; Al Nuaimi, N.; Abu Taqa, A. Carbon Nanotube Effect on the Ductility, Flexural Strength, and Permeability of Concrete. J. Nanomater. 2019, 2019, 6490984. [Google Scholar] [CrossRef]
  15. Mohsen, M.; Al Ansari, M.; Taha, R.; Senouci, A.; AbuTaqa, A. Optimum Dispersion Parameters of Carbon Nanotubes: Concrete Strength by Response Surface Methodologies. In Proceedings of the International Conference on Civil Infrastructure and Construction, Doha, Qatar, 2–5 February 2020; Volume 1, pp. 298–307. [Google Scholar] [CrossRef]
  16. Mohsen, M.O.; Al-Nuaimi, N.; Al-Rub, R.K.A.; Senouci, A.; Bani-Hani, K.A. Effect of mixing duration on flexural strength of multi walled carbon nanotubes cementitious composites. Constr. Build. Mater. 2016, 126, 586–598. [Google Scholar] [CrossRef]
  17. Mohsen, M.O.; Taha, R.; Abu Taqa, A.; Al-Nuaimi, N.; Abu Al-Rub, R.; Bani-Hani, K.A. Effect of Nanotube Geometry on the Strength and Dispersion of CNT-Cement Composites. J. Nanomater. 2017, 2017, 6927416. [Google Scholar] [CrossRef]
  18. Mohsen, M.O.; Alansari, M.; Taha, R.; Senouci, A.; Abutaqa, A. Impact of CNTs’ treatment, length and weight fraction on ordinary concrete mechanical properties. Constr. Build. Mater. 2020, 264, 120698. [Google Scholar] [CrossRef]
  19. Mohsen, M.; Taha, R.; Abu Taqa, A.; Shaat, A. Optimum carbon nanotubes’ content for improving flexural and compressive strength of cement paste. Constr. Build. Mater. 2017, 150, 395–403. [Google Scholar] [CrossRef]
  20. Sobolkina, A.; Mechtcherine, V.; Khavrus, V.; Maier, D.; Mende, M.; Ritschel, M.; Leonhardt, A. Dispersion of carbon nanotubes and its influence on the mechanical properties of the cement matrix. Cem. Concr. Compos. 2012, 34, 1104–1113. [Google Scholar] [CrossRef]
  21. Swinehart, D.F. The beer-lambert law. J. Chem. Educ. 1962, 39, 333. [Google Scholar] [CrossRef]
  22. ASTM C348-14; Standard Test Method for Flexural Strength of Hydraulic-Cement Mortars. ASTM International: West Conshohocken, PA, USA, 2014; 6p.
  23. ASTM C109/C109M-16a; Standard Test Method for Compressive Strength of Hydraulic Cement Mortars (Using 2-in. or [50-mm] Cube Specimens). ASTM International: West Conshohocken, PA, USA, 2020; 10p.
  24. Konsta-Gdoutos, M.S.; Metaxa, Z.S.; Shah, S.P. Multi-scale mechanical and fracture characteristics and early-age strain capacity of high performance carbon nanotube/cement nanocomposites. Cem. Concr. Compos. 2010, 32, 110–115. [Google Scholar] [CrossRef]
  25. Chandra, S.; Björnström, J. Influence of cement and superplasticizers type and dosage on the fluidity of cement mortars—Part I. Cem. Concr. Res. 2002, 32, 1605–1611. [Google Scholar] [CrossRef]
  26. Metaxa, Z.; Konsta-Gdoutos, M.; Shah, S. Carbon Nanotubes Reinforced Concrete. Nanotechnology of Concrete: The Next Big Thing Is Small; ACI Special Publications: Farmington Hills, MI, USA, 2009; Volume 267, pp. 11–20. [Google Scholar]
  27. Al-Rub, R.K.A.; Ashour, A.I.; Tyson, B.M. On the aspect ratio effect of multi-walled carbon nanotube reinforcements on the mechanical properties of cementitious nanocomposites. Constr. Build. Mater. 2012, 35, 647–655. [Google Scholar] [CrossRef]
Figure 1. Surfactant molecule concentrations on a CNT surface: (a) low concentration; (b) balanced concentration, and (c) overdosed concentration [19].
Sustainability 14 12433 g001
Figure 2. Schematic representation of absorbance calculation stages: (a) stage 1—CNTs + water only; (b) stage 2—CNT + water + surfactant before sonication; and (c) stage 3CNT + water + surfactant after sonication.
Sustainability 14 12433 g002
Figure 3. (a) Mechanical properties testing machine, (b) ultrasonic wave mixer, (c) centrifuge device and (d) UV/Vis spectrophotometer.
Sustainability 14 12433 g003
Figure 4. (a) Filtration process; (b) solutions of 0.15% content before sonication, after sonication, and after filtration.
Sustainability 14 12433 g004
Figure 5. The 28th-day cement paste flexural strength versus surfactant concentration.
Sustainability 14 12433 g005
Figure 6. The 28th-day cement paste compressive strength versus surfactant concentration.
Sustainability 14 12433 g006
Figure 7. Calibration curve for water and surfactant solutions.
Sustainability 14 12433 g007
Figure 8. Surfactant consumption rate versus CNT content.
Sustainability 14 12433 g008
Figure 9. Remaining surfactant amount after sonication.
Sustainability 14 12433 g009
Figure 10. Relationship between η factor and CNT-to-water weight fraction.
Sustainability 14 12433 g010
Figure 11. Effective versus original surfactant concentrations.
Sustainability 14 12433 g011
Figure 12. SEM images showing voids in (a) plain cement paste, and (b) a mix containing a 0.08 surfactant-to-cement ratio.
Sustainability 14 12433 g012
Figure 13. SEM images showing voids in (a) a mix containing a 0.15 surfactant-to-cement ratio, and (b) a mix containing a 0.6 surfactant-to-cement ratio.
Sustainability 14 12433 g013
Figure 14. SEM images showing CNT weight fractions of (a) 0.075 wt. % CNTs and (b) 0.225 wt. % CNTs.
Sustainability 14 12433 g014
Figure 15. SEM images showing CNT weight fractions of (a) 0.375 wt. % CNTs and (b) 0.625 wt. % CNTs.
Sustainability 14 12433 g015
Table 1. CNTs’ physical properties.
Aspect RatioPurity
(wt. %)
Outside Diameter
(nm)
Inside Diameter
(nm)
Length
(μm)
SSA
m2/g
Ash
(wt. %)
ColorElectrical Conductivity
(s/cm)
True Density
(g/cm3)
Manufacturing Method
1333>9510–20 nm5–10 nm10–30 um>200<1.5Black>100~2.1CVD
Table 2. Mechanical properties testing matrix.
BatchSurfactant/Cement Weight Fraction (%)Specimen No.w/cFlexural
Strength (MPa)
Compressive
Strength (MPa)
00 (Conrol)Sa1-Sa50.4Fs = 0.0028 PCs = P/A
10.03S1-S6
20.08S7-S12
30.12S13-S18
40.15S19-S24
50.32S25-S30
60.60S31-S36
Table 3. Chemical analysis test matrix.
SolutionCNT/Water
(%)
Surfactant/Water
(%)
Water Weight
(gm)
10.0750.31000
20.2250.91000
30.3751.51000
40.6252.51000
Table 4. Absorbance and concentration results.
SolutionStage 1Stage 2Stage 3
Blank (Water + CNTs)Before Sonication (Water + CNTs + S)After Sonication (Water + CNTs + S)
Abs1Conc. (%)Abs. 2Abs. 2–Abs. 1Conc. (%)Abs. 3Abs. 3–Abs. 1Conc. (%)
10.00820.01100.05800.04980.32620.04170.03350.1926
20.00890.01110.12600.11710.87790.06820.05930.4041
30.00940.01110.21400.20461.59510.06140.05200.3443
40.00970.01120.33400.32432.57620.05510.04540.2902
Table 5. Surfactant original and predicted concentrations.
SolutionCNT/Water
(wt. %)
Original Concentration (wt. %)Predicted Concentration Using Chemical Analysis Method
(wt. %)
Error
(%)
10.0750.300.338.74
20.2250.900.882.46
30.3751.501.606.34
40.6252.502.583.05
Publisher’s Note: MDPI stays neutral with regard to jurisdictional claims in published maps and institutional affiliations.

