Article

An Integrated Framework for the Quantification of Road Network Seismic Vulnerability and Accessibility to Critical Services

by
Ahmad Mohamad El-Maissi
1,
Sotirios A. Argyroudis
2,
Moustafa Moufid Kassem
1,
Lee Vien Leong
1 and
Fadzli Mohamed Nazri
1,*
1
School of Civil Engineering, Engineering Campus, Universiti Sains Malaysia, Nibong Tebal, Penang 14300, Malaysia
2
Department of Civil and Environmental Engineering, College of Engineering, Design and Physical Sciences, Brunel University, Uxbridge, London UB8 3PH, UK
*
Author to whom correspondence should be addressed.
Sustainability 2022, 14(19), 12474; https://doi.org/10.3390/su141912474
Submission received: 18 August 2022 / Revised: 8 September 2022 / Accepted: 26 September 2022 / Published: 30 September 2022
(This article belongs to the Special Issue Sustainable Planning and Preparedness for Emergency Disasters)

Abstract

:
Road networks are regarded as the backbone of transportation systems, which play an important role in the social and economic prosperity of societies. Due to this reason, it is crucial to develop road networks with higher resiliency rates to operate normally during earthquake incidents. In the last decades, the research that tackled the management of disasters for road networks gained great attention, in particular by developing various seismic vulnerability assessment models. Most of those models study a single criterion, e.g., physical damage of road assets, traffic disruption, and/or functionality loss of the network without taking into consideration the combination of different vulnerability criteria. The proposed framework is part of the global seismic vulnerability assessment models that combine fragility functions and vulnerability indices, which is demonstrated by an application in a road network in the city of Penang in Malaysia. In the first step, the fragility functions are developed where their results are used to calculate the Seismic Vulnerability Index (SVI) for roadways by weighting the main investigated parameters. This is followed by investigating the Accessibility Index (AI) model that is employed to assess the accessibility of targeted districts within the investigated area. Subsequently, an integrated approach is employed to generate the emergency evacuation maps to critical service centres by referring to the correlations between vulnerability and the accessibility rates. In conclusion, the results of this study integrate engineering judgment and numerical models to create a comparative study for assessing the performance of road networks and to validate the significance of an integrated seismic assessment on various critical societal sectors, such as improving emergency accessibility and implementing better mitigation strategies for communities living in disaster-prone areas.

1. Introduction

Recent earthquakes affecting the life and economic prosperity of humans has raised a lot of concerns about the reliability of road networks and their elements. Moreover, earthquakes can disturb the evacuation and rescue process in a specific region. Due to these facts, different approaches have been proposed to evaluate and mitigate the earthquake-related risks for these systems. In particular, the assessment of road networks under seismic incidents has become a crucial approach in response to recent earthquakes [1]. This assessment approach mainly helps in achieving one of the main goals of disaster management, which is to limit the effect of disasters by implementing better natural disaster security measures and emergency strategies [2]. In this respect, the integrated vulnerability assessment approach for road networks, which takes into consideration the accessibility to critical services such as hospitals, firefighting stations, and open spaces, is considered essential.
Even though the resulting damage to road networks due to earthquakes cannot be precisely predicted, a preventative procedure can be implemented. This procedure is an assessment of the risks that can endanger road network systems, which would consequently reduce disturbance. Therefore, a precise estimation of the degree of the seismic hazard and its effects is considered a challenge encountered during this assessment. This is mainly because a road network is extended over a large area, compared with a specific structure, e.g., a building, where the risk is considered site-specific, and thus in the case of networks the effects of a natural disaster may be more severe. Additionally, the accuracy of seismic hazard assessment can be reduced because several network elements are exposed to diverse geotechnical conditions and variable levels of seismic intensity [3,4].
Previous studies that have assessed the seismic vulnerability of road networks tackle a single criterion, such as the physical damage of roadway assets, traffic disruption, and/or loss of functionality for road networks are categorized in Figure 1. For instance, the Accessibility Index (AI) considers the vulnerability of the network by calculating the relative accessibility and linkage between the network nodes. This index is typically based on two measures, i.e., the travel distance and time [5,6,7,8,9,10,11]. In addition, the link importance index focuses on the criticality of road elements inside a road network [12,13,14,15,16,17,18,19,20,21].
Additionally, the loss estimation and quantitative risk analysis commonly rely on fragility functions, which correlate a given intensity measure with damage probability [22,23,24,25,26,27,28] and vulnerability indexes [29,30,31,32]. For further details on the applications for seismic vulnerability assessment models, refer to El Maissi et al. [33].
Figure 1. Applications for seismic vulnerability assessment models with respect to travel time distance [5,6,7,8,9,10,11], link importance index [12,13,14,15,16], and vulnerability index [22,28] and fragility functions [29,30,31,32].
Sustainability 14 12474 g001
Nonetheless, the studies that takes into consideration the correlation between asset damage, functionality, and network traffic, within risk assessment models that concentrate on multiple criteria aspects, are limited. Moreover, specifying and prioritizing the seismic performance for road networks using seismic vulnerability assessment models is considered an important step in enhancing the resilience of the network following a major earthquake event [34].
Various research have addressed the physical seismic vulnerability and reliability assessment for different types of critical infrastructures such as roadway systems and bridges [35,36]. For instance, O’Reilly et al. [37] conducted a study on a sample of existing school buildings in Italy to assess the seismic vulnerability and estimate the losses by developing a model that relies on the collected data from site examinations to precisely develop the dynamic analysis for these school structures. Additionally, Kassem et al. [38] developed an analytical framework to investigate the seismic behaviour of hospital and school reinforced concrete buildings in Malaysia, where the authors proposed a Seismic Vulnerability Index by using nonlinear parametric analysis for prioritizing the damage to buildings. Zanini, et al. [39] developed a probabilistic seismic risk framework to forecast the economic losses based on the vulnerability of bridges. The frameworks assess 500 different bridges in Veneto region, Italy. The authors reached an interesting conclusion that illustrated significant discrepancies between average annual losses. Moreover, Ertugay, et al. [40] provided an accessibility model based on the road closure probabilities, where the results are drawn in maps showing the main effect of the earthquake scenarios on specified shelter site accessibility.
Mainly, improving accessibility by specifying the main emergency evacuation corridors that can be used after earthquakes is considered a crucial point in seismic vulnerability assessment. In this respect, the assessment of road networks during earthquakes is considered a critical process to improve urban resilience and enhance emergency accessibility by 40% by considering suitable reliability measures for emergencies [36]. The evacuation process is classified into two main categories, which are short-notice and no-notice evacuation. The categories are typically based on the type of threat and its level [41].
To improve the accessibility to emergency facilities a disaster management plan should be developed by taking into consideration the link between different phases of the disaster management cycle [42,43]. The latter consists mainly of five phases, which are prevention, mitigation, preparedness, response, and recovery. In the case of Malaysia, disaster risk management that can operate efficiently in all phases has been developed through different agencies such as National Disaster Management Agency (NADMA), State Disaster Management, and Relief Committee (SDMRC) [44].
However, more effort is needed to overcome the main challenges such as the integration of immediate rescue responses and developing the readiness to sustain the number of emergency facilities [45]. In addition, more focus should be provided to the mitigation of road networks since this can improve the accessibility to healthcare centres [44]. Moreover, Barnes, et al. [46] argued that even the developed countries including the USA and European countries need to employ more advanced disaster management methods in the future to improve preparedness when facing natural hazards, regarding critical infrastructure. Although the main studies that assess the vulnerability of road networks are increasing, the number of studies that integrate the physical vulnerability of transportation systems in the accessibility modelling process is considered limited.
Many researchers have conducted AI models to identify the accessibility scores of roads in specific road networks based on various scales and aspects of analysis. One of the first studies that conducted the AI is the Hansen Index which was presented by Hansen [8]. This index was conducted by evaluating the accessibility spatial separation ratios and supply–demand ratios. The assessment of the relative accessibility of road networks needs a big data analytics approach and hence, the ArcGIS platform (Esri, Redlands, CA, USA) provides a useful tool for conducting spatial analysis models. Moreover, the use of ArcGIS facilitates the development of land use accessibility maps because it correlates the decision support methodology (AHP) with efficient visualization and mapping [47,48].
The main ArcGIS-based approaches that are used to assess accessibility are: (1) zone-based approach, (2) isochrone-based approach, and (3) raster-based approach. Bono and Gutiérrez [49] conducted a network-based analysis that assesses the accessibility of road networks in Haiti by using a raster-based model. The research combined simple graph theory perceptions and ArcGIS-based spatial analysis during earthquakes. Moreover, Ertugay, et al. [40] provided an accessibility model based on the road closure probabilities, where the results are drawn in maps showing the main effect of the earthquake scenarios on specified shelter site accessibility. It was noticed that most of the previous studies focus on building accessibility models without relating it to analytical assessment of physical damage to roadways and their assets, so it is essential to conduct an integrated approach that correlates the SVI with AI for achieving more precise results that are based on real earthquake events.
It is important to identify and analyse the unforeseen hazard scenarios of road performances to acquire big data analytics that help in implementing better natural disaster security measures and solutions, which can reduce losses [50,51,52]. The impacts following an earthquake should account for the properties of the system such as the configuration of the road network and characteristics of roads, e.g., locations, traffic capacities, and redundancies. However, transport agencies do not always account for the impact of seismic damage on traffic conditions in their risk reduction studies and mitigation planning [53]. This research tackles significantly the seismic vulnerability assessment of road sections where other structural assets in road network, e.g., bridges, tunnels, and retaining walls are not being assessed and do not appear in the investigated network and are described elsewhere [54,55].
Looking at these facts shows the importance of developing an integrated seismic vulnerability assessment model for road networks. In this respect, this paper proposes an integrated framework that includes three main stages: (1) Seismic Vulnerability Index (SVI) for road networks and their assets, (2) traffic disruption assessment, and (3) building integrated transport performance maps pre-and post-earthquake conditions. Each stage is addressed in a specific section with a detailed explanation for all the steps for these stages. The proposed framework aims toward a higher fidelity assessment procedure. Thus, it may be used in the evaluation process of seismic performance for road networks and to inform efficient emergency planning. The framework is shown through a case study in the city of Penang in Malaysia.

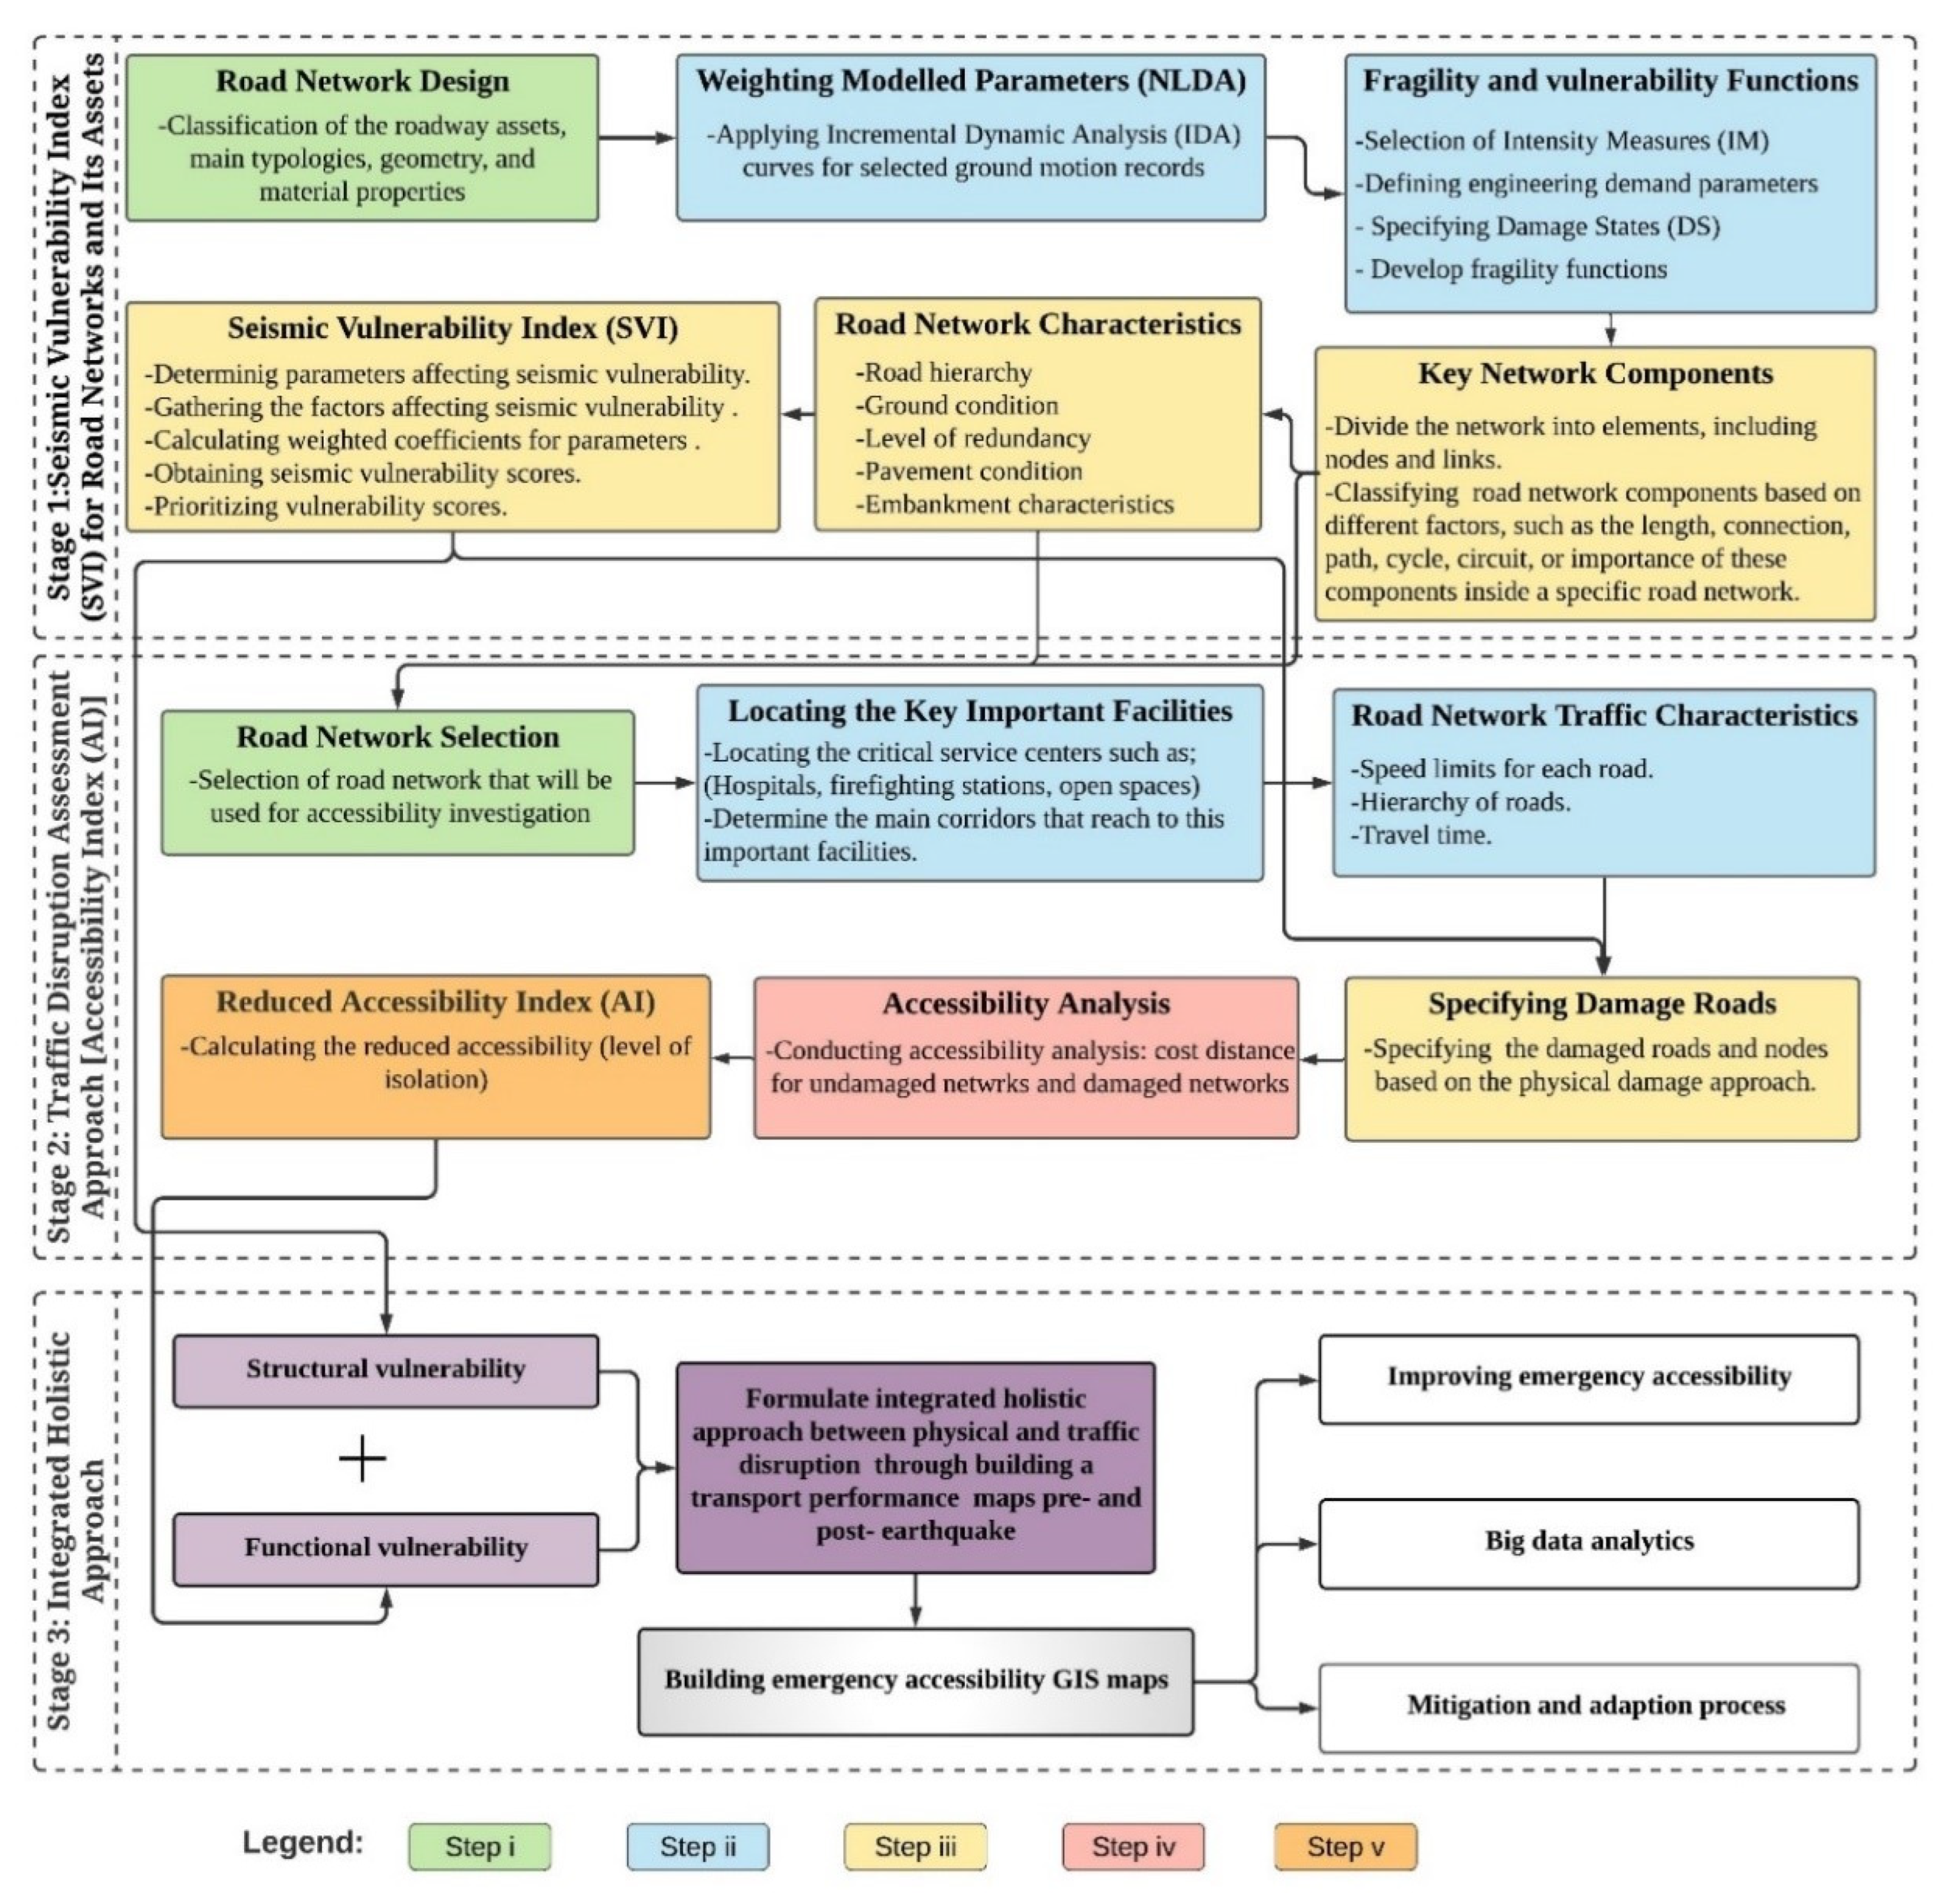
2. Integrated Framework for Road Network Vulnerability Assessment

Vulnerability assessment can be conducted at an asset or network level. Assessment at the asset level focuses on the damage degree for specific assets exposed to given intensity measures using fragility functions and/or vulnerability indexes. At a network level, available models commonly study traffic-based aspects of the network functionality, e.g., accessibility index and link importance index [33]. Various studies evaluated the vulnerability of road networks and their elements by tackling single criteria, without considering how physical damage might affect traffic and functionality of the network, through models that are based on multi-criteria approaches [56].
Many studies consider the function of single assets in the transportation system and neglect the effect of the System of Assets [57]. Moreover, several approaches assess the consistency and useability of roadway systems that are subjected to an earthquake, but most of these systems deal only with the possibility of physical or functionality damage and do not deliver any information on the pre-disaster performance of each structural component in the system [58]. Hence, an integrated framework for road network vulnerability is considered a necessity in transport infrastructure risk management.
This section represents the main methodology for building the framework of this research, which includes three main stages: In stage 1 the physical damage is assessed by following three main steps. In step (i), the road network is set up based on the classification of its assets considering various aspects such as the linkage between nodes, the length of the links, or the role of the components within the network. This is followed by developing the Seismic Vulnerability Index (SVI) through selecting the main modelled parameters, which are classified into four main parameters: embankments (P1), pavement strength (P2), ground condition (P3), and road width (P4). Afterward, the vulnerability classification is categorized. In step (ii) a Non-Linear Dynamic Analysis (NLDA) is conducted based on various selected ground motion records to generate fragility curves, which are used to weight the modelled parameters (P1, P2, P3, and P4). This step helps in prioritizing the parameters from the most to the least essential one, based on the results of the fragility functions for the roads. In step (iii) of this stage, the SVI can be calculated, and each road has a specific vulnerability score. This is followed by stage 2 which focuses on traffic assessment by calculating the Accessibility Index (AI) of road networks based on the results of the physical damage assessment in stage 1. This stage is aiming to specify and prioritize emergency accessibility by identifying the main emergency evacuation corridors. Finally, in stage 3, the transport performance maps before and after earthquakes are built based on an integration between the first two stages of this framework. All the stages are described in one master flowchart shown in Figure 2. Each stage is described in detail in the following sections.

2.1. Stage 1: Seismic Vulnerability Index (SVI) for Road Networks and Their Assets

In the SVI method, various parameters and weighting factors are used to rate the assets of the roadway. This method is mainly used to assess and rank the assets based on their vulnerability level, aiming to prioritize the asset that needs a more detailed assessment before any mitigating measures are applied. SVI can be assessed based on the intrinsic (e.g., pavement, embankments, and soil beneath roads) or extrinsic (e.g., surrounding buildings and bridges) elements characteristics [15,59,60]. The proposed framework focuses on the main structural characteristics of the transportation systems (intrinsic characteristics). The number of assessed parameters is selected based on vulnerability type (physical or traffic-based aspect) under investigation and the perspective (intrinsic or extrinsic) of this SVI.
Francini et al. [15] developed an SVI that evaluates the seismic performance of various roadway assets in urban areas. The study is conducted in Italy, where it focused on four main parameters which are: (i) road length, (ii) road width, (iii) level of redundancy for the road, and (iv) critical components. The SVI is calculated based on Equation (1):
I v j = i = 1 n w i P a i
where I v j is the Vulnerability Index of the j-th alternative road, w i is the weight related to the i-th parameter, P a i is the i-th parameter, and n = 1   to   4 .
Moreover, Adafer and Bensaibi [29] investigated the vulnerability of roadway systems in Algeria, through formulating a Vulnerability Index (VI) method. The method depends mainly on the expert and judgmental view based on past earthquake incidents where different factors are weighted using Analytical Hierarchy Process (AHP) to calculate the VI, which is calculated using Equation (2):
V I = i = 1 2 W i j = 1 3   o r   4 W i j k = 1 2   o r   3 W i j k . C i j k 1
where W i is the weighting coefficient of the studied parameter, W i j is the weighting coefficient of item, W i j k is the weighting coefficient of factor, and C i j k l is the score of the factors, where l = 2, 3, 4, or 5.
Vulnerability assessments using the different models in previous studies revealed significant variations due to different assumptions and weighting factors as described in Equations (1) and (2). This controversial variation in SVI values is a result of the modification of the parameters used and their weighting score coefficient [15,29].
The variation in the results shows the importance of enabling a more reliable assessment method of the SVI. The first stage of the framework in the present study advances previous models by providing a new weighting approach for the vulnerability parameters of the investigated structural roadway components by implementing an analytical approach with respect to NLDA. This stage helps in specifying the main damage level of the assets for roads and in prioritizing the assets that affect the SVI scores significantly. The framework that is suggested focuses on road embankments and pavements, but it can also be used for other types of assets including bridges, tunnels, and retaining walls.

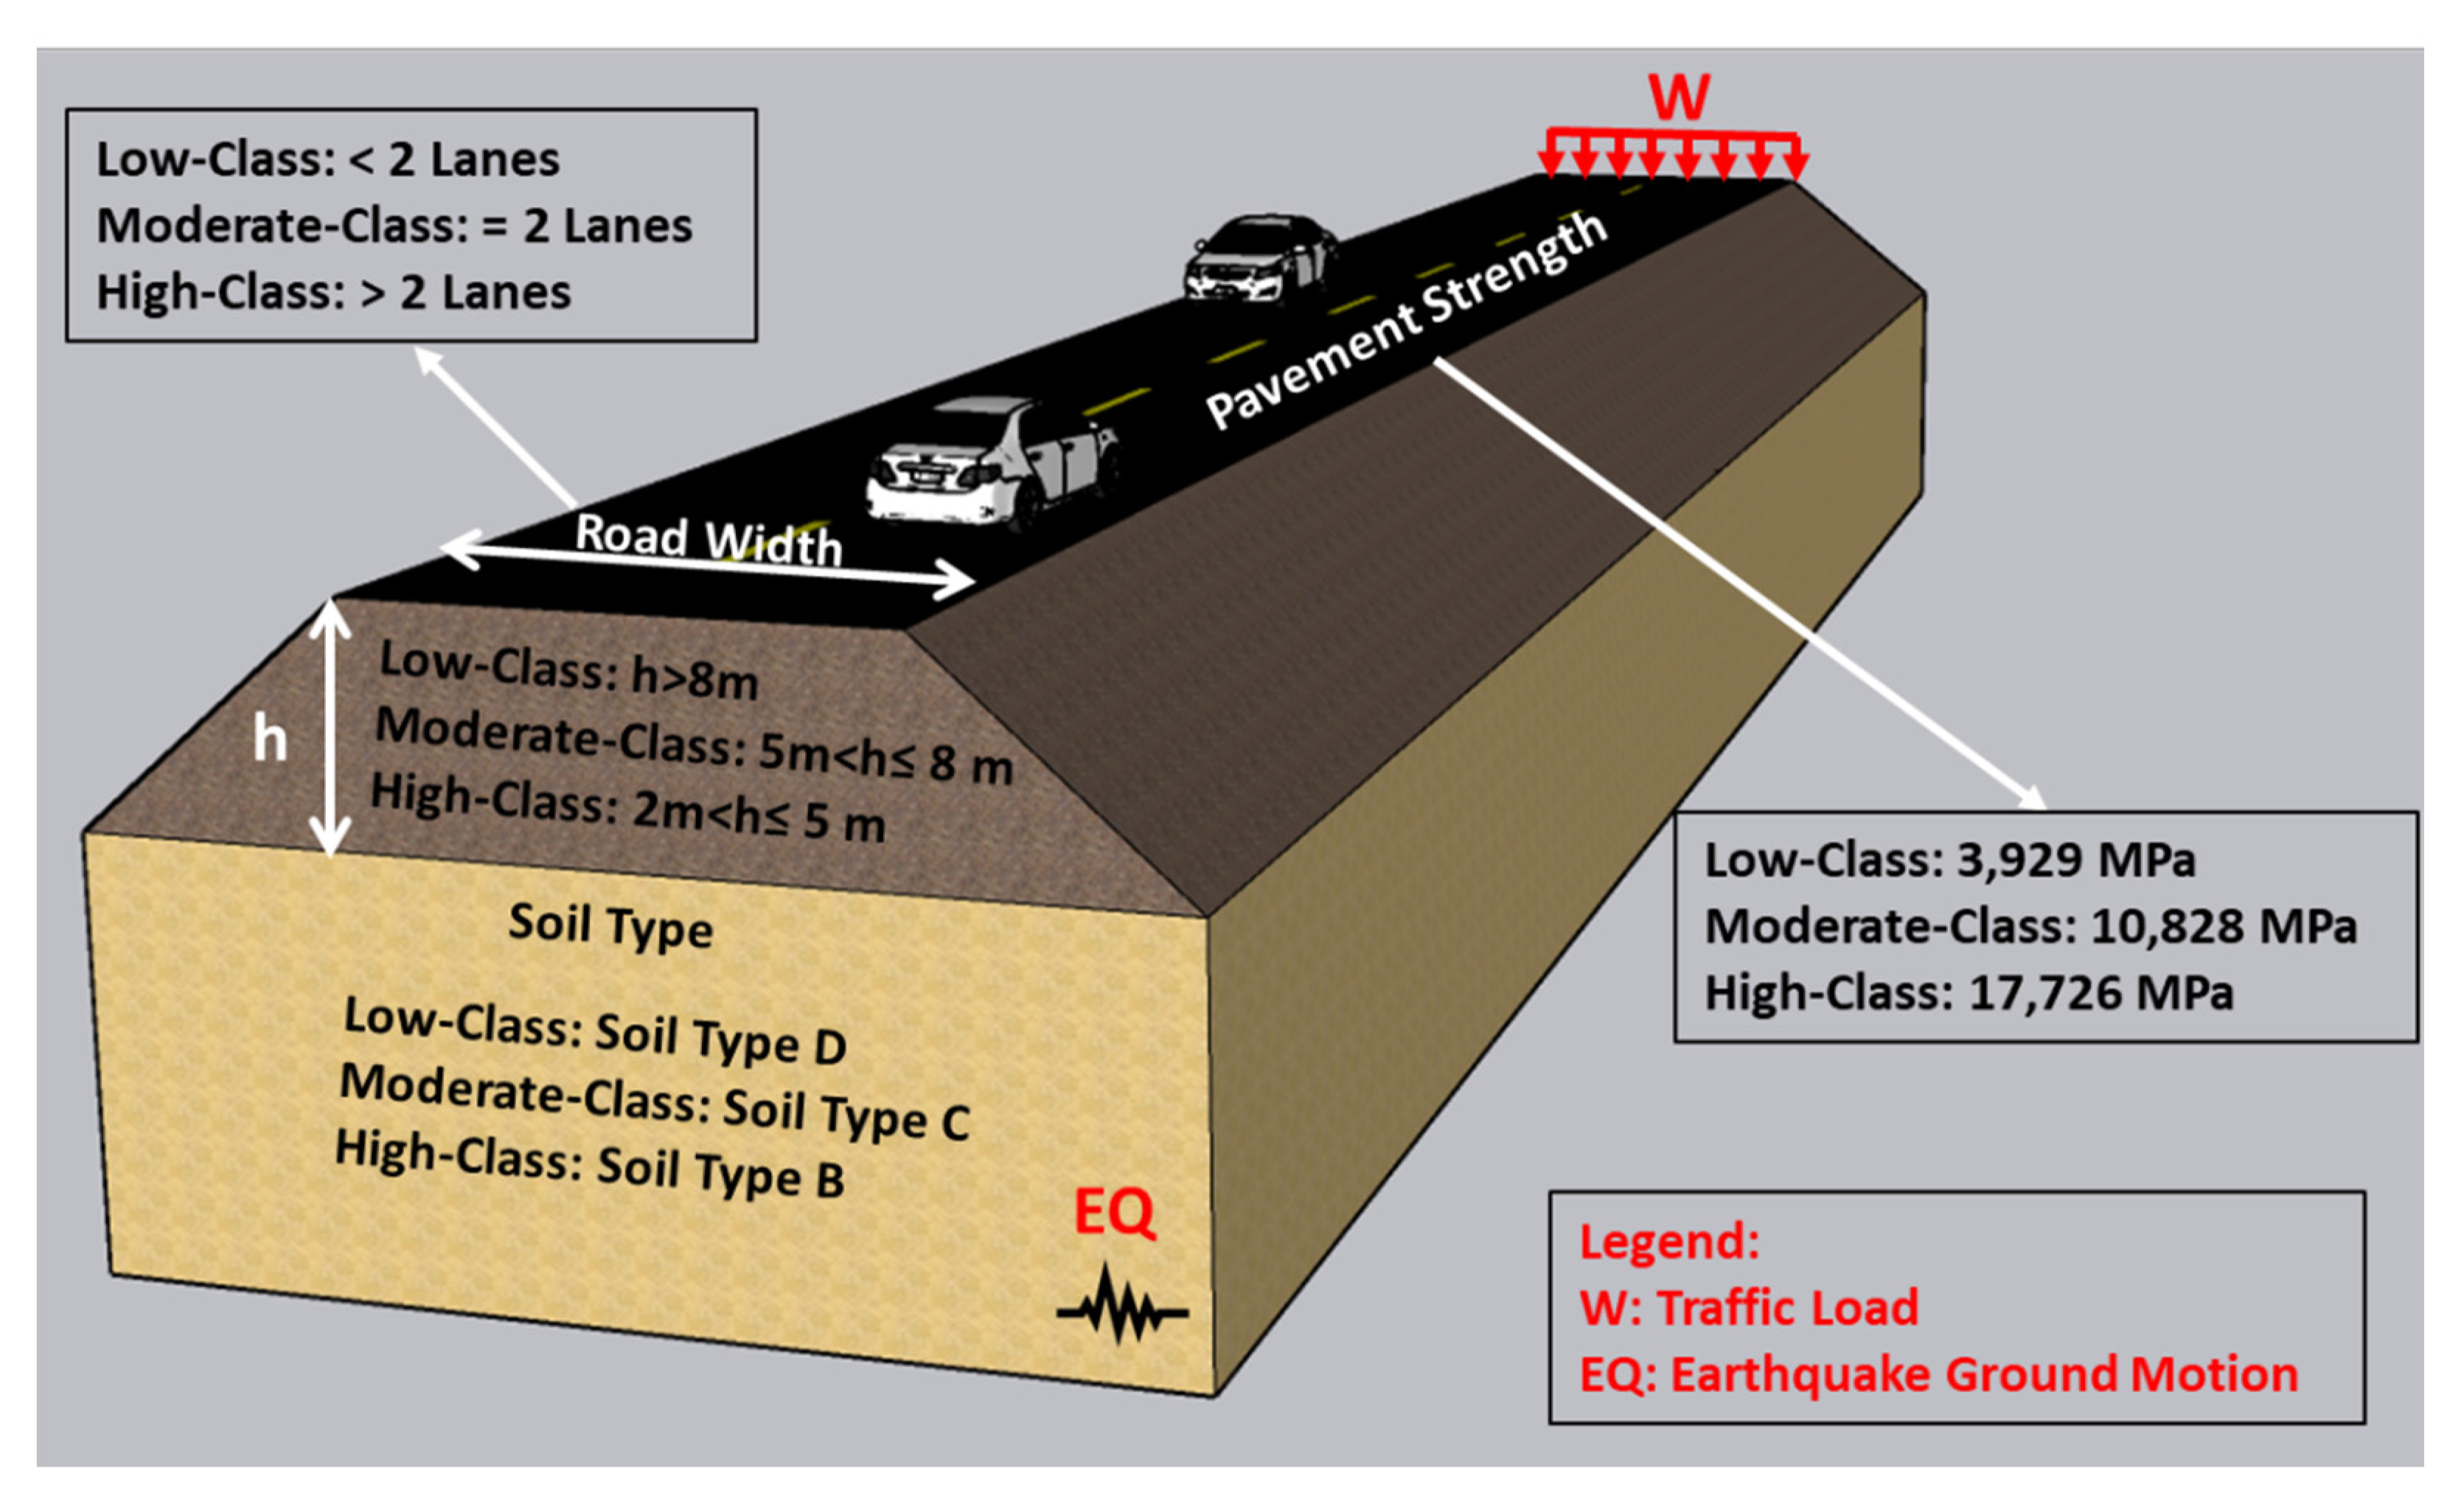
2.1.1. Selected Modelled Parameters

Road vulnerability mainly depends on different structural and geometric features, in addition to the seismic and geotechnical properties of the study area. The main parameters considered in the present study are discussed in the following:
  • P1: embankments.
Roadway embankments are one of the most vulnerable assets in the roadway system. Maruyama et al. [26] analysed the damage distribution by developing fragility functions for roadway embankments after various earthquake incidents in Japan and found that the roadway and embankment damage accounts for 65% of the total damage of roadway assets. The parameters that are commonly taken into consideration are the height and slope angles [2], while some studies considered the compaction quality [61].
  • P2: pavement
The road pavement has an important effect on vehicle speeds, traffic safety, and rescue operations [1]. The main parameters linked to the damage of pavements are the type and condition of the pavement. Caiado et al. [59] used the quality of pavement to assess the seismic vulnerability for urban networks in Lisbon city, Portugal. Moreover, Pitilakis et al. [60] conducted research to study the systematic vulnerability of transportation systems in Thessaloniki city, Greece. One of the main investigated assets in this study is the road pavement, by which the road closure results were analysed based on the direct damage to road pavement.
  • P3: ground condition
Road assets are considered geotechnical infrastructures and for this reason, the ground condition is a main parameter in the vulnerability assessment. One of the main references that are used widely to classify the ground conditions is the Eurocode 8 [61], which, adapts five soil types: A (rock), B (very dense sand), C (medium dense sand), D (loose—to medium cohesion—less soil), and E (soil profile consisting of a surface alluvium layer). The ground condition is also affected by potential liquefaction, fault rupture, and landslides, which can cause a partial or total road closure. Different studies concentrated on the ground conditions as one of the main parameters for evaluating the SVI of road networks [22,62].
  • P4: road width
Road width is usually considered as a factor of the pavement category. For instance, Adafer and Bensaibi [29] used the number of lanes and pavement types to assess the vulnerability of pavements, while Francini et al. [15] concentrated on road width and length, assuming that wider roads can have a higher capacity and shorter roads can help to reduce the travel time. In the present study, the road width and pavement type are assessed separately. After defining the main parameters, each modelled parameter is distributed in three main vulnerability classes (low, moderate, and high class), as shown in Table 1.
The fragility functions are built based on the interaction between all the components of the roadway system, for instance, while determining the damage probability based on the height of the embankment. Different situations are considered using different height ratios, such as h = 4 m, h = 6 m, or h = 9 m, while keeping the other parameters, such as road width, pavement strength, and soil type, unchanged at a certain value. When performing the fragility functions, the worst-case situations with the most severe consequences are considered. To evaluate each of the key elements of the roadway system, the same procedure is performed to assess all the parameters of the roadway system. All the classified parameters in Table 1 are considered in the roadway assessment model as shown in Figure 3. Various heights (h) for embankments, pavement strengths, soil types, and different road widths are assigned in different numerical models at different seismic intensities to assess the roadway damage.

2.1.2. Weighting Modelled Parameters Using NLDA

  • IDA curve for selected ground motion records
Empirical approaches are characterized by uncertainties due to the restricted data and expert judgment applied to develop the SVI. Currently, analytical approaches can provide more reliable and precise vulnerability assessments [64]. In this respect, Non-Linear Dynamic Analysis (NLDA) was introduced to develop the main models for the investigated parameters of the road network and to produce fragility curves which are used for weighting the vulnerability weights of the SVI.
The proposed analytical approach models each parameter individually through the three vulnerability classes of Table 1 in Section 2.1.1. This can be achieved by applying the Incremental Dynamic Analysis (IDA) [65]. An appropriate ground motion intensity must be specified to construct IDA curves accurately and efficiently and reflect the response of the road assets under different earthquake records. The Damage Measure (DM) is described by the vertical displacement/settlement and is used to describe the damage states of the roadway asset. The intensity measure (IM) is commonly defined by the spectral acceleration at fundamental period Sa (T1). Since the Sa (T1) measure is considered a convenient and efficient intensity measure for first mode dominated structures [66,67], it has been widely adopted in seismic design codes and research in many countries.
Furthermore, choosing the appropriate ground motion records is considered a vital step towards obtaining the Non-Linear Time History Analysis, and it is considered an important criterion for developing an accurate Non-Linear Time History Analysis (NL-THA). According to several seismic codes [68,69], a minimum of three or seven ground motion records are required. Thus, to comply with the minimum requirement of international codes, seven ground motion records were considered in this study, which is obtained from the Consortium of Organizations for Strong-Motion Observation Systems Database (COSMOS) Database as tabulated in Table 2.
  • Probabilistic damage distribution functions
Probabilistic damage distribution functions can help in formulating the seismic vulnerability physical assessment of road networks in terms of DM and IM by applying the Cumulative Distribution Function (CDF) of the infrastructure performance damage states. A probabilistic approach is represented by fragility functions, which describe the correlation between the seismic intensity level and the damage probability and are considered efficient tools in seismic risk analysis of infrastructure systems [3]. Additionally, a fragility curve is considered an indicator of seismic vulnerability and can be used to help make decisions about retrofitting, calculating the cost of destruction, and avoiding fatalities during earthquakes. The maximum vertical displacement or settlement is taken into consideration as an Engineering Demand Parameter (EDP) to measure how well the damaged road performs under the influence of lateral stresses.
Different IMs and mathematical expressions have been adopted to establish seismic fragility functions [33]. Numerous seismic IMs can be used to develop fragility functions. The crucial damaged form in the road structural element of the first mode shape is related to the spectral acceleration (Sa) for the vibration period (T1) by which the IM utilized in this study is derived. While the first mode of spectral acceleration is an accurate index for structures to react elastically, it is frequently used such as a default earthquake intensity scaling parameter for a time-history analysis. Equation (3), is applied to establish the fragility functions, as formulated by Ibrahim and El-Shami [70] and Kassem et al. [38].
P [ Damage DS / Sa ( T 1 ) ] = Φ ( ln   [ S a ( T 1 ) ] µ   σ )
where Sa(T1) is spectral acceleration for a specific vibration period, Φ is the standard normal distribution, µ is the mean value for damage states at different intensity measures, σ is the standard deviation for each damage state as shown in Table 3. Two major parameters are required for development of the fragility functions, i.e., µ and σ .

2.1.3. Vulnerability Classification

Two main studies by Adafer and Bensaibi [29] and Francini et al. [15] tackled the SVI for roadway assets based on different empirical approaches. As stated in Section 2.1 the two studies adopt different vulnerability parameters and weighting factors for assessing the SVI. Moreover, both studies used the judgemental expert method to weigh the main parameters that are used to conduct the SVI. In the present study the weighting is based on the results of the analytical-based rating approach (see Section 4.3) to provide higher fidelity evaluation of the SVI is calculated by Equation (4):
S V I j = i = 1 n w i P a i
where SVIj is the Seismic Vulnerability Index of the j-th alternative road; P a i is the i-th parameter that are labelled in Section 2.1.1; w i is the weight that is related to the i-th parameter that is extracted from the fragility function results after developing the analytical model (Section 4.2); and n is the number of parameters.
For the Penang case study, various seismic hazard scenarios derived from the micro-zonation studies are used to perform the vulnerability analysis of the roadways and their assets [72]. The classification of roadway systems is built on the following investigated parameters: soil type, road width, pavement strength, and embankment height (P1–P4, respectively). According to the spectral acceleration, the probability of damage is determined using appropriate fragility curves for the roadway assets that are mainly located in Penang. It is mainly distinguished that the embankment height is the most effective parameter that seems to have by far the highest percentage of improvement followed by the number of lanes; on the contrary, the soil type and the pavement strength are the least effective parameters of the roadway system with a small advantage for the soil type compared with pavement strength. SVI is mostly unaffected by any eccentric factors and is related to the intrinsic characteristics of roadway systems. Depending on the level of damage being investigated and the primary context of this SVI, a different set of parameters are used. Where the weighting factors are commonly employed to assess the contribution of the different parameters to the road vulnerability see El Maissi et al. [33,73] for more information regarding SVI development.
The weighting of the parameters, which is evaluated in relation to the percentage of improvement that is taken from the generated fragility functions, is used to classify the vulnerability that is determined using Equation (4). Different earthquakes scenarios with different ground motions are specified as shown in Table 2 and applied for various models to assess the vulnerability of the roadway system. The selected ground motions are considered the most critical situations with the highest disastrous impact. Additionally, in this study the main aim is to correlate the evaluated vulnerability with the accessibility rate, to achieve this aim it is important to consider earthquakes with high seismic intensities ranging between VIII and IX [29], where the assessment of roadway vulnerability is considered more efficient by considering this critical situations and validation process shown in Figure 15 Subsequently, the reduced accessibility values are evaluated based on the vulnerability of roads that is linked with different earthquake scenarios. A new vulnerability classification is proposed in this study, which is divided into three main classes based on the range of the estimated SVI. In particular, the road segment is classified as safe (VI = 0–0.40), moderately resistant (VI = 0.4–0.7), and low resistant (VI = 0.7–1).

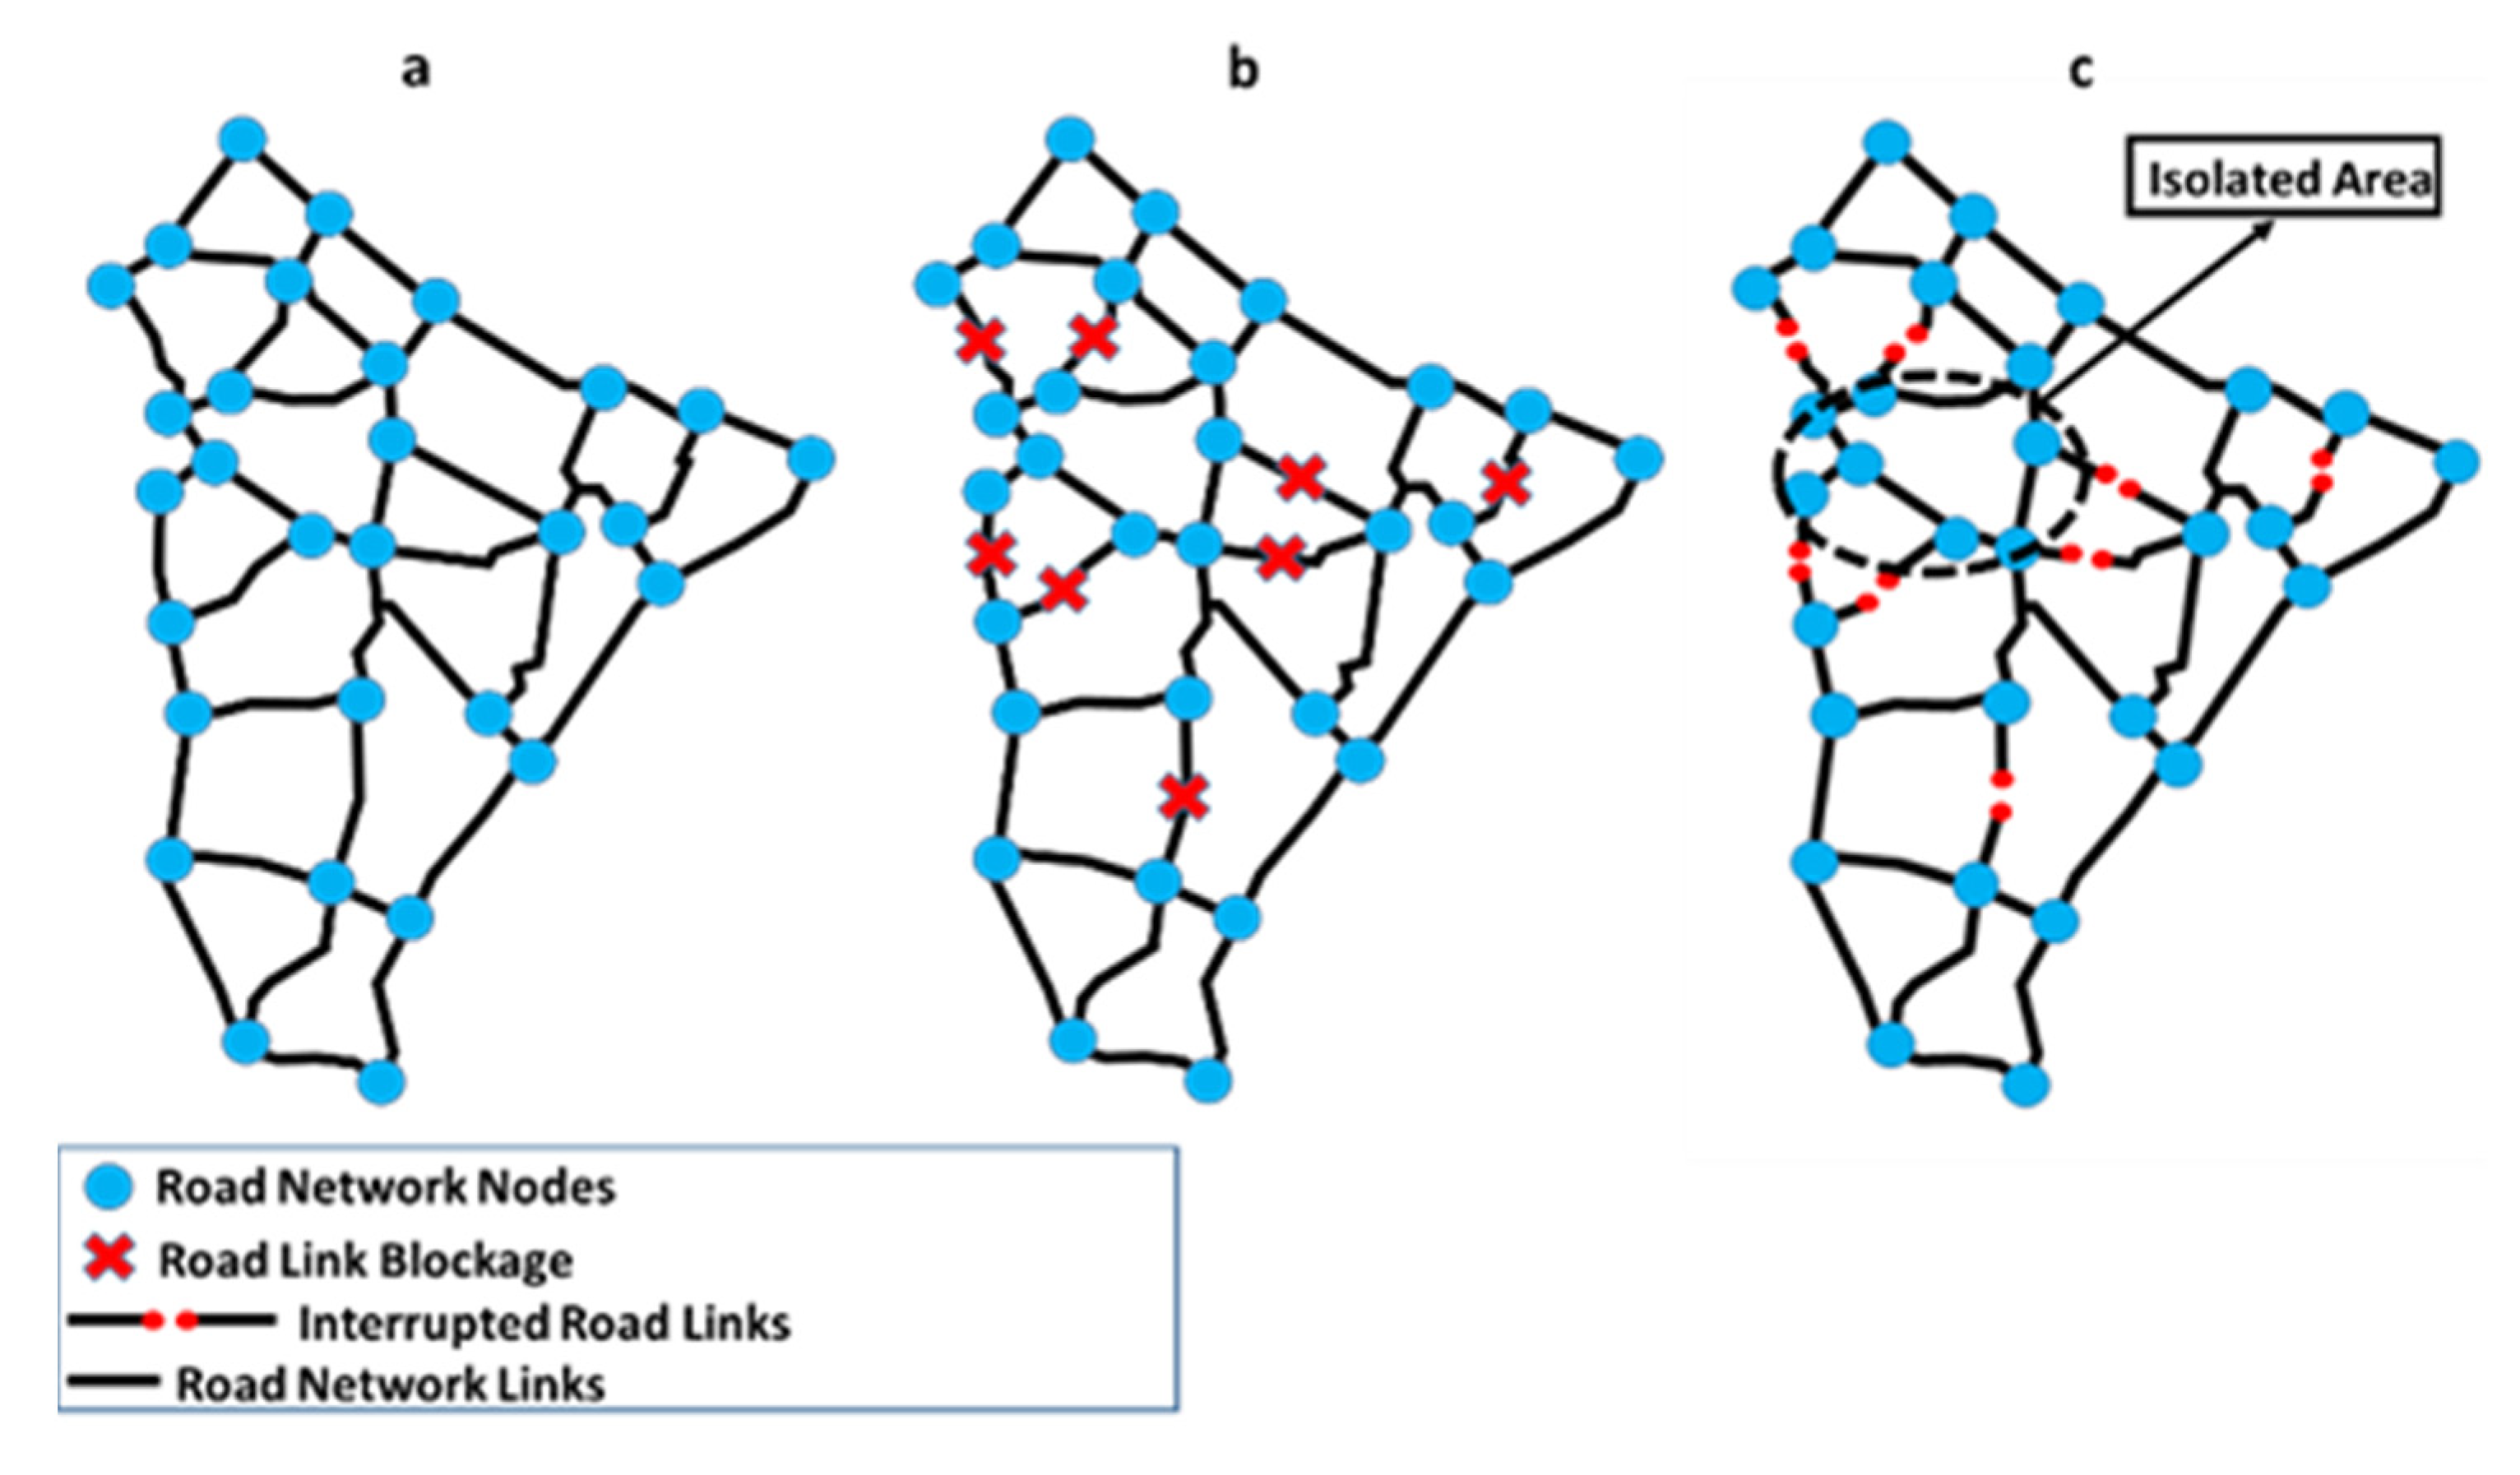
2.2. Stage 2: Traffic Disruption Assessment Method

The accessibility disruption of the road network is assessed using the Accessibility Index AI. The AI scores signify the score of accessibility between various nodes in the network, where the high scores represent a better accessibility ratio. To calculate the AI, the relative accessibility, which studies the ratio of connectivity between the nodes should be evaluated based on the distance, travel costs, and travel time. This research considers the distance as the main factor in the calculation of the AI since the distance is considered a constant factor with less variability compared with travel time demand.
The traffic disruption assessment is conducted through six new main steps. In step (i) the road network is selected and defined based on the existing data and the distribution of the critical service centres (Hospitals, firefighting stations, open spaces) because this network is used to estimate the relative accessibility. The relative accessibility is calculated to evaluate the ease of transport towards main critical service centres in case of emergency based on the connection between origin and destination.
In step (ii) the network and critical services topology are built, and the crucial network components and geographical dimensions are classified. A road network is considered a set of specific nodes and links. Nodes are considered the main point elements of this network. The travellers can use them to enter (e.g., bridge and intersection) or alter the path of travel (e.g., ramps, roundabouts, and road interchanges). The linear elements are represented by links connecting the nodes. The classification of road network elements is evaluated by a different number of variables, which are the length of the road, the connection between nodes, direction, cycle, and circuit representing the geographical dimensions of the network. The critical service centres are classified and located on the map for estimating the relative accessibility to these critical services. This helps in specifying the emergency and evacuation corridors towards each critical service point. An example of a road network is shown in Figure 4 with the classified network topology and representation of the critical service centre’s location.
The aim of step (iii) is to determine the undamaged corridors, which represent the components that the traffic can be relied on in case of emergencies (emergency corridors). The damaged roads are specified based on the physical damage approach results extracted from stage 1, by which the roads are classified as safe, moderately resistant, and low resistant (damaged roads). The network is considered fully connected if there is an accessible path between the main network nodes, and in this case, the nodes are considered equally accessible. When the road network is not entirely linked, then it is divided into various independent connected elements. If links are damaged or blocked, the connecting nodes in these links can become unreachable (isolated area); hence, the network graph may be divided into various components (road network nodes and links) (see Figure 5). Connectivity analysis is developed by identifying the undamaged components (low vulnerability components) to distinguish the isolated areas of the network.
In step (iv) the accessibility analysis is performed in pre-and post-earthquake conditions. The accessibility can be calculated through different terms, which are distance, cost of travel, and time of travel. In this research, the focus is on the cost distance analysis to calculate the accessibility index. The latter is assessed based on the raster grid converted from a road network vector feature using GIS as shown in Figure 6. The black lines in Figure 6a represent the undamaged road, while Figure 6b represents the road after being damaged due to an earthquake. The scaling blue points and the colour intensities are used for estimating the cost value of the regions surrounding the roads that vary as a result of damaged parts (eliminated parts). The main critical service locations are located on a specific raster grid inside the network map and the variation in results of cost distance for this specific grid shows the reduced accessibility towards this service location.
The cells that the links path through are considered the sources, which are used to calculate the cost distance by measuring the distance between these sources and other cells as shown in Equations (5) and (6) [49]. The two main factors, which play a crucial role in defining the impedance of the links are: (i) the extracted cost from the distance travelled between origin and destination and (ii) the path of roads that are passing through the cells. As a result, when there is an orthogonal movement between neighbouring cells, the costs are calculated by finding the average cost of these cells, while in the case of diagonal movement the cost is calculated as the average of the costs between the cells multiplied by 2 , to recompense for the longer distance [74] as shown in Figure 7.
Orthogonal   cos t :   C 0 = ( c o s t 1 + c o s t 2 ) / 2
Diagonal   cos t :   C d = 2   ( c o s t 1 + c o s t 2 ) / 2
In step (v) the reduced accessibility (level of isolation) is calculated on the basis of the outcome between the two cumulative costs’ difference (Figure 6). The cells that are near the links are considered unaffected, due to the small distance between the source and these cells. The cells are coloured in white and represented in Figure 8. While the damaged links result in increasing the accessibility values, which are coloured in red, orange, and yellow and scaled based on accessibility values from 0.00 to 0.06 as shown in Figure 8. Finally, the accessibility maps for road networks after earthquakes are built based on the accessibility index that is developed from cost distance analysis using the GIS platform.

2.3. Stage 3: Building Transport Performance Maps
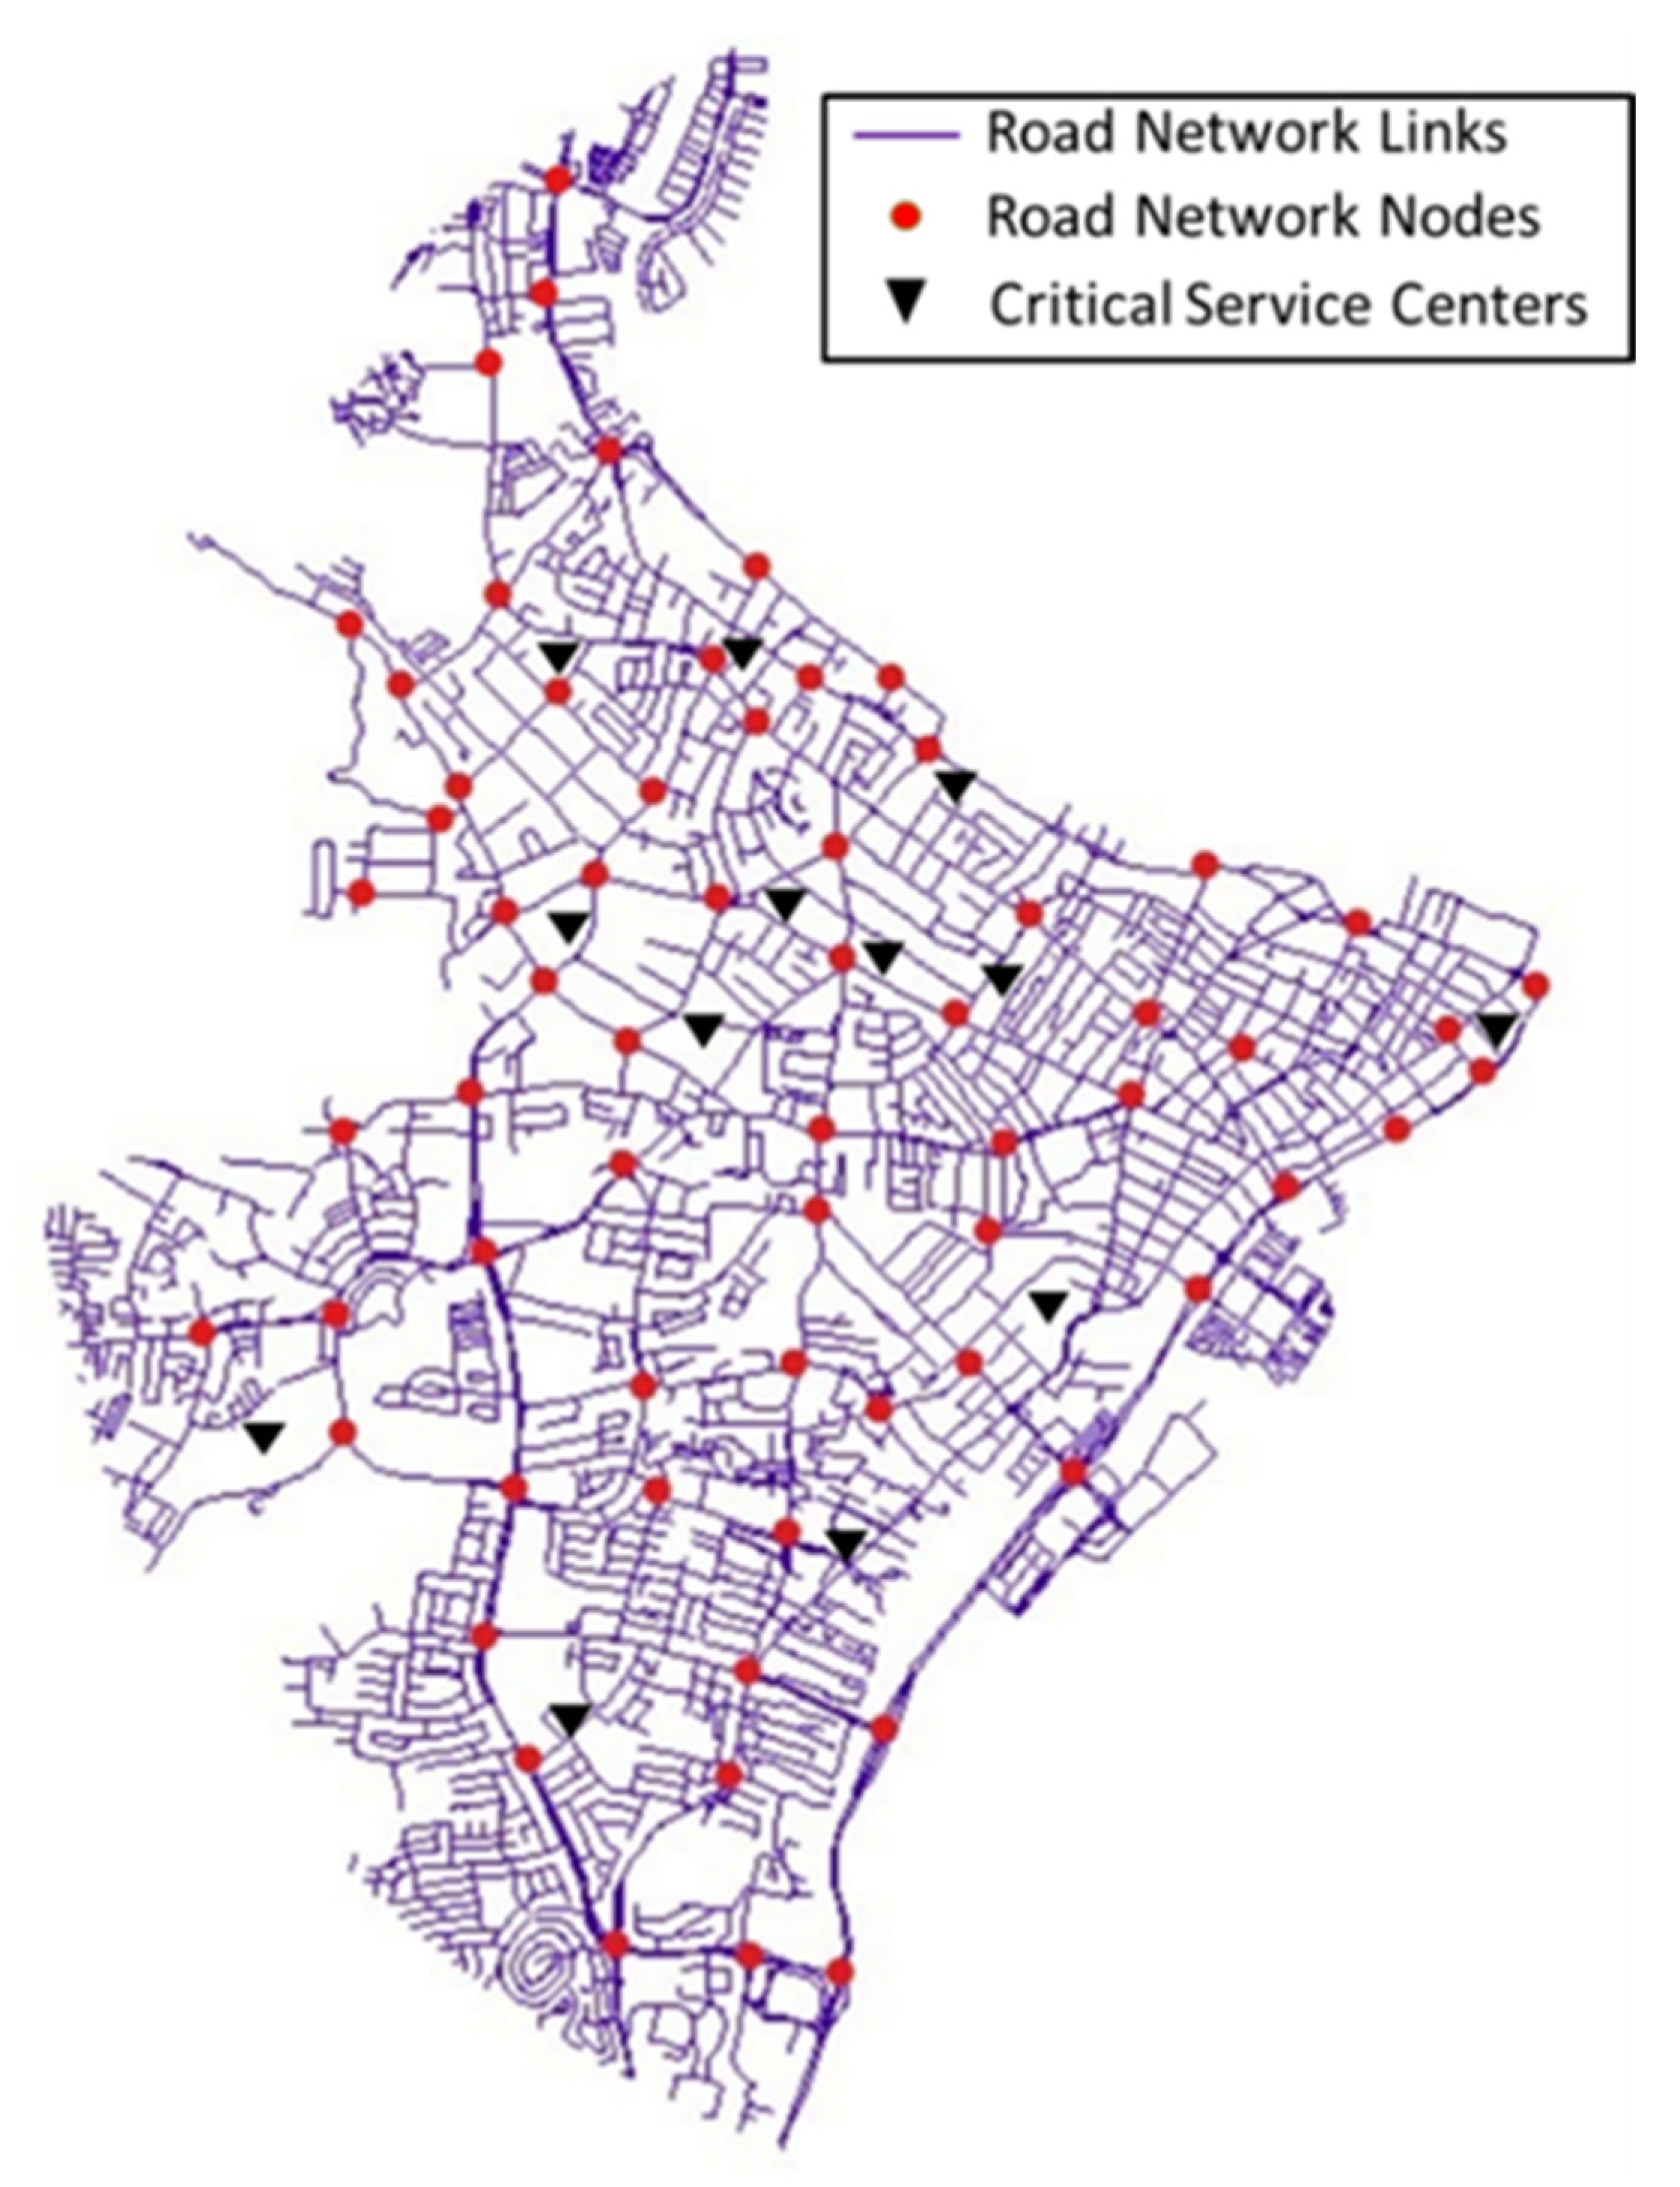
This stage includes the development and visualization of the transport performance map using the ArcGIS platform, aiming to define the main corridors that will be operating after earthquakes. Firstly, the main map is divided into districts for the area under investigation as shown in Figure 9.
After that, the accessibility for these districts is visualized into GIS maps from the extracted data in stage 2. The integrated maps are comprised of (1) damaged roads, (2) accessibility for each district in the specified area, and (3) main emergency corridors that will be operating after earthquakes.
Finally, the relationship between the SVI and AI is drawn, based on the developed integrated approach between the traffic functionality and physical asset damage assessment for the road network. The visualised outcomes will be useful for the stakeholders and decisionmakers to determine which regions of the city will have lower accessibility scores towards critical service centres during earthquakes, so more precautionary measures and re-maintenance procedures can be taken in the near future. These measures are expected to improve the accessibility of the network, toward more resilient and sustainable cities.

3. Case Study

Penang Island experiences tremors whenever there is an earthquake in Indonesia that can affect the functionality and causes damage to road segments and linking nodes of the road network. The large earthquakes originating from Sumatra pose the highest threats to the transportation systems in Penang, which is 350 km away from the Sumatra fault. Penang is one such state in Malaysia that is working on improving and transforming transportation systems, by proposing the Penang Transport Master Plan (PTMP). The plan works on enhancing accessibility and reducing traffic congestion without taking into consideration the effect of natural disasters such as earthquakes, floods, and others.
Such disasters have a direct effect on the functionality and accessibility of road networks and improved planning is needed in the future to make these networks more resilient to natural disasters. Due to these facts, this research focuses on developing a seismic vulnerability assessment model in accordance with nearby seismicity such as Sunda Megathrust. The present case study is the region within 5 km of the surrounding of Komtar area, since it is considered a main metropolitan area and all the critical service centres (hospitals, firefighting stations, and emergency departments) are located within this main region, where the road network under investigation is considered a major network in Penang with high traffic flow.
All the roads in the road network are classified as federal or state roads according to the Malaysian Highway Authority. The road network consists of 64 nodes and 84 links. Most of the roads follow the one-way road system. The local roads that have a higher risk of closure are not investigated in this research because the main aim is to focus on the main structure of the network and its assets and not on its surroundings. Moreover, in the analysis the road under investigation is considered a one-way road due to two different reasons: (1) Komtar area follows the one-way system operation and (2) in case of emergency the emergency vehicles may not follow the traffic rules. Therefore, the roads in this study are converted to one-direction links.
The seismic records were selected for soil type D and Magnitude (Mw) between 5.0 and 8.0 and recognised as Far-Field (FF) records with Epi-central Distance more than 20 km according to Malaysia historical seismic events. A different range of seismic intensities should be considered for the development of the fragility functions. Therefore, according to the Malaysia National Annex (NA), all the selected records are scaled within the range of 0.125 g to 0.684 g, with respect to the targeted response spectrum as shown in Figure 10 and Table 4.

4. Results and Discussion

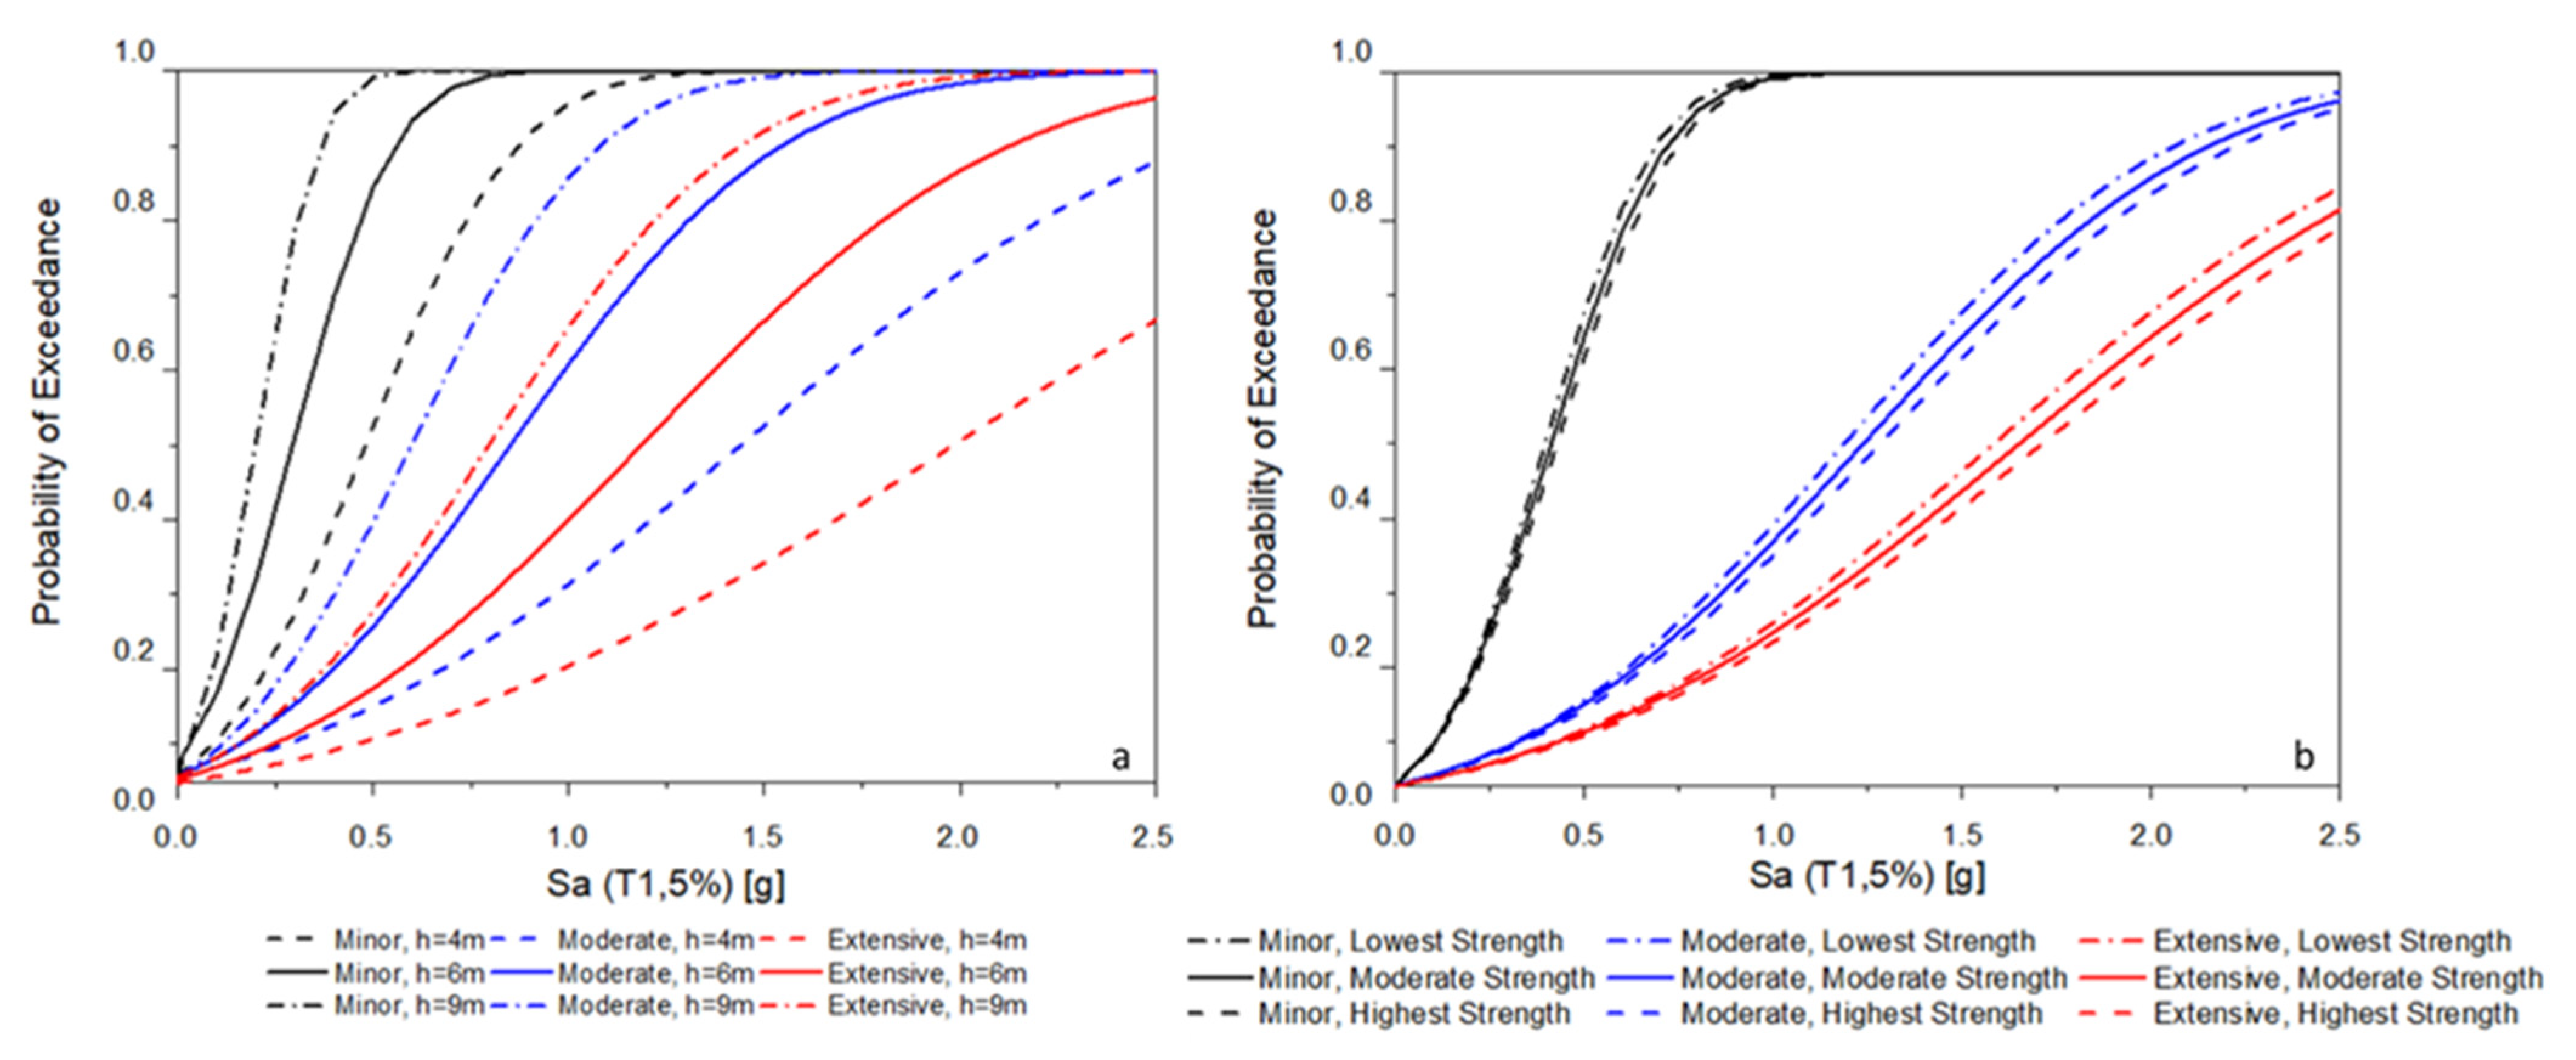
4.1. Incremental Dynamic Analysis (IDA)

When evaluating and prioritizing the impact of the parameters on the stabilization of the roadway system, it is important to consider the idea of resistance design for highway systems. At the collapse stage, the roadway system’s destabilization can be predicted. It is important to investigate how this system might be stabilized appropriately by applying resistance design perception at two separate transmission stages. By examining the percent difference/improvement in two different stages with respect to the damage states and primarily the collapse state at specific collapse intensity measures, it is possible to weigh each parameter’s influence on its structural performance and vulnerability behaviour from the fragility curves [74]. Table 5 shows the first stage, which is from low to moderate class, and the second stage, which is from moderate to high class. Based on the generated Incremental Dynamic Analysis (IDA) and percentage of improvement, the ERD principle can be interpreted for the roadway system that are shown in Figure 11 and Figure 12 and Table 5.
The embankment height (P1) clearly enhances the roadway stability by 48.82% and 39.20% by extending the endurance of resistance against earthquakes before reaching the collapse stage from 0.589 g to 1.152 g, and 1.903 g for transmission stage 1 (Low-ERD to Moderate-ERD) and stage 2 (Moderate-ERD to High-ERD), respectively, as shown in Figure 11a.
Nevertheless, number of lanes (P4) enhanced the roadway stability by 28.57% and 28% at a collapse stage by increasing the resistance to earthquakes before the stage of collapse from 1.048 g to 1.505 g, and 2.103 g for transmission stage 1 and stage 2, respectively, as shown in Figure 11b. The soil type (P3) parameter enhances moderately the stability of roadway system of 13.95 and 12.5 for transmission stage 1 and stage 2, respectively, as shown in Figure 12a. Subsequently, the pavement strength showed a very small percentage of improvement at both transmission stages (5.16% for transmission stage 1 and 5.09 for transmission stage 2) as illustrated in Figure 12b.
It is obvious that the most effective parameter is embankment height, followed by the number of lanes, while the least effective criteria are soil type and pavement strength, with soil type being more effective than pavement strength.

4.2. Assessment of Resistance for Roadway System by Conducting Fragility Functions

The fragility functions for various parameters of roadway assets (embankment height, number of lanes, soil type, and pavement strength) are developed from the main extracted results of the Incremental Dynamic Analysis (IDA), which are shown in Figure 13a,b and Figure 14a,b. The main parameters under investigation are soil type, the height of embankment, number of lanes, and strength of the pavement. Different models were developed using a simulated numerical model. To compare the results of the main parameters, which are under investigation, the Probability of Exceedance (POE) for each parameter is drawn out at a fixed value for Sa (T1, 5%) that is equal to 1.0 g for all the extensive damage states.
The results of the fragility function for roads with different soil types indicated a POE equal to 38%, 43%, and 48% for soil type B, C, and D, respectively, at the extensive damage state. Additionally, the results for embankments heights for roads show that the POE is equal to 20%, 40%, and 66% for h = 4 m, h = 6 m, and h = 9 m, respectively. The POE for roads with a different number of lanes that are shown in the fragility function is equal to 18%, 25%, and 35% for roads with more than two lanes, equal to two lanes, and less than two lanes. Moreover, the fragility function for roads with various pavement strengths indicated that POE is equal to 23%, 25%, and 26% for high, moderate, and low strength, respectively, at extensive damage state.
Based on the derived fragility functions, it is evident that the models with a lower strength of soil type D are more vulnerable compared with higher strength profiles of soil type B and C. Furthermore, as expected, the embankments with 9 m height are more vulnerable than the ones with lower heights of 4 m and 6 m. The fragility functions also indicate that roads with one or two lanes are more vulnerable than roads with more than two lanes. Moreover, roads with high pavement strength are more resistive compared with low pavement strength roads, which are shown in Figure 13a,b and Figure 14a,b.

4.3. Seismic Vulnerability Index (SVI)

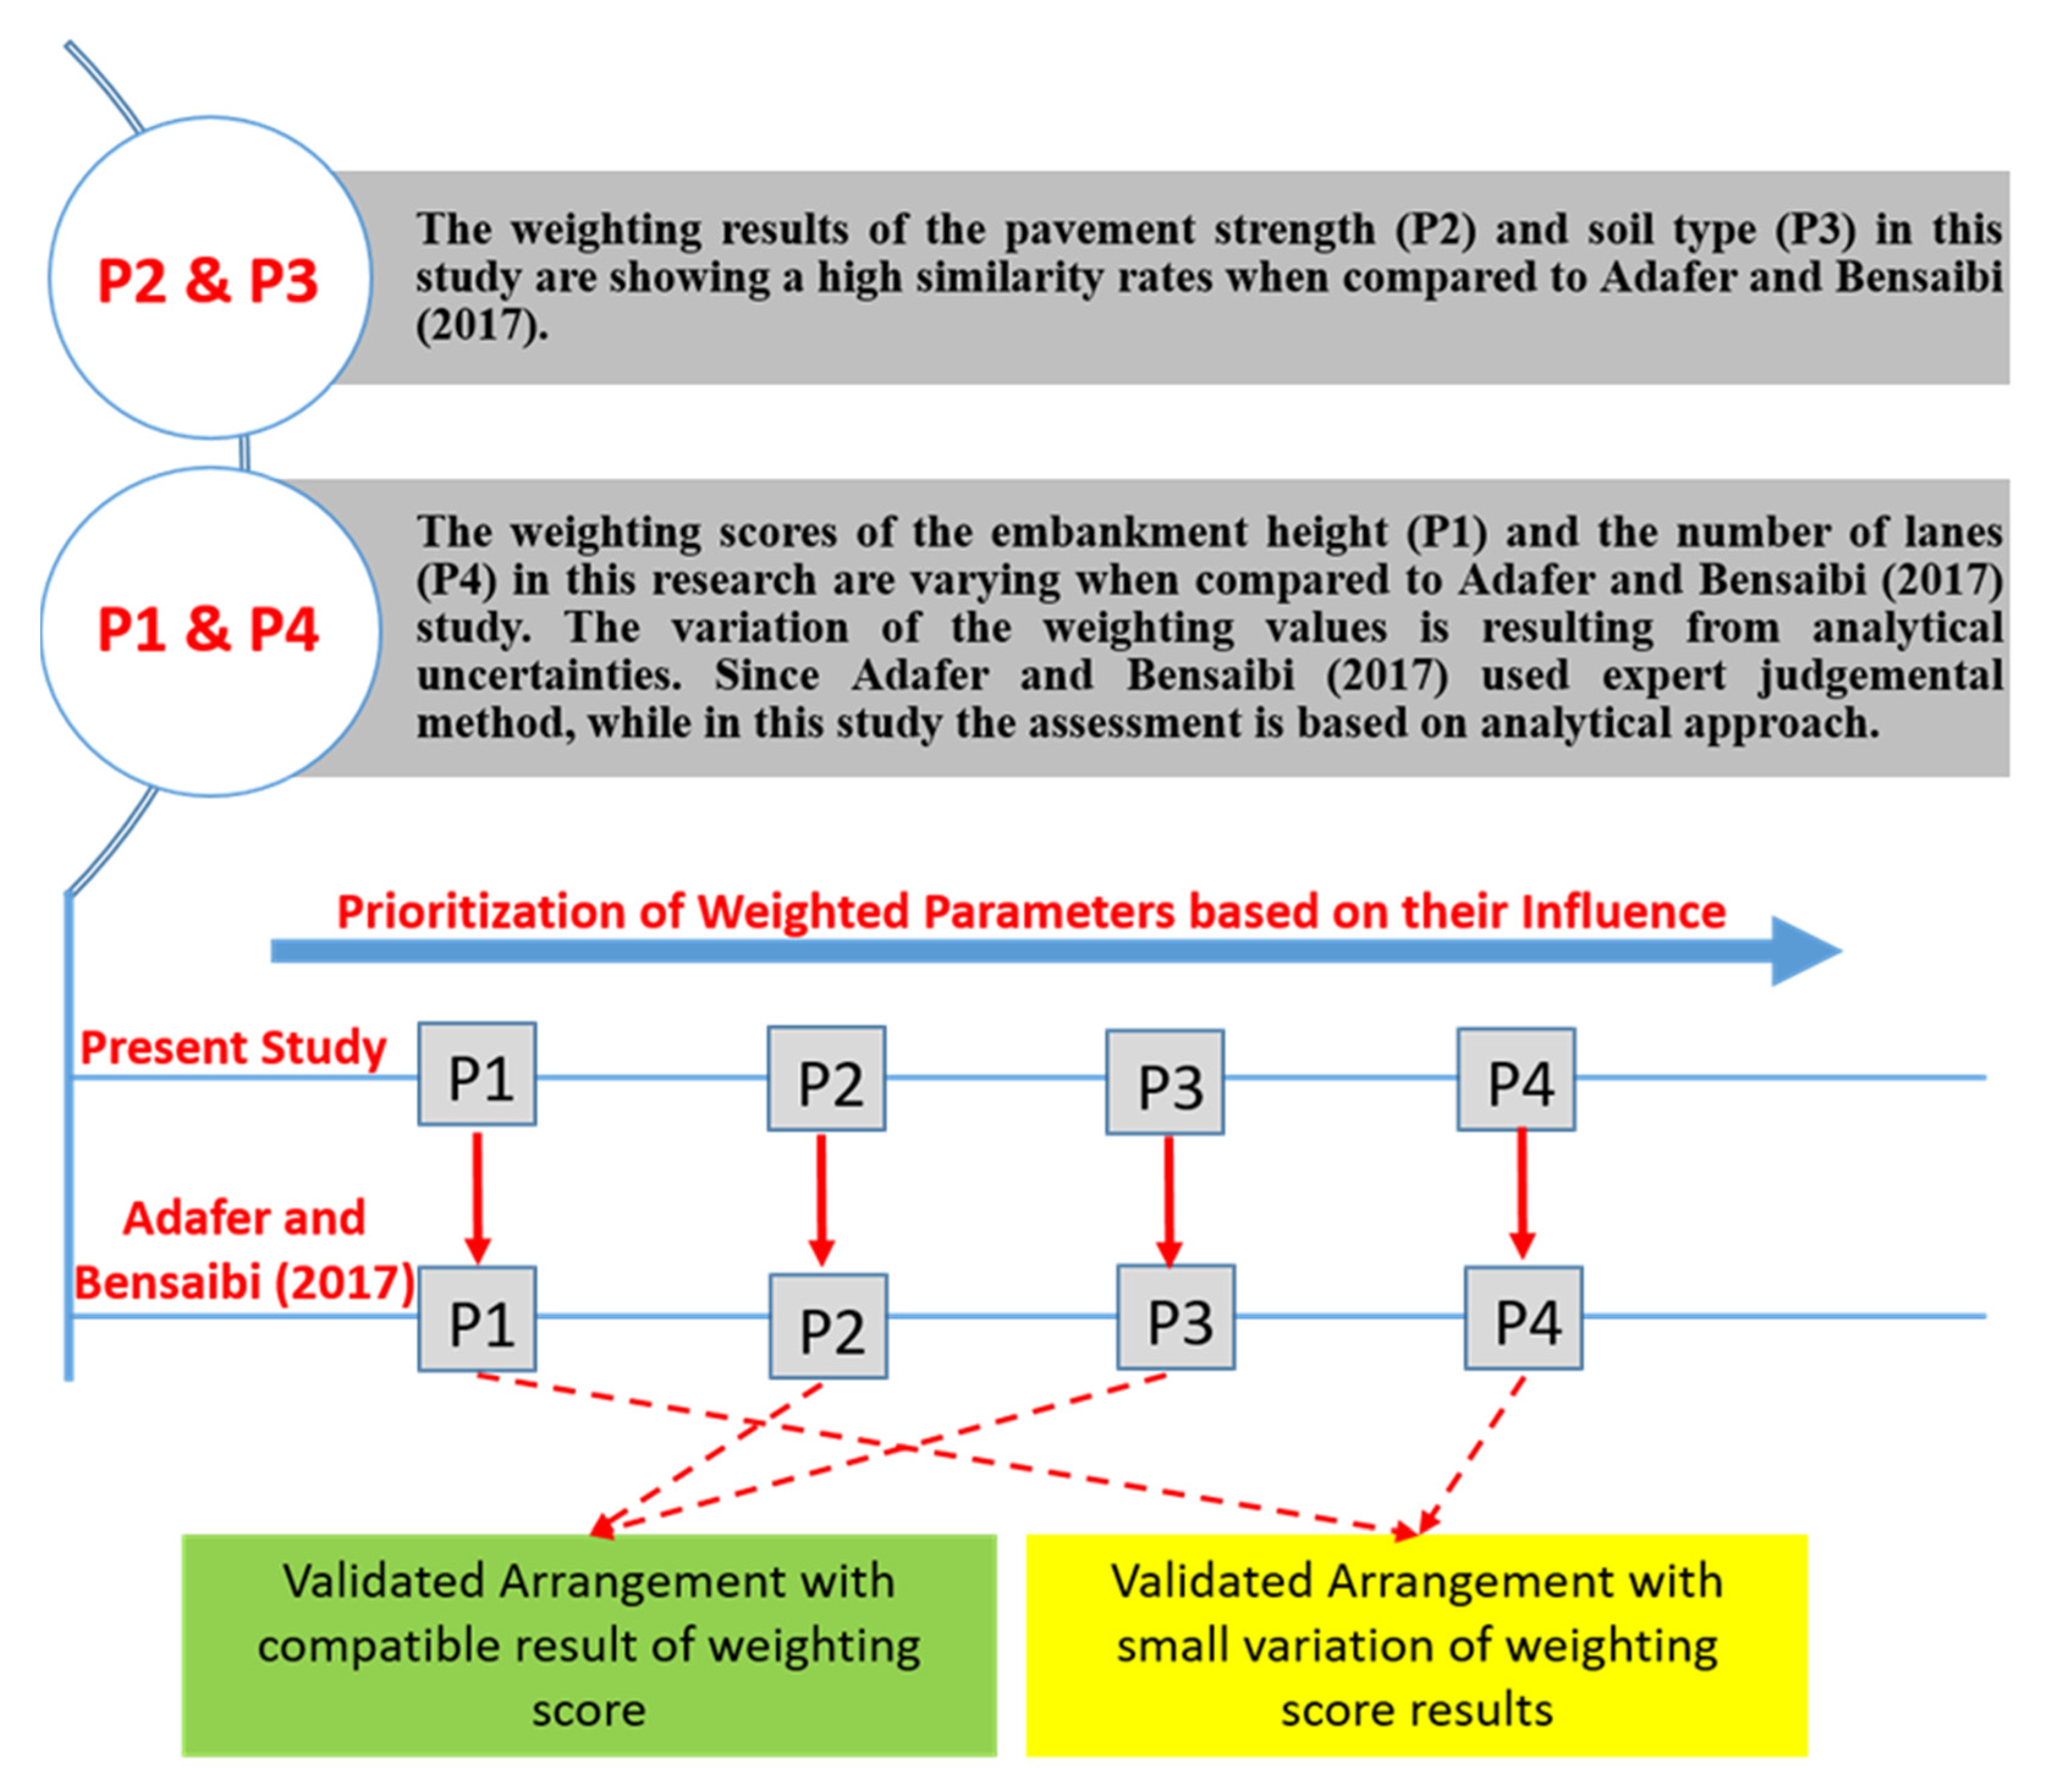
4.3.1. Weighting of Identified Parameters

The main identified parameters that were assessed based on the results of fragility functions in (Section 4.2), are weighted using the Analytical Hierarchy Process (AHP). The parameters are grouped in two different criteria and compared head-to-head to conclude the importance of one parameter among the other. Criteria A and B are compared, and they are weighted based on the importance of one criterion over another. This importance is scaled by different intensities based on Saaty [75] classification and the main results that are extracted from (Section 4.1), where the most effective parameter is concluded from the probability of damage difference between the two transmission stages at collapse state that is shown in Table 6.
The comparison pairwise matrix is built based on the main intensities extracted from Table 6 after comparing the main parameters with each other. The matrix equation is represented in Equation (7).
M = [ 1 8 9 9 1 8 1 7 8 1 9 1 7 1 2 1 9 1 8 1 2 1 ]
By multiplying the matrix by big powers, adding up the rows one by one, and dividing the sum of each row by the sum of all the rows, the weighted priorities for the parameters are obtained in a specified way. Embankment height, lane count, soil type, and pavement strength all had weights that came out to 0.65, 0.21, 0.11, and 0.03 correspondingly. Additionally, the parameters are separated into various categories, and each category is provided a particular score depending on the findings of the derived fragility functions. The main assigned scores are presented in Table 7.

4.3.2. Validation of the Seismic Vulnerability Index (SVI) Assessment Method

The weighting values of the soil type (P2) and pavement strength (P3) in this research are showing similar results compared to the study by Adafer and Bensaibi [29]. However, when considering the embankment height and the number of lanes, the weighting scores in this research are higher. The weighting values are varying because this study is conducting the SVI and weighing the main parameters on the basis of analytical approach, while the past studies used mainly expert judgemental methods. Although there is a small variation between P1 and P4 when comparing the results of this study with Adafer and Bensaibi [29] results, the prioritization of the weighted parameters based on their influence on the roadway and its assets is showing compatibility. The followed validation process in this study is illustrated in Figure 15.

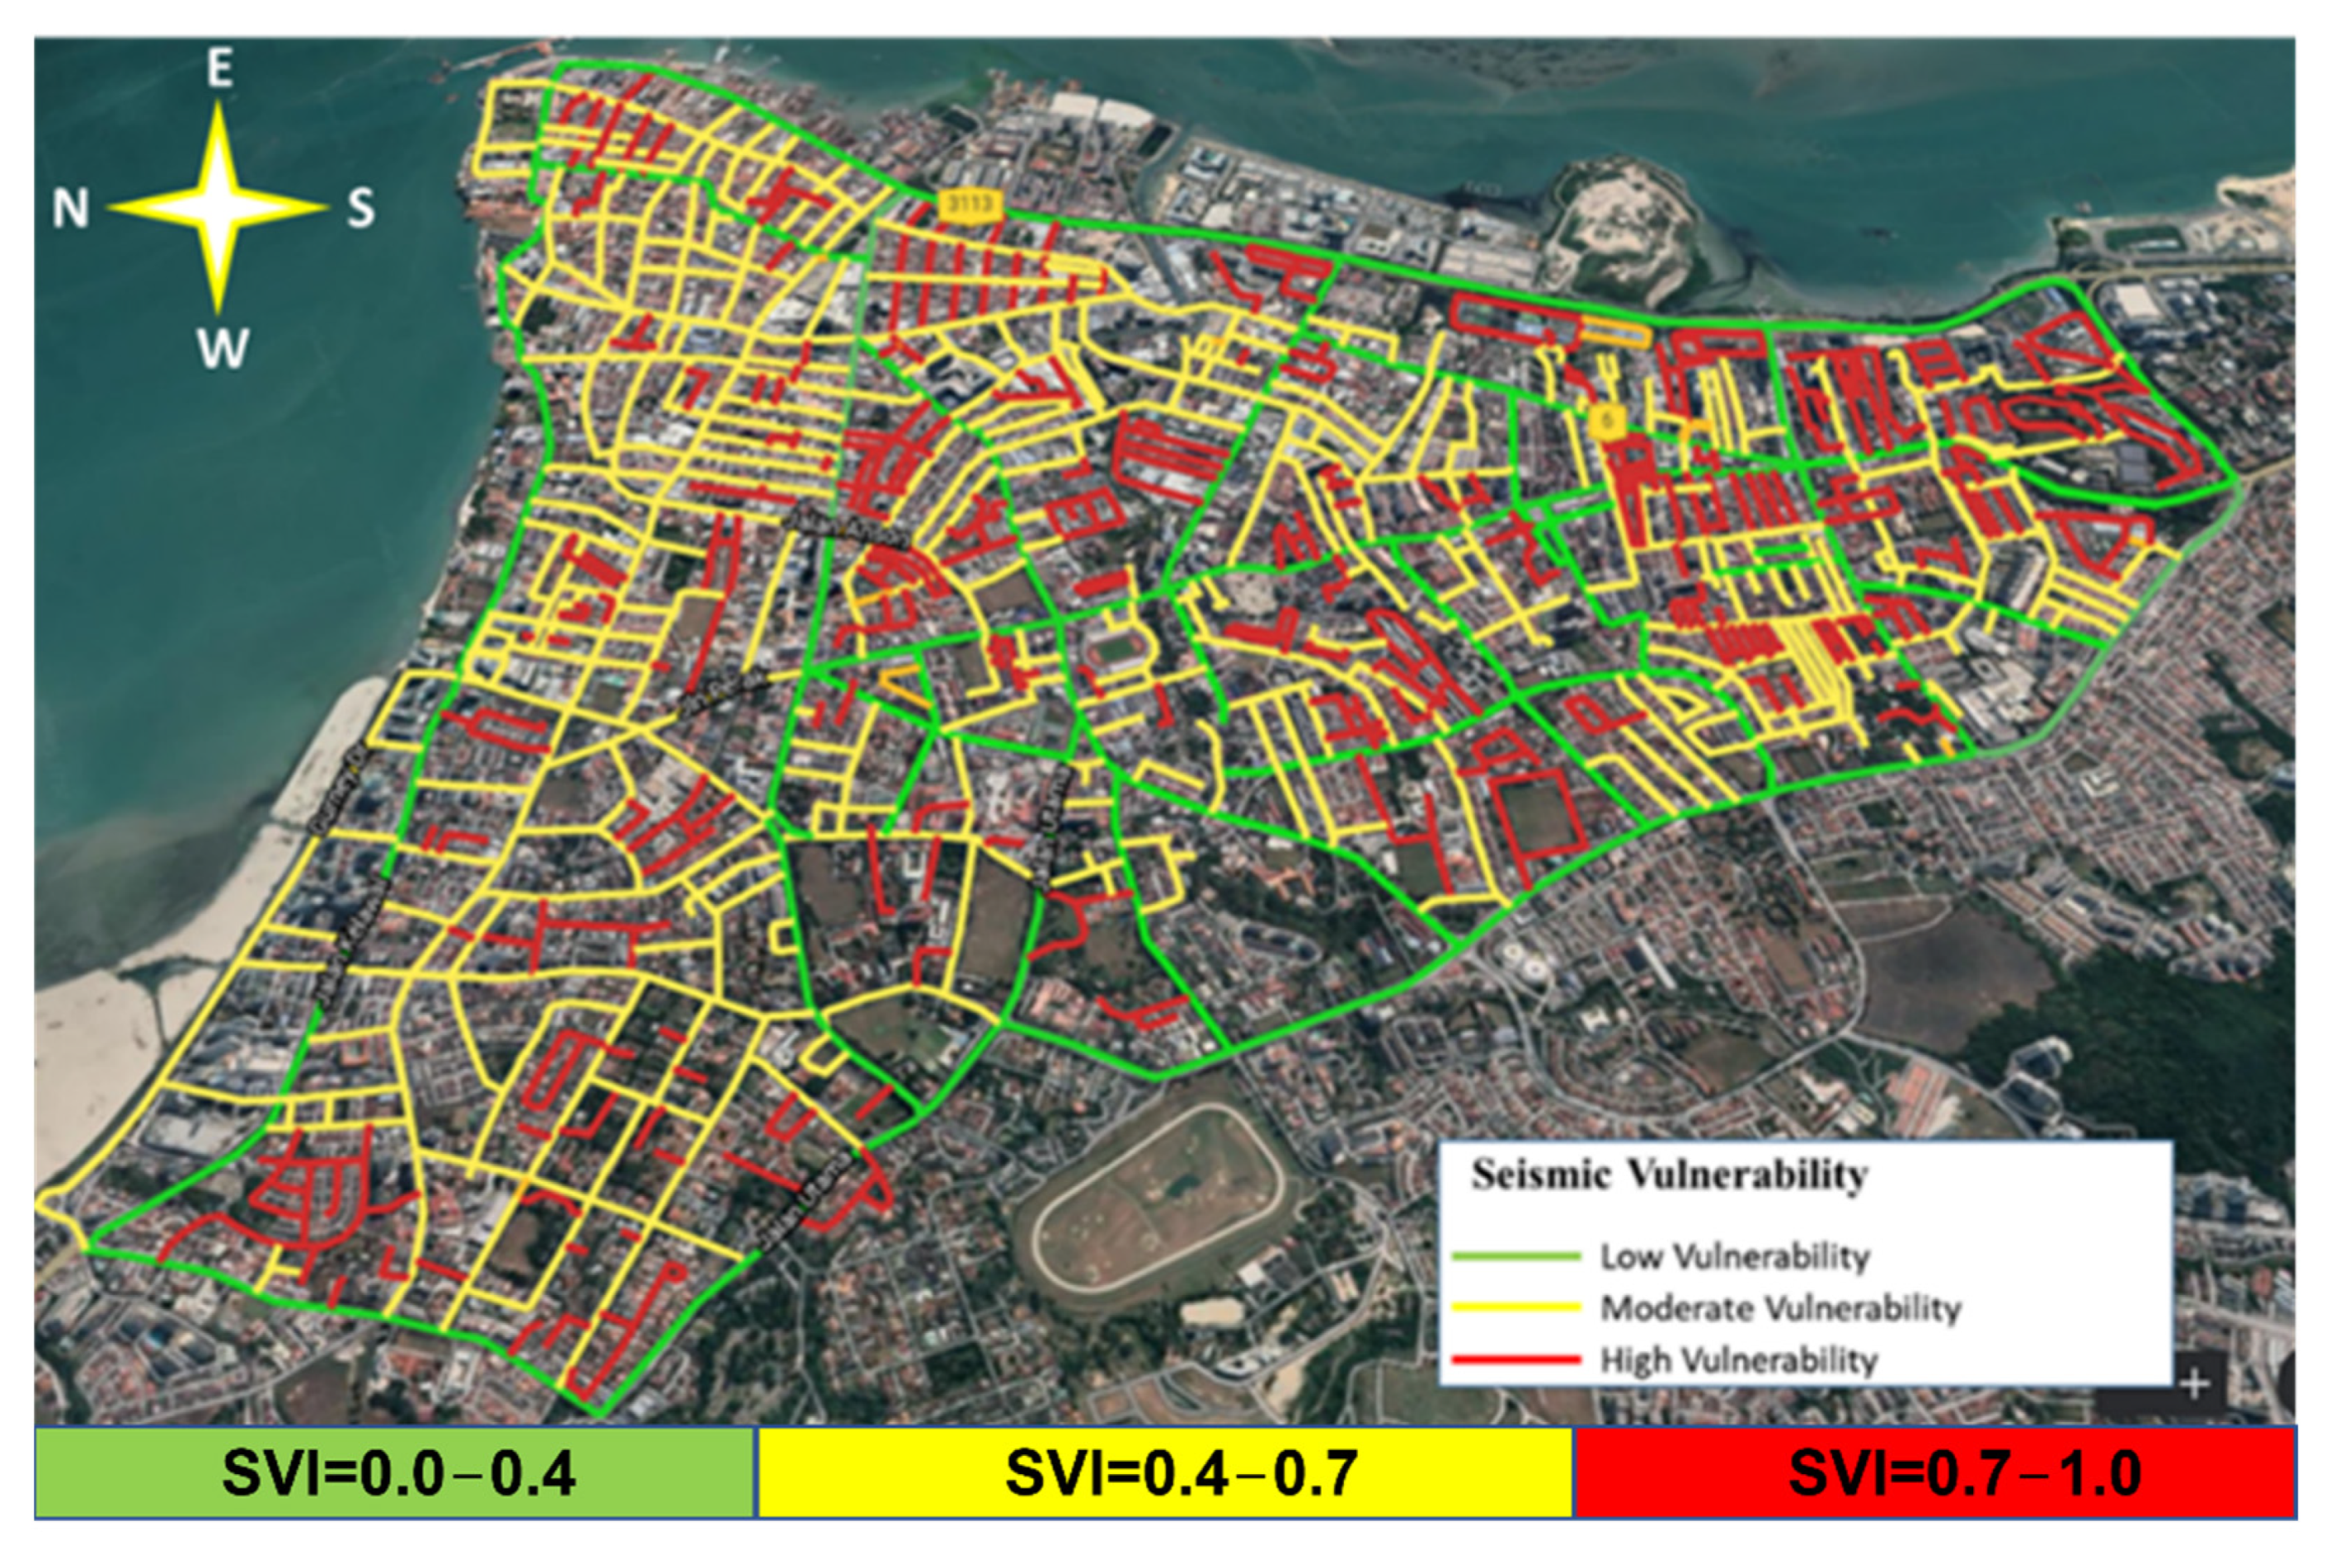
4.3.3. Calculation of the Seismic Vulnerability Index (SVI) Scores

Equation (4) is utilized in the SVI scores calculation based on the impact of various characteristics for the roads, different scores are derived. When determining the SVI for the route and its assets, all the parameters with various categories were introduced. Some of the samples for SVI scores are determined and illustrated in Table 8.
The results of the SVI scores show that the scores increase with small values that do not exceed 0.1, when the pavement strength and soil type change from the highest vulnerability class (Soil type B and high pavement strength) to the lowest vulnerability class (Soil type D and low pavement strength), while the embankment height and number of lanes are fixed at the same class (for example see the difference between street number 6 and 9). On the other hand, when there is a variation in the embankment height and the number of lanes from low to moderate class or from high to moderate class the SVI scores are rapidly increasing. This is due to the fact that the main weighting scores that have been adjusted for each parameter are highly fixed for the height of embankments and number of lanes, after conducting an analytical method to assess these parameters. Figure 16 illustrates the map of the investigated area with the estimated SVI classification for each road segment of the network.

4.4. Seismic Vulnerability Index (SVI)

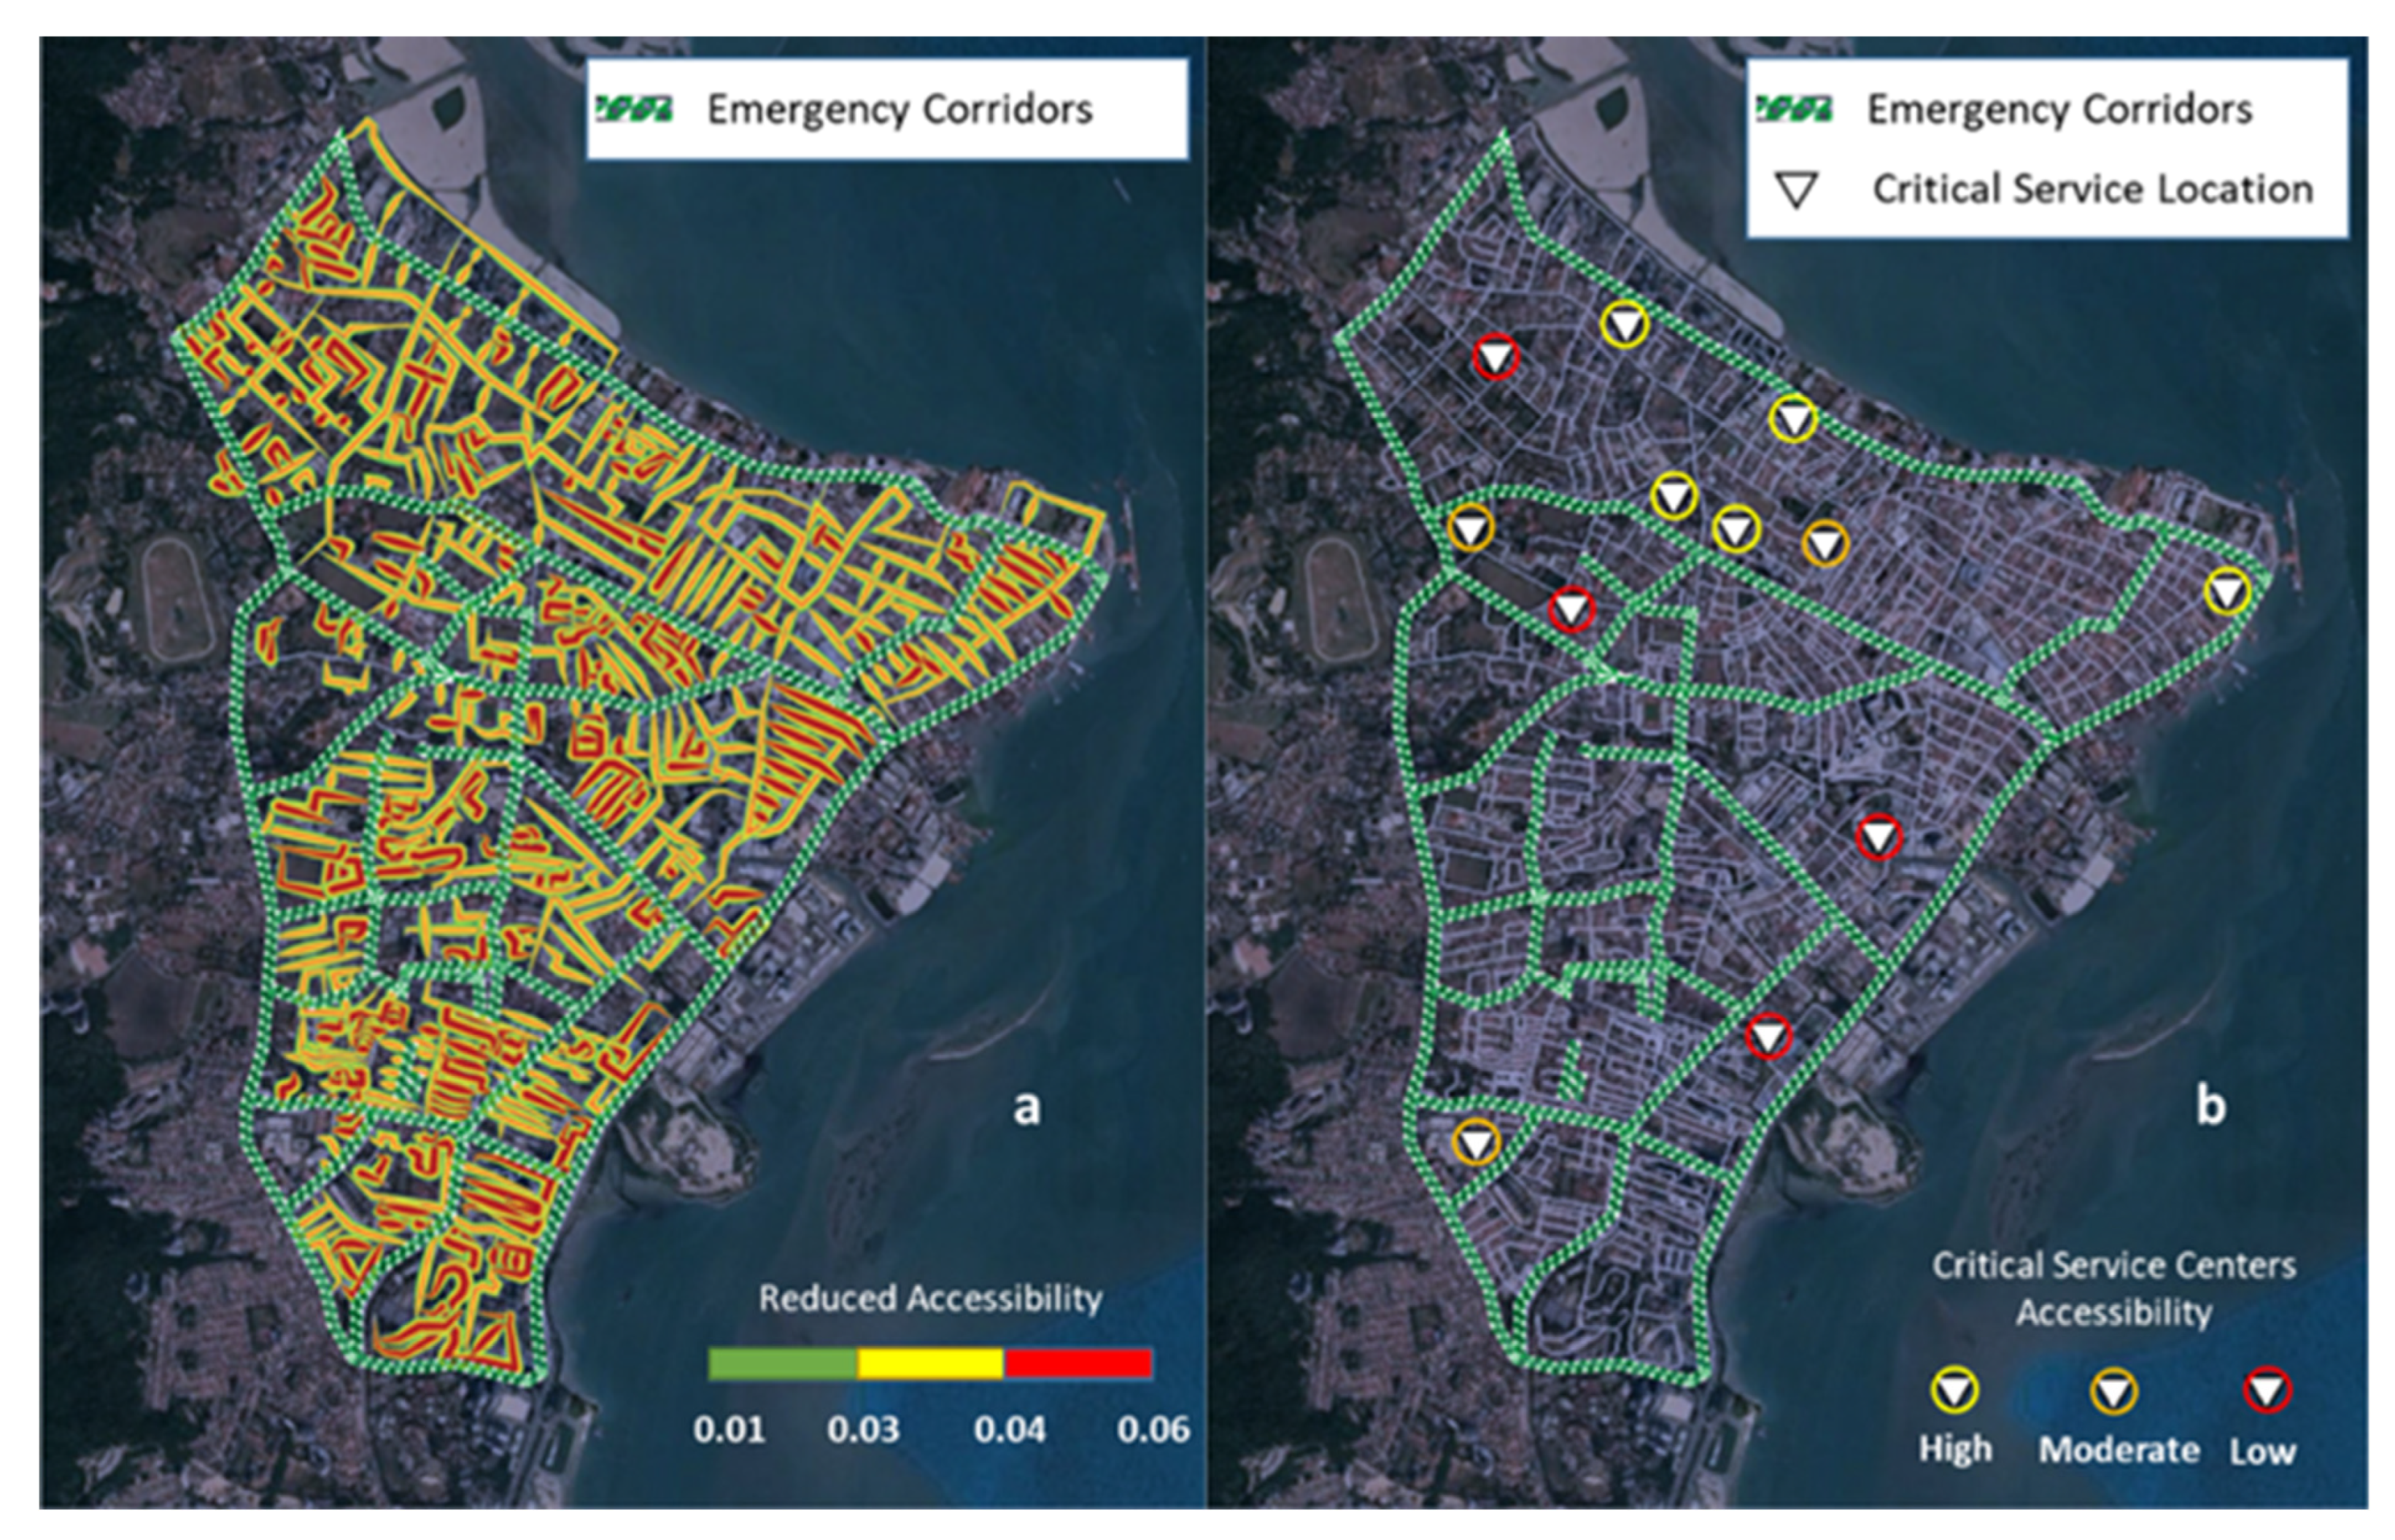
  • Traffic disruption approach for road network
The traffic disruption is assessed following the steps described in Section 2.2 using the results of stage 1. The level of accessibility is characterised by three different colours (green, yellow, and red); red signifies a highly reduced accessibility. The results showed that the accessibility is reduced sharply for the roads that have high a Seismic Vulnerability Index (SVI) score with values between 0.04 and 0.06, while the roads with moderate reduced accessibility values range between 0.03 and 0.04 for the roads that have a moderate VI score as shown in Figure 17a.
Figure 17b shows the main extracted emergency corridors with the critical service location and ranges of their accessibility. The emergency corridors represent the roads that have the lowest VI, in other words, the highest resistive roads. The accessibility of the critical service centres is assessed based on the distance from the emergency corridors to the critical service locations, taking into consideration the disruption of roads, i.e., roads with the highest VI scores (red coloured roads in Figure 16). The following results highlight the reduced accessibility of the critical service centres based on an integration with the seismic vulnerability assessment, which creates an integrated tool for assessing road networks accessibility compared with previous studies that focus on physical or functional aspects alone.

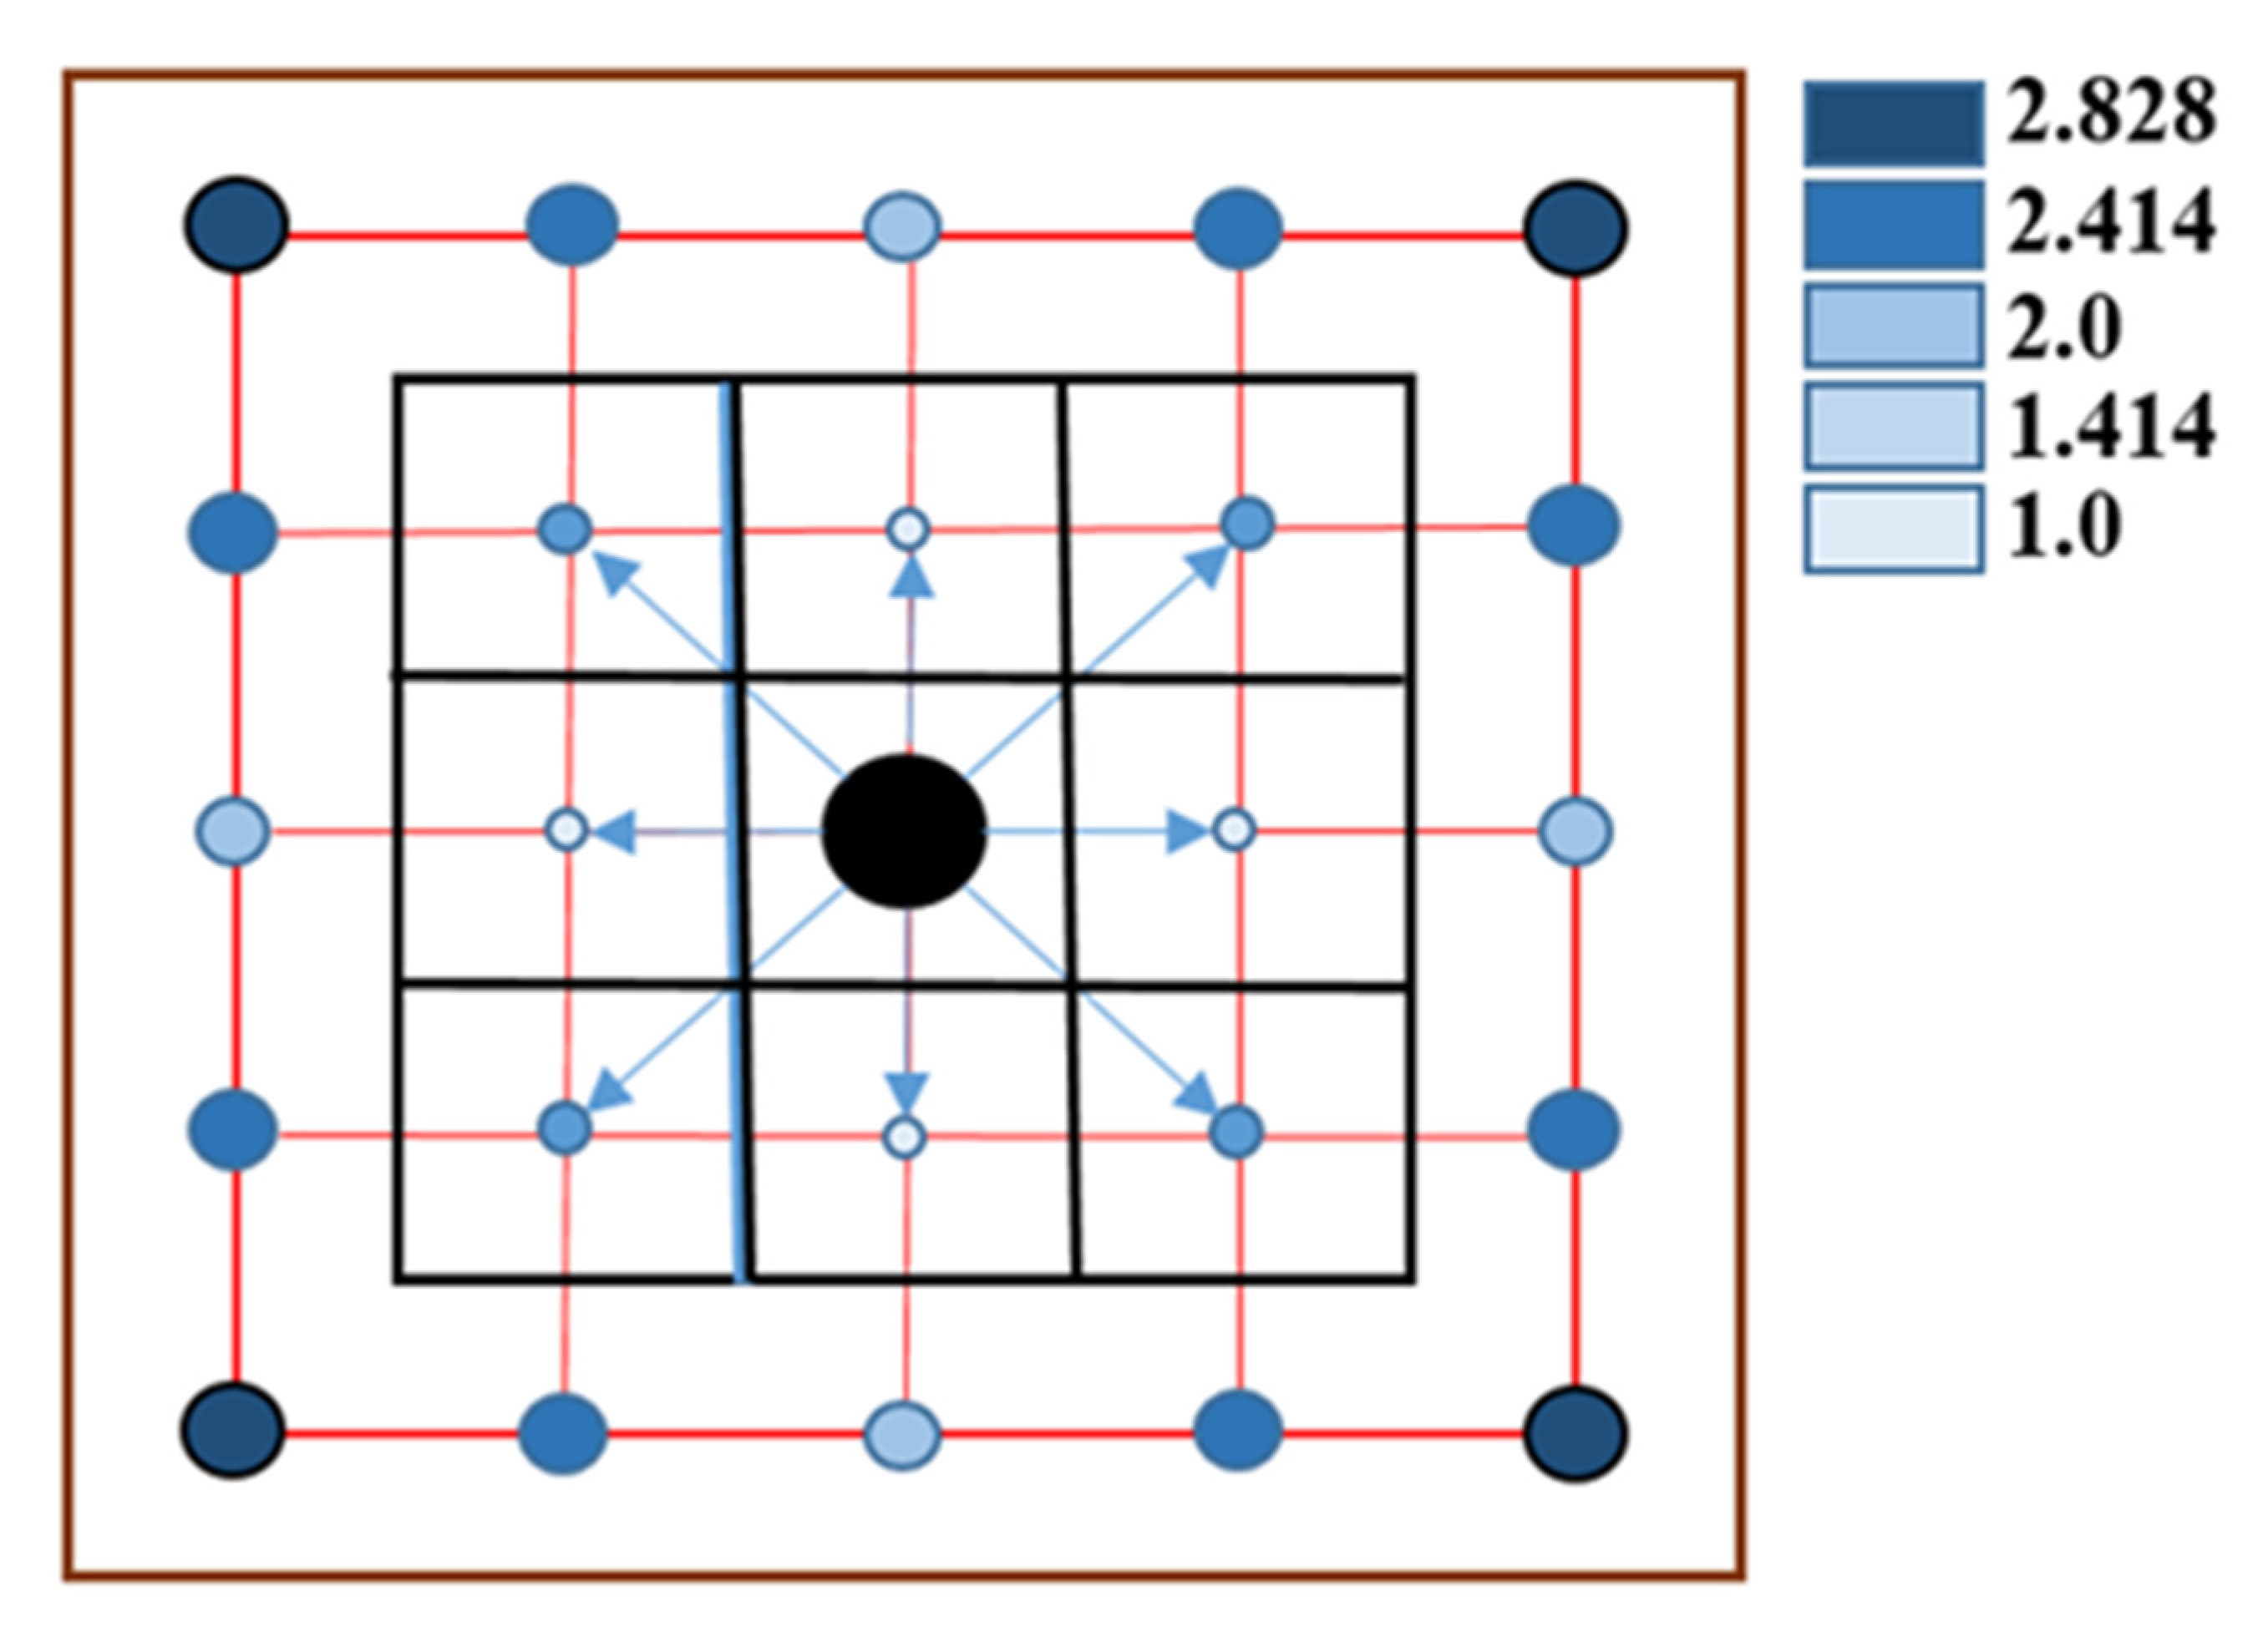
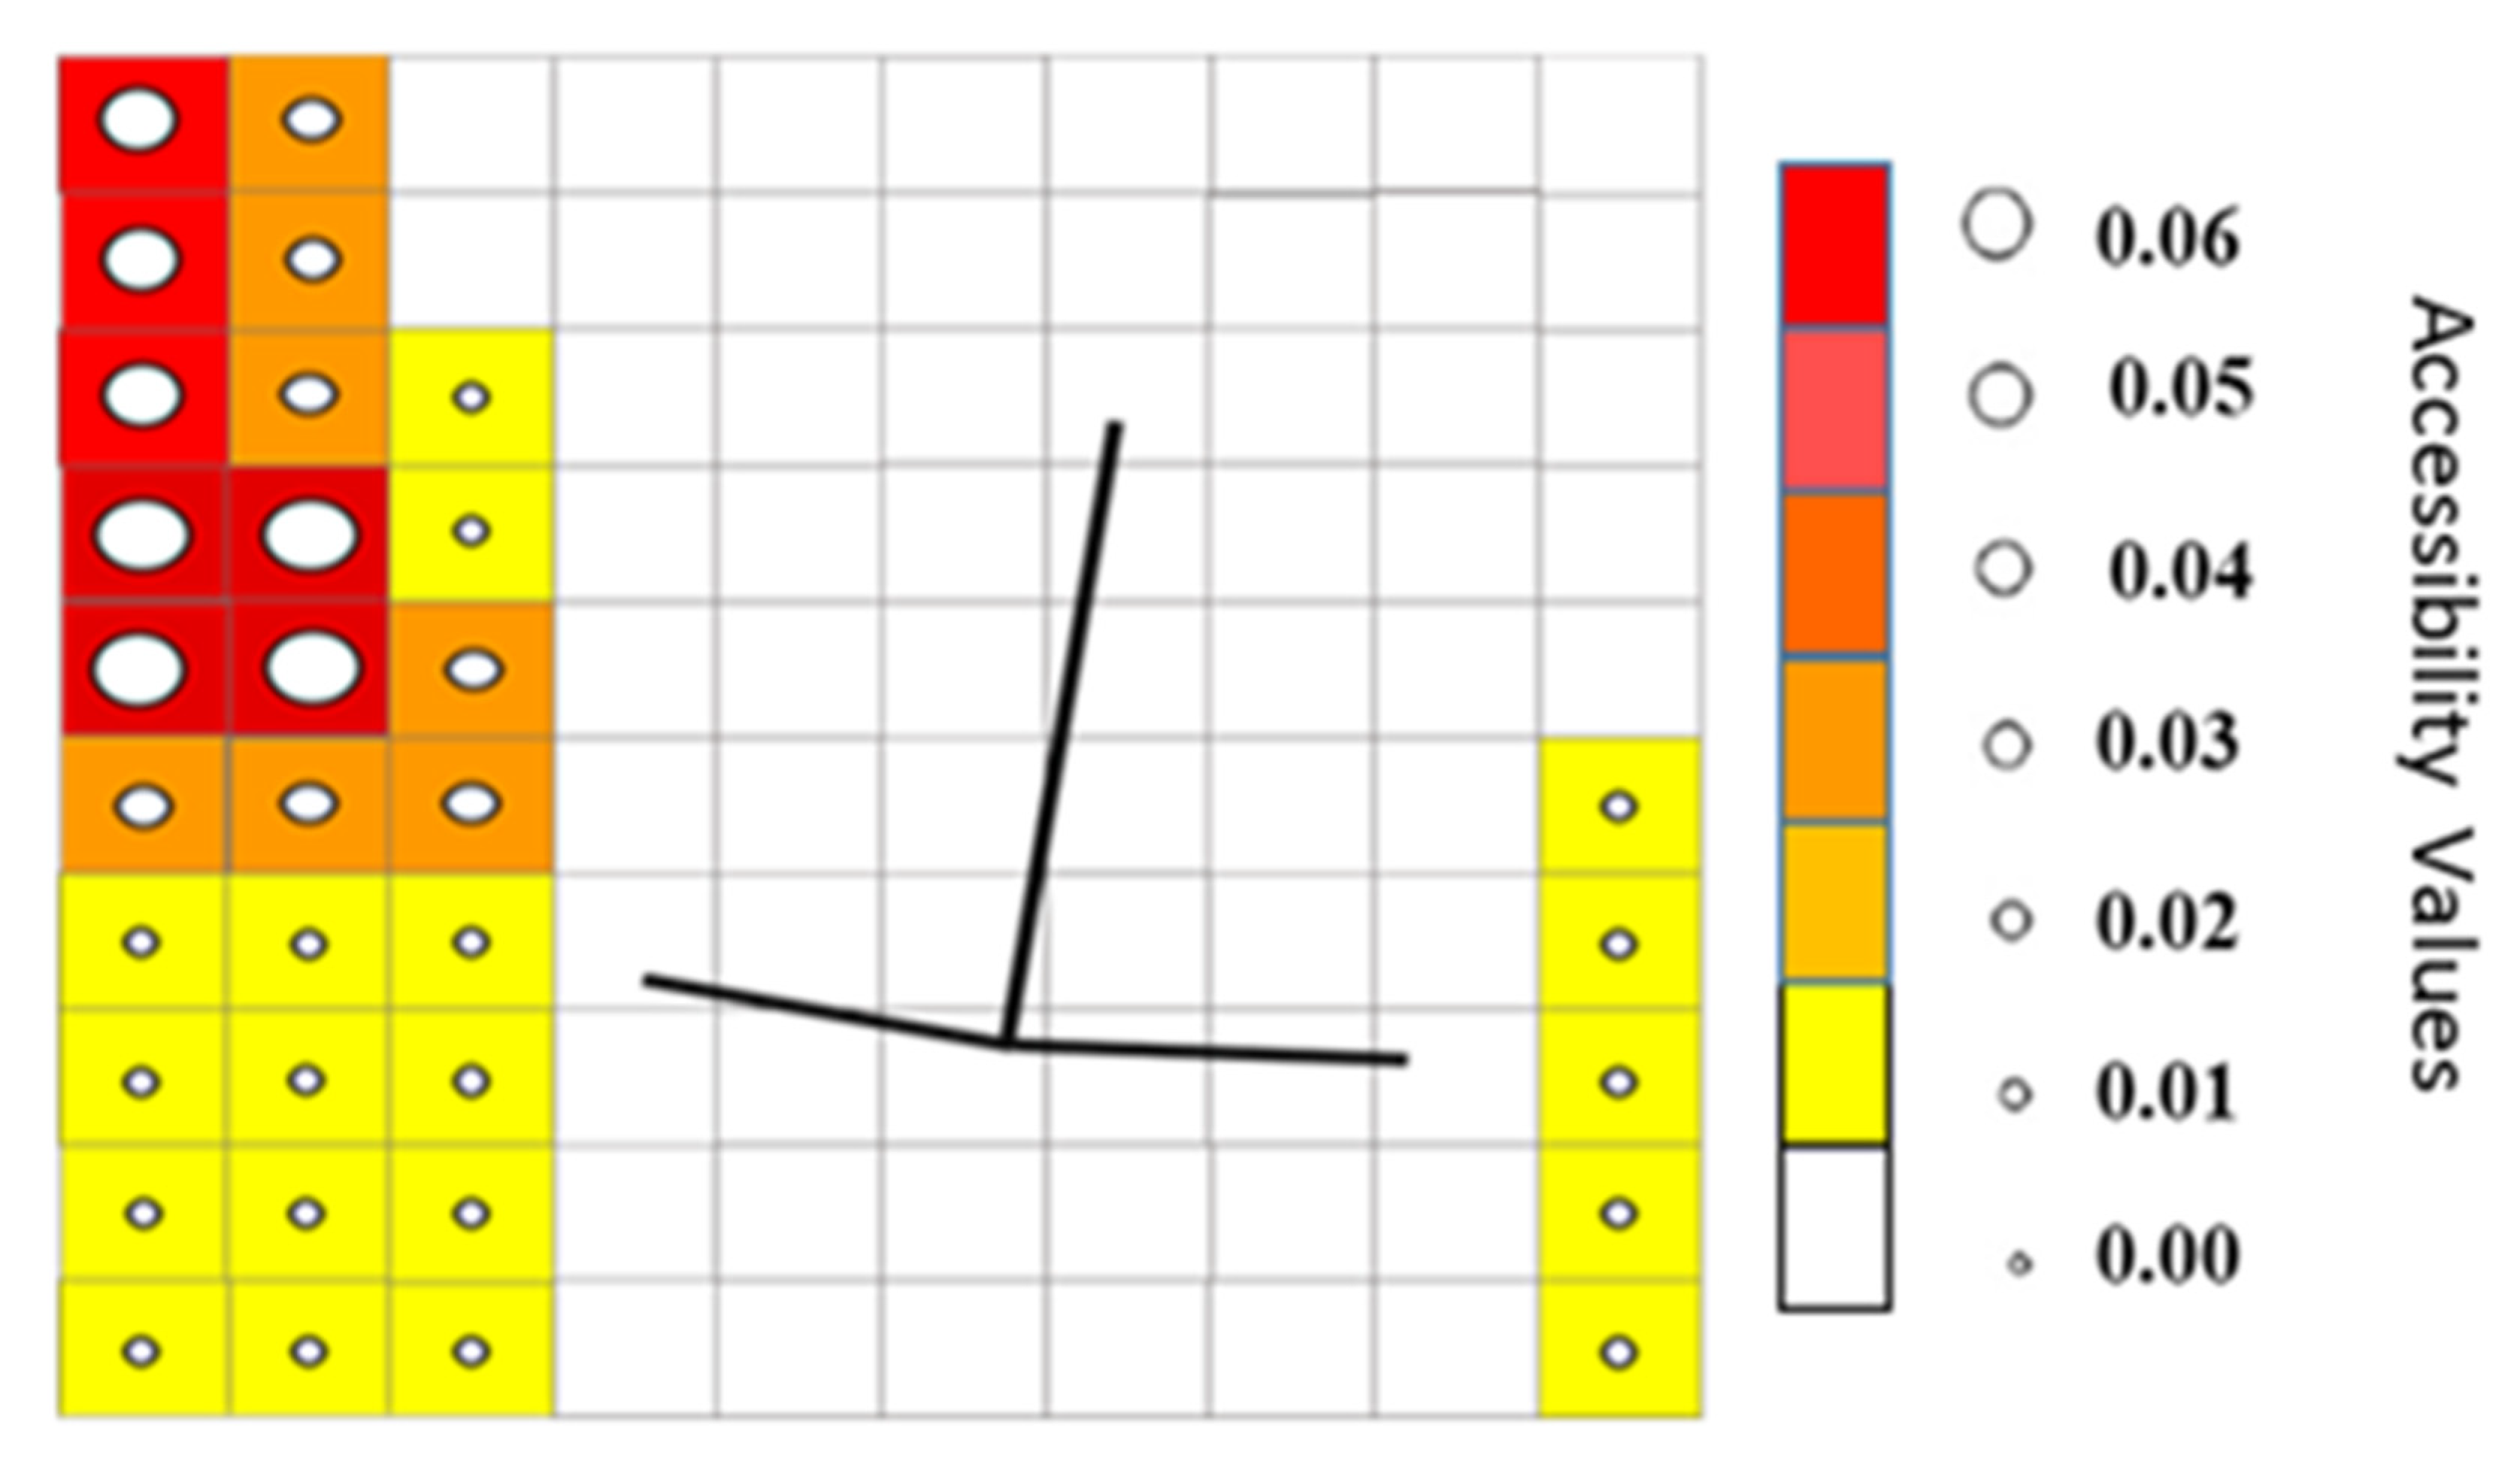
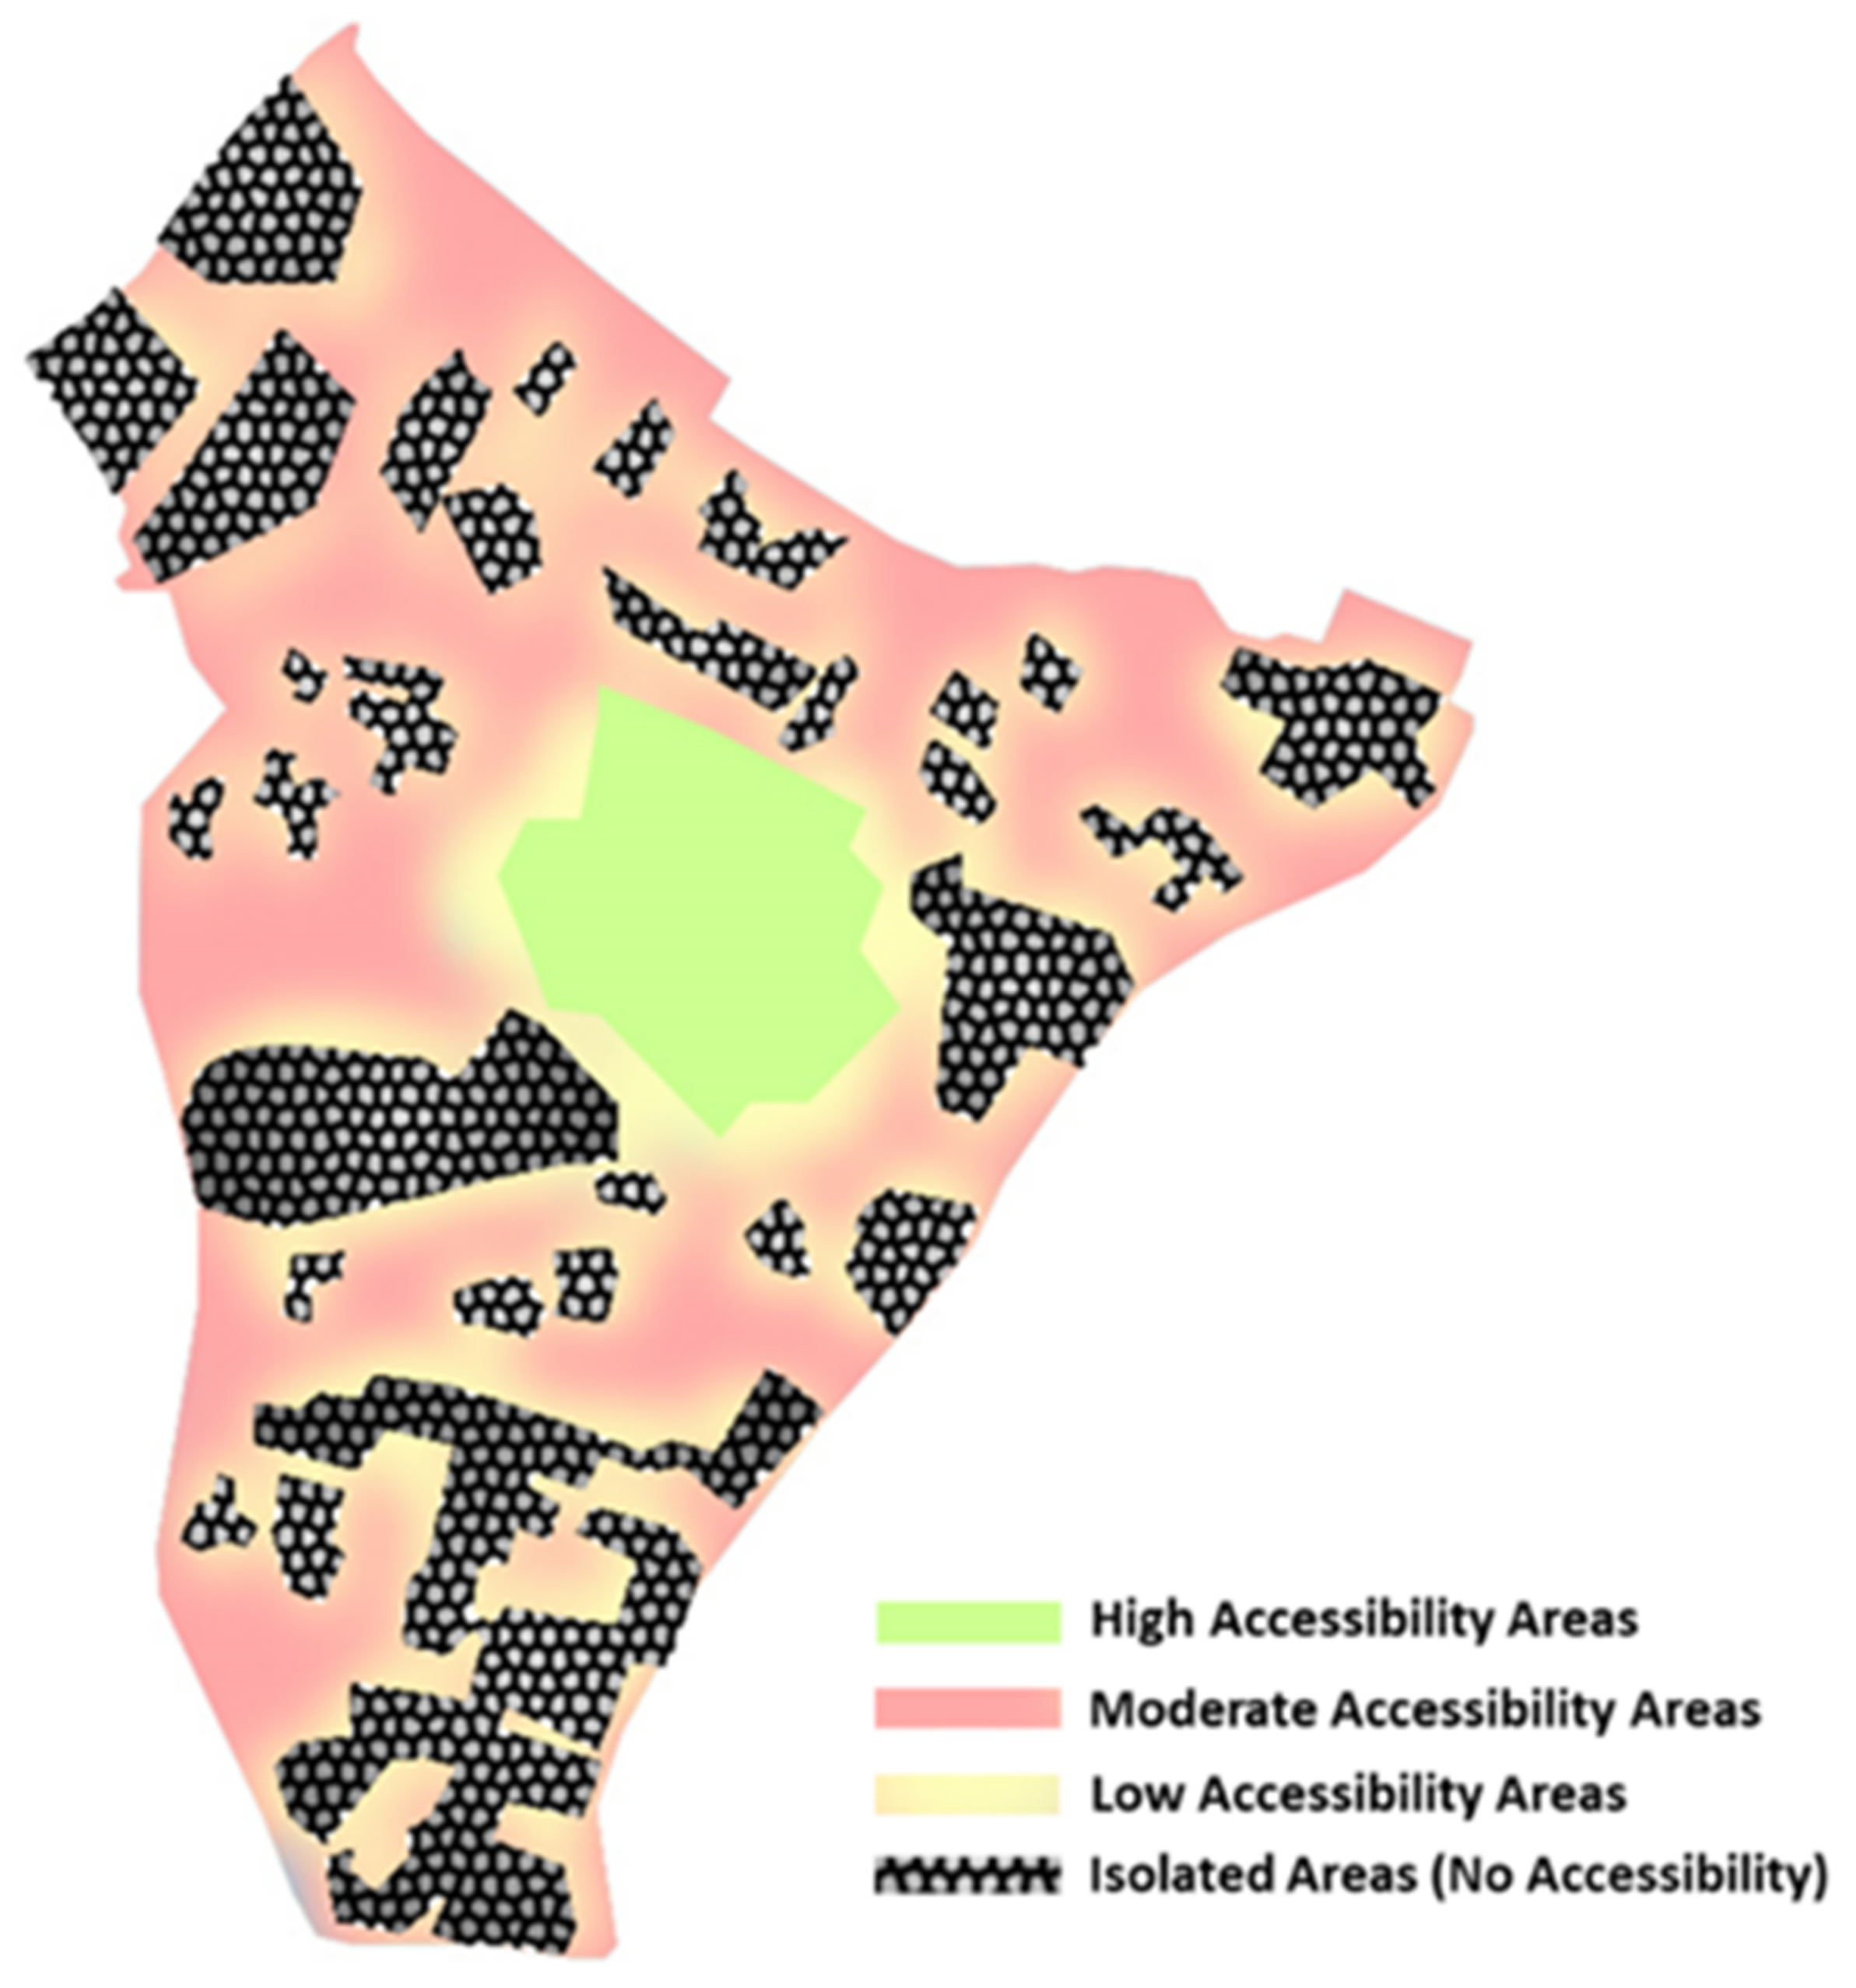
Traffic Disruption Approach for Main Districts (Accessibility of Areas)

The traffic disruption approach for the main districts is assessed on the basis of the cost distance and the reduced accessibility, which are defined in Section 2.2. The reduced accessibility values (level of isolation) are calculated based on the difference between the two cumulative costs. Furthermore, different levels of isolation are categorized by referring to the reduced accessibility values which are, high (0.01–0.03), moderate (0.03–0.04), and low (0.04–0.06) accessibility areas, and the isolated zones that contain many roads with values higher than 0.06 of reduced accessibility as shown in Figure 18. The results showed compatibility between the vulnerability and accessibility approach, demonstrating a directly proportional relation between the Vulnerability Index (VI) and the reduced accessibility levels.

5. Conclusions

The main aim of this research is to develop an integrated model for the assessment of the seismic vulnerability of road networks and their assets by combining vulnerability with accessibility assessment approaches, where the focus in this research is on the road sections without considering other road network elements such as bridges, tunnels, and retaining walls. The model sheds light on the importance of using integrated tools for more realistic and detailed outcomes, which can support the decisionmakers’ disaster risk reduction. Moreover, the criticality of this research lies in assessing the pre- and post-earthquake accessibility levels for the critical service centres.
This research is considered an original framework for building an analytical investigation approach and integrating the seismic vulnerability of road networks in terms of physical and functionality assessment of roadway systems, which aims to improve the established methods that have been performed in previous studies. Fragility functions are used to extract and compare the percentage of improvement related to the four investigated parameters. Findings demonstrate that the height of the embankment is the most significant parameter with the percentage of improvement, which ranges between 20% and 66%, followed by the number of lanes that is ranging between 38% and 48%. Meanwhile, soil type and pavement strength had lower efficiency rates with percentage of improvement ranging from 18% to 35% and 23% to 26%, respectively, thus indicating that soil type has a better efficiency compared with pavement strength. Additionally, a Seismic Vulnerability Index (SVI) approach was established by weighting different parameters based on analytical approach aimed at a more precise assessment of roadways and their assets. These precise results were used to generate more advanced and accurate procedures by integrating the analytical outcomes and GIS techniques, particularly for regional and complex road networks.
The variation in the data related to the vulnerability parameters and their weighting scores makes it difficult to develop a common vulnerability index perspective. For this reason, a new VI approach was developed by weighting the parameters based on analytically derived fragility functions aiming for more reliable assessment of roadways and their assets. The results show that the most effective parameter is the height of the embankment followed by the number of lanes, soil type, and pavement strength, where the effectiveness of each parameter over another is assessed at collapse state. The weight of the height of embankments and number of lanes are compatible with the weights of past studies, while the weights of soil type and pavement strength differ from past studies due to the variation in factors used and the integration between the vulnerability and accessibility approach. Furthermore, these results were used to conduct the accessibility index in a more advanced and precise way by integrating the analytical outcomes and GIS techniques, particularly in urban and complex networks.
Moreover, the case study in the city of Penang, established the main isolated regions, which are located mostly in the south and west of the area under study, signifying the main regions that need improved preparedness for emergency cases. In addition, the main emergency corridors, and the accessibility level to critical service centres were determined, which will help in planning and managing the disasters in the future, paving the way towards more resilient cities.
In conclusion, the integrated model can be useful in real-world settings to determine the relationships between all road network assets, to facilitate disaster management, and to lower mortality and financial losses during disasters. Future research should concentrate on creating accurate maps for disaster management, including the best places for essential service centres. The interdependencies between various infrastructures, such as electric power, water, transit, airports, or fuel should be the focus of future research. This includes, for example, the interaction rate between transportation networks and other systems [76,77]. In order to create advanced models in the future, resilience analytics and other emerging digital technologies should be supported [78,79].

Author Contributions

Conceptualization and methodology: A.M.E.-M., F.M.N. and M.M.K.; writing—original draft preparation: A.M.E.-M., F.M.N., M.M.K. and S.A.A.; writing—review and editing: S.A.A.; investigation, A.M.E.-M., F.M.N. and M.M.K.; resources, L.V.L.; data curation, L.V.L.; visualization: A.M.E.-M., L.V.L. and M.M.K.; supervision: F.M.N. and S.A.A. All authors have read and agreed to the published version of the manuscript.

Funding

This research was supported by Ministry of Higher Education (MOHE) through Fundamental Research Grant Scheme (FRGS/1/2020/TK02/USM/02/1).

Conflicts of Interest

The authors declare no conflict of interest.

References

  1. Freddi, F.; Galasso, C.; Cremen, G.; Dall’Asta, A.; Di Sarno, L.; Giaralis, A.; Gutiérrez-Urzúa, F.; Málaga-Chuquitaype, C.; Mitoulis, S.A.; Petrone, C. Innovations in earthquake risk reduction for resilience: Recent advances and challenges. Int. J. Disaster Risk Reduct. 2021, 60, 102267. [Google Scholar] [CrossRef]
  2. Quagliarini, E.; Bernardini, G.; Santarelli, S.; Lucesoli, M. Evacuation paths in historic city centres: A holistic methodology for assessing their seismic risk. Int. J. Disaster Risk Reduct. 2018, 31, 698–710. [Google Scholar] [CrossRef]
  3. Argyroudis, S.A.; Mitoulis, S.A.; Winter, M.G.; Kaynia, A.M. Fragility of transport assets exposed to multiple hazards: State-of-the-art review toward infrastructural resilience. Reliab. Eng. Syst. Saf. 2019, 191, 106567. [Google Scholar] [CrossRef]
  4. Eidsvig, U.; Tanasic, N.; Hajdin, R.; Ekeheien, C.; Piciullo, L. Vulnerability of terrestrial transportation lines to natural events. In EGU General Assembly Conference Abstracts; Austria Center Vienna: Veinna, Austria, 2020; p. 9542. [Google Scholar]
  5. Chang, S.E. Transportation planning for disasters: An accessibility approach. Environ. Plan. A 2003, 35, 1051–1072. [Google Scholar] [CrossRef]
  6. D’este, G.A.; Taylor, M.A. Network Vulnerability: An Approach to Reliability Analysis at the Level of National Strategic Transport Networks; Emerald Group Publishing Limited: Bingley, UK, 2003. [Google Scholar]
  7. Davidson, K.B. Accessibility in transport/land-use modelling and assessment. Environ. Plan. A 1977, 9, 1401–1416. [Google Scholar] [CrossRef]
  8. Hansen, W.G. How accessibility shapes land use. J. Am. Inst. Plan. 1959, 25, 73–76. [Google Scholar] [CrossRef]
  9. Luathep, P.; Sumalee, A.; Ho, H.; Kurauchi, F. Large-scale road network vulnerability analysis: A sensitivity analysis based approach. Transportation 2011, 38, 799–817. [Google Scholar] [CrossRef]
  10. Maltinti, F.; Melis, D.; Annunziata, F. Road network vulnerability: A review of the literature. In ICSDC 2011: Integrating Sustainability Practices in the Construction Industry; ASCE: Kansas City, MO, USA, 2012; pp. 677–685. [Google Scholar]
  11. Taylor, M.A. Critical transport infrastructure in Urban areas: Impacts of traffic incidents assessed using accessibility-based network vulnerability analysis. Growth Chang. 2008, 39, 593–616. [Google Scholar] [CrossRef]
  12. Balijepalli, C.; Oppong, O. Measuring vulnerability of road network considering the extent of serviceability of critical road links in urban areas. J. Transp. Geogr. 2014, 39, 145–155. [Google Scholar] [CrossRef]
  13. Chen, B.Y.; Lam, W.H.; Sumalee, A.; Li, Q.; Li, Z.-C. Vulnerability analysis for large-scale and congested road networks with demand uncertainty. Transp. Res. Part A Policy Pract. 2012, 46, 501–516. [Google Scholar] [CrossRef]
  14. Elnashai, A.S.; Borzi, B.; Vlachos, S. Deformation-based vulnerability functions for RC bridges. Struct. Eng. Mech. 2004, 17, 215–244. [Google Scholar] [CrossRef]
  15. Francini, M.; Gaudio, S.; Palermo, A.; Viapiana, M.F. A performance-based approach for innovative emergency planning. Sustain. Cities Soc. 2020, 53, 101906. [Google Scholar] [CrossRef]
  16. Huang, Q.; Gardoni, P.; Hurlebaus, S. A probabilistic damage detection approach using vibration-based nondestructive testing. Struct. Saf. 2012, 38, 11–21. [Google Scholar] [CrossRef]
  17. Muntasir Billah, A.; Shahria Alam, M. Seismic fragility assessment of highway bridges: A state-of-the-art review. Struct. Infrastruct. Eng. 2015, 11, 804–832. [Google Scholar] [CrossRef]
  18. Nagurney, A.; Qiang, Q. A transportation network efficiency measure that captures flows, behavior, and costs with applications to network component importance identification and vulnerability. In Proceedings of the POMS 18th Annual Conference, Dallas, TX, USA, 4–7 May 2007; Volume 4. [Google Scholar]
  19. Rupi, F.; Bernardi, S.; Rossi, G.; Danesi, A. The evaluation of road network vulnerability in mountainous areas: A case study. Netw. Spat. Econ. 2015, 15, 397–411. [Google Scholar] [CrossRef]
  20. Taylor, M.A.; Sekhar, S.V.; D’Este, G.M. Application of accessibility based methods for vulnerability analysis of strategic road networks. Netw. Spat. Econ. 2006, 6, 267–291. [Google Scholar] [CrossRef]
  21. Zanini, M.A.; Pellegrino, C.; Morbin, R.; Modena, C. Seismic vulnerability of bridges in transport networks subjected to environmental deterioration. Bull. Earthq. Eng. 2013, 11, 561–579. [Google Scholar] [CrossRef]
  22. Andreotti, G.; Lai, C.G. Use of fragility curves to assess the seismic vulnerability in the risk analysis of mountain tunnels. Tunn. Undergr. Space Technol. 2019, 91, 103008. [Google Scholar] [CrossRef]
  23. Argyroudis, S.; Kaynia, A.M. Fragility functions of highway and railway infrastructure. In SYNER-G: Typology Definition and Fragility Functions for Physical Elements at Seismic Risk; Springer: Berlin/Heidelberg, Germany, 2014; pp. 299–326. [Google Scholar]
  24. Ghosh, J.; Padgett, J.E.; Sánchez-Silva, M. Seismic damage accumulation in highway bridges in earthquake-prone regions. Earthq. Spectra 2015, 31, 115–135. [Google Scholar] [CrossRef]
  25. Kaynia, A.; Mayoral, J.; Johansson, J.; Argyroudis, S.; Pitilakis, K.; Anastasiadis, A. Fragility functions for roadway system elements. SYNER-G Proj. Deliv. 2011, 3, 109. Available online: http://www.vce.at/SYNER-G/files/dissemination/deliverables.html (accessed on 15 September 2022).
  26. Maruyama, Y.; Yamazaki, F.; Mizuno, K.; Tsuchiya, Y.; Yogai, H. Fragility curves for expressway embankments based on damage datasets after recent earthquakes in Japan. Soil Dyn. Earthq. Eng. 2010, 30, 1158–1167. [Google Scholar] [CrossRef]
  27. Nielson, B.G.; DesRoches, R. Analytical seismic fragility curves for typical bridges in the central and southeastern United States. Earthq. Spectra 2007, 23, 615–633. [Google Scholar] [CrossRef]
  28. Stefanidou, S.P.; Kappos, A.J. Methodology for the development of bridge-specific fragility curves. Earthq. Eng. Struct. Dyn. 2017, 46, 73–93. [Google Scholar] [CrossRef]
  29. Adafer, S.; Bensaibi, M. Seismic vulnerability classification of roads. Energy Procedia 2017, 139, 624–630. [Google Scholar] [CrossRef]
  30. Djemai, M.; Bensaibi, M.; Zellat, K. Seismic vulnerability assessment of bridges using analytical hierarchy process. IOP Conf. Ser. Mater. Sci. Eng. 2019, 615, 012106. [Google Scholar]
  31. Werner, S.D.; Taylor, C.E.; Cho, S.; Lavoie, J.-P.; Huyck, C.K.; Eitzel, C.; Chung, H.; Eguchi, R.T. Redars 2 Methodology and Software for Seismic Risk Analysis of Highway Systems; US Department of Transportation Federal Highway Administration: Washington, DC, USA, 2006.
  32. Winter, M.; Smith, J.; Fotopoulou, S.; Pitilakis, K.; Mavrouli, O.; Corominas, J.; Argyroudis, S. An expert judgement approach to determining the physical vulnerability of roads to debris flow. Bull. Eng. Geol. Environ. 2014, 73, 291–305. [Google Scholar] [CrossRef]
  33. El-Maissi, A.M.; Argyroudis, S.A.; Nazri, F.M. Seismic vulnerability assessment methodologies for roadway assets and networks: A state-of-the-art review. Sustainability 2020, 13, 61. [Google Scholar] [CrossRef]
  34. Bocchini, P.; Frangopol, D.M. Connectivity-based optimal scheduling for maintenance of bridge networks. J. Eng. Mech. 2013, 139, 760–769. [Google Scholar] [CrossRef]
  35. Morbin, R.; Zanini, M.; Pellegrino, C.; Zhang, H.; Modena, C. A probabilistic strategy for seismic assessment and FRP retrofitting of existing bridges. Bull. Earthq. Eng. 2015, 13, 2411–2428. [Google Scholar] [CrossRef]
  36. Argyroudis, S.A.; Mitoulis, S.A.; Hofer, L.; Zanini, M.A.; Tubaldi, E.; Frangopol, D.M. Resilience assessment framework for critical infrastructure in a multi-hazard environment: Case study on transport assets. Sci. Total Environ. 2020, 714, 136854. [Google Scholar] [CrossRef]
  37. O’Reilly, G.J.; Perrone, D.; Fox, M.; Monteiro, R.; Filiatrault, A. Seismic assessment and loss estimation of existing school buildings in Italy. Eng. Struct. 2018, 168, 142–162. [Google Scholar] [CrossRef]
  38. Kassem, M.M.; Nazri, F.M.; Farsangi, E.N. The seismic vulnerability assessment methodologies: A state-of-the-art review. Ain Shams Eng. J. 2020, 11, 849–864. [Google Scholar] [CrossRef]
  39. Zanini, M.A.; Faleschini, F.; Zampieri, P.; Pellegrino, C.; Gecchele, G.; Gastaldi, M.; Rossi, R. Post-quake urban road network functionality assessment for seismic emergency management in historical centres. Struct. Infrastruct. Eng. 2017, 13, 1117–1129. [Google Scholar] [CrossRef]
  40. Ertugay, K.; Argyroudis, S.; Düzgün, H.Ş. Accessibility modeling in earthquake case considering road closure probabilities: A case study of health and shelter service accessibility in Thessaloniki, Greece. Int. J. Disaster Risk Reduct. 2016, 17, 49–66. [Google Scholar] [CrossRef]
  41. Li, H.; Zhao, L.; Huang, R.; Hu, Q. Hierarchical earthquake shelter planning in urban areas: A case for Shanghai in China. Int. J. Disaster Risk Reduct. 2017, 22, 431–446. [Google Scholar] [CrossRef]
  42. Tesfamariam, S.; Saatcioglu, M. Seismic vulnerability assessment of reinforced concrete buildings using hierarchical fuzzy rule base modeling. Earthq. Spectra 2010, 26, 235–256. [Google Scholar] [CrossRef]
  43. Urbina, E.; Wolshon, B. National review of hurricane evacuation plans and policies: A comparison and contrast of state practices. Transp. Res. Part A Policy Pract. 2003, 37, 257–275. [Google Scholar] [CrossRef]
  44. Chong, N.O.; Kamarudin, K.H. Disaster risk management in Malaysia: Issues and challenges from the persepctive of agencies. Plan. Malays. 2018, 16. [Google Scholar] [CrossRef]
  45. Khuzzan, S.M.S.; Mohyin, N.A.; Izuddin, S. Post Disaster Management (PDM) in Malaysia: Issues and Challenges. Adv. Sci. Lett. 2017, 23, 6390–6393. [Google Scholar] [CrossRef]
  46. Barnes, B.; Dunn, S.; Wilkinson, S. Natural hazards, disaster management and simulation: A bibliometric analysis of keyword searches. Nat. Hazards 2019, 97, 813–840. [Google Scholar] [CrossRef]
  47. Marinoni, O. Implementation of the analytical hierarchy process with VBA in ArcGIS. Comput. Geosci. 2004, 30, 637–646. [Google Scholar] [CrossRef]
  48. Rikalovic, A.M.; Cocić, I. GIS based multi-criteria decision analysis for industrial site selection: The state of the art. J. Appl. Eng. Sci. 2014, 12, 197–206. [Google Scholar] [CrossRef] [Green Version]
  49. Bono, F.; Gutiérrez, E. A network-based analysis of the impact of structural damage on urban accessibility following a disaster: The case of the seismically damaged Port Au Prince and Carrefour urban road networks. J. Transp. Geogr. 2011, 19, 1443–1455. [Google Scholar] [CrossRef]
  50. Mitoulis, S.A.; Argyroudis, S.A.; Loli, M.; Imam, B. Restoration models for quantifying flood resilience of bridges. Eng. Struct. 2021, 238, 112180. [Google Scholar] [CrossRef]
  51. Foulser-Piggott, R.; Bowman, G.; Hughes, M. A framework for understanding uncertainty in seismic risk assessment. Risk Anal. 2020, 40, 169–182. [Google Scholar] [CrossRef] [PubMed]
  52. Kilanitis, I.; Sextos, A. Integrated seismic risk and resilience assessment of roadway networks in earthquake prone areas. Bull. Earthq. Eng. 2019, 17, 181–210. [Google Scholar] [CrossRef]
  53. Mattsson, L.-G.; Jenelius, E. Vulnerability and resilience of transport systems—A discussion of recent research. Transp. Res. Part A Policy Pract. 2015, 81, 16–34. [Google Scholar] [CrossRef]
  54. Buratti, G.; Celati, S.; Cosentino, A.; Gaudioso, D.; Mazzatura, I.; Morelli, F.; Salvatore, W. The new guidelines of Italian Ministry of Infrastructures for the structural risk classification of existing bridges: Genesis, examples of application and practical considerations. In Proceedings of the International Conference of the European Association on Quality Control of Bridges and Structures, Padova, Italy, 29 August–1 September 2021; pp. 835–844. [Google Scholar]
  55. Pellegrino, C.; Faleschini, F.; Zanini, M.A.; Matos, J.C.; Casas, J.R.; Strauss, A. Proceedings of the 1st Conference of the European Association on Quality Control of Bridges and Structures: EUROSTRUCT 2021, Padua, Italy, 29 August–1 September 2021; Springer Nature: Berlin/Heidelberg, Germany, 2021; Volume 200.
  56. Santarelli, S.; Bernardini, G.; Quagliarini, E.; D’Orazio, M. New indices for the existing city-centers streets network reliability and availability assessment in earthquake emergency. Int. J. Archit. Herit. 2018, 12, 153–168. [Google Scholar]
  57. Mosoarca, M.; Onescu, I.; Onescu, E.; Anastasiadis, A. Seismic vulnerability assessment methodology for historic masonry buildings in the near-field areas. Eng. Fail. Anal. 2020, 115, 104662. [Google Scholar] [CrossRef]
  58. Alamanis, N. Failure of Slopes and Embankments Under Static and Seismic Loading. Am. Sci. Res. J. Eng. Technol. Sci. 2017, 35, 95–126. [Google Scholar]
  59. Caiado, G.; Oliveira, C.; Ferreira, M.A.; Sá, F. Assessing urban road network seismic vulnerability: An integrated approach. In Proceedings of the 15WCEE, Lisbon, Portugal, 24–28 September 2012. [Google Scholar]
  60. Pitilakis, K.; Argyroudis, S. Seismic vulnerability assessment: Lifelines. In Encyclopedia of Earthquake Engineering; Springer: Berlin/Heidelberg, Germany, 2014. [Google Scholar]
  61. EC8; Eurocode 8: Design of Structures for Earthquake Resistance—Part 1: General Rules, Seismic Actions and Rules for Buildings. European Standard: Brussels, Belgium, 2004.
  62. Giuliani, F.; De Falco, A.; Cutini, V. The role of urban configuration during disasters. A scenario-based methodology for the post-earthquake emergency management of Italian historic centres. Saf. Sci. 2020, 127, 104700. [Google Scholar] [CrossRef]
  63. Zakaria, N.M.; Yusoff, N.I.M.; Hardwiyono, S.; Mohd Nayan, K.A.; El-Shafie, A. Measurements of the stiffness and thickness of the pavement asphalt layer using the enhanced resonance search method. Sci. World J. 2014, 2014, 594797. [Google Scholar] [CrossRef] [PubMed]
  64. Silva, V.; Akkar, S.; Baker, J.; Bazzurro, P.; Castro, J.M.; Crowley, H.; Dolsek, M.; Galasso, C.; Lagomarsino, S.; Monteiro, R. Current challenges and future trends in analytical fragility and vulnerability modeling. Earthq. Spectra 2019, 35, 1927–1952. [Google Scholar] [CrossRef]
  65. Vamvatsikos, D.; Cornell, C.A. Direct estimation of the seismic demand and capacity of MDOF systems through incremental dynamic analysis of an SDOF approximation. ASCE J. Struct. Eng. 2005, 131, 589–599. [Google Scholar] [CrossRef] [Green Version]
  66. Cordova, P.P.; Deierlein, G.G.; Mehanny, S.S.; Cornell, C.A. Development of a two-parameter seismic intensity measure and probabilistic assessment procedure. In Proceedings of the Second US-Japan Workshop on Performance-Based Earthquake Engineering Methodology for Reinforced Concrete Building Structures, Sapporo, Japan, 11–13 September 2000; pp. 187–206. [Google Scholar]
  67. Shome, N.; Cornell, C.A.; Bazzurro, P.; Carballo, J.E. Earthquakes, records, and nonlinear responses. Earthq. Spectra 1998, 14, 469–500. [Google Scholar] [CrossRef]
  68. Federal Emergency Management Agency (FEMA) Publications. 750, NEHRP Recommended Seismic Provisions for New Buildings and Other Structures; Building Seismic Safety Council of the National Institute of Building Sciences: Washington, DC, USA, 2009.
  69. HAZUS-MH, N. Users’s Manual and Technical Manuals. Report Prepared for the Federal Emergency Management Agency; Federal Emergency Management Agency (FEMA): Washington, DC, USA, 2004.
  70. Ibrahim, Y.E.; El-Shami, M.M. Seismic fragility curves for mid-rise reinforced concrete frames in Kingdom of Saudi Arabia. IES J. Part A Civ. Struct. Eng. 2011, 4, 213–223. [Google Scholar] [CrossRef]
  71. Argyroudis, S.; Kaynia, A.M. Analytical seismic fragility functions for highway and railway embankments and cuts. Earthq. Eng. Struct. Dyn. 2015, 44, 1863–1879. [Google Scholar] [CrossRef]
  72. bin Rambat, S.; Shi, Z.; bin Mazlan, S.A. Seismic Vulnerability Assessment in Ranau, Sabah, Using Two Different Models. ISPRS Int. J. Geo-Inf. 2021, 10, 271. [Google Scholar]
  73. El Maissi, A.M.; Argyroudis, S.A.; Kassem, M.M.; Leong, L.V.; Mohamed Nazri, F. Integrating Intrinsic and Eccentric Seismic Vulnerability Indices to Prioritize Road Network Accessibility. Adv. Civ. Eng. 2022, 2022, 5888020. [Google Scholar] [CrossRef]
  74. El-Maissi, A.M.; Argyroudis, S.A.; Kassem, M.M.; Nazri, F.M. Development of Intrinsic Seismic Vulnerability Index (ISVI) for Assessing Roadway System and its Assets Framework. MethodsX 2022, 9, 101818. [Google Scholar] [CrossRef]
  75. Saaty, T.L. A scaling method for priorities in hierarchical structures. J. Math. Psychol. 1977, 15, 234–281. [Google Scholar] [CrossRef]
  76. Collier, Z.A.; Lambert, J.H.; Linkov, I. Advanced Analytics for Environmental Resilience and a Sustainable Future; Springer: Berlin/Heidelberg, Germany, 2021; Volume 41, pp. 1–2. [Google Scholar]
  77. Häring, I.; Fehling-Kaschek, M.; Miller, N.; Faist, K.; Ganter, S.; Srivastava, K.; Jain, A.K.; Fischer, G.; Fischer, K.; Finger, J. A performance-based tabular approach for joint systematic improvement of risk control and resilience applied to telecommunication grid, gas network, and ultrasound localization system. Environ. Syst. Decis. 2021, 41, 286–329. [Google Scholar] [CrossRef]
  78. Naderpajouh, N.; Matinheikki, J.; Keeys, L.A.; Aldrich, D.P.; Linkov, I. Resilience and projects: An interdisciplinary crossroad. Proj. Leadersh. Soc. 2020, 1, 100001. [Google Scholar] [CrossRef]
  79. Argyroudis, S.A.; Mitoulis, S.A.; Chatzi, E.; Baker, J.W.; Brilakis, I.; Gkoumas, K.; Vousdoukas, M.; Hynes, W.; Carluccio, S.; Keou, O. Digital technologies can enhance climate resilience of critical infrastructure. Clim. Risk Manag. 2022, 35, 100387. [Google Scholar] [CrossRef]
Figure 2. Integrated approach for road network vulnerability and its assets.
Sustainability 14 12474 g002
Figure 3. Main classified parameters of the roadway under investigation.
Sustainability 14 12474 g003
Figure 4. Example of a road network with representation of critical service centre’s location.
Sustainability 14 12474 g004
Figure 5. (a) Undamaged road network, (b) damaged road network after earthquakes, and (c) road network with located road interruptions and isolated areas.
Sustainability 14 12474 g005
Figure 6. (a) Cost distance for undamaged network and (b) Cost distance for damaged network. Smaller size of the blue points represents lower cost in terms of travelled distance [74].
Sustainability 14 12474 g006
Figure 7. Cost function: Cost distance development using raster set.
Sustainability 14 12474 g007
Figure 8. Reduced accessibility map.
Sustainability 14 12474 g008
Figure 9. Map with a representation for the main districts of the main area under investigation.
Sustainability 14 12474 g009
Figure 10. Ground motion scaling with respect to target spectrum in case of before scaling, after scaling, and mean matched spectrum with respect to target spectrum of Penang.
Sustainability 14 12474 g010
Figure 11. IDA curves showing Sa (T1) values for (a) embankment height and (b) number of lanes for different vulnerability classes.
Sustainability 14 12474 g011
Figure 12. IDA curves showing Sa (T1) values for (a) soil type and (b) pavement strength for different vulnerability classes.
Sustainability 14 12474 g012
Figure 13. Numerical fragility functions for different roadway assets (a) height of embankment and (b) pavement strength.
Sustainability 14 12474 g013
Figure 14. Numerical fragility functions for different roadway assets (a) type of soil and (b) road width.
Sustainability 14 12474 g014
Figure 15. Validation process of the Seismic Vulnerability Index (SVI) in comparison with Adafer and Bensaibi [29].
Sustainability 14 12474 g015
Figure 16. Seismic vulnerability indexed map for road network under investigation.
Sustainability 14 12474 g016
Figure 17. (a) Seismic vulnerability indexed map for road network under study (b) main emergency corridors and locations of the critical services.
Sustainability 14 12474 g017
Figure 18. Accessibility map for the main districts under study.
Sustainability 14 12474 g018
Table 1. Vulnerability classes for the investigated roadway parameters based on Adafer and Bensaibi [29] and Zakaria et al. [63].
Investigated Parameter Defined Vulnerability Class
Parameter (P1) Vulnerability Classes
EmbankmentLowModerateHigh
HeightH > 8 m5 m < H ≤ 8 m2 m < H ≤ 5 m
Parameter (P2) Vulnerability Classes
PavementLowModerateHigh
Elastic Modulus3929 MPa10828 MPa17,726 MPa
Thickness of Pavement0.04 m0.08 m0.14 m
Parameter (P3) Vulnerability Classes
Ground ConditionLowModerateHigh
Soil TypeType DType CType B
Parameter (P4) Vulnerability Classes
Road WidthLowModerateHigh
Number of Lanes<2 lanes=2 lanes>2 lanes
Table 2. Selected sets of ground motion records.
#EarthquakeYearStationPGA (g)Epicentral Distance (km)Magnitude (Mw)
1Izmit-Kocaeli, Turkey1999Nuclear Research Center0.1811017.4
2Landers USA1992San Bernardino, CA0.332807.3
3Superstition Hills, USA1987Calipatria, CA0.252276.5
4Chi-Chi, Taiwan1999Taichung0.527397.6
5Loma-Prieta, USA1989Emeryville, CA0.490687.0
6Northridge, USA1994Santa Monica, CA0.684286.7
7Ranau, Sabah, Malaysia2015KKM_HNE0.125656.1
Table 3. Damage states of roadway and its assets [71].
ServiceabilityDamage States (DS)Direct DamagesIndirect Damages
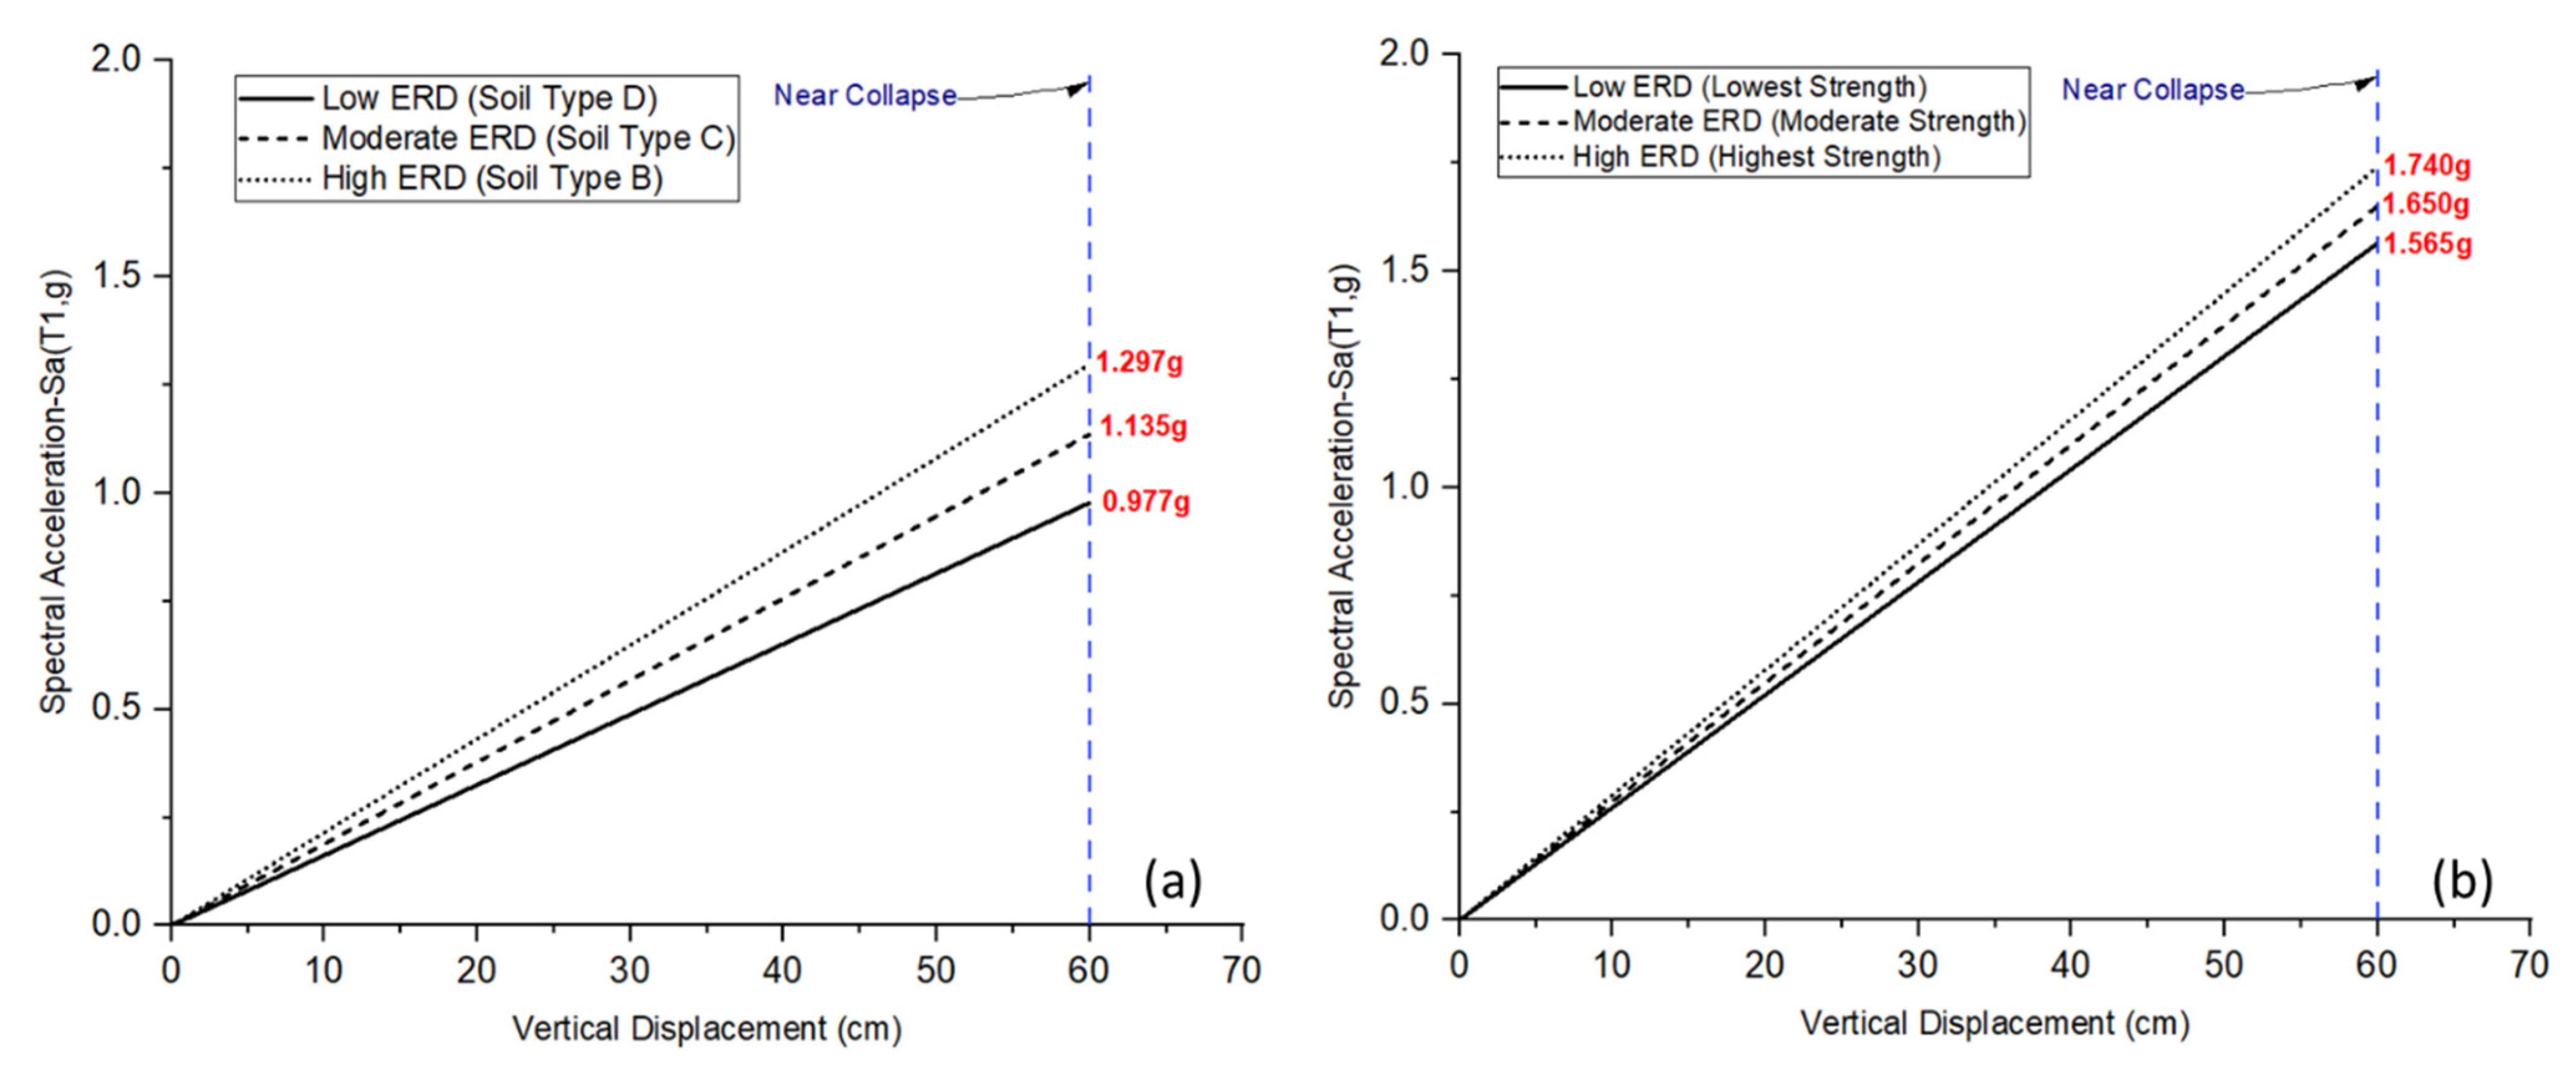
Fully or partially closed due to temporary maintenance and traffic for a few weeks or a few months.ExtensiveMajor settlement or
offset of the ground
(>60 cm)
Considerable debris of collapsed structures
Fully closed due to temporary maintenance for a few days. Partially closed to traffic due to permanent maintenance for a few weeks.ModerateModerate
settlement or offset
of the ground
(30 to 60 cm)
Moderate amount of debris of collapsed structures
Open to traffic. Reduced speed during maintenance.MinorSlight settlement (<30 cm) or offset of the groundMinor amount of debris of collapsed structures
Fully open.None-No damage/Clean road
Table 4. Parameters recommended for Penang Horizontal Elastic Response Spectrum According to Malaysia National Annex.
ParametersSTBTCTD
Soil Type (D)1.350.300.802.20
Table 5. Percentage of improvement of the investigated parameters on the roadway system for two different stages.
ParametersPercentage of Improvement
Embankment HeightNumber of LanesSoil TypePavement Strength
1st Transmission Stage from Low to Moderate48.82%28.57%13.95%5.16%
2nd Transmission Stage from Moderate to High39.20%28.00%12.5%5.09%
Table 6. Comparative table for identified parameters with their intensities.
CriteriaMore ImportantIntensity
AB
Embankment HeightNumber of LanesA8
Embankment HeightSoil TypeA9
Embankment HeightPavement StrengthA9
Soil TypeNumber of LanesB7
Pavement StrengthNumber of LanesB8
Soil TypePavement StrengthA2
Table 7. Assigned scores for the categories of main parameters.
Parameter   ( P a i ) CategoryScores
Embankment heighth ≤ 4 m0.2
4 m < h ≤ 6 m0.6
6 m < h ≤ 9 m0.8
Number of lanes > 2 lanes0.4
2 lanes0.8
Soil typeSoil type B0.2
Soil type C0.6
Soil type D1.0
Pavement strengthHigh strength0.2
Moderate strength0.4
Low Strength0.6
Table 8. Samples of the SVI scores for roads.
Street NumberEmbankment Height (m)Number of LanesSoil
Type
Pavement StrengthSVI
Score
14>2BHigh0.242
26>2CModerate0.552
39>2DLow0.732
44<2BHigh0.326
56<2CModerate0.636
69<2DLow0.816
74>2DLow0.342
86>2CModerate0.552
99>2DModerate0.726
104<2DLow0.426
116<2CHigh0.630
129<2BHigh0.716
SVI Range Classifications
SVI = 0.0–0.4SVI = 0.4–0.7SVI = 0.7–1.0
Publisher’s Note: MDPI stays neutral with regard to jurisdictional claims in published maps and institutional affiliations.

