Abstract
The purpose of this study is to determine the frequency trend of daily temperature and precipitation extremes in Montenegro. Firstly, using the Multiple Analysis of Series for Homogenization method (MASHv3.02), the accuracy of daily maximum and minimum temperatures, as well as daily precipitation, from 18 meteorological stations in Montenegro during 1961–2020, was examined. Using percentile distributions, one of the most objective methods in researching modern climate change, time series were formed for four temperature and four precipitation percentile indices on a seasonal and annual level. Finally, the trend was calculated using the Sen Method, while the significance was tested using the Mann–Kendall test. The obtained results demonstrate that there is a significant warming in Montenegro, because the number frequency trend of cold days and nights/warm days and nights decreases/increases (annually up to: −12.9, −18.4, 7.0 and 6.8 days/decade). The trend in the frequency of very wet, moderately wet, moderately dry and very dry days is insignificant, but indicates slight aridization. Significant warming increases water evaporation, which, with additional slight aridization, can pose a problem in the functioning of natural systems as well as in the life and work of the citizens.
1. Introduction
In the last few decades, there has been an accelerated transformation of the climate system. The general opinion is that the primary cause of this is the uncontrolled anthropogenic emission of gases with the greenhouse effect, primarily carbon dioxide (CO2). It is generally believed that heat waves, rising sea levels, extreme rainfall and floods, melting ice, long–term droughts and forest fires, devastating tropical hurricanes and other extreme events are being registered more often and are most likely linked to global warming. The sixth report of the Intergovernmental Panel on Climate Change (IPCC) confirms, with a high degree of certainty, the supremacy of the anthropogenic factor on today’s global climate. The Paris Agreement from 2015 sets out a global framework by limiting global warming to below 2 °C, i.e., the global average temperature should be 1.5 °C higher by the end of this century compared to the pre–industrial level. If the global temperature rises by 2 or more degrees compared to the pre–industrial period, irreversible and possibly large negative changes in natural and human systems can be expected according to the models [1]. However, in the aforementioned IPCC Report, it is said that the global temperature nowadays is higher by 1 °C and that an increase of 1.5 °C will be happening in the next 20 years (until 2040), because the progression of atmospheric CO2 concentration has not stopped.
Therefore, the CO2 of anthropogenic origin remains the greatest threat to climate change. In addition, a recent announcement by NOAA [2] highlights the concern over the record increase in the concentration of methane (CH4) in the atmosphere during 2020 and 2021. Methane is the second most powerful anthropogenic factor in global warming, right after CO2. This gas stays in the atmosphere for a much shorter time than CO2, approximately for nine years. However, CH4 has a far stronger greenhouse effect, as it retains even 31 times more heat than CO2, and has a strong short–term impact. It is very likely that the record increases in CH4 concentrations are due to the expansion of oil and gas drilling, as methane tends to leak from wells and pipelines. This gas is also released from agriculture (cattle farming and landfills).
Even though they take place in different time distances, anthropogenic climate change and COVID–19 are currently the most pressing crisis [1,3,4,5,6]. It is considered that the solution to the climate crisis is to stop the anthropogenic emission of CO2 and other gases that pollute the atmosphere, respectively, the decarbonization of the global economy, which means stopping the burning of fossil fuels and switching to the use of green energy [7,8,9]. Regarding modern climate change, the most up–to–date information for Europe and the European Union is based on data from the Copernicus Climate Change Service (C3S), which operates within the European Center for Medium–Range Weather Forecasting from Reading (ECMWF). The latest data released by C3S shows that globally, 2020 was on par with 2016, which has been rated as the warmest on record since 1851. For Europe, 2020 was the warmest year on record (since 1851), with a margin of 1.6 °C compared to the average of the reference period 1981‒2010, which is 0.4 °C above the previous warmest year in 2019. The fact that the 5 warmest years were registered in the last decade, 2011–2020 [10] indicates significantly of the warming of Europe.
Regional differences regarding changes in precipitation are more pronounced than those regarding temperature. Certain regions and countries are becoming more arid, some are becoming more humid, while there are also those areas where dry and extremely rainy periods alternate with floods. Research indicates that for almost 120 years (1901–2019), central Europe and the Mediterranean region became drier, while northern Europe became wetter [11]. Changes in temperature and precipitation, as well as more frequent and intense weather extremes, are also registered in the Mediterranean region, a region that is becoming warmer, but also drier [12,13,14,15,16,17].
In the area of the Western Balkans, a sub region to which Montenegro belongs, there has been a rise in temperature and more frequent extreme weather events, such as extreme temperatures, heat waves, droughts, and extreme precipitation, yet the changes in annual precipitation sums remain insignificant [18]. In the area of neighboring Serbia, during the second half of the 20th and the beginning of the 21st century, an increase in temperature, a negative trend of precipitation and more frequent individual extreme events were recorded [19,20,21,22,23,24,25,26,27]. The warming trend is also present in neighboring Bosnia and Herzegovina [28,29,30]. Contemporary climate change and extreme weather events have not bypassed Montenegro, a small Mediterranean country. Over the past 20 years, records of temperature, precipitation and wind have been registered in the territory of Montenegro [31,32,33].
The main purpose of the article is to identify changes in temperature and precipitation in the territory of Montenegro during 1961–2020. A large database was used, as we focused on daily extreme temperatures (maximum and minimum) as well as daily precipitation from 18 meteorological stations (MS). When the analysis is conducted on a daily basis, numerous climate indices for temperature and precipitation are used in the research of climate change. Generally, indices with fixed and variable thresholds are used, followed by those that demonstrate frequency and intensity. For the purposes of this article, we used indices that are calculated using the percentile distribution. Indices calculated using fixed thresholds, such as tropical days, summer days, frosty days, icy days, rainy days and others, do not give an objective picture of changes in these two most important climatic elements. For instance, summers in both the coastal region of Montenegro and in the area of the capital (Podgorica), have tropical days and tropical nights as a frequent occurrence (Tmax ≥ 30 °C, Tmin ≥ 20 °C). Conversely, these days are almost non–existent in the higher mountainous areas in the north of the country. Winters with frosty days (Tmin < 0 °C) are common in the north, while they are almost non–existent in the south of the country. Consequently, we focused on percentiles, for they have a significant advantage over indices with fixed thresholds. They are calculated according to the same empirical distribution; thus, variable thresholds are obtained in this way. For work purposes, percentages that indicate the frequency of extreme events (temperature and precipitation) were used. Trend calculations were made for eight percentile indices on a seasonal and annual level. Percentiles indicating potentially extreme events were selected—for maximum and minimum temperature of the 10th and 90th (Tx10p, Tn10p, Tx90p and Tn90p), and for precipitation of the 95th, 75th, 25th and 5th percentile. Therefore, the percentile method demonstrates the most realistic changes in temperature and precipitation, and this is the main contribution of the results presented in this article. In the context of contemporary climate change, no research was conducted in Montenegro; thus, the results presented in this paper will help decision makers to better understand this current issue.
2. Study Area
The area of research is Montenegro, a country located in Southeast Europe, i.e., on the Balkan Peninsula. The area of the country is 13,812 km2, with a population of about 620,000 inhabitants. It extends to the Adriatic Sea for a length of about 100 km (air distance). In terms of relief, most of the country has a mountainous character. The coast of Montenegro is a narrow region along the Adriatic Sea, from a few meters wide to a maximum of 10 km. In the immediate vicinity of the Montenegrin coast, the Dinaric Mountains, with peaks up to 1894 m.a.s.l., rise. In the Central region, there is the Skadar lake basin (water level at about 6 m), the Zetsko–Bjelopavlićka plain (10–60 m), karst fields whose bottoms are at about 650 m (Cetinjsko, Nikšićko) and mountainous areas. In this region is located the two largest cities in Montenegro—Podgorica and Nikšić. The mountainous region occupies the northern half of the country, with peaks over 2000 m.a.s.l. Here, is the highest peak of Montenegro—the peak of Zla Kolat on Prokletije, with an altitude of 2534 m.a.s.l. (Figure 1). Apart from relief fragmentation, the primary factors that influence the climate of Montenegro are the mathematical–geographical position, proximity to the sea and synoptic conditions, i.e., air masses within cyclones and anticyclones [34].
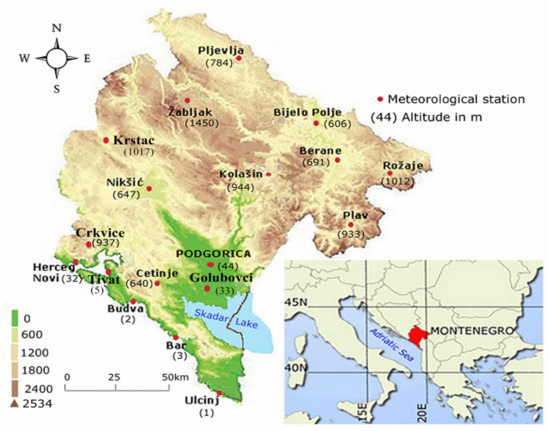
Figure 1.
Relief map of Montenegro with locations and altitude of meteorological stations.
Certainly, the great dissection of the terrain (0–2534 m.a.s.l.) and the unevenness of the relief conditions a true climatic mosaic. In general, based on the Köppen classification, two climates (C and D), three types (Cs, Cf and Df) and five subtypes of climate are distinguished in Montenegro: Csa, Csb, Cfb, Dfb and Dfc. For the period of 1961–1990, the average annual temperature along the coast and in the area of the Zetsko–Bjelopavlić lowland and Podgorica was from 14.8 °C to 15.8 °C. The average annual temperature in places up to the 600–700 m altitude was around 10 °C, and at around 1000 m altitude it was around 6–7 °C, while in the north of the country, at around 1500 m altitude, it was around 4.5 °C. Most of the country has a Mediterranean pluviometric regime, which means that the summers were dry, while the greatest amount of precipitation occurs during autumn and winter. Average annual precipitation varies widely. The town of Crkvice, located in the southwest of the country, at an altitude of 1000 m on the slopes of the coastal mountain Orjen, collects an average of 4600 mm of precipitation per year [35]. On the other hand, Pljevlja, in the far north of the country, collects the least amount of precipitation in Montenegro; the annual average for the period of 1961–1990 was 802 mm [36].
3. Database and Methods
For the purposes of the study, daily data on the maximum and minimum temperature and precipitation from 18 meteorological stations for the period 1961–2020 were used. The data were taken from the state Institute of Hydrometeorology and Seismology of Montenegro. The time series were complete, and only few data from 0.01% to 3% of the total number of data cases were missing. The only exceptions were three meteorological stations (MS) that started working later: Plav (start of work in 1966), Rožaje (1968) and Golubovci (1978). All data sets were tested for relative homogeneity using the MASH (Multiple Analysis of Series for Homogenization) method. The MASHv3.02 version was used, because it enables the quality control of daily data, as well as the estimation of missing data in the series [37,38,39]. Those parts of the time series that were determined to be inhomogeneous were excluded from the series, which is only 0.3–1.0% of the data. Those data that were excluded (0.3–1.0%), as well as those that were missing (0.01–3%) and missing for the three mentioned MS, were estimated based on the data of the surrounding stations using MASHv3.02 methods. In this way, all data sets for the period of 1961–2020 were completed.
In order to more accurately detect temperature and precipitation extremes, the percentile method is used as one of the most relevant indicators of today’s climate change. To be precise, climate indices defined using percentile methods represent specific days, not with fixed but with variable thresholds. Percentile values range from 0 to 100. Percentiles indicate the position of data in a given increasing sequence, that is, how many percentage members of the observed sequence were above or below the observed value. For example, the 10th percentile indicates that 10% of the data in the observed time series has a value less than its absolute value. Compared to standardized deviations and other methods, the advantage of percentiles is that they more accurately identify rare (extreme) events. In particular, during certain seasons, it is impossible to analyze climate indices that were defined by means of fixed thresholds—e.g., there were no summer and tropical days and tropical nights (TR) in Montenegro during the winter, and there were no frosty and icy days in summer (in the north of the country, in the higher mountain areas, there is no TR even in summer).
Taking into account the above mentioned, for the purposes of this study, 8 percentile climate indices were analyzed—4 for temperature and 4 for precipitation (Table 1). Temperature indices (Tx10p, Tx90p, Tn10p and Tn90p) were defined using the 10th and 90th percentiles of the maximum (Tx) and minimum (Tn) daily temperature. Climatic indices for precipitation were determined using the 95th, 75th, 25th and 5th percentiles of daily precipitation sums (Rd) of 1 mm or more. The percentile thresholds for the mentioned temperature and precipitation indices were calculated according to the rules proposed by the Expert Team on Climate Change Detection and Indices (ETCCDI), which is supported by the World Meteorological Organization (WMO) Commission on Climatology, the Joint Commission on Oceanography and Marine Meteorology (JCOMM) and the Research Program on Climate Variability and Predictability (CLIVAR) [40,41,42].

Table 1.
Used climate indices of temperature and precipitation (unit of measure: no. of days).
The procedure for calculating thresholds for temperature indices is more complex than for precipitation percentile indices. The percentile thresholds for temperature were determined for each calendar day of the year for the standard climate period. For example, the threshold for Tn90p for January 10 was calculated based on 150 data, i.e., daily minimum temperatures of a 5–day window (8–12 January) for the standard climate period. When the threshold was calculated, days with a minimum temperature higher than the obtained value (90th percentile) in the period of 1961–2020 were counted. The same procedure was applied for each calendar day from 1 January to 31 December, for all stations included in the analysis. Thresholds for Tn10p, Tx10p and Tx90p were determined in the same way. This means that 365 (366) thresholds for one temperature percentile index were calculated for each MS.
The methodology for obtaining percentile thresholds for precipitation was simpler, because they were calculated from a sample of all days with a precipitation amount of 1 mm or more (Rd) for a given time unit (month, season, year). When the threshold was calculated for, e.g., the 75th percentile for the winter season (December, January and February), the counted days with precipitation were above that threshold in the mentioned season for the period of 1961–2020. The same procedure was applied for other seasons. At the annual level, the percentile threshold for precipitation was calculated based on the daily precipitation of 1 mm or more for all 12 months of the year for the standard climate period, and then the days with precipitation above the obtained value were counted in the observed 60–year period (1961–2020).
Climate indices defined using percentiles were calculated according to the same empirical distribution, which means that the obtained results can be compared from different parts of the world. It is considered to be the main advantage of the analysis of weather extremes that are determined using percentile thresholds. Secondly, in the analysis of extreme weather events, the importance of indices determined using percentile thresholds is also in the fact that they consider more moderate extremes and therefore instead of one with an absolute value, more potentially dangerous phenomena can be identified in the observed time unit (season, year).
For the purposes of this study, 5 time series were formed for one index (for seasons and on an annual level), that is, for all 8 percentile indices used, a total of 40 time series were formed for one MS. Next, a trend was calculated for each time series and its significance was examined. The Sen Method was used to calculate the trend, and the significance of the tendency was examined using the Mann–Kendall (MK) test at the risk level of 0.001, 0.01, 0.05 and 0.1, i.e., the degree of accuracy of the hypothesis of 99.9, 99, 95 and 90% [43,44,45].
The main advantage of Sen’s slope estimates and MK test is that they are non–parametric methods, i.e., they are less demanding than parametric ones, since they take into account a smaller number of assumptions required for their implementation. Accordingly, these methods are often used to detect trends in meteorological and hydrological variables. The MK test is based on the calculation of variance (S).
The statistic S is obtained by Equation [45]:
The signum function (sgn) is calculated according to the formula:
where n is the length of the sample, xk and xj are from k = 1, 2, ..., n–1 and j = k + 1, ..., n. If n is bigger than 8, statistic S approximates to normal distribution. The mean of S is 0 and the variance of S can be acquired as follows:
The Z statistic is calculated using the formula:
Sen’s method assumes that the trend is linear:
where: Q—slope, B—constant and t—time.
The estimate of the slope of the trend (Q) is calculated according to the formula:
The indices j and k denote a time instance (e.g., years) and j > k.
The significance of the trend is evaluated using the Z value obtained by the formula and the trial given in the two–sided test table for the level of: α = 0.10, 0.05, 0.01 and 0.001. A positive (negative) value of Z indicates an upward (downward) trend.
The trend calculations were tabulated. For the purpose of visualization, the spatial distribution of the trend of individual temperature and precipitation percentile indices was also shown. Additionally, the SURFER computer program was used for these purposes. This program contains a number of interpolation techniques. The most reliable method for dissected terrains has been the Kriging method. Using Kriging interpolation algorithms based on the data of all nearby stations, the daily value of the given percentile index was estimated in 100 × 100 m grids.
It should be mentioned that the World Meteorological Organization (WMO) recommended new climate standards to be used at the end of 2020, i.e., from the period of 1991–2020 [46]. Respecting the recommendation of the WMO regarding the use of a new reference climate period (the previous base climate period was 1961–1990), for the purposes of this study, 1991–2020 was used as the standard or base period.
4. Results
4.1. Trend of Percentile Temperature Indices
On an annual level, on the territory of Montenegro, there are on average about 36 cold and warm days (Tx10p and Tx90p), that is, cold and warm nights (Tn10p and Tn90p). At the level of the seasons, the average number of mentioned days is about 9. This uniformity is a consequence of the calculation according to the same empirical distribution, and at the same time a confirmation of the correctness of the application of the percentile method.
4.1.1. Cold Days and Cold Nights (Tn10p and Tx10p)
The index Tx10p (number of cold days: daily Tx < 10th percentile) was classified in the category of cold temperature indices. In the winter season, the Tx10p trend ranges from −0.4 days/decade in Kolašin to −3.1 days/decade in Berane. In 16 out of 18 MS, the reduction in the number of cold days was statistically significant, mostly at the risk level of 0.001 (99.9% hypothesis acceptance level). During spring and summer, all MS register a significant decrease in the number of cold days. In summer, the number of cold days decreases most intensively on the Montenegrin coast (up to −6.9 days/decade). The autumn season registered a decrease in the number of cold days in the period of 1961–2020 (significantly to 13, and insignificantly to 5 MS). Comparing the trend values of the seasonal number of cold days for the period of 1961–2020, the smallest decrease occurred during the fall, and the most intensive in the summer season (Table 2).
Table 2.
Trend (no. days/decade) of the number of cold days and cold nights (Tx10p and Tn10p) in Montenegro in the period 1961–2020. (Significantly: *** p < 0.001, ** p < 0.01, * p < 0.05, + p < 0.10).
The index showing the number of cold nights (Tn10p) that was defined, i.e., the thresholds are calculated in the same way as for the previous one, with the fact that the minimum daily temperatures (Tn) are taken instead of the maximum. It was mentioned that the average annual number of cold nights in Montenegro was around 36. However, the Tn10p index, like the others, varies within fairly wide limits. For example, Podgorica (the capital of the country) had 99 cold nights in 1980, and only 11 in 2003.
For the observed 60–year period (1961–2020), trend reports demonstrated that the number of cold nights was also decreasing, which was another indicator of the warming tendency of Montenegro. The decrease in the number of cold nights in the summer season ranges from −1.8 to −7.1 days per decade, and in the spring, the trend of the Tn10p index was from −0.3 to −3.7 days per decade. It was important to point out that during both seasons, the negative trend was significant, mostly at the highest level of the acceptance of the hypothesis (p < 0.001). The exception was one MS on the coast (Ulcinj), where the negative tendency of Tn10p in spring (−0.3 days/decade) was statistically insignificant. On the other hand, during winter and autumn, the intensity of the reduction in the number of cold nights was lower. Moreover, mostly the northern and northeastern part of the country registers a significant decrease, while in other regions, the changes were insignificant during these two seasons, in general.
The trend results at the seasonal level clearly indicated that the annual number of cold days and cold nights was decreasing. The Tx10p trend rate ranged from −4.4 days/decade (MS Kolašin) to even −12.9 days/decade on the coast (MS Bar) (Figure 2a). When it came to the annual number of cold nights (Tn10p), in the north and northeast of the country, the trend went up to −18.4 days per decade (Figure 2b). It was important to point out that in all 18 MS, the negative tendency of the annual Tx10p and Tn10p index met the conditions of the MK test at the highest level of the risk of correctness of the hypothesis (p < 0.001). In general, the number of cold days and cold nights decreased the fastest in the northeast of the country and along the coast from Bar to Budva, and the slowest in the southwest of Montenegro. In any case, the results of the Tx10p and Tn10p indices were clear indicators of the warming tendency of Montenegro in the period of 1961–2020, because the number of days with maximum and minimum temperatures lower than the 10th percentile was decreasing.
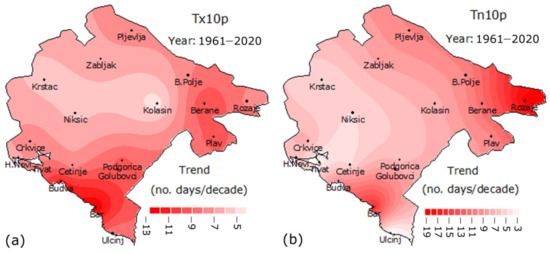
Figure 2.
Trend of the annual number of cold days ((a), Tx10p) and cold nights ((b), Tn10p) on the territory of Montenegro in the period 1961–2020 (in all MS, the trend was significant at the 99.9% level).
4.1.2. Warm Days and Warm Nights (Tx90p and Tn90p)
Different from the two previous ones, Tx90p and Tn90p are warm temperature indices, because they refer to warm days and warm nights. It should be remembered that all percentile indices are defined using variable daily thresholds. Therefore, warm days (Tx90p) and warm nights (Tn90p) are defined using the 90th percentile, in the same way as the two previous percentile indices, except that in this case, the rule Tx > 90p, i.e., Tn > 90p, applies. When the thresholds for each calendar day of the year were calculated on the basis of the base period (1991–2020), days were counted for the entire analyzed period (1961–2020) with daily Tx, i.e., daily Tn higher than the obtained value (the corresponding daily threshold).
Based on previous calculations, the numbers of warm days (Tx90p) were expected to increase in Montenegro, which was confirmed by the trend calculations. What was not to be expected was that under the conditions of the anthropogenic effect of the greenhouse, according to climate models, the maximum temperature should rise faster in the colder part of the year than in the warmer part of the year. However, the number of warm days (Tx90p) registered the most intensive changes (increase) in the summer season. The same happened with the decrease in the number of cold days and cold nights (Tx10p and Tn10p). In all 18 MS, the number of warm days in summer increases at the highest significance level (99.9% significance level): 1.0–1.7 days/decade. In the spring season as well, the Tx90p index recorded a positive tendency, which was statistically significant mainly at the 99.9% level of acceptance of the hypothesis. For the period of 1961–2020, the trend of increasing the number of warm days in the winter season was insignificant at 4 MS (Table 3), and during autumn it was significant at 17 MS.
Table 3.
Trend (no. days/decade) of the number of warm days and warm nights (Tx90p and Tn90p) in Montenegro in the period of 1961–2020. (Significantly: *** p < 0.001, ** p < 0.01, * p < 0.05, + p < 0.10).
For the observed 60–year period, the absolute fluctuation of the annual and seasonal number of warm nights was large, as with the other three percentile indices. At almost all stations, the warmest nights (Tn90p) were registered in the last two decades of the observed period (mainly 2003, 2007, 2012, 2015 and 2018). For example, Podgorica had the fewest warm nights in 1980, a total of 5, while in 2003 and 2012, there were 53 and 56 warm nights, respectively. In 2018, the meteorological station Bar (coast) registered as many as 93 warm nights, i.e., days with a minimum temperature higher than the 90th percentile.
At the level of seasons, the smallest changes in the number of warm nights occurred in winter. Moreover, at 6 MS, no changes were observed (the trend was equal to zero to the second decimal place). Other MS registered a trend of increasing the number of warm nights in the winter season, but it was significant only in 5 MS. For the period 1961–2020, during the spring and summer, almost all MS registered a significant upward trend in the number of warm nights. Again, the summer season recorded the most intense positive tendency of the Tn90p index (up to 2.0 days/decade). The trend in the number of warm nights in the autumn was not observed in two MS on the coast (Ulcinj and Tivat), while in other places, the tendency was positive and mostly significant (Table 3).
For example, in 2007, Podgorica registered 74 warm days comparing to 1964 and 1972, when the Tx90p index had a value of 0. It was similar at the seasonal level, so in Podgorica, the summer of 2007 had 31 warm days, and in the first half of the analyzed period there were several cases when the mentioned season did not register a single such day. The annual number of warm days increased at a trend rate from 3.2 to 7.0 days per decade (Figure 3a), and the positive tendency was statistically significant in all MS at the highest level of hypothesis acceptance (p < 0.001). The most intensive increase in the number of warm days was recorded in the capital and the largest city of Montenegro (Podgorica, 7.0 days/decade). It was very likely that this was partly a consequence of the urban heat island. Moreover, the annual number of warm nights (Tn90p) has a positive trend in all observed MS (Figure 3b). At the same time, the changes are insignificant only in one MS (Ulcinj). For the observed period (1961–2020), the annual number of warm nights increased the fastest in Bar and Rožaje (6.1 and 6.8 nights/decade).
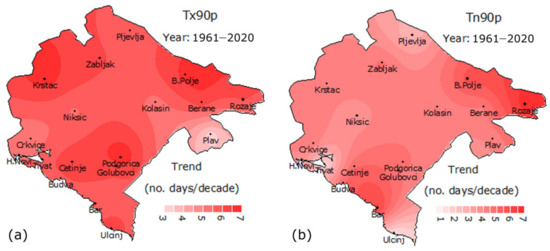
Figure 3.
Trend of the annual number of warm days ((a), Tx90p) and warm nights ((b), Tn90p) on the territory of Montenegro in the period of 1961–2020 (in almost all MS, the trend was significant at the 99.9% level).
The obtained results demonstrated that there was a warming trend in the territory of Montenegro. From 1961 to 2020, maximum and minimum daily temperatures that have “warmer” values occurred more often. The biggest contribution to the increase in the annual number of warm days and nights, i.e., the decrease in cold days and nights, was made by changes during the summer. Under the conditions of the anthropogenic greenhouse effect, it was logical to expect a more intensive increase in the number of warm nights in the colder than in the warmer part of the year. This logic derives from the fact that, other conditions being equal, atmospheric counter radiation has a greater share in the radiation balance at night and in winter. However, the number of warm nights in winter increased negligibly, while the positive tendency of the Tn90p index in summer was twice as large, in general.
4.2. Trend of Percentile Precipitation Indice
For the purposes of this work, calculations were also made for four percentile precipitation indices. First, seasonal and annual thresholds were determined for each MS (see Table A1 in Appendix A) for Rd ≥ 1 mm, then, the days above/below the obtained values were counted, and the trend was calculated and its significance examined. Thresholds had the highest values in those places with the richest precipitation. The annual average precipitation in Crkvice was 4606.0 mm, and in 2010, the MS registered 9078.8 mm. In Crkvice, probably the rainiest place in Europe, the 75th percentile for winter was 69.0 mm, and the 95th was 181.1 mm. On the other hand, in Pljevlja with the lowest amount of precipitation in Montenegro (annual average for the period of 1991–2020 was 796.7 mm), for the winter season the 75th percentile was 8.3 mm, and the 95th was 20.7 mm. The values for the 25th percentile were quite uniform, and the smallest difference was in the thresholds for the 5th percentile (threshold values ranged between 1.0–1.9 mm).
4.2.1. Very Wet Days and Moderately Humid Days (R95p and R75p)
The results in the previous chapter demonstrated that extreme temperatures with higher values, both maximum and minimum, were more often registered in the territory of Montenegro. However, when it came to days with daily precipitation sums greater than the 95th (R95p) and 75th (R75h) percentiles (very wet days and moderately humid days), the trend of changes was negligible (Table 4). The average number of days with Rd > 95th percentile was 1–1.5 days per season, i.e., about 5.5 days per year, which meant that very wet days rarely occurred. Only MS Krstac registered a significant decrease in the number of very wet days in spring and summer (−0.37 and −0.48 days/decade), but only at the lowest level of significance (p < 0.10).
Table 4.
Trend (no. days/decade) of the number of very wet and moderately wet days (R95p and R75p) in Montenegro in the period of 1961–2020 (Significantly: ** p < 0.01, * p < 0.05, + p < 0.10).
Even moderately wet days (R75p) were rarely registered, but their number was slightly higher compared to R95p, which was to be expected. The average number of moderately wet days per season was about 7–7.5 days, and about 25–26 days per year. As for the trend of the R75p index (Rd > 75th percentile), the results demonstrated that the changes were negligible, even then. In the winter season, only two MS showed significant changes: MS Krstac decrease (−0.59 days/decade) and MS Žabljak increase (0.48 days/decade). During spring and autumn, only one MS registered significant changes in R75p. In the summer season, 4 MS registered a significant decrease in the number of moderately wet days, but up to 0.57 days per decade. In all other cases, changes in the number of moderately wet days were insignificant. At the annual level, the trend of both indices was negligible and insignificant, except for MS Krstac, which registered a significant decrease in the number of very wet and moderately wet days (−1.0 and −2.1 day/decade).
Observing Montenegro as a whole, the annual number of very wet days (Figure 4a) was almost zero (−0.02 days/decade). The trend of moderately wet days was also negligible (Figure 4b). Both indices had their maximum peaks in 1979 and 2010, because those were the two years with the most precipitation in Montenegro during the period of instrumental measurements.
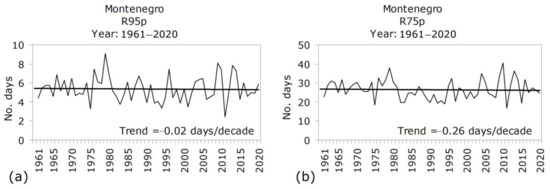
Figure 4.
Trend of very humid ((a), R95p) and moderately humid ((b), R75p) days in the territory of Montenegro as a whole for the period of 1961–2020.
4.2.2. Moderately Dry Days and Very Dry Days (R25p and R5p)
Montenegro has a Mediterranean pluoviometric precipitation regime, which means that an average year registers a large number of days without precipitation, especially in the warmer part of the year. The average annual number of days with Rd < 25th percentile ranged between 269–298 days, and with Rd < 5th percentile between 242–281 days (depending on the location). At the level of the seasons, moderately dry (R25p) and very dry (R5p) days were the most common in summer. The Montenegrin coast and the area around the capital (Podgorica) had an average of 82–85 moderately dry days in summer, or 80 very dry days, while in the rest of the country that number was generally 2–4 days less. However, the number trend even these days was negligible and rarely exceeds 1 day/decade in absolute terms. In the period of 1961–2020, in winter, the trend of changes in both indices was insignificant in all observed MS (Table 5).
Table 5.
Trend (no. days/decade) of the number of very wet and moderately wet days (R25p and R55p) in Montenegro in the period of 1961–2020 (Significantly: ** p < 0.01, * p < 0.05, + p < 0.10).
During the spring, a significant decrease in the number of moderately dry and very dry days was registered in only 3 MS in the northern part of the country, while in other places, the changes were insignificant. In the autumn season, only 1 MS in the north of the country registered the significance of the R25p and R5p trend. Therefore, during the mentioned seasons (winter, spring and autumn) changes in the number of moderately dry and very dry days were not observed or there was a negative tendency on 1–3 MS, which means that there was no question of increasing the dryness of Montenegro, which, according to climate models, should be expected. However, this cannot be said for the summer season, because although the trend values were small (up to 1.1 days/decade), almost all MS registered an increase in the number of moderately dry and very dry days, and the positive tendency was significant in 7 MS each.
The annual number of moderately dry days (R25p) increased to 14, and decreased to 4 MS (Figure 5a). Out of a total of 18 MS, significant trend changes were registered by 5 MS (4 increase and 1 decrease). The trend of the R5p index had a positive sign at 15 and a negative sign at 3 MS. Moreover, 5 MS registers significant changes along the trend line (Figure 5b). A positive trend indicated a tendency to dryness, while a negative trend indicated the opposite. Regardless of the fact that the changes were minor and, in most cases, insignificant, it should be emphasized that in the summer season, when the need for water was increased, as well as on an annual basis, the number of moderately dry and very dry days increased in most of Montenegro. The aridization tendency was minor, but not favorable for either natural or human systems.
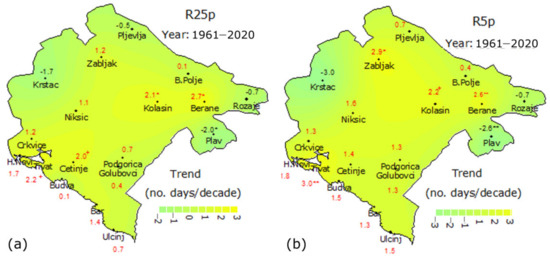
Figure 5.
Trend of the annual number of moderately ((a), R25p) and very ((b), R5p) dry days on the territory of Montenegro in the period of 1961–2020 (Significantly: ** p < 0.01, * p < 0.05, + p < 0.10).
5. Discussion
The results of the calculation of four temperature percentile indices clearly indicated significant warming trend in Montenegro. The percentile temperature indices demonstrated the smallest changes in winter, which was not expected. Namely, under the conditions of the anthropogenic effect of the greenhouse, we should expect more intense warming at night and in winter than during the day and in summer. The opposite has been happening in Montenegro. Firstly, the maximum temperature rose faster than the minimum temperature (cold/warm days (Tx10 and Tx90) decrease/increase more intensively than cold/warm nights (Tn10 and Tn90)), in general. Secondly, changes in the frequency of the considered percentile indices, for both the maximum and minimum temperature, were more intense in summer than in winter. As for precipitation, there is a slight aridization, but the frequency of extremes has not changed significantly. The general view is that modern climate changes are occurring as a consequence of the anthropogenic greenhouse effect. On the other hand, some authors point out that changes in temperature, precipitation, cloudiness and other climatic elements can be partially or completely attributed to natural factors, such as variations in atmospheric and oceanic oscillations (teleconnections). It is recognized that the phenomenon of El Niño–Southern Oscillation (ENSO) has an impact on the global climate. Furthermore, it affects certain telecommunications, with the strongest intensity in the tropics of the Pacific and Indian Oceans. [47,48,49,50]. Some studies demonstrate that ENSO does affect European climate, e.g., [51], and it was determined that there is a relationship between ENSO and the decadal variability of precipitation in Serbia [52]. During 1951–2010, it was determined that there was a connection between the temperature change in Montenegro and several global and regional teleconnections, such as [53]: East Atlantic Oscillation (EA), Arctic Oscillation (AO), Atlantic Multidecadal Oscillation (AMO), East Atlantic–West Russian Oscillation (EAWR), Scandinavian Pattern (SCAND) and North Atlantic Oscillation (NAO), specifically with the Mediterranean Oscillation (MO) and Western Mediterranean Oscillation (WeMO). The mentioned teleconnections, but also some others, such as the Summer North Atlantic Oscillation (SNAO), Polar–Eurasian Oscillation (POLEUR), North Sea–Caspian Pattern (NCP) and South Oscillation (SOI), affect the variability of cloudiness over Montenegro [54].
At any rate, Montenegro is not released from extreme weather events. In the last two decades, the frequency and intensity of extreme weather and climate events related to temperature have increased. High temperatures and heat waves occur more often. Regarding precipitation, we mentioned that the frequency of extremes has not changed significantly. Though, it would be wrong to conclude that there are no changes in precipitation or that they are minor. In this study, not intensity indices but extreme frequency indices were analyzed. According to previous research, precipitation extremes have become more intense (extreme). For example, during 2010, Montenegro faced heavy rain and floods three times—in January, November and especially at the beginning of December. Likewise, we can mention the examples of extreme weather on the Montenegrin coast on 9 June 2018, then in November 2019 [55]. The results for the two neighboring countries, Serbia and Croatia, based on the analysis of percentile and other climate indices, also demonstrate that in the period of 1961–2010, no significant changes were registered in the frequency of precipitation extremes [56,57].
Therefore, this study indicated that the frequency of extremely hot/cold weather has increased/decreased in Montenegro. There have been extreme daily precipitation-related events before (heavy rains, dry intervals, etc.), but their frequency has not significantly changed in recent times. However, in the last two decades, such phenomena have become more intense, i.e., more extreme (not more frequent, but more extreme). On the basis of the aforementioned, it could be assumed that there are different percentile indices (some show frequency, others intensity) and one should be careful when interpreting the obtained results [58].
The results presented in this paper can assist decision makers to take the climate change issue seriously in Montenegro and develop adaptation and mitigation strategies. Strategies and plans for mitigating and adapting to contemporary climate change should be expertly planned and future research should be focused in that direction.
6. Conclusions
For the purposes of this work, the percentile method was applied to detect the tendency frequency of extreme temperatures and precipitation that occurred as a consequence of modern climate change in the territory of Montenegro. The research included data from 18 meteorological stations for the period of 1961–2020, and all calculations were made on a seasonal and annual level. A total of eight percentile indices were considered, four each for temperature and precipitation.
The obtained results indicated that the number of cold days and cold nights (Tx10p and Tn10p) was decreasing in the territory of Montenegro, and the number of warm days and warm nights (Tx90p and Tn90p) was increasing. In most cases, the trend of changes was statistically significant, both at the level of seasons and during the year. The decrease in the cold and the increase in the warm percentile indices was a clear indicator of the warming tendency of Montenegro. For the observed 60–year period (1961–2020), the most intense warming was registered in the warmer part of the year, especially during the summer season, when the trend of all considered temperature percentile indices was significant at the highest level of hypothesis acceptance (p < 0.001) in all MS. In summer, the tendency of the Tx10p and Tn10p indices was up to −6.9 and up to −7.1 days/decade, and Tx90p and Tn90p up to 1.7 and up to 2.0 days/decade.
For the observed 60–year period, the trend of changes of the frequency in all four precipitation indices (R95p, R75p, R25p and R5p) was minor and in most cases statistically insignificant. During the last two decades, the absolute daily, seasonal and annual rainfall records were registered in most of Montenegro for the instrumental period, but the frequency of extremes did not demonstrate significant changes in one direction or the other. In contrast to the temperature, where there was uniformity in terms of the sign of the trend in the entire area of Montenegro, the obtained results for precipitation indices did not demonstrate this. Namely, the same precipitation index had a positive trend in some regions of the country, and a negative trend in others. For example, the trend of the R75p index in winter ranged from −0.6 to 0.5 days/decade. As for the different signs of the trend, sometimes even in close places, it is plausible that they are a consequence of relief diversity (altitude and relief unevenness).
Author Contributions
Conceptualization, D.B. and M.D.; data curation, D.B. and M.D.; formal analysis, D.B. and M.D.; Investigation, D.B. and M.D.; methodology, D.B. and M.D.; project administration, D.B. and M.D.; supervision, D.B.; validation, D.B. and M.D.; writing—original draft preparation, D.B. and M.D.; writing—review and editing, D.B. and M.D. All authors have read and agreed to the published version of the manuscript.
Funding
This research received no external funding.
Institutional Review Board Statement
Not applicable.
Data Availability Statement
Data is not publicly available, though the data may be made available on request from the corresponding author.
Conflicts of Interest
The authors declare no conflict of interest.
Appendix A
Table A1.
Percentile thresholds (mm) in Montenegro calculated for the base period 1991–2020.
Table A1.
Percentile thresholds (mm) in Montenegro calculated for the base period 1991–2020.
| MS | Very Wet Days (R95p) | Moderately Humid Days (R75p) | ||||||||
|---|---|---|---|---|---|---|---|---|---|---|
| Winter | Spring | Summer | Autumn | Year | Winter | Spring | Summer | Autum | Year | |
| Ulcinj | 41.8 | 40.9 | 47.1 | 56.9 | 46.0 | 19.9 | 15.8 | 16.9 | 22.3 | 19.5 |
| Bar | 43.2 | 43.5 | 47.5 | 53.6 | 47.8 | 20.3 | 16.3 | 15.6 | 23.8 | 19.8 |
| Budva | 46.9 | 44.6 | 41.3 | 55.6 | 47.3 | 20.8 | 17.4 | 16.1 | 23.3 | 20.1 |
| Tivat | 47.9 | 42.3 | 45.7 | 61.2 | 49.8 | 22.0 | 18.2 | 15.7 | 23.8 | 20.3 |
| H. Novi | 62.1 | 52.7 | 49.2 | 65.7 | 59.9 | 25.5 | 20.4 | 16.7 | 26.3 | 22.8 |
| Golubovci | 46.6 | 40.4 | 41.2 | 66.2 | 51.0 | 23.1 | 18.0 | 13.6 | 27.6 | 21.7 |
| Podgorica | 52.4 | 46.2 | 38.2 | 69.7 | 54.0 | 23.7 | 19.5 | 12.7 | 29.2 | 22.8 |
| Cetinje | 121.9 | 77.2 | 46.7 | 114.8 | 102.0 | 47.3 | 26.3 | 13.6 | 42.4 | 34.2 |
| Crkvice | 181.1 | 130.1 | 55.4 | 167.5 | 156.2 | 69.0 | 38.0 | 17.0 | 60.2 | 48.2 |
| Niksic | 67.1 | 44.2 | 33.3 | 75.6 | 60.3 | 28.2 | 19.5 | 12.6 | 29.0 | 23.0 |
| Krstac | 54.8 | 38.6 | 26.8 | 56.9 | 46.9 | 24.1 | 16.8 | 12.6 | 25.6 | 19.4 |
| Plav | 32.4 | 26.2 | 22.3 | 34.6 | 29.5 | 14.2 | 9.2 | 8.5 | 14.8 | 12.4 |
| Kolasin | 59.9 | 47.5 | 35.7 | 72.3 | 57.2 | 24.5 | 16.1 | 11.1 | 29.0 | 20.4 |
| Zabljak | 44.1 | 35.1 | 24.4 | 56.9 | 41.2 | 16.1 | 11.4 | 11.1 | 20.7 | 14.1 |
| Rozaje | 21.7 | 24.5 | 29.3 | 27.4 | 25.4 | 8.8 | 9.4 | 12.3 | 12.2 | 10.7 |
| Berane | 28.9 | 27.1 | 24.0 | 33.0 | 29.0 | 12.1 | 11.0 | 10.2 | 14.4 | 12.0 |
| B. Polje | 26.5 | 25.3 | 24.6 | 34.8 | 27.8 | 11.2 | 9.8 | 11.1 | 14.2 | 11.4 |
| Pljevlja | 20.7 | 20.1 | 25.3 | 26.8 | 23.2 | 8.3 | 8.2 | 10.7 | 11.2 | 9.5 |
| MS | Moderately Dry Days (R25p) | Very Dry Days (R5p) | ||||||||
| Winter | Spring | Summer | Autumn | Year | Winter | Spring | Summer | Autumn | Year | |
| Ulcinj | 4.3 | 3.1 | 2.8 | 3.7 | 3.5 | 1.4 | 1.2 | 1.2 | 1.2 | 1.3 |
| Bar | 3.9 | 3.2 | 2.8 | 3.6 | 3.3 | 1.3 | 1.2 | 1.3 | 1.2 | 1.2 |
| Budva | 4.2 | 3.3 | 2.6 | 4.6 | 3.8 | 1.4 | 1.2 | 1.2 | 1.4 | 1.3 |
| Tivat | 3.8 | 3.0 | 2.4 | 3.9 | 3.4 | 1.2 | 1.0 | 1.0 | 1.2 | 1.1 |
| H. Novi | 4.6 | 3.3 | 2.6 | 4.3 | 3.8 | 1.4 | 1.2 | 1.2 | 1.4 | 1.3 |
| Golubovci | 4.6 | 3.3 | 2.4 | 4.9 | 3.8 | 1.4 | 1.2 | 1.2 | 1.3 | 1.3 |
| Podgorica | 5.1 | 3.9 | 2.8 | 4.9 | 4.2 | 1.5 | 1.3 | 1.3 | 1.4 | 1.4 |
| Cetinje | 7.3 | 3.2 | 2.5 | 5.1 | 4.0 | 1.6 | 1.2 | 1.0 | 1.2 | 1.2 |
| Crkvice | 8.8 | 5.0 | 3.3 | 7.6 | 5.8 | 1.8 | 1.4 | 1.2 | 1.9 | 1.5 |
| Niksic | 5.0 | 3.4 | 2.5 | 4.6 | 3.8 | 1.5 | 1.3 | 1.1 | 1.4 | 1.3 |
| Krstac | 5.4 | 3.7 | 3.0 | 4.8 | 3.9 | 1.7 | 1.5 | 1.3 | 1.5 | 1.4 |
| Plav | 3.1 | 2.4 | 2.4 | 2.8 | 2.6 | 1.4 | 1.2 | 1.2 | 1.2 | 1.2 |
| Kolasin | 3.0 | 2.5 | 2.3 | 4.1 | 2.9 | 1.3 | 1.2 | 1.1 | 1.4 | 1.2 |
| Zabljak | 2.6 | 2.5 | 2.4 | 3.1 | 2.6 | 1.2 | 1.2 | 1.2 | 1.2 | 1.2 |
| Rozaje | 2.1 | 2.3 | 2.8 | 2.6 | 2.3 | 1.1 | 1.2 | 1.2 | 1.2 | 1.2 |
| Berane | 2.0 | 2.0 | 2.1 | 2.8 | 2.1 | 1.0 | 1.0 | 1.0 | 1.0 | 1.0 |
| B. Polje | 2.5 | 2.4 | 2.7 | 2.8 | 2.6 | 1.2 | 1.2 | 1.4 | 1.3 | 1.2 |
| Pljevlja | 2.2 | 2.3 | 2.6 | 2.5 | 2.4 | 1.1 | 1.1 | 1.2 | 1.1 | 1.1 |
References
- IPCC. Summary for Policymakers. In Climate Change 2021: The Physical Science Basis. Contribution of Working Group I to the Sixth Assessment Report of the Intergovernmental Panel on Climate Change; Masson–Delmotte, V., Zhai, P., Pirani, A., Connors, S.L., Péan, C., Berger, S., Caud, N., Chen, Y., Goldfarb, L., Gomis, M.I., et al., Eds.; Cambridge University Press: Cambridge, UK, 2021; p. 40. Available online: https://www.ipcc.ch/report/ar6/wg1/downloads/report/IPCC_AR6_WGI_SPM_final.pdf (accessed on 18 February 2022).
- NOAA. Increase in Atmospheric Methane Set Another Record during 2021. Available online: https://www.noaa.gov/news-release/increase-in-atmospheric-methane-set-another-record-during-2021 (accessed on 29 May 2022).
- Schmidt, R.C. Are there similarities between the Corona and the climate crisis? J. Environ. Stud. Sci. 2021, 11, 159–163. [Google Scholar] [CrossRef] [PubMed]
- Feldman, L.; Hart, P.S. Upping the ante? The effects of “emergency” and “crisis” framing in climate change news. Clim. Change 2021, 169, 10. [Google Scholar] [CrossRef]
- Geiger, N.; Gore, A.; Squire, C.V.; Attari, S.Z. Investigating similarities and differences in individual reactions to the COVID–19 pandemic and the climate crisis. Clim. Change 2021, 167, 1. [Google Scholar] [CrossRef] [PubMed]
- Meijers, M.H.C.; Scholz, C.; Torfadóttir, R.; Wonneberger, A.; Markov, M. Learning from the COVID–19 pandemic to combat climate change: Comparing drivers of individual action in global crises. J. Environ. Stud. Sci. 2021, 12, 272–279. [Google Scholar] [CrossRef] [PubMed]
- Yang, S.; Dong, W.; Chou, J.; Dai, T.; Hong, T.; Xiao, C.; Wei, T.; Tian, D.; Ji, D. Quantifying the developed and developing worlds’ carbon reduction contributions to Northern Hemisphere cryosphere change. Int. J. Climatol. 2019, 39, 3231–3240. [Google Scholar] [CrossRef]
- Wei, T.; Liu, C.; Dong, W.; Yu, H.; Yang, S.; Yan, Q.; Hao, Z. Reduction in extreme climate events and potential impacts by the use of technological advances. Int. J. Climatol. 2020, 41, 2495–2508. [Google Scholar] [CrossRef]
- Murali, R.; Kuwar, A.; Nagendra, H. Who’s responsible for climate change? Untangling threads of media discussions in India, Nigeria, Australia, and the USA. Clim. Change 2021, 164, 51. [Google Scholar] [CrossRef]
- C3S/ECMWF. Globe in 2020. Available online: https://climate.copernicus.eu/esotc/2020 (accessed on 11 May 2021).
- Ionita, M.; Nagavciuc, V. Changes in drought features at the European level over the last 120 years. Nat. Hazards Earth Syst. Sci. 2021, 21, 1685–1701. [Google Scholar] [CrossRef]
- Del Rio, S.; Cano-Ortiz, A.; Herrero, L.; Penas, A.P. Recent trends in mean maximum and minimum air temperatures over Spain (1961–2006). Theor. Appl. Climatol. 2012, 109, 605–626. [Google Scholar] [CrossRef]
- Hoerling, M.; Eischeid, J.; Perlwitz, J.; Quan, X.; Zhang, T.; Pegion, P. On the increased frequency of Mediterranean drought. J. Clim. 2012, 25, 2146–2161. [Google Scholar] [CrossRef]
- Milošević, D.D.; Savić, S.M.; Pantelić, M.; Stankov, U.; Žiberna, I.; Dolinaj, D.; Leščešen, I. Variability of seasonal and annual precipitation in Slovenia and its correlation with large–scale atmospheric circulation. Open Geosci. 2016, 8, 593–605. [Google Scholar] [CrossRef]
- Milošević, D.; Savić, M.; Stankov, U.; Žiberna, I.; Pantelić, M.; Dolinaj, D.; Leščešen, I. Maximum temperatures over Slovenia and their relationship with atmospheric circulation patterns. Geografie 2017, 122, 1–20. [Google Scholar] [CrossRef]
- Kostopoulou, E.; Giannakopoulos, C.; Krapsiti, D.; Karali, A. Temporal and Spatial Trends of the Standardized Precipitation Index (SPI) in Greece Using Observations and Output from Regional Climate Models. In Perspectives on Atmospheric Sciences; Karacostas, T., Bais, A., Nastos, P., Eds.; Springer: Berlin/Heidelberg, Germany, 2017; pp. 475–481. [Google Scholar] [CrossRef]
- Lemus-Canovas, M.; Lopez–Bustins, J.A. Assessing internal changes in the future structure of dry–hot compound events: The case of the Pyrenees. Nat. Hazards Earth Syst. Sci. 2021, 21, 1721–1738. [Google Scholar] [CrossRef]
- Stagge, J.H.; Kingston, D.G.; Tallaksen, L.M.; Hannah, D.M. Observed drought indices show increasing divergence across Europe. Sci. Rep. 2017, 7, 14045. [Google Scholar] [CrossRef]
- Tosic, I.; Unkasevic, M. Analysis of wet and dry periods in Serbia. Int. J. Climatol. 2014, 34, 1357–1368. [Google Scholar] [CrossRef]
- Arsenović, P.; Tošić, I.; Unkašević, M. Trends in combined climate indices in Serbia from 1961 to 2010. Meteorol. Atmos. Phys. 2015, 127, 489–498. [Google Scholar] [CrossRef]
- Bajat, B.; Blagojević, D.; Kilibarda, M.; Liković, J.; Tošić, I. Spatial analysis of the temperature trends in Serbia during the period 1961–2010. Theor. Appl. Climatol. 2015, 121, 289–301. [Google Scholar] [CrossRef]
- Luković, J.; Bajat, B.; Blagojević, D.; Kilibarda, M. Spatial pattern of recent rainfall trends in Serbia (1961–2009). Reg. Environ. Change 2014, 14, 1789–1799. [Google Scholar] [CrossRef]
- Luković, J.; Blagojevć, D.; Kilibarda, M.; Bajat, B. Spatial pattern of North Atlantic Oscillation impact on rainfall in Serbia. Spat. Stat. 2015, 14, 39–52. [Google Scholar] [CrossRef]
- Stanojević, G.; Stojilković, J.; Spalević, A.; Kokotović, V. The impact of heat waves on daily mortality in Belgrade (Serbia) during summer. Environ. Hazards 2014, 13, 329–342. [Google Scholar] [CrossRef]
- Kutiel, H.; Lukovic, J.; Buric, D. Spatial and temporal variability of rain–spells’ characteristics in Serbia and Montenegro. Int. J. Climatol. 2015, 35, 1611–1624. [Google Scholar] [CrossRef]
- Malinovic-Milicevic, S.; Radovanovic, M.M.; Stanojevic, G.; Milovanović, B. Recent changes in Serbian climate extreme indices from 1961 to 2010. Theor. Appl. Climatol. 2016, 124, 1089–1098. [Google Scholar] [CrossRef]
- Pecelj, M.M.; Lukić, Z.M.; Filipović, J.D.; Protić, M.B.; Bogdanović, M.U. Analysis of the Universal Thermal Climate Index during heat waves in Serbia. Nat. Hazards Earth Syst. Sci. 2020, 20, 2021–2036. [Google Scholar] [CrossRef]
- Trbić, G.; Popov, T.; Gnjato, S. Analysis of air temperature trends in Bosnia and Herzegovina. Geogr. Pannonica 2017, 21, 68–84. [Google Scholar] [CrossRef]
- Popov, T.; Gnjato, S.; Trbić, G.; Ivanišević, M. Recent trends in extreme temperature indices in Bosnia and Herzegovina. Carpathian J. Earth Environ. Sci. 2018, 13, 211–224. [Google Scholar] [CrossRef]
- Popov, T.; Gnjato, S.; Trbić, G. Changes in temperature extremes in Bosnia and Herzegovina: A fixed thresholds–based index analysis. J. Geogr. Inst. Jovan Cvijic SASA 2018, 68, 17–33. [Google Scholar] [CrossRef]
- Burić, D.; Luković, J.; Ducić, V.; Dragojlović, J.; Doderović, M. Recent trends in daily temperature extremes over southern Montenegro (1951–2010). Nat. Hazards Earth Syst. Sci. 2014, 14, 67–72. [Google Scholar] [CrossRef]
- Burić, D.; Luković, J.; Bajat, B.; Kilibarda, M.; Živković, N. Recent trends in daily rainfall extremes over Montenegro (1951–2010). Nat. Hazards Earth Syst. Sci. 2015, 15, 2069–2077. [Google Scholar] [CrossRef]
- Mihajlović, J.; Burić, D.; Ducić, V.; Milenković, M. Synoptic characteristics of an extreme weather event: The tornadic waterspout in Tivat (Montenegro), on June 9, 2018. Geogr. Pol. 2021, 94, 69–90. [Google Scholar] [CrossRef]
- Burić, D.; Ducić, V.; Mihajlović, J. The climate of Montenegro: Modificators and types—Part one. Bull. Serb. Geogr. Soc. 2013, 93, 83–102. [Google Scholar] [CrossRef]
- Burić, D.; Ducić, V.; Mihajlović, J. The climate of Montenegro: Modificators and types—Part two. Bull. Serb. Geogr. Soc. 2014, 94, 73–90. [Google Scholar] [CrossRef]
- Doderović, M.; Burić, D.; Mijanović, I.; Premović, M. Analysis of River Water and Air Pollution—Pljevlja as a “Hot Spot” of Montenegro. Sustainability 2021, 13, 5229. [Google Scholar] [CrossRef]
- Szentimrey, T. Multiple Analysis of Series for Homogenization (MASH). In Proceedings of the Second Seminar for Homogenization of Surface Climatological Data, Budapest, Hungary, 9–13 November 1998; WCDMP–No. 41. WMO: Budapest, Hungary, 1999; pp. 27–46. [Google Scholar]
- Szentimrey, T. Multiple analysis of series for homogenization (MASH); Verification procedure for homogenized time series. In Proceedings of the Fourth Seminar for Homogenization and Quality Control in Climatological Databases, Budapest, Hungary, 6–10 October 2003; WMO–TD No. 1236. WMO: Budapest, Hungary, 2003; pp. 193–201. [Google Scholar]
- Szentimrey, T. Manual of Homogenization Software MASHv3.02; Authorized script; Hungary Meteorological Service: Budapest, Hungary, 2007; p. 65. [Google Scholar]
- Peterson, T.C.; Folland, C.; Gruza, G.; Hogg, W.; Mokssit, A.; Plummer, N. Report on the Activities of the Working Group on Climate Change Detection and Related Rapporteurs 1998–2001; World Meteorological Organisation Rep. WMO–TD No. 1071, WCDMP–No. 47; WHO: Geneva, Switzerland, 2001; p. 143. Available online: http://etccdi.pacificclimate.org/docs/wgccd.2001.pdf (accessed on 2 February 2022).
- World Meteorological Organization. Report of the CCI/CLIVAR Expert Team on Climate Change Detection, Monitoring and Indices (ETCCDMI); WHO: Geneva, Switzerland, 2004; Available online: https://library.wmo.int/doc_num.php?explnum_id=9265 (accessed on 25 February 2022).
- World Meteorological Organization. Guidelines on Analysis of Extremes in a Changing Climate in Support of Informed Decisions for Adaptation; Climate Data and Monitoring WCDMP–No. 72; WHO: Geneva, Switzerland, 2009. [Google Scholar]
- Mann, H.B. Nonparametric tests against trend. Econometrica 1945, 13, 245–259. Available online: https://www.jstor.org/stable/1907187 (accessed on 19 November 2020). [CrossRef]
- Kendall, M.G. Rank Correlation Methods, 4th ed.; Charles Griffin: London, UK, 1975. [Google Scholar]
- Salmi, T.; Määttä, A.; Anttila, P.; Ruoho-Airola, T.; Amnell, T. Detecting Trends of Annual Values of Atmospheric Pollutants by the Mann–Kendall Test and Sen’s Slope Estimates–The Excel Template Application MAKESENS; Publications on Air Quality Number: 31; Finnish Meteorolog Institute: Helsinki, Finland, 2002. [Google Scholar]
- WMO. WMO Guidelines on the Calculation of Climate Normals; WMO–No. 1203; WHO: Geneva, Switzerland, 2017; p. 29. Available online: https://library.wmo.int/doc_num.php?explnum_id=4166 (accessed on 25 June 2021).
- Serykh, I.V.; Sonechkin, D.M. El Niño forecasting based on the global atmospheric oscillation. Int. J. Climatol. 2021, 41, 3781–3792. [Google Scholar] [CrossRef]
- Serykh, I.V.; Sonechkin, D.M. El Niño–Global Atmospheric Oscillation as the Main Mode of Interannual Climate Variability. Atmosphere 2021, 12, 1443. [Google Scholar] [CrossRef]
- Diaz, H.F.; Hoerling, M.P.; Eischeid, J.K. ENSO variability, teleconnections and climate change. Int. J. Climatol. 2001, 21, 1845–1862. [Google Scholar] [CrossRef]
- Abid, M.A.; Ashfaq, M.; Kucharski, F.; Evans, K.J.; Almazroui, M. Tropical Indian Ocean mediates ENSO influence over Central Southwest Asia during the wet season. Geophys. Res. Lett. 2020, 47, e2020GL089308. [Google Scholar] [CrossRef]
- Broennimann, S. Impact of El Niño-Southern Oscillation on European climate. Rev. Geophys. 2007, 45, RG3003. [Google Scholar] [CrossRef]
- Ducic, V.; Milovanovic, B.; Lukovic, J. Connection between ENSO index, NAO index and decadal-scale variability of precipitation in Serbia. In Proceedings of the Third International Conference-Global Changes and Regional Challenges, Sofia, Bulgaria, 16–17 April 2006; pp. 28–29. Available online: https://scholar.google.com/scholar?hl=sr&as_sdt=0,5&cluster=1633933266264773797 (accessed on 18 September 2021).
- Burić, D.; Dragojlović, J.; Penjišević-Sočanac, I.; Luković, J.; Doderović, M. Relationship Between Atmospheric Circulation and Temperature Extremes in Montenegro in the Period 1951–2010. In Climate Change Adaptation in Eastern Europe—Managing Risks and Building Resilience to Climate Change; Leal Filho, W., Trbic, G., Filipovic, D., Eds.; Springer: Berlin/Heidelberg, Germany, 2019; pp. 29–42. [Google Scholar] [CrossRef]
- Burić, D.; Stanojević., G. Trends and possible causes of cloudiness variability in Montenegro in the period 1961–2017. Clim. Res. 2020, 81, 187–205. [Google Scholar] [CrossRef]
- Burić, D.; Doderović, M.; Dragojlović, J.; Penjišević, I. Extreme weather and climate events in Montenegro—Case study, November 2019. Weather 2021, 76, 383–388. [Google Scholar] [CrossRef]
- Malinović-Milićević, S.; Mihailović, D.T.; Radovanović, M.M.; Drešković, N. Extreme precipitation indices in Vojvodina region (Serbia). J. Geogr. Inst. Jovan Cvijic SASA 2018, 68, 1–15. [Google Scholar] [CrossRef]
- Gajić-Čapka, M.; Cindrić, K.; Pasarić, Z. Trends in precipitation indices in Croatia, 1961–2010. Theor. Appl. Climatol. 2015, 121, 167–177. [Google Scholar] [CrossRef]
- Schär, C.; Ban, N.; Fischer, E.M.; Rajczak, J.; Schmidli, J.; Frej, C.; Giorgi, F.; Karl, T.R.; Kendon, E.J.; Klein Tank, A.M.G.; et al. Percentile indices for assessing changes in heavy precipitation events. Clim. Change 2016, 137, 201–216. [Google Scholar] [CrossRef]


Publisher’s Note: MDPI stays neutral with regard to jurisdictional claims in published maps and institutional affiliations. |
© 2022 by the authors. Licensee MDPI, Basel, Switzerland. This article is an open access article distributed under the terms and conditions of the Creative Commons Attribution (CC BY) license (https://creativecommons.org/licenses/by/4.0/).