Article

Analysis on the Effect of the Targeted Poverty Alleviation Policy on Narrowing the Urban-Rural Income Gap: An Empirical Test Based on 124 Counties in Yunnan Province

1
School of Economics, Yunnan University of Finance and Economics, Kunming 650221, China
2
Institute of Targeted Poverty Alleviation and Development, Yunnan University of Finance and Economics, Kunming 650221, China
*
Author to whom correspondence should be addressed.
Sustainability 2022, 14(19), 12560; https://doi.org/10.3390/su141912560
Submission received: 15 September 2022 / Revised: 28 September 2022 / Accepted: 29 September 2022 / Published: 2 October 2022

Abstract

:
China’s targeted poverty-alleviation policy has eliminated absolute poverty and become the focus of world attention. However, a relative-poverty problem still exists in China, and the large urban–rural income gap is an important issue. Whether the implementation of the targeted poverty-alleviation policy has narrowed the urban–rural income gap, along with its specific effects, requires an accurate analysis, which is particularly critical in order for China to implement a rural-revitalization strategy and further eliminate relative poverty in the future. Given the problems and shortcomings of the existing studies, such as not passing the parallel trend test to overestimate the policy effect, in this study we refer to the previous results, and our analyses divide the 124 counties in Yunnan province into four categories: non-poverty counties and counties with grade-I, grade-II, and grade-III poverty. We selected the panel data of the urban–rural income ratio of each county along with eight influencing factors from 2011 to 2020 for difference-in-difference model (DID) analysis. In this study, we compare the four types of counties level-by-level, and we construct a full-sample spatial DID model. The estimated results, after excluding the impact of COVID-2019, are significant. In addition, we perform robustness and placebo tests and other work on the DID model. All of the results show that the implementation of the targeted poverty-alleviation policy has effectively reduced the urban–rural income ratio in areas experiencing poverty. Finally, we use the intermediary effect analysis method to explore the reasons for the findings: driven by the targeted poverty-alleviation policy, the financial investment in poor areas has substantially increased, further increasing the income level of rural residents in poor areas and thus promoting a notable reduction in the income gap between urban and rural residents in poor areas. We suggest that, although China has achieved comprehensive success in targeted poverty-alleviation, assistance investment still needs to be increased, policies must be adjusted, and income growth must be accelerated to achieve industrial prosperity.

1. Introduction

The urban–rural income gap is one of the important manifestations of the gap between the rich and those living in poverty [1]. Narrowing the urban–rural income gap not only helps to ensure the sustained, stable development of the national economy, but is also crucial for a country to maintain long-term stability [2]. Since the reform and opening up, China’s economy has unprecedentedly developed, people’s living standards have substantially improved, and the disposable income per capita has also notably increased. However, although the total income level has increased, the income gap between those in rural and urban areas has widened [3,4]. Unbalanced and insufficient development has become the main obstacle in the process of people’s pursuit of a better life [5]. When attending the press conference of the third session of the 13th National People’s Congress on the afternoon of 28 May 2020, Premier Li Keqiang stated that the average monthly income of 600 million people in China is only approximately CNY 1000 [6], which has received widespread attention in China and other countries. The income gap problem is gradually becoming a huge obstacle to China’s construction of a well-off society and even a modern country, and the urban–rural income gap is one of its important problems. According to Sicular et al. (2007) [7], approximately 30~50% of the national income gap can be explained by the urban–rural income gap. Overall, the trend in the disposable income ratio of urban and rural residents in China has been an increase followed by a decrease since 2000. After reaching a peak of 3.11 in 2009, the disposable income ratio has been slowly declining for more than 10 years, dropping to 2.56 in 2020 [8]. Although this value is still higher than the international level [9,10], in the past 10 years, with the support of a series of strong preferential policies such as new rural construction, overall urban and rural development, rural poverty-alleviation and development, and beautiful rural construction, China’s urban–rural income gap has been decreased.
The problem of an excessive urban–rural income gap has long attracted extensive attention in academic circles. The urban–rural income gap was first discussed in the Petty Clark theorem [11] and the research of David Ricardo [12]. Since then, Kuznets’s inverted-U curve hypothesis (1955) showed us that the urban–rural income gap will first rise and then decline with economic growth [13]. Many scholars have successively confirmed the authenticity of Kuznets curve. Although some scholars still question this hypothesis, the majority generally agree with its accuracy [14,15,16,17,18]. In studies on the urban–rural income gap, more commonly applied research main points are measurement methods [19], analyses of influencing factors [20,21,22,23,24], analyses of temporal and spatial pattern [25,26], case studies [27], etc. Due to the fact that the causes of urban–rural income gaps are complex and diverse, research results on the factors influencing urban–rural income gaps are varied.
The targeted poverty-alleviation policy implemented in China since 2014 is known as the “World Poverty Reduction China Program”. Since 2014, China’s targeted poverty-alleviation policy has achieved comprehensive success and eliminated absolute poverty. However, although absolute poverty has been eliminated, the problem of relative poverty has not been completely solved, which involves the urban–rural income gap. China’s existing urban–rural income gap is too large; however, in this study, we were more interested in whether China’s targeted poverty-alleviation policy has been conducive to alleviating relative poverty while eliminating absolute poverty and its specific effects. This is one of the important issues of concern in China and other counties following the comprehensive success of the national antipoverty campaign. As such, an accurate scientific assessment of this issue is required, because studying this issue will not only help China to formulate a rural revitalization strategy and achieve common prosperity in the future, but will also help to further understand the relationship between absolute and relative poverty. Targeted poverty-alleviation aims for poor farmers to achieve the goal of being free from worries regarding food and clothing, to have access to compulsory education, basic medical services, and safe housing [5], and to increase the sustainability of farmers’ incomes. In theory, it will also narrow the gap between the rich and the poor. However, we do not understand the actual situation. As such, an empirical study needs to be conducted to understand these issues.
Scholars have only indirectly discussed the relationship between targeted poverty-alleviation policies and the urban–rural income gap in the literature. For example, Yang et al. (2021) [28] indirectly discussed the relationship between targeted poverty-alleviation and the urban–rural income gap, and compared the urban–rural income gap of counties at four poverty levels in Yunnan province. In addition, some scholars discussed the effects of the targeted poverty-alleviation policy from the perspective of income. For example, Guo et al. (2008) [29], Liu et al. (2018) [30], Zhao et al. (2018) [31], and Cai et al. (2019) [32] successively analyzed the effects of the implementation of targeted poverty-alleviation policies on increasing rural residents’ incomes. Some scholars discussed the effects of the targeted poverty-alleviation policy from the health perspective. For example, Dai et al. (2020) [33] used Shaanxi province as an example to analyze the effect of targeted poverty-alleviation policies on promoting rural resident health. Other scholars confirmed the effect of targeted poverty-alleviation policies from another perspective by obtaining household survey data and analyzing the changes in household incomes resulting from the implementation of targeted poverty-alleviation policies from a micro perspective. For example, Li et al. (2020) [34] analyzed the effect of targeted poverty-alleviation on rural resident income-increase based on a micro-data survey and the use of a fuzzy RDD model. Huang et al. (2021) [35] selected a city as an example to analyze the effect of targeted poverty-alleviation on household income.
In the literature, few researchers have directly studied the effect of China’s targeted poverty-alleviation policies on narrowing the urban–rural income gap, inspiring some scholars to fill this gap in the literature. Zhang et al. (2018) [36], taking 31 provinces (cities and autonomous regions) in China as their study area, and based on provincial panel data from 2010 to 2016, explored the role of China’s targeted poverty-alleviation policies in reducing the urban–rural income gap with a spatial econometric model. However, this had some shortcomings: the data were not accurate to the county level (i.e., poverty counties and non-poverty counties), and the comparative analysis was not conducted using more complete policy-evaluation tools, such as the difference-in-difference model (DID). Liu et al. (2020) [37] used the PSM model to analyze the impact of targeted poverty-alleviation policies on the income gap between urban and rural residents, taking Shanxi Province as an example. Compared with the previous research, Liu et al. achieved some breakthroughs, but they only considered all of the years before and after the policy’s implementation as cross-sectional data; a more detailed dynamic effect comparison for each year was lacking. In addition, Zhang et al. (2021) [38] obtained the data of 119 counties (cities and districts) in Yunnan province from 2010 to 2019 to build a PSM-DID model which compared poverty counties with non-poverty counties, and analyzed the change in the urban–rural income gap in Yunnan’s state-level counties experiencing poverty under the impact of targeted poverty-alleviation policies. However, this analysis had some shortcomings. First, the authors did not control the time effect when building the model. Second, we found that the simple method of taking non-poverty counties as the control group and poverty counties as the treatment group for comparative analysis did not pass the parallel trend test, which led to the overestimation of the effect of the targeted poverty-alleviation policies.
Through a literature review, we also found that few scholars have directly evaluated the effect of targeted poverty-alleviation policies on reducing the urban–rural income gap. Despite some researchers doing so [36,37,38], their studies had some shortcomings. In particular, failure to pass the parallel trend test led to a certain deviation in the results estimated by the model, which therefore could not accurately reflect the effect of targeted poverty-alleviation policies. The reason may be that the practice of taking poverty counties as the treatment group and non–poverty counties as control groups prevents the parallel trend test from being passed, so the obtained results lack credibility. More importantly, in the published studies, the authors did not deeply explore the mechanisms and reasons for the impact of targeted poverty-alleviation policies on narrowing the urban–rural income gap, which is also a weak link in the existing studies. Clarifying the effect of implementing targeted poverty-alleviation policies will provide a vital reference for the effective implementation of rural revitalization strategies. Given the shortcomings in the current research, in this study, we selected Yunnan province, which has the most poverty-stricken counties in China, for an empirical study. We divided the 124 counties that we analyzed (excluding the main urban areas, the specific reasons for which are described below) into four categories: non-poverty counties and grade-I, grade-II, and grade-III poverty-stricken counties [28]. We selected the panel data of the urban–rural income gap and eight influencing factors in each county from 2011 to 2020 for difference-in-difference model (DID) analysis. We considered how to address the shortcomings of the existing research. Due to the fact that prior researchers did not use appropriate policy-evaluation tools, we intended to use a DID model for analysis. However, the results of DID model analyses usually fail the parallel trend test. As such, we needed to solve this problem. This required innovation in research methods. All counties in Yunnan province are subject to the targeted poverty-alleviation policy. However, due to the differences in the poverty and economic development levels in each region, different counties are affected to different degrees by poverty. For regions with strong economic conditions, the country’s poverty-alleviation efforts are minimal, but for economically undeveloped areas, the poverty-alleviation efforts are substantial. Therefore, we divided the regions of Yunnan province into different levels [28]. Yunnan hosts 88 poverty-stricken counties, in which the level of poverty level widely varies. If the differences between poverty and non-poverty counties are generally compared, the parallel trend test will be failed. Therefore, we adopted the method of grading the poverty-stricken counties, and drew on previous research experience to determine the basis and level of division so as to more accurately analyze the effects of the targeted poverty-alleviation policies.

2. Materials and Methods

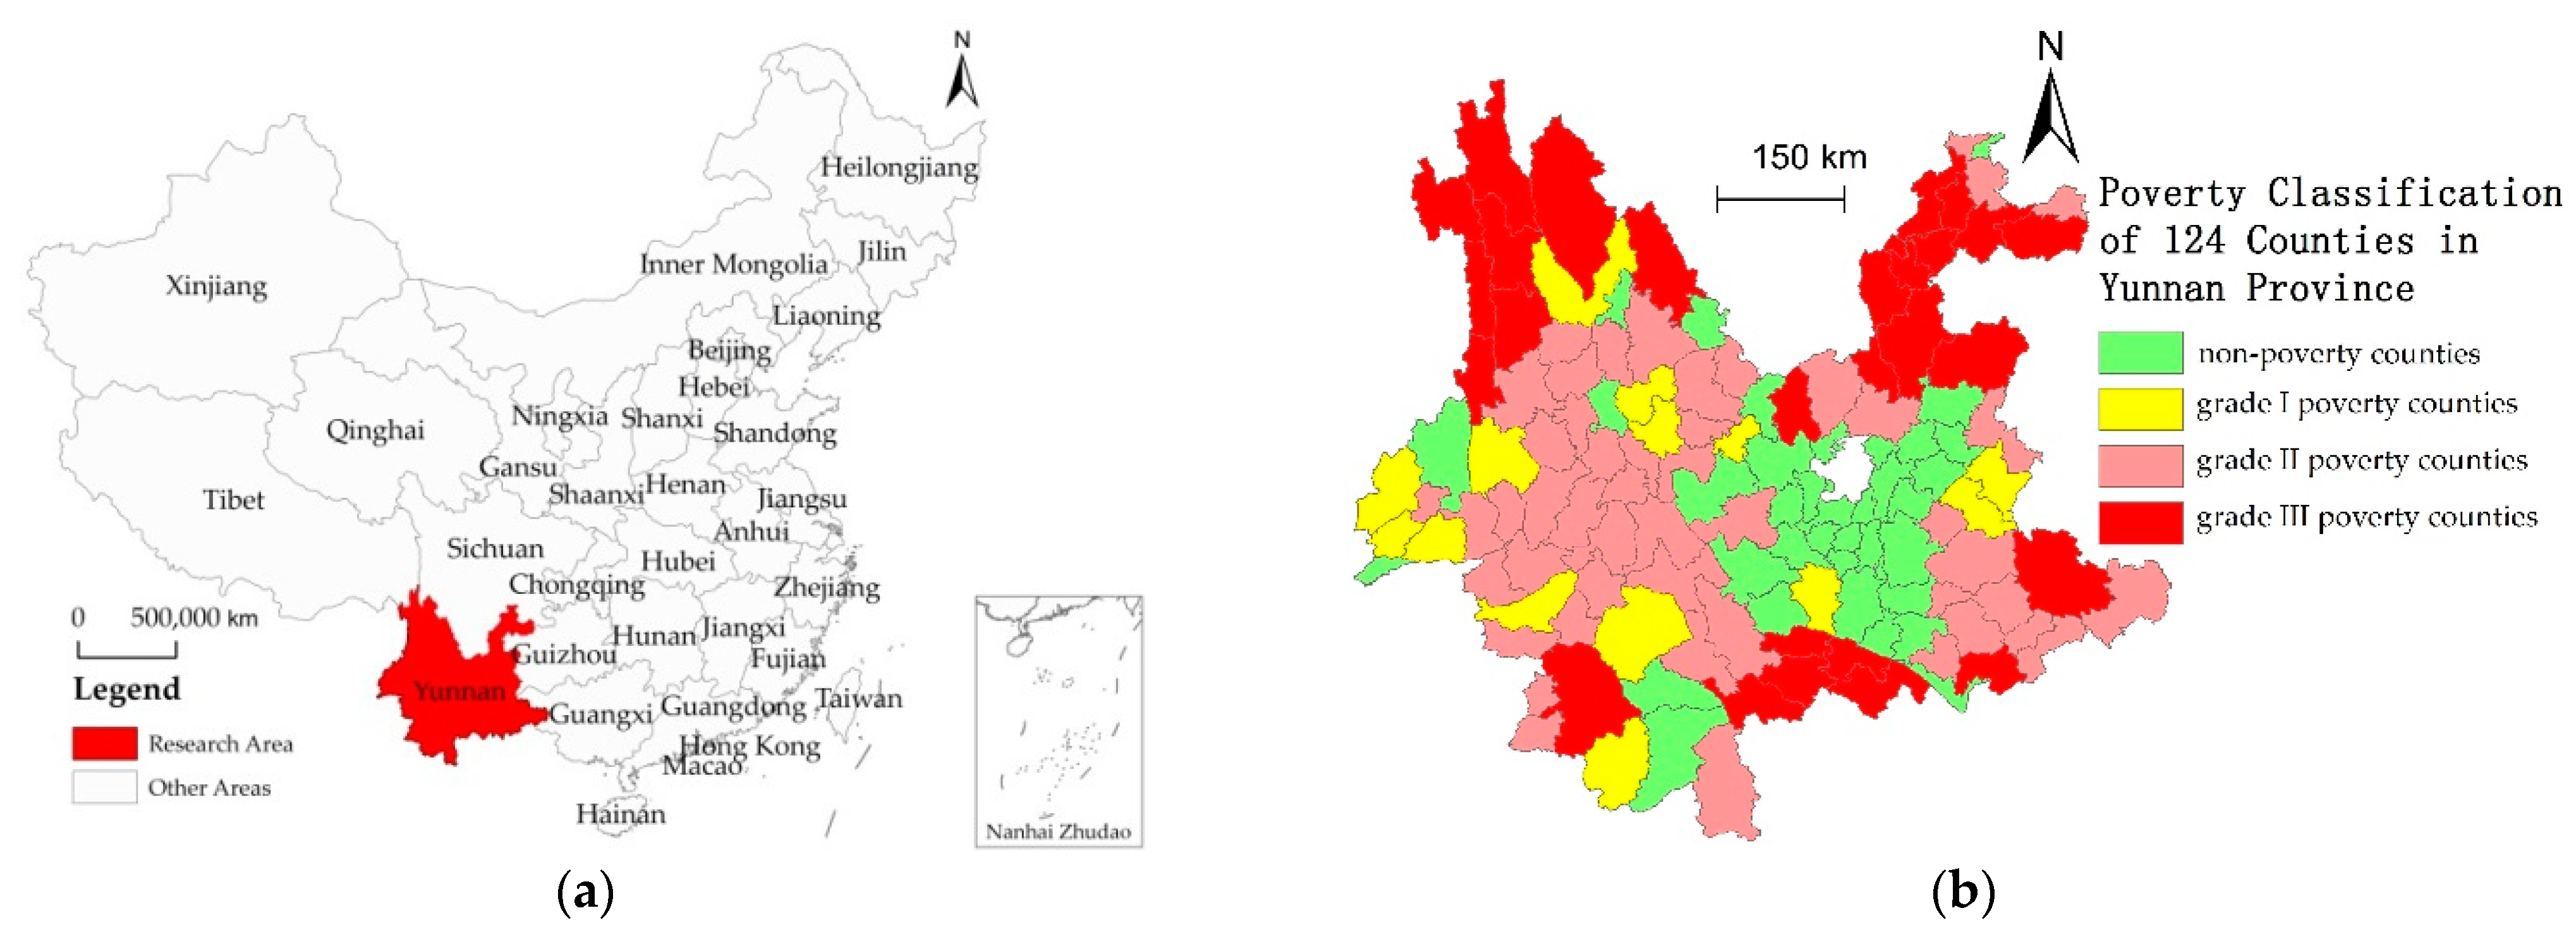
2.1. Overview of Poverty in China

Poverty is a major problem that human society has been facing. Eliminating poverty, narrowing the urban–rural income gap, and moving toward common prosperity are the major goals to achieve sustainable development and long-term stability in China. As the largest developing country in the world, China is also facing a serious rural poverty problem, so must undertake the major mission and arduous task of reducing poverty. Since the founding of the People’s Republic of China, China’s rural poverty-alleviation has experienced three stages: traditional relief poverty-alleviation (1949–1983, mainly simple relief methods such as the provision of money and goods), poverty-alleviation development (1984–2012), and targeted poverty-alleviation (2013–2020) [39,40,41,42]. In November 2013, President Xi introduced the important idea of targeted poverty-alleviation when he visited Shibadong Village. Since 2014, targeted poverty-alleviation has become a basic strategy for China to reduce poverty. Through continuous efforts during the 13th Five-Year Plan period, China’s targeted poverty-alleviation has achieved unprecedented comprehensive success: absolute poverty has been eliminated, a considerable increase in the per capita income of the rural poor has been achieved, and a foundation has been laid for narrowing the gap between the rich and poor in achieving common prosperity. The results of the analysis in this study show that the effective implementation of this policy has significantly reduced the relative urban–rural income gap in poverty-stricken areas. To determine the size and mechanism of this role, a more mature and perfect policy-evaluation model needed to be used to ensure scientific and reasonable evaluation and analysis, so as to provide support for the improvement of follow-up policies.
The implementation of the targeted poverty-alleviation policy has effectively helped poor farmers to remarkably increase their income and abolished absolute poverty. Theoretically, the “township” problem in the urban–rural income gap has been solved to varying degrees [39]. In addition to natural conditions, the reason why poverty-stricken counties are poor is largely due to their weak industrial foundation, lack of capital, low level of fiscal revenue, and insufficient public investment, which have slowed the development of rural economies and limited the increase in people’s income in these rural areas. The targeted poverty-alleviation policy focuses on poverty-stricken counties and rural poor people. The central, provincial, municipal, and county governments provide support to poverty-stricken counties through financial transfer payments, tax relief, special poverty-alleviation discounts, etc. High-intensity and -density human talent, materials, and other poverty-alleviation resources are constantly transferred to poverty-stricken counties, especially to deeply poverty-stricken counties. A series of implemented targeted policies and measures has considerably alleviated the situations of those experiencing poverty, and effectively improved the income level of poor households. Li et al. (2020) [43] found that targeted poverty-alleviation policies have played a large role in promoting the economic growth of poverty-stricken counties, and that this role is continuously being enhanced with the continuous implementation of targeted poverty-alleviation policies. In recent years, the disposable income per capita of rural residents in poverty-stricken areas has continued to grow. To consolidate and enhance the achievements in poverty-alleviation, the state has set up a five-year transition period. One of the important objectives of the 14th Five-Year Plan period is to effectively connect the consolidating and expanding of the achievements in targeted poverty-alleviation and rural revitalization [44].

2.2. Research Methods

2.2.1. Difference-In-Difference (DID) Model

In recent years, the DID model has been widely used to quantitatively analyze the net effect of a policy or the actual effect of a project [45]. It is a relatively perfect policy-evaluation tool and can more accurately answer the question as to whether the targeted poverty-alleviation policy has promoted the narrowing of the urban–rural income gap. The DID model divides each sample into control and treatment groups and judges whether a policy has had a notable impact on the treatment group by comparing the differences between the two groups before and after the implementation of the policy. In this study, we used the panel data of counties in Yunnan province from 2011 to 2020 to build the DID model. Due to the fact that the targeted poverty-alleviation policy was implemented in 2014, we could use the DID model to estimate the policy’s effects. We set the model as [46,47]:
Y i j = β 0 + β 1 t i m e × t r e a t + k = 1 n λ k X k , i j + γ j + μ i + ε i j
where Yij is the urban–rural income gap; time is a dummy variable for time, which was assigned a value of 0 before 2014 and 1 after 2014; treat is the dummy variable of each group, taking a value of 1 in the treatment group and 0 in the control group; Xk,ij represents the kth control variable; β0, β1, and λk are the estimation coefficients; γj and μi represent time and individual effects, respectively; and εij is the error disturbance term.

2.2.2. Selection of Indicators

To measure the urban–rural income gap, we mainly used relative and absolute indicators. The former refers to the ratio of disposable income per capita of urban and rural residents, which is also known as the urban–rural income ratio [48]. The latter is the difference between them, which is referred to as the urban–rural income differential [48]. Whether the relative or absolute indicator is adopted, the size of the urban–rural income gap depends on two specific factors: the disposable income per capita of urban and rural residents. For the convenience of analysis, we selected the ratio of disposable income of urban and rural residents as the dependent variables. Our data sources were the Yunnan Leading Cadres Manual (2020–2021, Yunnan People’s Publishing House) and the Yunnan Survey Yearbook (2017–2019, China Statistics Publishing House). Referring to previously used research methods [20,21,22,23,24,28,38], we selected 8 control variables from three dimensions: industrial development, economic level, and population structure. The calculation method is shown in Table 1. Our data sources included the Yunnan Statistical Yearbooks (2012–2021, China Statistics Press) and the EPS platform.

2.2.3. Poverty Classification Method

Whether the targeted poverty-alleviation policy has narrowed the urban–rural income gap in poverty-stricken counties and its specific effects need to be scientifically assessed. However, the simple practice of taking poverty-stricken counties as the treatment group and non-poverty counties as the control group will result in the parallel trend test being failed, so the evaluation results will lack credibility. Therefore, we needed to determine how to pass the parallel trend test. Here, the perspective can be shifted to poverty-stricken counties. For a one-size-fits-all policy, any sample will be affected by the policy. However, due to the different natures of the samples, the degree of impact varies. Here, the DID model can also be used to estimate the areas more- or less-impacted by the policy. Many scholars have studied the actual effect of the one-size-fits-all policy based on this idea [49,50,51,52]. Using previous research ideas for reference, we divided 124 counties in Yunnan province into multiple levels, according to the impact of the targeted poverty-alleviation policy; then, the effect of policy implementation was obtained by comparing the decline of the urban-rural income gap between the counties with greater impact and the counties with less impact. We needed to determine how to judge the impact of the targeted poverty-alleviation policy on each county. Generally, targeted poverty-alleviation policies mainly influence poverty-stricken counties. The more poverty-stricken the county, the stronger impact of the targeted poverty-alleviation policy, and the more financial capital and other resources are invested. Therefore, we were able to classify the 124 counties in the province according to their poverty level [28]. Based on the results, according to the former Office of the Poverty Alleviation and Development Leading Group of the State Council [53,54] and in combination with the situation in Yunnan province, we divided 124 counties in Yunnan province into four levels, according to their degree of poverty (Table 2).
Although Table 2 divides 124 counties in Yunnan Province into different poverty levels, we cannot directly see the locations of these counties. As such, we drew a poverty distribution map of the 124 counties in Yunnan province in China (Figure 1).
We found that the urban–rural income gap substantially increases as poverty deepens (Figure 2). Based on this, this study compares non-poverty counties, grade-I poverty counties, grade-II poverty counties, and grade-III poverty counties, respectively. By comparing the differential changes of the urban–rural income gap among counties at different levels under the influence of the targeted poverty-alleviation policy, we can better judge the policy’s effect.
After resetting the treatment and control groups to estimate the net effect of the targeted poverty-alleviation policy, we conducted a full-sample spatial DID model estimation and parallel trend, placebo, and model robustness tests, excluding the impact of COVID-19, and explored the mechanism through which the targeted poverty-alleviation policy affected the narrowing of the urban–rural income gap.

2.2.4. Mediation Effect Analysis Method

By using the DID model, we could more accurately estimate the actual effect of the targeted poverty-alleviation policy, but we could not determine why the policy played such a role. That is, we wanted to determine the impact mechanism that enabled the targeted poverty-alleviation policy to narrow the urban–rural income gap. This required in-depth discussion.
Baron et al. (1986) [55] proposed a model to test the intermediary effect, which refers to a process through which the independent variable affects the dependent variable through one or more variables in the middle. The model is used to test the mechanism of action of the independent variable on the dependent variable (i.e., how the independent variable acts on the dependent variable). From the above analysis, we found that the targeted poverty-alleviation policy had achieved results, but we wanted to determine its mode of action. Was the effect achieved by increasing farmer income or by promoting the construction of rural infrastructure and narrowing the gap between urban and rural public services, so as to narrow the urban–rural income gap? Therefore, we used the intermediary effect model to analyze this intermediary effect.
According to the theory and method proposed by Baron et al., we set the tested model as:
M i j = φ 1 + θ 1 Z i j + k = 1 n λ k , 1 X k 1 , i j + γ 1 j + μ 1 i + ε 1 , i j Y i j = φ 2 + θ 2 M i j + k = 1 n λ k , 2 X k 2 , i j + γ 2 j + μ 2 i + ε 2 , i j Y i j = φ 3 + θ 3 Z i j + θ 4 M i j + k = 1 n λ k , 3 X k 3 , i j + γ 3 j + μ 3 i + ε 3 , i j
where Yij is the dependent variable; Zij indicates the core independent variable of concern (where time × treat expresses effect of the targeted poverty-alleviation policy); Mij is the intermediate variable; Xk1,ij, Xk2,ij, and Xk3,ij represent the control variables; φ1, φ2, φ3, λk,1, λk,2, λk,3, θ1, θ2, θ3, and θ4 represent the estimation coefficients; γ1j, γ2j, and γ3j represent the year effects; μ1i, μ2i, and μ3i represent the individual effects; and ε1,ij, ε2,ij, and ε3,ij are the error disturbance terms. If the following four conditions are met, mediation exists: (1) the estimation result of θ1 is significant; (2) the estimation result of θ2 is significant; (3) the estimation result of θ4 is significant; (4) the absolute value of θ4 is less than that of θ2.
Many scholars have proposed different methods to test the intermediary effect. Aroian (1947) [56] and Goodman (1960) [57] proposed the Taylor expansion algorithm and unbiased estimation algorithm, respectively; Sobel (1982) [58] proposed the first-order Taylor expansion algorithm. In this study, we applied these three methods.

2.2.5. Research Hypothesis

Before discussing the policy mechanisms, certain assumptions were required that we verified with the econometric model. Therefore, we could further use the econometric model to test the correctness of each hypothesis. To determine the mechanism through which the targeted poverty-alleviation policy narrowed the urban–rural income gap, after careful thinking and analysis, we drew the following assumptions:
Hypothesis 1.
We think that the calculation formula of the relative urban–rural income gap shows that if the income of rural residents considerably increases, the gap narrows. Therefore, the targeted poverty-alleviation policy likely increases the disposable income of rural residents, thus narrowing the urban–rural income gap. Accordingly, we used the natural logarithm of the disposable income of rural residents (ln income) as the intermediary variable. Considering the influence of factors such as rising prices and the availability of data, we divided the income for each year by the GDP index to obtain the actual income (the base period was 2009). Similarly, the fiscal expenditure variables in the latter assumptions also excluded the impact of prices. In addition, because our main focus in this study was the impact of the targeted poverty-alleviation policy on the growth rate of rural residents’ actual disposable income, rather than the total amount, the logarithmic form was more realistic. However, when studying the impact of fiscal expenditure, we focused on the total amount rather than the increase, so we did not take the logarithm.
Hypothesis 2.
The targeted poverty-alleviation policy not only improves farmers’ income, but also ensures that rural poor people are free from worries regarding food and clothing and have access to compulsory education, basic medical services, and safe housing. This is an important measure to ensure the housing safety of poor farmers and the construction of rural infrastructure such as water, electricity, and roads. During the period of targeted poverty-alleviation, many poor villages received access to water, electricity, and roads, and many of those in poor households relocated. Although these do not directly improve farmers’ incomes, they facilitate transport and increase the convenience of working with and selling agricultural products, thus indirectly reducing the gap between urban and rural public services and incomes. Considering the availability of data, we used the county night light data obtained by DMSP/OLS from 2010 to 2020 and used pairs to approximately characterize the improvement in infrastructure. We added 0.01 to the variable, and then took the logarithm (ln light) as the intermediary variable.
Hypothesis 3.
The targeted poverty-alleviation policy needs increased human, material, and financial support to increase the disposable income of rural residents. Therefore, for areas with people experiencing deep poverty, governments are likely to spend more money on poverty-alleviation and increase transfer payments to rural residents (including various subsidies), thus directly or indirectly narrowing the urban–rural income gap. Considering the availability of data, we adopted the actual per capita public financial budget expenditure (i.e., the control variable X7 in Table 1, which is expressed as “finance” below for convenience) as the intermediary variable.
Hypothesis 4.
The targeted poverty-alleviation policy promotes the assistance of local cadres to farmers, especially to poverty households, including the establishment of public welfare posts, assistance workshops, technical training, and many other ways, so as to promote the employment of poverty farmers and improve the incomes of poverty farmers, which may help to further narrow the urban–rural income gap. Considering the availability of data and drawing on the ideas of Zhang et al. (2021) [38], we adopted the rural employment level (rural employees/total rural population, called “work”) as the intermediary variable. The data regarding the rural employment population for a small number of counties were missing, and the 2020 data had not been published. We used Stata software to automatically eliminate these missing values when estimating.
Hypothesis 5.
Industry and employment are two important avenues through which to implement the targeted poverty-alleviation policy and increase farmers’ incomes. The targeted poverty-alleviation policy motivates local cadres to explore characteristic rural industries according to the local natural and socio-economic conditions. It also helps with arranging professional production cooperatives or enterprises to drive and share dividends to increase farmers’ outputs and incomes. Therefore, in this study, we used the natural logarithm form (ln industry) of the output value of agriculture, forestry, animal husbandry, and fishery as the intermediary variable.
Hypothesis 6.
The targeted poverty-alleviation policy further promotes increases in farmers’ incomes by increasing local financial expenditure (national and provincial investment in the public finance of deeply poverty-stricken counties), and thus narrows the urban–rural income gap.

2.2.6. Summary of Research Methods

The above described our main study methods. As the study methods involved many sources to more intuitively and clearly explain the study’s purpose and steps, Figure 3 depicts a flow chart of the study methods.

3. Results

3.1. DID Model Estimation and Test Results

3.1.1. DID Model Estimation Results

By comparing the changes in the urban–rural income ratio among the counties at all levels under the influence of the targeted poverty-alleviation policy, we evaluated the effect of the policy (Table 3). Notably, 41 of the counties in Yunnan province were considered not-impoverished. Among them, the Wuhua, Panlong, Guandu, Xishan, and Chenggong Districts, which are located in the main urban area of Kunming (provincial capital city), were not comparable with the considered counties due to their developed economies and high resident population densities, having mostly urban residents and a low urban-to-rural income gap. After using Stata software calculation, we found that the leverage and residual square values of these five samples were very high (taking 2020 as an example, the leverage values of the five main urban areas in Kunming were 13.85, 7.19, 5.09, 1.21, and 1.05, respectively, and the residual square values were 1.96, 1.30, 1.26, 0.68, and 0.63, respectively). They could therefore be considered inappropriate leverage points [59] that would have seriously impacted the results [60]. If we had retained these five main urban areas, the model may not only have overestimated the effect of the narrowing of the urban–rural income gap, but may also have failed the parallel trend test. The calculation results show that if the five main urban areas were retained, the estimation of the policy effect without considering the control variables would have been −0.0980 (overestimated by 0.0041 compared with that after elimination), whereas the estimated value of policy effect after considering the control variables was −0.0848 (overestimated by 0.0092 compared with that after elimination), which would fail parallel trend test. According to previous research experience, these inappropriate leverage points lead to estimation bias, so we needed to eliminate them [60,61]. Therefore, we eliminated the five districts from the main urban area of Kunming; the final number of counties in the non-impoverished sample was 36.
The estimated results of models (1)–(6) in Table 3 were all negative. Among them, the estimated results of models (1) and (2) passed the significance test at the 1% level, which shows that compared with non-poverty counties, grade-I poverty counties have significantly reduced the urban–rural income gap under the influence of the targeted poverty-alleviation policy. Although the estimation results of models (3)–(6) were negative, they were not significant, especially after adding the control variables; they did not pass the 10% significance test, which shows that, for poverty-stricken counties, the targeted poverty-alleviation policy has not significantly reduced the urban–rural income gap in areas with deeper poverty than in areas with less poverty. Based on this, we compared grade-I and grade-III poverty counties, as shown in models (7) and (8). The absolute value (0.0458) of the estimation result of model (8) was less than that (0.0756) of the estimation result of model (2), and after adding the control variables and adopting the standard error of clustering at the individual level, the estimated result of time × treat also failed to pass the significance test at the 10% level (the p value was 0.132, being slightly larger than 0.1), indicating that the difference in the effect of the targeted poverty-alleviation policy on grade-I and -III poverty counties is less than that on non-poverty and grade-I poverty counties. In other words, for the poverty-stricken counties experiencing deeper poverty, the effect of targeted poverty-alleviation is stronger compared with that in less-poverty-stricken counties, but the impact is still limited. This may be because all poverty-stricken counties, regardless of the depth of poverty, have been fighting against poverty as they were driven by the targeted poverty-alleviation policy. Compared with non-poverty counties, the urban–rural income gap has been significantly narrowed. However, in areas experiencing deeper poverty, due to the constraints imposed by natural conditions such as terrain and financial restrictions and human and material resources, the poverty alleviation and income increase have remained limited. Therefore, in targeted poverty-alleviation strategies, we need to focus on those poverty-stricken counties that have more fragile natural and socio-economic conditions.
Traditional DID estimation results are unbiased, even if they are not significant. After controlling the interference of various factors as much as possible, according to the estimated results in Table 3, the implementation of the targeted poverty-alleviation policy has further reduced the urban–rural income gap of grade-I poverty counties by 0.0756 compared with non-poverty counties, grade-II poverty counties by 0.0141 compared with grade I poverty counties, and grade-III poverty counties by 0.0324 compared with grade II poverty counties. Compared with grade-I poverty counties, the urban–rural income ratio of grade-III poverty counties was further reduced by 0.0458. To facilitate calculation, we separately compared the non-poverty counties with the grade-I–III poverty counties. According to the above estimation results, we roughly estimated that the implementation of the targeted poverty-alleviation policy has further reduced the urban–rural income ratio of grade-I poverty counties by 0.0756 compared with that of non-poverty counties; compared with non-poverty counties, the urban–rural income ratio of grade-II poverty counties has further decreased by 0.0141 + 0.0756 = 0.0897. Compared with non-poverty counties, the urban–rural income ratio of grade-III poverty counties has been further reduced by 0.0458 + 0.0756=0.1214. Based on this finding, we could roughly calculate the total effect of the targeted poverty-alleviation policy as follows: (14 × 0.0756 + 47 × 0.0897 + 27 × 0.1214)/(14 + 47 + 27) ≈ 0.0972.

3.1.2. Parallel Trend Test Results of DID Model

We used the event-study approach (ESA) to perform the parallel trend test (both considering the control variables) [62]. Figure 4a–d depicts the parallel trend test results of the four types of situations in Table 3, respectively: the estimated values of the four models, (2), (4), (6), and (8) in Table 3, considering the control variables before and during the implementation of the policy were not significant, which supports the parallel trend hypothesis. Due to the existence of multicollinearity, we eliminated year2011 × treat in this study. For the treatment variable, the parallel trend test started from 2012, and the period before and during the implementation of the policy included 2012–2014. At the same time, it should be pointed out that although the sample of the main urban area is excluded in this paper, the results in Figure 4a have a downward trend in 2013. This may be due to the small sample size, and the model in this part is mainly to present the comparison of counties at different levels more intuitively, so as to lay a foundation for the full-sample DID estimation. Due to the sufficient sample size, the parallel trend test of the full-sample DID (Figure 6a,b) is perfect.
Although Figure 4b,c conforms to the parallel trend, it shows that the urban–rural income gap has not significantly changed after the implementation of the targeted poverty-alleviation policy. Although Figure 4d shows notable changes, the grade-I and -III poverty counties show considerable differences after many years of policy implementation, and the range of change is limited. Figure 4a shows that after the implementation of the targeted poverty-alleviation policy, the urban–rural income gap in grade-I poverty counties was much smaller than that in non-poverty counties. These trends are generally consistent with the results of our analysis shown in Table 3: the targeted poverty-alleviation policy has substantially reduced the urban–rural income gap in poverty counties; for areas experiencing deeper poverty, the effect of targeted poverty-alleviation has been stronger than in counties experiencing less poverty, but its impact has remained limited.

3.1.3. DID Estimation Results after Excluding COVID-19 Outbreak Years

We accurately estimated the narrowing effect of the targeted poverty-alleviation policy on the income gap between urban and rural poverty counties, but the years we chose for this study were 2011–2020. Given the spread of COVID-19 in 2020, if we did not control for the effect of the pandemic, the estimation results could have been biased. Although we controlled for time and individual effects, we were concerned that the effects of the pandemic would interfere with the estimation results. To test the robustness of the estimation, we excluded the observations from 2020 and redid the estimation according to the method in Table 3, and the results are shown in Table 4.
Comparing the results in Table 3 and Table 4, we found that the significance level of the estimated treatment result of time × treat slightly decreased and that the estimation coefficient did not considerably change, indicating that the result estimated by the model was robust. Even considering the COVID-19 outbreak year, the two-way fixed model could better control for the effects of the pandemic. After excluding the outbreak year, the estimation results of the DID model still passed the parallel trend test. To save space, the test results are not provided, but they can be provided upon request from the corresponding author.

3.1.4. Placebo Test of DID Model

Although the results of the above model pass the parallel trend test, further study was required. If other policies are issued in the study period or other non-random factors have an influence, they would interfere with the results estimated by the DID model, resulting in the estimated policy effect not being the real policy effect. As an important part of the DID model system, the placebo test can help increase the robustness of the results estimated by the DID model. Many methods can be used for the placebo test, among which the more commonly used are the random setting of the control and treatment groups. After several settings, whether the policy effect significantly deviates from other hypothetical results must be tested [62,63]. We used this method for the placebo test.
In this study, we performed the placebo test on the DID model with non-poverty counties as the control group and grade-I poverty counties as the treatment group. Specifically, we randomly selected 14 counties out of 50 counties (i.e., the 36 non-poverty counties and 14 grade-I poverty counties after excluding the five main urban areas in Kunming) as the treatment group and the rest were the control group. We considered the impacts of individual and time effects according to the above method, and we added eight control variables. In this study, we used 500 samples (Figure 5a), and we excluded the influence of the COVID-19 outbreak year. We also took 500 samples according to the original method (Figure 5b). The curve shows a normal distribution, and the time was stable; whether all years were retained or 2020 was excluded, the estimated values of time × treat concentrated near point zero and were roughly consistent with βDID = 0 (symmetric). The p value of most of the estimation results is greater than 0.1, while the estimation results of the second model in Table 3 and the second model in Table 4 are outliers, far from the density function curve. This shows that the results estimated by the DID model are unlikely to be affected and driven by other unobservable factors.

3.2. Full-Sample Spatial DID Model Estimation and Test Results

We used the above method of pairwise comparison to compare the effect of narrowing the urban–rural income gap in the four levels of counties driven by the targeted poverty-alleviation policy, but we still needed to determine the total effect of the targeted poverty-alleviation policy. We could achieve this by adding up the results of the two comparisons, but the targeted poverty-alleviation policy had different impacts on the different levels of the counties. Another method involved adding the 124 counties analyzed into the model, but this would have led to the failure of the parallel trend test. As mentioned above, for a one-size-fits-all policy, any sample will be affected by the policy to varying degrees. The DID model can be used to estimate the net policy effect on the areas more- or less-strongly impacted [49,50,51,52]. Therefore, after repeated experiments, we reset the control and treatment groups. We found that, by taking the non-poverty counties and the grade-I and-II poverty counties as the control group and the grade-III poverty counties as the treatment group, the parallel trend test was passed.
As we added many counties, spatial autocorrelation was likely. The simple use of the traditional DID model may also have led to bias in the estimation results, which would have hindered a more accurate measurement of the narrowing effect of the urban–rural income gap produced by the targeted poverty-alleviation policy. Therefore, in addition to the Cochrane–Orcutt iterative method [64], we introduced the method of spatial econometrics to construct a spatial adjacency weight matrix W, which we verified by a spatial autocorrelation model (SAC), spatial autoregressive model (SAR), and spatial error model (SEM) [64]. The estimation results are shown in Table 5.
Table 5 shows that regardless of using spatial econometric estimation methods or not and regardless of what spatial econometric estimation methods were used, the estimated results of time × treat were significant. In addition, after using the spatial econometric estimation method, the absolute value of the estimation results of time × treat decreased and the estimation results of various spatial econometric models showed minimal differences, indicating that the spatial econometric estimation method could better control the spatial autocorrelation problem and produce estimation results closer to reality. According to spatial parameters ρ and λ, we selected the spatial error model (the estimation results of the three types of spatial econometric models differed little) as the optimal model for estimation. The results show that when considering the influence of other factors, the targeted poverty-alleviation policy decreased the urban–rural income ratio of grade-III poverty counties by 0.0484 compared with other counties in Yunnan province, and the estimation result is significant.
To further test the robustness of the model and eliminate the interference of COVID-19 on the results, we excluded the year of the COVID-19 outbreak (2020) and reused the above method to construct the model. The estimated results are shown in Table 6.
Table 6 shows that the results estimated for time × treat using each estimation method are significant. The results estimated for time × treat (absolute value) are slightly lower than before, and the reduction range is small, indicating that the model is relatively robust.
In this study, we used the event-study approach (ESA) to test the parallel trend (Figure 6a, where we considered the control variables). As the COVID-19 outbreak would have interfered with the test results of the parallel trend, we then used the event-study approach (ESA) to test the estimated results after excluding the pandemic year (2020) (Figure 6b). In this study, we randomly selected 27 counties out of 124 counties, excluding the five main urban areas in Kunming, as the treatment group, and used the rest as the control group. According to the above method, considering the effects of individual and time, we added control variables, and carried out the approach considering 500 (Figure 6c) and 10,000 samples (Figure 6d). We also considered 500 samples excluding the year affected by the pandemic (Figure 6e).
As shown in Figure 6a,b, regardless of whether the year of the pandemic outbreak was excluded, the estimated results before and during the implementation of the policy were not significant, indicating that the setting of the DID model conforms to the parallel trend premise. The placebo results (Figure 6c–e) show that the results estimated by the DID model are likely not affected or driven by other unobservable factors.

3.3. Impact Mechanism Analysis

The above model results and analyses show that targeted poverty-alleviation policies can significantly narrow the urban–rural income gap. However, we wanted to determine how these policies play such a role, i.e., the mechanism through which this is achieved. This required in-depth discussion.
According to the study hypotheses in Section 2.2.5 and the mediation effect analysis method in Section 2.2.4, we obtained the estimation results of various assumptions, which are shown in Table 7.
The results in Table 7 show that Hypothesis 3 is supported, whereas Hypotheses 4 and 5 are not. In Hypothesis 3, the results of (7) and (8) both pass the significance test at the 1% level, and the estimated results using (9), ln finance, pass the significance test at the 1% level, indicating that the implementation of the targeted poverty-alleviation policy has substantially increased investment by the state and Yunnan province in the public finance of deeply poverty-stricken counties, thus promoting faster increases in the disposable income of rural residents. The analysis of Hypothesis 3 shows that the targeted poverty-alleviation policy has led to rapid increases in the disposable income of rural residents through considerable increases in the investment of the state and Yunnan province in the public finance of deeply poverty-stricken counties. The analysis results of Hypothesis 1 show that the targeted poverty-alleviation policy further reduced confirmed the urban–rural income gap by increasing farmers’ incomes. The policy has promoted the increase in farmers’ incomes and has substantially increased the amount of local financial expenditure in rural areas. Then, we wanted to determine the existence of a relationship among the implementation of the targeted poverty-alleviation policies, the continuous expenditure of local finance for poverty-alleviation, the increase in farmers’ incomes, and the narrowing of the urban–rural income gap. Therefore, we first constructed the hypothesis, then used the econometric model to verify the hypothesis.
We needed multiple intermediary effect models to verify the hypothesis: the first step was verifying whether the targeted poverty-alleviation policy promoted the increase in rural residents’ disposable incomes through increased fiscal expenditure, and the second step involved verifying whether the increase in fiscal expenditure narrowed the urban–rural income gap by increasing rural residents’ disposable incomes. The first step had already been with Hypothesis 3. Therefore, we further tested whether the increase in fiscal expenditure narrowed the urban–rural income gap by increasing the disposable incomes of rural residents, as shown in Table 7.
Table 7 show that the estimation results of the variable ln income pass the significance test at the 1% level, indicating that the increase in fiscal expenditure reduced the urban–rural income gap by increasing the growth in rural residents’ disposable incomes.
Although the above test results of the mediating effect meet the four conditions of the type (12) mediating effect, we still needed to test the above three mediating effects with the coefficient product method. In addition, we needed to determine the effect of the above three intermediary effects and the sizes of their influences on the total effect (Table 8).
We used Stata software to obtain the results of the Sobel, Aroian, and Goodman tests of the three hypotheses. Overall, the differences in the Z statistics are minimal. All results pass the 1% significance level test, and the test results of the direct and total effects also pass the 1% significance level test, confirming the existence of the intermediary effects of the above three hypotheses. The three hypothetical mediating effects account for 12.05%, 40.36%, and 35.69% of the total effects, respectively. This means that the indirect effect of the targeted poverty-alleviation policy on increasing the per capita disposable incomes of rural residents by increasing local fiscal expenditure accounts for 40.36% of the effect; the indirect effect of the policy on narrowing the urban–rural income gap by increasing farmers’ incomes accounts for 12.05%; and the indirect effect of the increase in local fiscal expenditure on narrowing the urban–rural income gap by promoting the increase in farmers’ incomes accounts for 35.69%.

4. Conclusions and Discussion

In this study, we selected Yunnan province, which contains 88 counties that are nationally considered to be impoverished, as this was the province with largest number of poverty counties in China. We divided its 124 counties (excluding the 5 main urban districts in Kunming, the provincial capital) into four levels, according to their degree of poverty: non-poverty counties and grade-I, grade-II and grade-III poverty counties. We constructed a DID model by changing the settings of the treatment and control groups, and the results pass the parallel trend test.
The results of the DID model show that the targeted poverty-alleviation policy has substantially narrowed the urban–rural income gap in poverty-stricken areas. For areas experiencing deeper poverty, the effect of the targeted poverty-alleviation was stronger than in counties experiencing less poverty, but its impact was still limited. According to our calculations in this study, the implementation of the targeted poverty-alleviation policy further decreased the urban–rural income ratio of grade-I poverty counties by 0.0756 compared with that of non-poverty counties. It has also further decreased the urban–rural income ratio of grade-II poverty counties by 0.0141 compared with that of grade-I poverty counties, and decreased the urban–rural income ratio of grade-III poverty counties by 0.0324 compared with that of grade-II poverty counties. We roughly calculated that the targeted poverty-alleviation policy has further decreased the urban–rural income ratio of the 88 poverty-stricken counties in the province by 0.0972 compared with that of non-poverty counties.
We tested the robustness of the model by excluding the year of the COVID-19 outbreak (2020) and using spatial econometric model estimation. The estimation results show that the model was robust. We found that by taking non-poverty counties, grade-I poverty counties, and grade-II poverty counties as the control group and grade-III poverty counties as the treatment group, the results of the model pass the parallel trend test and the estimation results are unbiased. We selected the spatial error model (SEM) as the optimal model for analysis. The results show that under the influence of other factors, the targeted poverty-alleviation policy decreased the urban–rural income ratio of grade-III poverty counties by 0.0484 compared with that of other counties in Yunnan province, and the estimation results are significant.
Finally, we proposed six hypotheses about the mechanism of action of the policy, and we separately estimated the mediating effects of each hypothesis. The results show that the transmission path of the targeted poverty-alleviation policy was achieved through the high-intensity poverty-alleviation investment of the state and local governments at all levels. The targeted poverty-alleviation policy significantly increased the expenditure intensity of public funds to poverty-stricken counties for rural poverty-alleviation, thereby promoting a steady increase in the income of poor households, which then narrowed the urban–rural income gap.
Through a literature review, we found that few scholars have directly evaluated the effect of targeted poverty-alleviation policies on reducing the urban–rural income gap. Although Zhang et al. (2018) [36], Liu et al. (2020) [37], and Zhang et al. (2021) [38] directly discussed the effect of targeted poverty-alleviation on reducing the urban–rural income gap, their studies had some shortcomings. Given the limitations of the current research results, we selected Yunnan province, which has the most poverty-stricken counties in China, for an empirical study. We divided the 124 counties that we analyzed (excluding the main urban areas) into four categories. We selected the panel data of the urban–rural income gap of each county from 2011 to 2020 and eight influencing factors for difference-in-difference model (DID) analysis. With our study, we have provided contributions in the following aspects:
(1)
In terms of innovation, we further developed the theoretical relationship between the elimination of absolute and relative poverty. Through analysis, we found that the targeted poverty-alleviation policy has substantially reduced the urban–rural income gap while eliminating absolute poverty, which means that the targeted poverty-alleviation policy has further promoted the reduction in and the elimination of relative poverty, which not only provides a useful reference for Yunnan province and even the whole of China to formulate practical and feasible specific strategies for rural revitalization in the future, but also enriches and develops the organic relationship between absolute and relative poverty and provides a reference for China to achieve common prosperity in the future.
(2)
Regarding the analysis method, given the shortcomings in the literature, such as not using appropriate policy evaluation tools, not detailing the annual dynamic changes, and the results not passing the parallel trend test, we adopted a method of poverty classification, and we set different treatment and control groups to pass the parallel trend test. As such, we more-accurately evaluated the effects of targeted poverty-alleviation on narrowing the urban–rural income gap. In addition, we used the full-sample spatial DID model to further explore the effects of the targeted poverty-alleviation policy. Compared with the existing studies, these research methods are innovative and can provide a reference and basis for other related research.
(3)
Regarding the reality in China, we used innovative technical methods, such as poverty classification, to deeply explore the specific effect of a targeted poverty-alleviation policy on narrowing the urban–rural income gap, which produced more accurate, objective, and credible results. In addition, we used the intermediary effect analysis method to deeply explore the mechanism through which the targeted poverty-alleviation policy impacted the urban–rural income gap. This will not only help Yunnan province and even the whole country to consolidate and expand upon the poverty-alleviation achievements and effectively connect the implementation of rural revitalization strategies in the future, but also help to better formulate countermeasures to narrow the urban–rural income gap and gradually achieve the goal of common prosperity.
(4)
Although we focused on Yunnan, China, our findings may be applicable to other countries. Poverty is a major global challenge, and China has embarked on a successful path to eliminating absolute poverty. Although the problem of absolute poverty has been solved, relative-poverty remains a problem, and understanding the effect that China’s targeted poverty-alleviation policy has had on narrowing the urban–rural income gap is also an important topic worthy of worldwide attention. The results of this study can also be a useful reference for other countries and regions when designing countermeasures for the eradication of absolute poverty and the reduction in relative poverty. First, we found that the implementation of the targeted poverty-alleviation policy in Yunnan Province has substantially narrowed the urban–rural income gap, which can provide a reference for other countries to formulate policies to eliminate poverty and narrow the gap between the rich and poor. Second, we discussed the mechanism of the effects of the targeted poverty-alleviation policy in depth. Other developing countries can learn from China’s successful practice of targeted poverty-alleviation, fundamentally solving the problem of inaccurate poverty identification and increasing poverty-alleviation efforts while accurately identifying poor households. Considering the impact of regional differences, other countries can direct their funds toward impoverished regions, set up special poverty-alleviation funds, allocate more human and material resources to eliminate poverty, and narrow the urban–rural income gap. In addition, the results of this study provide a reference for other countries in formulating local poverty-reduction policies and measures according to local conditions.

5. Countermeasures and Suggestions

We found that the targeted poverty-alleviation policy has had a substantial effect on promoting increases in the income of the rural population in poverty-stricken counties, so that these people now meet the national poverty-alleviation standard. The policy has also had a certain effect on narrowing the urban–rural income gap However, this effect has remained limited because during the targeted poverty-alleviation period, absolute poverty was mainly eliminated, and the net increase in the per capita income of the rural poor was not high. Simultaneously, the income levels of some people who are now out of poverty remain low, and the foundation for poverty-alleviation is relatively weak.
According to the survey, at present, some low-income people in rural poverty-alleviation areas are still struggling develop their industries and increase their employment income, and the proportion of policy-oriented transfer income is relatively large. Therefore, after the comprehensive success in alleviating poverty, the continuous consolidation of rural poverty-alleviation achievements must be promoted during the 14th Five-Year Plan, which is a major realistic aim for China’s antipoverty goals. To this end, investment in assistance must be increased. We must always prioritize lifting farmers out of poverty and increasing their income. We should make policy adjustments (but not adjust the promoting of the acceleration of income growth of farmers) and undertake actions to lift people out of poverty to increase their income.
First, we must earnestly and deeply study the situation in special counties, formulate overall plans, accurately implement policies, scientifically formulate an appropriate measurement system for increasing farmers’ incomes, and promote the rapid increase in people’s incomes to life them out of poverty.
Second, based on the specific county condition, industry, and employment situations, and with the goals of industrial prosperity and the transfer of employment as the starting point, we should continue to promote the “two industries” [5] assistance work.
Finally, we should focus on strengthening the establishment of the long-term mechanisms of linking agriculture with characteristic industries and of employment assistance and effectively help farmers out of poverty by continuing to increase their income, so as to promote the effective implementation of the Rural Revitalization Strategy to lift areas out of poverty and further narrow the relative urban–rural income gap.

Author Contributions

Conceptualization, R.Y. and Z.Y.; methodology, R.Y.; software, R.Y.; validation, C.Z. and Z.Y.; formal analysis, R.Y.; investigation, R.Y.; resources, R.Y.; data curation, R.Y.; writing—original draft preparation, Q.W. and R.Y.; writing—review and editing, R.Y.; visualization, Q.W.; supervision, R.Y.; project administration, C.Z. and Z.Y.; funding acquisition, C.Z. and Z.Y. All authors have read and agreed to the published version of the manuscript.

Funding

This study was funded by the National Natural Science Foundation of China (41261018), the National Natural Science Foundation of China (71673182), and the Major Projects of National Social Science Foundation of China (18VSJ023).

Institutional Review Board Statement

Not applicable.

Informed Consent Statement

Not applicable.

Data Availability Statement

Not applicable.

Conflicts of Interest

The authors declare no conflict of interest.

References

  1. Molero-Simarro, R. Inequality in China revisited. The effect of functional distribution of income on urban top incomes, the urban–rural gap and the Gini index, 1978–2015. China Econ. Rev. 2017, 42, 101–117. [Google Scholar] [CrossRef]
  2. Zhao, H.; Zheng, X.; Yang, L. Does Digital Inclusive Finance Narrow the Urban–rural Income Gap through Primary Distribution and Redistribution? Sustainability 2022, 14, 2120. [Google Scholar] [CrossRef]
  3. Ma, X.; Wang, F.; Chen, J.; Zhang, Y. The income gap between urban and rural residents in China: Since 1978. Comput. Econ. 2018, 52, 1153–1174. [Google Scholar] [CrossRef]
  4. Miu, X.; Wang, T.; Gao, Y. The effect of fiscal transfer on the gap between urban–rural public services based on a grouping comparison of different economic catching-up provinces. Econ. Res. J. 2017, 52, 52–66. [Google Scholar]
  5. Xi, J. To Win the Great Victory of Socialism with Chinese Characteristics in the New Era by Building a Well-Off Society in an All-Round Way: A Report at the Nineteenth National Congress of the Communist Party of China; People’s Publishing House: Beijing, China, 2017. [Google Scholar]
  6. Xinhua News Agency. Premier Li Keqiang Attended the Press Conference and Answered Questions from Chinese and Foreign Journalists. Available online: http://www.gov.cn/premier/2020-05/29/content_5515798.htm#allContent (accessed on 29 May 2020).
  7. Sicular, T.; Yue, X.; Gustafsson, B.; Li, S. The Urban–rural Income Gap and Inequality in China. Rev. Income Wealth 2007, 53, 93–126. [Google Scholar] [CrossRef] [Green Version]
  8. National Bureau of Statistics of China. China Statistical Yearbook-2021; China Statistics Press: Beijing, China, 2021. [Google Scholar]
  9. Zhang, Y.; Chai, D. Relationship between urban–rural income gap and urbanization. Popul. Res. 2018, 42, 61–73. [Google Scholar]
  10. Zhang, Y.; Wan, H. Determinants and Forecast on the Urban–rural Household Income Gap in China. J. Quant. Tech. Econ. 2019, 36, 59–75. [Google Scholar]
  11. Colin, C. Conditions of Economic Progress; Macmillan: London, UK, 1940. [Google Scholar]
  12. David, R. The Principles of Political Economy and Taxation; Dover Publications: New York, NY, USA, 2004. [Google Scholar]
  13. Kuznets, S. Economic growth and income inequality. Am. Econ. Rev. 1955, 45, 42–48. [Google Scholar]
  14. Ahiuwalia, M. Inequality, poverty and development. J. Dev. Econ. 1976, 3, 307–342. [Google Scholar] [CrossRef]
  15. Anand, S.; Kanbur, S.M.R. Inequality and development: A critique. J. Dev. Econ. 1993, 41, 19–43. [Google Scholar] [CrossRef]
  16. T Tunali, C.B.; Yilanci, V. Are per papita incomes of MENA countries converging or diverging? Stat. Mech. Appl. 2010, 21, 4855–4862. [Google Scholar] [CrossRef]
  17. Deininger, K.; Squire, L. New ways of looking at old issues: Inequality and growth. J. Dev. Econ. 1998, 57, 259–287. [Google Scholar] [CrossRef]
  18. Piketty, T. The dynamics of the wealth distribution and the interest rate with credit rationing. Rev. Econ. Stud. 1997, 64, 173–189. [Google Scholar] [CrossRef] [Green Version]
  19. Li, S.; Luo, C. Re-estimating the income gap between urban and rural households in China. J. Peking Univ. Philos. Soc. Sci. 2007, 44, 111–120. [Google Scholar]
  20. Wan, H.; Li, S. The effects of household registration system discrimination on urban–rural income inequality in China. Econ. Res. J. 2013, 48, 43–55. [Google Scholar]
  21. Forbes, K.J. A reassessment of the relationship between inequality and growth. Am. Econ. Rev. 2000, 90, 869–887. [Google Scholar] [CrossRef]
  22. Castello, A.; Domenech, R. Human capital inequality and economic growth: Some new evidence. Econ. J. 2002, 112, 187–200. [Google Scholar] [CrossRef]
  23. Chen, B.; Lin, Y. Development strategy, urbanization and the urban–rural income gap in China. Soc. Sci. China 2013, 81–102, 206. [Google Scholar]
  24. Knowles, S. Inequality and economic growth: The empirical relationship reconsidered in the light of comparable data. J. Dev. Stud. 2005, 41, 135–159. [Google Scholar] [CrossRef] [Green Version]
  25. Ding, Z.; Zhang, G.; Wang, F. Spatial-temporal differentiation of urban–rural income in Central Plains Region at different scales. Geogr. Res. 2015, 34, 131–148. [Google Scholar]
  26. Sun, X.; Xu, Y.; Liu, Y. Residents’ income disparity and spatial difference in China. Econ. Geogr. 2015, 35, 18–25+42. [Google Scholar]
  27. Fang, D.; Guo, Y. Rural Land Circulation, Capital Organic Composition and Urban–rural Income Gap—Based on the Experience and Empirical Evidence of Marxist Political Economy. Economist 2020, 11, 107–115. [Google Scholar]
  28. Yang, Z.; Yang, R.; Liu, F. Spatio-temporal evolution and influencing factors of urban–rural income gap in Yunnan province based on poverty classification. Geogr. Res. 2021, 40, 2252–2271. [Google Scholar]
  29. Guo, J. Analysis on the Effect of Agricultural Industrialization on Increasing Farmers’ Income: A Case Study of Shanxi Province. Chin. Rural. Econ. 2008, 24, 8–17. [Google Scholar]
  30. Liu, Z.; Wang, J.; Wang, L. An analysis of farmers’ income increase effect through Targeted Poverty Alleviation policies. J. Lanzhou Univ. (Soc. Sci.) 2018, 46, 63–72. [Google Scholar]
  31. Zhao, Z.; Hou, Y.; Wen, Y. Research on the impact of precision poverty alleviation projects on the income of rural residents: Based on the Propensity Score Match method. Stat. Inf. Forum 2018, 33, 104–110. [Google Scholar]
  32. Cai, J.; Yu, Y.; Qiu, J. Evaluation on effect of national accurate poverty alleviation policy on rural poor households: Based on Difference-In-Difference Model. Hum. Geogr. 2019, 34, 90–96. [Google Scholar]
  33. Dai, X.; Wang, L.; Ren, Y. The Effects of China’s Targeted Poverty Alleviation Policy on the Health and Health Equity of Rural Poor Residents: Evidence from Shaanxi Province. Healthcare 2020, 8, 256. [Google Scholar] [CrossRef]
  34. Li, F.; Zhang, Y.; Zheng, X. Impact of Targeted Poverty Alleviation: Micro Tracking Data of Poor Populations. Econ. Res. J. 2020, 55, 171–187. [Google Scholar]
  35. Huang, W.; Zhu, W. Multidimensional Evaluation of the Consolidation and Expansion of Targeted Poverty Alleviation: An Empirical Analysis of Poverty Alleviation Practice in B city of G Province in China. J. Manag. World 2021, 37, 111–128. [Google Scholar]
  36. Zhang, S.; Liu, J. Is the Targeted Poverty-Relief Policy Narrowing the Income Gap between the Urban and RuralAreas?—An Empirical Study Based on Spatial Panel Data. J. Xinjiang Univ. 2018, 46, 1–9. [Google Scholar]
  37. Liu, M.; Li, J.; Li, Q. Impact of targeted poverty alleviation on the urban–rural household income gap—A case study of shanxi province. Chin. J. Agric. Resour. Reg. Plan. 2020, 41, 228–237. [Google Scholar]
  38. Zhang, B.; Cao, X. Impact of Targeted Poverty Alleviation policy on the urban–rural income gap in national poverty-stricken counties. Resour. Sci. 2021, 43, 1549–1561. [Google Scholar] [CrossRef]
  39. Yang, Z.; Liu, Z.; Lama, X.; Xiong, R.; Zhao, X. The Poverty Alleviation Model of Kunming Municipal Rural Areas in the Context of World Poverty Reduction; Social Sciences Academic Press: Beijing, China, 2020. [Google Scholar]
  40. Wang, S. Targeted Poverty Alleviation: Changing “flood irrigation” to “drip irrigation”. Party Build. Sichuan (Rural. Ed.) 2014, 4, 16–17. [Google Scholar]
  41. Xi, J. Speech at the Central Conference on Poverty Alleviation and Development. In Research Institute of CPC Central Committee History and documents. A Selection of Important Documents since the 18th National Congress of CPC (II); Central Literature Publishing House: Beijing, China, 2018. [Google Scholar]
  42. Xi, J. Speech at a National Conference to Review the Fight against Poverty and Commend Individuals and Groups Involved. People’s Daily, 26 February 2021. [Google Scholar]
  43. Li, X.; Li, X. Effect of Targeted Poverty Alleviation policies in contiguous poverty-stricken areas. J. Arid. Land Resour. Environ. 2020, 34, 34–42. [Google Scholar]
  44. Outline of the Fourteenth Five Year Plan for National Economic and Social Development and the Long-Term Goals for 2035 of the People’s Republic of China. People’s Daily, 13 March 2021. Available online: https://en.ndrc.gov.cn/policies/202203/P020220315511326748336.pdf(accessed on 14 September 2022).
  45. Sun, X. Does agricultural mechanization narrow the urban–rural income gap? J. Cap. Univ. Econ. Bus. 2021, 23, 81–93. [Google Scholar]
  46. Yao, Y. Difference-In-Difference and Difference-In-Difference-In-Difference models: A brief introduction. J. Transl. Foreign Lit. Econ. 2019, 26, 24–28. [Google Scholar]
  47. Ye, F.; Wang, Y. Introduction and application of Difference-In-Difference model. Chin. J. Health Stat. 2013, 30, 131–134. [Google Scholar]
  48. Ren, A.; Yang, R. Analysis on the Spatial and Temporal Characteristics of the Income Gap between Urban and Rural Areas in China. Success. Mark. 2021, 23, 146–148. [Google Scholar]
  49. Campello, M.; Larrain, M. Enlarging the contracting space: Collateral menus, access to credit, and economic activity. Rev. Financ. Stud. 2016, 29, 349–383. [Google Scholar] [CrossRef]
  50. Vig, V. Access to collateral and corporate debt structure: Evidence from a natural experiment. J. Financ. 2013, 68, 881–928. [Google Scholar] [CrossRef]
  51. Liu, H.; Cao, T. The Economic Impacts of Rollover Restrictions on Enterprises. Econ. Res. J. 2018, 53, 108–121. [Google Scholar]
  52. Qian, X.; Fang, S. Does Reform on Security Interests System Affect Corporate Debt Financing? Evidence from a Natural Experiment in China. Econ. Res. J. 2017, 52, 146–160. [Google Scholar]
  53. State Council Leading Group Office of Poverty Alleviation and Development. Guide Book for Cadres on Framework of Poverty Alleviation and Development in Rural China: 2011–2020; China Financial and Economic Publishing House: Beijing, China, 2012. [Google Scholar]
  54. State Council Leading Group Office of Poverty Alleviation and Development. Note on the Publication of a National List of Districts Divided into Contiguous Areas of Extreme Poverty. Available online: http://www.cpad.gov.cn/art/2012/6/14/art_343_41.html (accessed on 14 June 2012).
  55. Baron, R.M.; Kenny, D.A. The Moderator-Mediator Variable Distinction in Social Psychological Research: Conceptual, Strategic, and Statistical Considerations. J. Personal. Soc. Psychol. 1986, 51, 1173–1182. [Google Scholar] [CrossRef]
  56. Aroian, L.A. The probability function of the product of two normally distributed variables. Ann. Math. Stat. 1947, 18, 265–271. [Google Scholar] [CrossRef]
  57. Goodman, L.A. On the Exact Variance of Products. J. Am. Stat. Assoc. 1960, 55, 708–713. [Google Scholar] [CrossRef]
  58. Sobel, M.E. Asymptotic Confidence Intervals for Indirect Effects in Structural Equation Models. Sociol. Methodol. 1982, 13, 290–312. [Google Scholar] [CrossRef]
  59. Chen, Y.; Wang, B. Application of free software R in regression outlier detection. Stat. Decis. 2005, 21, 24–25. [Google Scholar]
  60. Zhao, J. The Fatal Attacks to the Unit Root Tests from Outlier. J. Bus. Econ. 2009, 29, 76–83. [Google Scholar]
  61. Zhao, J. Typical cases of the impact of outliers on measurement modeling. Stat. Res. 2010, 27, 92–98. [Google Scholar]
  62. Ren, S.; Zheng, J.; Liu, D.; Chen, X. Does Emissions Trading System Improve Firm’s Total Factor Productivity—Evidence from Chinese Listed Companies. China Ind. Econ. 2019, 5, 5–23. [Google Scholar]
  63. Liu, R.; Mao, Y.; Kang, Y. Deregulation, Market Vitality and Tourism Economy Development: Evidence from Chinese Cultural System Reform. Econ. Res. J. 2020, 55, 115–131. [Google Scholar]
  64. Chen, Q. Advanced Econometrics and Stata Applications, 2nd ed.; Higher Education Press: Beijing, China, 2014. [Google Scholar]
Figure 1. (a) The location of Yunnan province in China; (b) the 124 counties in Yunnan province.
Sustainability 14 12560 g001
Figure 2. Average urban–rural income ratio of counties in Yunnan province from 2011 to 2020.
Sustainability 14 12560 g002
Figure 3. Flow chart of the study methods.
Sustainability 14 12560 g003
Figure 4. Results of the parallel trend test: (a) non-poverty counties were the control group, and grade−I poverty counties were the treatment group; (b) grade−I poverty counties were the control group, and grade−II poverty counties were the treatment group; (c) grade−II poverty counties were the control group, and grade treatment III poverty counties were the treatment group; (d) grade−I poverty counties were the control group, and grade−III poverty counties were the treatment group.
Sustainability 14 12560 g004
Figure 5. Results of placebo test: (a) retaining all years and sample 500 times; (b) excluding the year affected by the COVID−19 pandemic (2020) and sampling 500 times.
Sustainability 14 12560 g005
Figure 6. Results of parallel trend test (a) including and (b) excluding the COVID−19 outbreak year; results of placebo test with (c) 500 and (d) 10,000 random samples; (e) results of placebo test excluding the year of COVID−19 outbreak and random sampling 500 times.
Sustainability 14 12560 g006
Table 1. Index system of control variable of urban–rural income gap.
DimensionVariableComputing MethodNameUnit
Industrial developmentDevelopment level of primary industryOutput value of primary industry/conversion index/total populationX1CNY/person
Development level of secondary industryOutput value of secondary industry/conversion index/total populationX2CNY/person
Development level of tertiary industryOutput value of tertiary industry/conversion index/total populationX3CNY/person
Economic levelInvestment in fixed assetsFixed asset investment/total population/conversion indexX4CNY/person
Land economic densityCurrent year GDP/total land area/conversion indexX5CNY 10,000/km2
Economic catch-up pressureHighest per capita GDP of neighboring counties/local per capita GDP × highest per capita GDP of counties in the province/local per capita GDPX6None
Financial expenditure levelPublic budget expenditure/conversion index/total populationX7CNY/person
Population structurePopulation densityTotal population/land area of the county (city, district)X8person/km2
Table 2. Poverty levels of 124 counties in Yunnan province.
Poverty ClassificationMeaning or Division BasisNumber of CountiesDegree of Poverty
Non-poverty countiesAll non-poverty counties in Yunnan province36Shallow
Grade-I poverty countiesA contiguous poverty-stricken area or county, but not a national key county for poverty-alleviation and development or a deeply poverty-stricken county14Medium
Grade-II poverty countiesA national key county for poverty-alleviation and development, but not a deeply poverty-stricken county47Deep
Grade-III poverty countiesAll deeply poverty-stricken counties determined by the Yunnan Poverty-Alleviation and Development Leading Group27Very deep
Table 3. Estimation results of DID of for different treatment and control group settings.
VariableNon-Poverty Counties as Control Group; Grade-I Poverty Counties as Treatment GroupGrade-I Poverty Counties as Control Group; Grade-II Poverty Counties Treatment GroupGrade-II Poverty Counties as Control Group; Grade-III Poverty Counties as Treatment GroupGrade I-Poverty Counties as Control Group; Grade III-Poverty Counties as Treatment Group
(1)(2)(3)(4)(5)(6)(7)(8)
time × treat−0.0939 ***
(0.0242)
−0.0756 ***
(0.0246)
−0.0218
(0.0244)
−0.0141
(0.0244)
−0.0488 *
(0.0263)
−0.0324
(0.0227)
−0.0706 **
(0.0319)
−0.0458
(0.0298)
Control VariableNoYesNoYesNoYesNoYes
Time EffectYesYesYesYesYesYesYesYes
Individual EffectYesYesYesYesYesYesYesYes
Number500500610610740740410410
R20.98250.98410.98610.98730.98600.98750.98710.9886
Note: the brackets in the estimation results are the robust standard errors of individual clustering; *, **, ***, indicating a rejection of the original hypothesis at the significance levels of 10%, 5%, and 1%, respectively; the same applies below.
Table 4. DID estimation results after excluding COVID-19 outbreak year.
VariableNon-Poverty Counties as Control Group; Grade-I Poverty Counties as Treatment GroupGrade-I Poverty Counties as Control Group; Grade-II Poverty Counties as Treatment GroupGrade-II Poverty Counties as Control Group; Grade-III Poverty Counties as Treatment GroupGrade I-Poverty Counties as Control Group; Grade-III Poverty Counties as Treatment Group
(1)(2)(3)(4)(5)(6)(7)(8)
time × treat−0.0905 ***
(0.0242)
−0.0740 ***
(0.0247)
−0.0184
(0.0243)
−0.0109
(0.0245)
−0.0421 *
(0.0250)
−0.0231
(0.0218)
−0.0604 *
(0.0310)
−0.0420
(0.0288)
Control VariableNoYesNoYesNoYesNoYes
Time EffectYesYesYesYesYesYesYesYes
Individual EffectYesYesYesYesYesYesYesYes
Number450450549549666666369369
R20.98170.98390.98600.98710.98660.98800.98780.9893
Note: the brackets in the estimation results are the robust standard errors of individual clustering; *, ***, indicating a rejection of the original hypothesis at the significance levels of 10%, 5%, and 1%, respectively; the same applies below.
Table 5. Estimation results of policy effects obtained by using different estimation methods.
VariableTraditional DID ModelCochran–Oster Iteration MethodSpatial Autocorrelation ModelSpatial Autoregressive ModelSpatial Error Model
(1)(2)(3)(4)(5)(6)(7)(8)(9)(10)
time × treat−0.0949 ***
(0.0252)
−0.0687 ***
(0.0263)
−0.0701 ***
(0.0186)
−0.0585 ***
(0.0212)
−0.0473 **
(0.0197)
−0.0457 **
(0.0224)
−0.0697 ***
(0.0204)
−0.0460 **
(0.0203)
−0.0694 ***
(0.0225)
−0.0484 **
(0.0229)
Iteration Parameter ρ 0.54210.5036
Spatial Parameter ρ −0.5773 ***−0.11030.4553 ***0.4419 ***
Spatial Parameter λ 0.7824 ***0.5401 *** 0.4489 ***0.4504 ***
Control VariableNoYesNoYesNoYesNoYesNoYes
Time EffectYesYesYesYesYesYesYesYesYesYes
Individual EffectYesYesYesYesYesYesYesYesYesYes
Number1240124012401240124012401240124012401240
R2/Within R20.98560.98690.99090.99110.90470.91450.91000.91790.90790.9154
Note: Five main urban areas of Kunming were excluded in the estimation process; the brackets in the estimation results are the robust standard errors of individual clustering; **, ***, indicating a rejection of the original hypothesis at the significance levels of 10%, 5%, and 1%, respectively; the same applies below.
Table 6. Estimation results of policy effects obtained by using different methods and excluding the COVID-19 outbreak year.
VariableTraditional DID ModelCochran–Oster Iteration MethodSpatial Autocorrelation ModelSpatial Autoregressive ModelSpatial Error Model
(1)(2)(3)(4)(5)(6)(7)(8)(9)(10)
time × treat−0.0851 ***
(0.0240)
−0.0645 ***
(0.0244)
−0.0673 ***
(0.0189)
−0.0552 ***
(0.0211)
−0.0577 ***
(0.0207)
−0.0480 **
(0.0224)
−0.0641 ***
(0.0197)
−0.0452 **
(0.0194)
−0.0639 ***
(0.0217)
−0.0473 **
(0.0224)
Iteration Parameter ρ 0.48150.4465
Spatial Parameter ρ −0.1942 ***0.03440.4257 ***0.4066 ***
Spatial Parameter λ 0.5647 ***0.3747 *** 0.4179 ***0.4078 ***
Control VariableNoYesNoYesNoYesNoYesNoYes
Time EffectYesYesYesYesYesYesYesYesYesYes
Individual EffectYesYesYesYesYesYesYesYesYesYes
Number1116111611161116111611161116111611161116
R2/Within R20.98620.98740.99100.99120.89420.90410.89740.90670.89540.9038
Note: Five main urban areas of Kunming were excluded in the estimation process; the brackets in the estimation results are the robust standard errors of individual clustering; **, ***, indicating a rejection of the original hypothesis at the significance levels of 10%, 5%, and 1%, respectively; the same applies below.
Table 7. Intermediary effect test of every hypothesis.
VariableHypothesis 1Hypothesis 2Hypothesis 3
ln income
(1)
gap
(2)
gap
(3)
ln light
(4)
gap
(5)
gap
(6)
finance
(7)
ln income
(8)
ln income
(9)
time × treat0.0372 * −0.0702 **−0.0627 −0.0788 ***650.55 *** 0.0222
ln income −0.2930 ***−0.2584 **
ln light 0.0206 *0.0178
finance 0.00002 ***0.00002 ***
Control VariableYesYesYesYesYesYesYesYesYes
Time EffectYesYesYesYesYesYesYesYesYes
Individual EffectYesYesYesYesYesYesYesYesYes
Number124012401240124012401240124012401240
R20.95730.98650.98720.95690.98580.98660.91330.96000.9602
VariableHypothesis 4Hypothesis 5Hypothesis 6
work
(10)
ln income
(11)
ln income
(12)
ln industry
(13)
ln income
(14)
ln income
(15)
ln income
(16)
gap
(17)
gap
(18)
time × treat2.9797 *** 0.0399 *0.0404 * 0.0366
work −0.0004−0.0002
ln industry 0.02390.0158
finance 0.00003 *** −0.00001
ln income −0.2930 ***−0.2563 ***
Control VariableYesYesYesYesYesYesYesYesYes
Time EffectYesYesYesYesYesYesYesYesYes
Individual EffectYesYesYesYesYesYesYesYesYes
Number110611061106124012401240124012401240
R20.54960.96060.96150.98850.95660.95730.96000.98650.9867
Note: To save space, the estimation results of standard error are not reported. The above results exclude the five main urban areas of Kunming, and grade−III poverty counties were taken as the treatment group and the rest as the control group; *, **, ***, indicating a rejection of the original hypothesis at the significance levels of 10%, 5%, and 1%, respectively; the applies same below.
Table 8. Results of tests of the coefficient product method of the intermediary effect and the calculated results of the intermediary effect.
Inspection Items and Intermediary EffectHypothesis 1 (ln income is Intermediary Variable)Hypothesis 3 (finance is Intermediary Variable)Hypothesis 6 (ln income is Intermediary variable)
Indirect effect (according to Sobel test)−0.0096 (−3.871) ***0.0150 (5.517) ***−6.3 × 10⁻⁶ (5.692) ***
Indirect effect (according to Aroian test)−0.0096 (−3.846) ***0.0150 (5.496) ***−6.3 × 10⁻⁶ (5.672) ***
Indirect effect (according to Goodman test)−0.0096 (−3.897) ***0.0150 (5.539) ***−6.3 × 10⁻⁶ (5.712) ***
Direct effect (according to Sobel test)−0.0702 (−7.349) ***0.0222 (2.741) ***−1.1 × 10⁻⁵ (3.562) ***
Total effect (according to Sobel test)−0.0799 (−8.233) ***0.0372 (4.534) ***−1.8 × 10⁻⁵ (5.651) ***
Proportion of intermediary effect (%)12.0540.3635.69
Note: Estimated results of Z statistics are provided in parentheses; ***, indicating a rejection of the original hypothesis at the significance levels of 10%, 5%, and 1%, respectively.
Publisher’s Note: MDPI stays neutral with regard to jurisdictional claims in published maps and institutional affiliations.

