Abstract
The Automatic Identification System (AIS) is a kind of navigation equipment that exchanges a wealth of essential information among vessels and between ships to shore through Very High Frequency. Currently, identification and other navigational information can be obtained in real time with AIS data integrated into other shipborne systems, such as the Electronic Chart Display and Information System and radar. However, at present, AIS information is represented in a two-dimensional (2D) way, which is not the same as the three-dimensional (3D) world people perceive visually. In this paper, we introduce RedNavi, a sustainable computer 3D scene building system that visualizes the current sea, specifically the environment and traffic conditions around the ownship, using received AIS data. RedNavi has a wide range of application scenarios. Applying to the maritime education and training field, it can serve as a bridge between the 2D and 3D worlds, helping less experienced trainees build up their capabilities. Applying to actual navigation, it can provide the deck officer with another visual aid to their lookout in addition to existing 2D information systems. In addition, given the microservices architecture RedNavi adopts, the development, deployment, and maintenance processes become relatively lighter, faster, and easier, and therefore more sustainable than traditional monolithic systems.
1. Introduction
Humankind has been engaged in seafaring for hundreds and thousands of years. Since the 1970s, traditional nautical paper charts have evolved into digital, electronic formats and expanded beyond their domain [1]. Since Ford [2] proposed the first three-dimensional (3D) nautical chart in 1994, the pursuit of three-dimensional maritime sciences and navigation safety has never stopped. For example, Gold et al. [3] developed a 3D system prototype, “Pilot Book”, for port-wide applications to help ships entering the port of Hong Kong and continued researching and developing the system [4]. Similar studies were done by Ternes et al. [5] to develop a 3D chart representation system for hydrographic surveying based on the user survey results, and by Liu et al. [6,7], etc. These studies all aimed to combine primary geographic information system (GIS) concepts with 3D modeling and are more oriented toward the presentation of electronic chart data and do not include real-time information such as other vessels’ moving on the sea.
In order to obtain information about the movement of other ships, we look to the automatic identification system (AIS). AIS is a maritime communication system that exchanges ship identification and other navigational information utilizing the marine very high frequency (VHF) radio and the self-organizing time division multiple access (SOTDMA) transmission protocol [8,9,10]. AIS sends data independently and constantly to other ships and facilities with receivers within a reasonable communication range. These data include precise dynamic information directly from various shipborne sensors and other static and voyage-related data manually input by ship officers [8,9,11]. Therefore, it is considered a significant improvement over traditional passive systems such as radar [12], which provides the motion parameters of the targets by calculating and analyzing the electromagnetic waves passively reflected from them. According to the International Maritime Organization (IMO), AIS’s aims include assisting in ship identification, target tracking, search and rescue operations, information sharing simplification, and giving extra information to aid situational awareness [8]. Since its inception in the 1990s, AIS has been under constant improvement [12] and currently is obligatory equipment for all ships of 300 gross tonnages (GT) or more engaged in international voyages, all ships of 500 GT or more not engaged in international voyages, and all passenger ships regardless of dimension by the International Convention for the Safety of Life at Sea (SOLAS) [13].
Although AIS provides a wealth of navigational information, people rarely use AIS equipment alone. As shown in Figure 1a, the AIS device itself has only the minimal information presentation capability provided by its minimum keyboard display (MKD) unit, which can only display information in a one-dimensional (1D) list via plain text or, in some models, relative positions via low-pixel graphics in a two-dimensional (2D) form. Therefore, in nautical practice, people use AIS in combination with other shipboard navigation equipment, such as traditional radar, as shown in Figure 1b, or the modern Electronic Chart Display and Information System (ECDIS), as shown in Figure 1c.
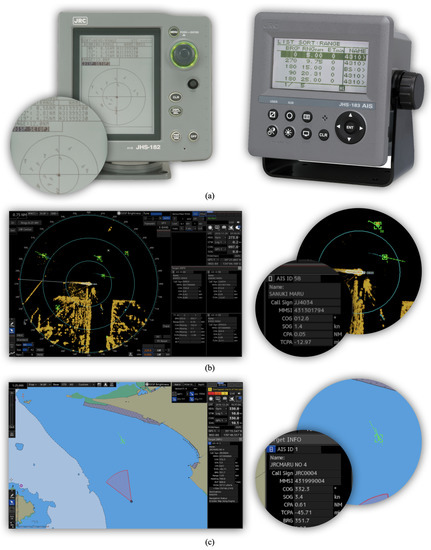
Figure 1.
Equipmentusing AIS data on board: (a) AIS devices with only minimum keyboard display, (b) shipboard radar image with AIS data integrated, and (c) Electronic Chart Display and Information System with AIS data integrated.
However, whether a radar image or an electronic chart, the information presented is 2D. Although correlating those 2D representations on display to the realistic 3D view is not difficult for experienced ship officers, for novices, this ability usually needs to be developed over time at work. In this case, a 3D system may serve as a bridge to help the less experienced seafarers quickly develop the relevant skills.
Compared to planar graphics, 3D models are more visually efficient, simpler to interpret, can represent more detailed information as an additional source of information, and have the potential to significantly increase users’ awareness of their surroundings as well as cognition of the items they describe [7]. Therefore, solutions for introducing 3D vision models are constantly being explored in various domains, from humanities and arts [14], public health [15], and MET. For example, Mallam et al. [16] believe that the adoption and integration of 3D and other immersive technologies into maritime education, training, and operations open up new opportunities and paradigms in the industry. Regarding the actual system development, it has also been explored by many researchers. For example, Cwilewicz et al. [17] developed a 3D engine room simulator and concluded that the gap between operating maritime equipment in simulation and in real-life is narrowed thanks to 3D visualization. Markopoulos et al. [18] developed a steering simulator system, MarSEVR, based on virtual reality (VR) technology, which explores the use of new technologies for trainees to operate in special or unexpected situations, such as abnormalities and accidents, in addition to the regular navigating. However, this system has only several pre-programmed scenarios for training.
Almost all of the studies noted above conclude that 3D representation holds great promise for use in various related fields. Therefore, inspired by those studies and combined with the characteristics of AIS data, we designed and developed RedNavi, a 3D information system which can construct computer 3D scenes on the screen to reflect the environment and traffic based on the information of the ownship and the AIS data received from other ships.
AIS information is represented in a 2D form in navigational practice, and ship officers need to develop their ability to correlate this 2D information to actual scenarios in the long term working practice. With RedNavi being introduced, it will become possible to generate 3D scenes based on AIS data during training, making it possible to develop such abilities for students and trainees before being onboard. Compared to live-ship training or introducing expensive sailing simulators, the cost of RedNavi is almost negligible. Moreover, as RedNavi-generated 3D scenes are data-driven, they do not receive interference from other factors such as weather conditions. Therefore, during the testing phase, we also tried to deploy RedNavi on a live ship rather than just on land to explore if there are more application scenarios. For example, even sailing in poor visibility conditions (e.g., night or fog navigation), users can still get a clear computer 3D scene from RedNavi, which will give the officer a reference for handling the vessel. (Due to the limitations of AIS and other data considerations, such a system can only be used as a reference and can never replace a regular lookout or any necessary means of detection.) Additionally, RedNavi is lighter and more efficient in terms of development, deployment, and maintenance processes due to the microservices architecture we selected during the design phase, making it more sustainable than a typical monolithic architecture-styled system.
The rest of this paper is organized as follows: Section 2 explains the design of RedNavi. Section 3 details the implementation of RedNavi. Section 4 deploys RedNavi, gives the discussion on the test results, and outlines the main directions for future work. Section 5 summarizes and presents the conclusions.
2. System Design
As in our previous research [19], unlike traditional systems that concentrate all functional modules in a single entity, RedNavi also uses a microservices architecture. Microservices architecture is a software architecture that approaches the modularization notion by using finely grained services that can be changed, deployed, and released independently, and contrasts with a traditional monolithic architecture that wraps all business logic in one piece and can only be deployed as a single item [20,21]. In other words, the system is designed to be partitioned into microservices by functional distinctions. Specifically, the entire RedNavi system consists of a front-end application and a series of back-end microservices. The core function of the front-end app is designed for rendering 3D scenes based on AIS information and interacting with users, whereas the back-end microservices provide a series of support from receiving data from AIS devices to parsing, storing, querying, packaging, and returning the data. Microservices communicate with each other through messages or Application Programming Interfaces (APIs).
Figure 2 shows the design architecture of RedNavi. The Data Service (Receiver) is responsible for receiving and parsing the received AIS data forwarded by the shipborne AIS equipment and sending the parsed results to the database; the Data Service (Provider) is responsible for sending data query requests to the database on demand and formatting the results and returning them to the end-user; the API service (Gateway) is responsible for processing and distributing user requests to the respective microservices, and returning their responses to the user; the App Service (Renderer) is responsible for providing the user with the application, the 3D model, and all the interaction interfaces; and the database is responsible for storing the parsed AIS data and querying and returning the data upon receipt of a query request from the Provider.
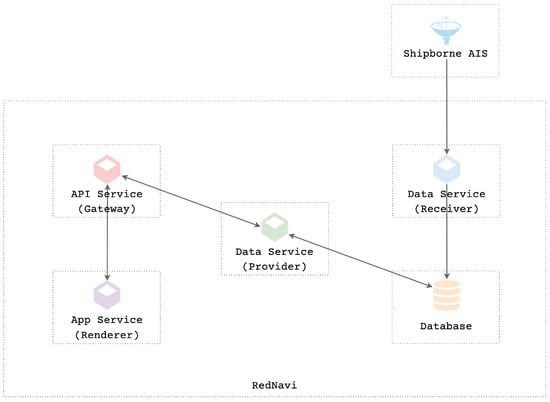
Figure 2.
Design diagram of RedNavi system using microservices architecture.
Except for the communication between the shipborne AIS and the Receiver using messages (which does not need direct two-way communication), the rest of the microservices and the database communicate with each other through APIs. As shown in Figure 3, while the Receiver continuously receives data from AIS equipment, parses the data and inserts them into the database, the user gets the application and interacts with the system through the Gateway. When the Gateway receives a request from the user to establish a connection, it forwards the request to the Renderer, which returns the application to the user, and the application starts running on the user’s device. When the 3D models are loaded, and the application is ready, it automatically sends a data request to the Gateway, which then forwards the request to the Provider responsible for querying and providing the parsed AIS data. The Provider then sends a query request to the database, reorganizes the results into the agreed format, and returns them to the application. After getting all the information, the application can start computing and scene rendering. The data flow between the microservices and the database is shown in Figure 4. Data transmissions, requests, and responses are marked using correspondingly colored arrows.
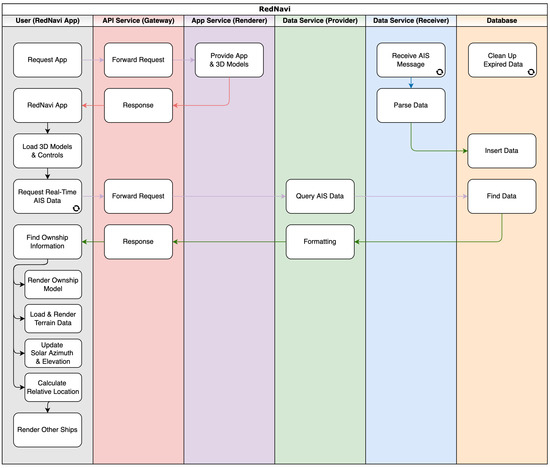
Figure 3.
Workflow diagram of RedNavi system.
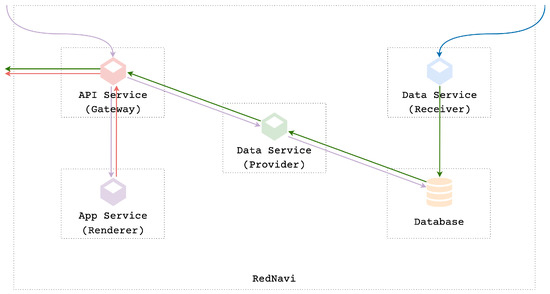
Figure 4.
Data flow diagram of RedNavi system.
3. Implementation
Based on the microservices architecture, each part of RedNavi was developed and implemented separately.
3.1. Data Service (Receiver)
In the system, the Receiver microservice is connected to the shipborne navigational instruments (global positioning system (GPS), AIS, gyrocompass, echo sounder, etc.) through a wired or wireless shipboard local area network (LAN). The NMEA 0183 format, a combined electrical and data protocol for communication between marine electronics that was created and is maintained by the National Marine Electronics Association (NMEA), is used by these navigational instruments to broadcast their data [22]. This paper focuses on NMEA 0183 formatted AIS data, as shown by the blue arrow in Figure 2. If necessary, the data acquisition process of other navigational instruments is more or less the same.
An NMEA 0183 formatted AIS message is structured as
Here, the reserved characters and their uses are shown in Table 1, and the meanings of the remaining parts represented using letters A through I are shown in Table 2.

Table 1.
Reserved characters of NMEA 0183 format messages and their uses.

Table 2.
Meaning of each part in the AIS message example.
For example, a piece of a typical AIS message may be as follows:
Message (2) shows a piece of encapsulated NMEA 0183 message transmitted by AIS equipment on board another vessel.
Messages received by the shipborne AIS equipment are encapsulated into complete data or fragments (sentences) thereof. Therefore, it is necessary to parse and pre-process the messages as they are received and before they are provided to the database and other microservices.
Depending on the message type, dynamic, static, and voyage-related information is encapsulated in the g-g part of the message (1). Therefore, this part of the data needs to be parsed first. The method is to reduce the ASCII characters in the g-g field one by one to 6-bit binary code according to the relevant encoding rules in Recommendation R-REC-M.1371; after judging the message type, the remaining binary codes are then grouped correspondingly and converted to decimal numbers to obtain the specific data values. In particular, if a complete message is divided into multiple sentences broadcast (common in message type 5, static information), it is necessary to wait until all sentences are received and then perform the parsing work by splicing the g-g part according to the sentence sequential number (part d in message (1)).
Figure 5 illustrates the AIS data decoding process of example message (2) of an AIS ship position report (message type 3, dynamic information). With 28 ASCII characters reduced to a total of 168 bits and divided into 16 sections, bit groups are indicated along with the AIS data items they represent within the message. Moreover, Figure 5 also shows the explanation of the information they contain.
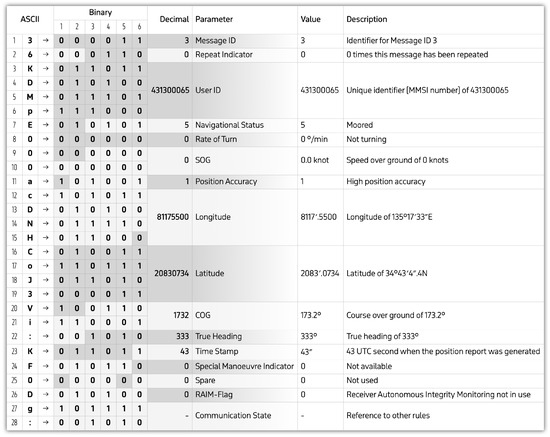
Figure 5.
AIS message decoding process.
3.2. Database
AIS messages currently contain 27 message types [23], among which there are about 8 types of messages that are relevant to the problem studied in this paper. Each of these types of messages has its own unique structure containing its own unique information, except for Messages 1, 2, and 3, which have the same schema. Figure 6 shows the typical structure of Messages 1, 2, 3, 5, and 24. There are also structural differences between Messages 5 and 24, even though they are also static messages.
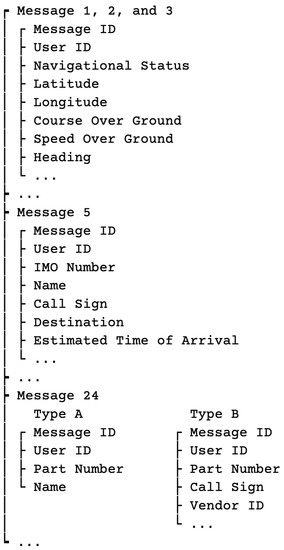
Figure 6.
Typical structure of AIS messages 1, 2, 3, 5, and 24.
In addition, AIS messages are updated in real time, and each message is updated at different frequencies as required by the rules. In addition, the quality of the messages themselves is not strictly guaranteed by the actual situation. Therefore, AIS data are considered “unstructured” data in this paper. Moreover, the location and other data of “moving objects” such as ships will grow rapidly and dynamically with time, and there is almost no upper limit to the amount of AIS data if we consider the storage of historical data instead of only real-time data.
Therefore, in this paper, a NoSQL database, MongoDB, with advantages in terms of flexibility, scalability, etc., over the traditional SQL database [24], is chosen to store the unstructured data of AIS.
Because MongoDB has a time to live (TTL) mechanism that can limit the lifespan or lifetime of data stored, ensuring that the AIS data in the database are real time does not require any additional operations, other than setting an appropriate TTL for the entire dataset (for RedNavi’s database, dynamic data and static data are stored and sent separately due to the different characteristics of the respective AIS message type, including the broadcast time interval) and adding a field to record the updated time for each document (entry) during the data inserting process.
3.3. Data Service (Provider)
The function of the Provider is to interface between user requests and the database. After receiving a request from the user, the Provider analyzes the request and queries the database based on it. After receiving the results from the database, the Provider formats the results into GeoJSON format, a geospatial data interchange format based on JavaScript Object Notation (JSON), which is a language-independent open standard file format and data interexchange format to store and transfer data objects [25,26] and return them to the user.
As shown in Figure 7, data returned from the database are formatted by the Provider to the GeoJSON format as an object of type “FeatureCollection”. This object contains a list of “Feature” objects. Each “Feature” object represents a record of AIS data and contains three attributes—“type”, “geometry”, and “properties”. The attribute “geometry” is used to store the geographic coordinates of the data (in the order of [longitude, latitude]), and “properties” is used to store other properties, including ship’s identification number, navigation status, etc., as defined in the AIS specification.
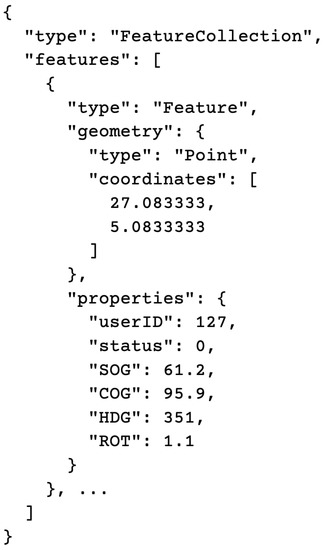
Figure 7.
GeoJSON format.
In this way, the application can start the calculation and scene update after receiving the AIS data back from the Provider.
3.4. RedNavi App
The RedNavi application is designed to be able to be run on almost any existing platform—from computers with keyboards and mice to tablets or smartphones with only a touch screen as the input source, and no matter what operating system they are equipped with, as long as they support any modern browser—Safari, Chrome, Firefox, etc.
RedNavi App is developed using Angular framework with Three.js library based on WebGL for 3D computer graphics. Specifically, the user interface of the whole application consists of a menu bar and a 3D engine area. The menu bar displays the title of the application and provides access to various functions through a settings button, while the 3D engine area is mainly responsible for displaying 3D scenes and various auxiliary information.
The 3D engine is the most critical part of the RedNavi App. In order to create 3D scenes closer to reality, we referred to the sample code from the Three.js library (under the MIT License) [27]. Figure 8 shows the process of simulating the environment using Three.js. First, a cube (called the skybox) is created as the simulation space for the whole scene, as shown in Figure 8a. At this point, the scene is without any ambient light; therefore, a light source, the sun, shown in Figure 8b, needs to be added. After that, a plane inside the skybox is created as the seaplane and the water texture effect is added to it, as shown in Figure 8c. Finally, the virtual camera is placed in an appropriate position, and the scene is shown in Figure 8d.
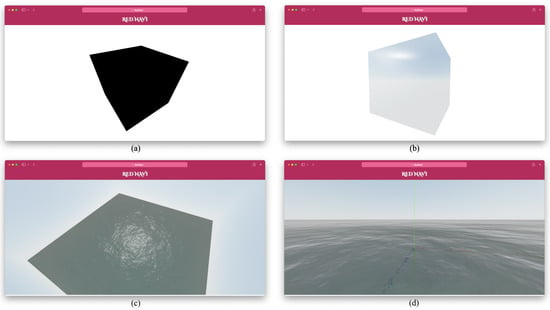
Figure 8.
Process of simulating the environment: (a) creating a skybox, (b) adding the light source, (c) creating the sea plane, and (d) setting camera to an appropriate position.
In addition, RedNavi’s 3D scenes are designed to be centered on the ownship. Therefore, as shown in Figure 3, the 3D engine starts rendering the ownship model, fetching and rendering the terrain, calculating the relative location, and rendering models of other ships after obtaining the ownship’s information from the API service. The ownship 3D models are modeled by IgYerm [28] and Malte Ullrich [29] under the Royalty Free License and the Editorial License, respectively, and the terrain data is provided by Mapbox [30]. Figure 9 explains the process.
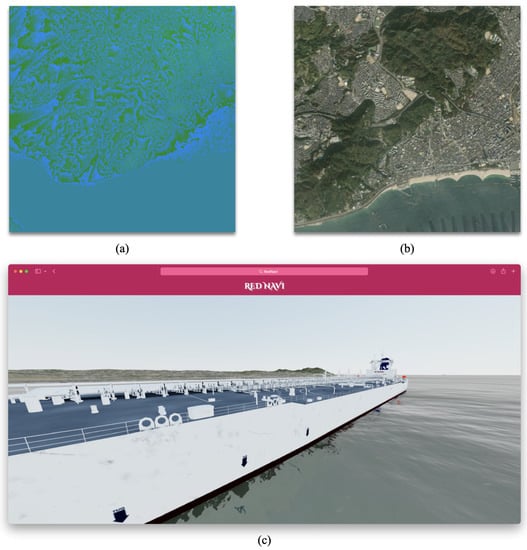
Figure 9.
Process of rendering models: (a) fetched terrain data (partial), (b) fetched satellite image data (partial), and (c) scene with 3D models rendered.
4. Results and Discussion
For different usage scenarios of RedNavi, we conducted separate tests on land and on a live ship. Due to the features of microservices architecture, each of RedNavi’s services can be deployed separately and collaborated remotely. For the land-based test, we set up the AIS receiver and the Receiver data service at the Graduate School of Maritime Sciences, Kobe University, where we could receive data broadcast from AIS-equipped ships located in Osaka Bay. To increase the scope and capacity of RedNavi’s services, we deployed the database and other microservices on dedicated servers located in Tokyo, and communication was conducted over the Internet. Results of the land test are shown in Figure 10.
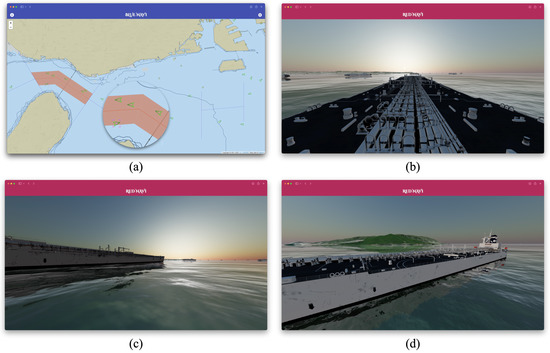
Figure 10.
Land test: (a) current sea conditions displayed on the 2D system BlueNavi, (b) simulated first person perspective (from the ownship’s bridge), (c) simulated third person perspective (from starboard aft side), and (d) simulated third person perspective (from port forward side).
Figure 10a shows our previous study, a 2D maritime information providing system, showing the current encounter situation. Figure 10b–d show the 3D scenes generated by RedNavi. The virtual camera can be freely adjusted in angle to obtain a simulated third-person or first-person view (as seen from the bridge).
The live-ship test was performed on a training craft, Hiyodori, of the Tokyo University of Marine Science and Technology. Details and results of the live-ship test are shown in Figure 11. The test vessel, training craft Hiyodori, looks as shown in Figure 11a,b. For the live-ship test, everything were deployed onboard the craft, as shown in Figure 11c, and the communication was conducted over the shipboard LAN. The photograph of a scene at a certain moment, the representation of the scene in the 2D system, and the 3D scene restored by the RedNavi are shown in Figure 11d–f, respectively.
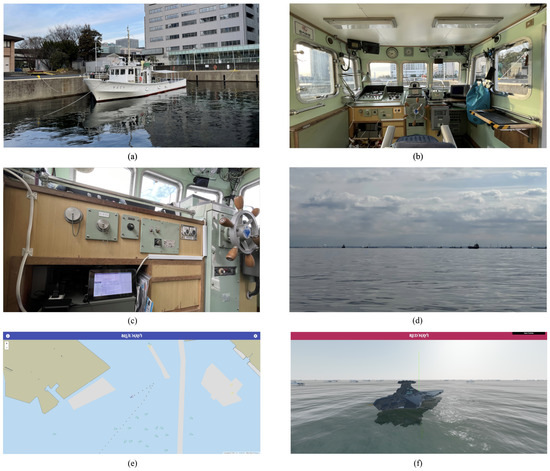
Figure 11.
Live-ship test: (a) test vessel Hiyodori, (b) bridge of Hiyodori, (c) RedNavi running on a Raspberry Pi, (d) photo of the sea (taken from the port side), (e) current sea conditions displayed on the 2D system BlueNavi, and (f) simulated third person perspective (from starboard aft side).
The test results show that the existing RedNavi system can successfully create 3D scenes from received AIS data. According to Figure 3, the current working flow of RedNavi is that all valid information received is sent to the client for rendering. However, such a data provision method may cause a series of problems. For example, when the ship is traveling in a complex sea area (where many ships are around), the large amount of data will cause the task of rendering to increase greatly, so that if the performance of the client is insufficient, it will lead to the problem of lag and non-smoothness of the front-end application. In this case, except for improving the performance of the client (which usually brings a large cost increase), reducing the amount of data according to the demand (for example, only showing vessels within a certain distance from the ownship) would be one of the feasible solutions. In addition, with the expansion of application scenarios and the development of communication means such as VHF Data Exchange System (VDES) [31], the future RedNavi will not be limited to the current application form but will be more widely applied to MET, traffic management, fleet monitoring, assisted intelligent navigation, etc. At that time, the data source of RedNavi will not be limited to a single AIS device (as shown in Figure 12), and the database will also cover a much wider sea area. This also requires changes to the way the client obtains data. Therefore, to address the above issues, the RedNavi workflow was redesigned, as shown in Figure 13, to cope with geographically specific data requests.
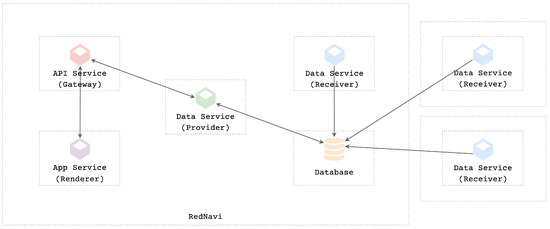
Figure 12.
Design diagram of the redesigned RedNavi system.
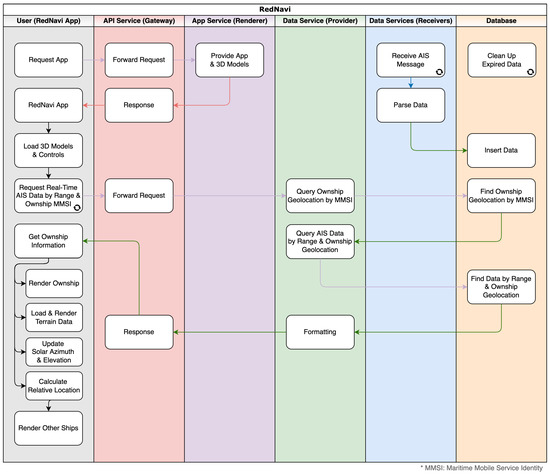
Figure 13.
Workflow diagram of the redesigned RedNavi System.
Another question is about how much reality needs to be fitted to the 3D scenes generated by the RedNavi system. As shown in Figure 6, from the dynamic and static data of the AIS, data such as the position, bow direction (heading), and dimensions of the target ships can be easily obtained. These data are sufficient to help render a 3D model that fits the actual visual dimensions. However, for users, the appearance of the ship model is probably the most intuitive visual information. The most important information that determines the appearance of a ship, the ship type, is not completely contained in the AIS data. (In the current version of RedNavi, also, for this reason, we use only the spacecraft model rather than the real ship model to represent the ownship and other ships.).
Table 3 shows the full range of ship types included in the static information of AIS.

Table 3.
Identifiers to be used by ships to report their type.
As shown in Table 3, the classification of certain types of ships, especially cargo ships, in AIS is not detailed enough. For example, identifiers do not make clear distinctions between bulk carriers, general cargo ships, container ships, ro-ro ships, etc., but only classifies them into cargo ships (identifier number 70 to 79). Therefore, from the AIS data alone, others do not know exactly what kind of ship a cargo ship belongs to and hence extra data sources are needed to be more specific in choosing a 3D model for rendering according to the actual ship type.
5. Conclusions
AIS can actively broadcast navigational dynamic, static, and voyage-related information of the ownship to the surroundings and is a navigation instrument required by the IMO at present. By using this information, the current state of ship traffic on the sea can be analyzed. This study set out to use the received AIS information to build computer 3D scenes. Based on the characteristics of AIS data and our previous study, we designed, developed, and tested RedNavi, a lightweight, efficient, and sustainable information system with a microservices architecture that receives, parses, stores, queries, and returns relative maritime information on-demand on the back-end and performs computer 3D scene building on the front-end. This study enhances the dimensionality of AIS data representation from 2D planar charts to 3D computer scenes. We believe that RedNavi will have a wide range of applications in the future, such as improving trainees’ professional skills of corresponding 2D information to reality when deployed on land for MET and providing certain visual aids and information support to the deck officer in scenarios where visibility is poor when deployed onboard for navigation. Both land-based and live-ship tests have demonstrated the efficacy of RedNavi and the feasibility of these applications, despite the problems that can affect the performance and rendering efficiency in the case of complex sea conditions and a large amount of data. Based on our findings, we discussed how RedNavi could be improved for further work.
Author Contributions
Conceptualization, N.W. and H.L.; methodology, H.L. and N.W.; software, H.L.; validation, H.L. and N.W.; formal analysis, H.L. and N.W.; investigation, H.L. and N.W.; resources, H.L. and N.W.; data curation, H.L. and N.W.; writing—original draft preparation, H.L.; writing—review and editing, H.L. and N.W.; visualization, H.L. and N.W.; supervision, N.W.; project administration, H.L. and N.W.; funding acquisition, N.W. All authors have read and agreed to the published version of the manuscript.
Funding
This research received no external funding.
Institutional Review Board Statement
Not applicable.
Informed Consent Statement
Not applicable.
Data Availability Statement
Not applicable.
Acknowledgments
The authors express their gratitude to Captain Tetsuya Itabashi of Hiyodori and other staff for the operation and for their help installing and testing the system onboard during the live-ship test session.
Conflicts of Interest
The authors declare no conflict of interest.
Abbreviations
The following abbreviations are used in this manuscript:
| 1D | One-dimensional |
| 2D | Two-dimensional |
| 3D | Three-dimensional |
| AIS | Automatic Identification System |
| API | Application Programming Interface |
| ECDIS | Electronic Chart Display and Information System |
| GIS | Geographic Information System |
| GPS | Global Positioning System |
| GT | Gross Tonnage |
| HSC | High-Speed Craft |
| IMO | International Maritime Organization |
| JSON | JavaScript Object Notation |
| LAN | Local Area Network |
| MET | Maritime Education and Training |
| MKD | Minimum Keyboard Display |
| MMSI | Maritime Mobile Service Identity |
| NMEA | National Marine Electronics Association |
| REST | Representational State Transfer |
| SOLAS | The International Convention for the Safety of Life at Sea |
| SOTDMA | Self-Organizing Time Division Multiple Access |
| TTL | Time to Live |
| VDES | VHF Data Exchange System |
| VHF | Very High Frequency |
| VR | Virtual Reality |
References
- Ford, S.F. ECDIS: Revolutionary or Evolutionary? In Proceedings of the 1994 National Technical Meeting of The Institute of Navigation, San Diego, CA, USA, 24–26 January 1994; pp. 719–728. [Google Scholar]
- Ford, S.F. The First Three-dimensional Nautical Chart. In Undersea with GIS; Wright, D.J., Ed.; ESRI Press: Redlands, CA, USA, 2002; pp. 117–138. [Google Scholar]
- Gold, C.; Chau, M.; Dzieszko, M.; Goralski, R. 3D Geographic Visualization: The Marine GIS. In Developments in Spatial Data Handling; Springer: Berlin/Heidelberg, Germany, 2005; pp. 17–28. [Google Scholar]
- Gold, C.; Goralski, R. 3D Graphics Applied to Maritime Safety. In Information Fusion and Geographic Information Systems; Popovich, V.V., Schrenk, M., Korolenko, K.V., Eds.; Springer: Berlin/Heidelberg, Germany, 2007; pp. 286–300. [Google Scholar]
- Ternes, A.; Knight, P.; Moore, A.; Regenbrecht, H. A User-defined Virtual Reality Chart for Track Control Navigation and Hydrographic Data Acquisition. In Geospatial Vision; Moore, A., Drecki, I., Eds.; Springer: Berlin/Heidelberg, Germany, 2008; pp. 19–44. [Google Scholar]
- Liu, T.; Zhao, D.; Pan, M. Generating 3D Depiction for a Future ECDIS Based on Digital Earth. J. Navig. 2014, 67, 1049–1068. [Google Scholar] [CrossRef]
- Liu, T.; Zhao, D.; Pan, M. An approach to 3D model fusion in GIS systems and its application in a future ECDIS. Comput. Geosci. 2016, 89, 12–20. [Google Scholar] [CrossRef]
- International Maritime Organization (IMO). Revised Guidelines for The Onboard Operational Use of Shipborne Automatic Identification Systems (AIS); International Maritime Organization (IMO): London, UK, 2015. [Google Scholar]
- International Telecommunication Union Radiocommunication Sector (ITU-R). Recommendation ITU-R M.1371-5: Technical Characteristics for an Automatic Identification System Using Time Division Multiple Access in the VHF Maritime Mobile Frequency Band; International Telecommunication Union Radiocommunication Sector (ITU-R): Geneva, Switzerland, 2014. [Google Scholar]
- International Association of Marine Aids to Navigation and Lighthouse Authorities (IALA). IALA Guideline 1082—An Overview of AIS. Available online: https://www.iala-aism.org/product/an-overview-of-ais-1082/ (accessed on 2 November 2021).
- Transportation Research Board. Shipboard Automatic Identification System Displays: Meeting the Needs of Mariners—Special Report 273; The National Academies Press: Washington, DC, USA, 2003; pp. 84–86. [Google Scholar]
- Plass, S.; Poehlmann, R.; Hermenier, R.; Dammann, A. Global Maritime Surveillance by Airliner-Based AIS Detection: Preliminary Analysis. J. Navig. 2015, 68, 1195–1209. [Google Scholar] [CrossRef]
- International Maritime Organization (IMO). International Convention for the Safety of Life at Sea (SOLAS), Chapter V. Safety of Navigation; International Maritime Organization (IMO): London, UK, 2002. [Google Scholar]
- Yuzuru, I.; Akihiro, T.; Yoshihiro, K.; Takuya, O.; Masakazu, S.; Keiji, Y.; Susumu, N.; Satoshi, T. Reconstruction of Kyoto of the Edo era based on arts and historical documents: 3D urban model based on historical GIS data. Int. J. Humanit. Arts Comput. 2009, 3, 21–38. [Google Scholar]
- Batson, S.; Score, R.; Sutton, A.J. Three-dimensional evidence network plot system: Covariate imbalances and effects in network meta-analysis explored using a new software tool. J. Clin. Epidemiol. 2017, 86, 182–195. [Google Scholar] [CrossRef] [PubMed]
- Mallam, S.C.; Nazir, S.; Renganayagalu, S.K. Rethinking Maritime Education, Training, and Operations in the Digital Era: Applications for Emerging Immersive Technologies. J. Mar. Sci. Eng. 2019, 7, 428. [Google Scholar] [CrossRef]
- Cwilewicz, R.; Tomczak, L. Improvement of ship operational safety as a result of the application of virtual reality engine room simulators. In Proceedings of the RISK ANALYSIS 2008, Cephalonia, Greece, 22 April 2008; pp. 535–544. [Google Scholar]
- Markopoulos, E.; Lauronen, J.; Luimula, M.; Lehto, P.; Laukkanen, S. Maritime Safety Fducation with VR Technology (MarSEVR). In Proceedings of the 2019 10th IEEE International Conference on Cognitive Infocommunications (Coginfocom 2019), New York, NY, USA, 23–25 October 2019; pp. 283–288. [Google Scholar]
- Liu, H.; Jurdana, I.; Lopac, N.; Wakabayashi, N. BlueNavi: A Microservices Architecture-Styled Platform Providing Maritime Information. Sustainability 2022, 14, 2173. [Google Scholar] [CrossRef]
- Newman, S. Building Microservices: Designing Fine-Grained Systems; O’Reilly Media, Inc.: Sebastopol, CA, USA, 2021. [Google Scholar]
- Wolff, E. Microservices: Flexible Software Architecture; Addison-Wesley Professional: Boston, MA, USA, 2016. [Google Scholar]
- National Marine Electronics Association (NMEA). NMEA 0183 Standard for Interfacing Marine Electronic Devices Version 3.01; National Marine Electronics Association (NMEA): Severna Park, MD, USA, 2002. [Google Scholar]
- U.S. Coast Guard Navigation Center. AIS Messages. Available online: https://www.navcen.uscg.gov/?pageName=AISMessages (accessed on 31 May 2022).
- MongoDB, Inc. NoSQL vs. SQL Databases|MongoDB. Available online: https://www.mongodb.com/nosql-explained/nosql-vs-sql (accessed on 31 May 2022).
- Internet Engineering Task Force (IETF). RFC 7946—The GeoJSON Format. Available online: https://datatracker.ietf.org/doc/html/rfc7946 (accessed on 31 May 2022).
- International Organization for Standardization (ISO). Information Technology—The JSON Data Interchange Syntax (ISO/IEC Standard No. 21778). Available online: https://www.iso.org/standard/71616.html (accessed on 10 November 2021).
- Three.js—JavaScript 3D Library. Available online: https://threejs.org (accessed on 31 May 2022).
- IgYerm|CGTrader. Available online: https://www.cgtrader.com/igyerm (accessed on 4 August 2022).
- dermalt|CGTrader. Available online: https://www.cgtrader.com/dermalt (accessed on 4 August 2022).
- Maps, Geocoding, and Navigation APIs & SDKs|Mapbox. Available online: https://www.mapbox.com/ (accessed on 4 August 2022).
- International Association of Marine Aids to Navigation and Lighthouse Authorities (IALA). IALA Guideline G1117—VHF Data Exchange System (VDES) Overview. Available online: https://www.iala-aism.org/product/vhd-data-exchange-system-vdes-overview-1117/ (accessed on 29 April 2022).
Publisher’s Note: MDPI stays neutral with regard to jurisdictional claims in published maps and institutional affiliations. |
© 2022 by the authors. Licensee MDPI, Basel, Switzerland. This article is an open access article distributed under the terms and conditions of the Creative Commons Attribution (CC BY) license (https://creativecommons.org/licenses/by/4.0/).