Article

A Comparative Life Cycle Assessment: Polystyrene or Polypropylene Packaging Crates to Reduce Citrus Loss and Waste in Transportation?

1
Transport Systems and Logistics Department, Faculty of Engineering, University of Duisburg-Essen, Keetmanstr. 3-9, 47058 Duisburg, Germany
2
Logistics and Supply Chain Management Department, College of International Transport and Logistics, Arab Academy for Science, Technology and Maritime Transport, Campus Abu-Qir, Alexandria 21625, Egypt
*
Author to whom correspondence should be addressed.
Sustainability 2022, 14(19), 12644; https://doi.org/10.3390/su141912644
Submission received: 1 September 2022 / Revised: 27 September 2022 / Accepted: 30 September 2022 / Published: 5 October 2022
(This article belongs to the Special Issue Sustainability and Security of Food Packaging)

Abstract

:
Packaging plays a key role in preserving food products during transportation. Therefore, selecting proper packaging crates to transport fruits from farms to the market can dramatically reduce loss and waste. This study aims to evaluate the environmental impact of two packaging alternatives when transporting citrus products in Jordan using the loss ratio, as an indicator to select the best packaging, based on the traveled distances. The research team tracked transportation trucks from several farms to the market. In addition, data were collected from the department of statistics in Jordan to build the model using OpenLCA Software with defined system boundaries. However, the results revealed that polypropylene crates performed better than polystyrene crates. Citrus loss during transportation was cut by at least 60% when using polypropylene crates. The use of polypropylene crates reduced product damages by handling better the vibration and load stress, especially with increased transport distances to the “Central Market of fruits and vegetables”. Different impact categories were evaluated. We selected 3 categories based on the hotspot analysis performed: climate change, resource depletion, and water resource depletion. Farm waste has the highest impact with ranges of 58–69%, 77–85%, and 77–81%, respectively. Other impactful waste is waste from packaging and inedible parts; they influence the impact categories up to 23%, 11%, and 17%, in the same order. In terms of environmental impact, the polypropylene crates have fewer impacts since they are reusable and recyclable at the end of the product life cycle. Therefore, we recommend adopting polypropylene crates when transporting citrus products to the market. As a future research direction, the study suggests performing a similar analysis to evaluate the effect of packaging crates on other agricultural products in Jordan.

1. Introduction

Food production is an essential activity for all societies around the globe. However, countries are trying to improve the sustainability of their Food Supply Chains (FSC), which rely on reducing food loss and waste (FLW) since it might hinder the sustainable development goals (SDGs) set by the United Nations (UN), such as poverty, hunger, and responsible consumption [1]. The global FLW reported by the Food and Agricultural Organization (FAO) has reached about 1.3 billion tons annually [2,3], which has had an impact on sustainable performance measures, since this amount of FLW consumes many resources and generates greenhouse gases (GHG) without any economic benefits. However, 45–55% of fruits and vegetables produced worldwide are considered FLW [4]. Transportation alone constitutes about 10% of the FLW generated through fruit and vegetable supply chains (SC) [3].
Usually, several factors affect the performance of SCs, such as delivery time, resource utilization, and the utilization of logistics operations [5], but when it comes to FSCs, other factors must be considered, perishability and delivery time [6], since food must be delivered before it deteriorates. However, citrus production is increasing worldwide [7], leading to an increase in the total citrus loss and waste (CLW) generated through its SC [8]. The average global CLW is estimated at 20% [9].
The loss and waste generated from fruits and vegetables are higher than other agricultural products since they are sensitive products and can be damaged easily. However, several studies have analyzed the vibration and stress effects while transporting different fruits and vegetables, such as peaches [10], tomatoes [11], apples [12,13], kiwifruit [14], bananas [15], papayas [16], watermelons [17], oranges [18], and strawberries [19], and they shared similar a conclusion, which is that the packaging used to transport those products play an important role in decreasing FLW resulting from the vibrations and stress.
The main function of packaging lies in protecting, handling, and storing packaged products [20,21,22]. It is also used to protect fruits and vegetables from vibration and stress effects from transport within the SCs [10,11,12,13,14,15,16,17,18,19,20,23]. Selecting proper packaging material and packaging is a key factor in reducing FLW, which would improve the SC’s competitive advantage [24]. Consequently, improving competitiveness enhances overall sustainability performance [25]. The environmental impacts of packaging materials are a major issue for practitioners and researchers due to the high energy required in the production processes and the consumption of natural resources. On the other side, transporting citrus without packaging crates will increase the losses due to the stress formed on the bottom layers. Although there are high environmental impacts, reasonable packaging should be used for the purpose of transporting fruits and vegetables from one stage to another within the SC [26].
Globally, around 158 million tons of citrus were produced in 2020 [27,28]. The Mediterranean region constitutes about 80–85% of the fresh citrus trade and about 20% of citrus production [29]. In addition, the Mediterranean region is the homeland of three citrus products: oranges, mandarins, and lemons [30]. Several causes of citrus losses were discussed in [1] on farms, while Defraeye et al. [31] elaborated on causes in the postharvest stages, including citrus transportation. Different research discussed the vibration and stress effects while transporting citrus. For instance, Zheng et al. [18] designed a new packaging format with a divider to eliminate the vibration effect during transportation on citrus fruits such as oranges. Moreover, Defraeye et al. [31] examined the performance of packaged citrus in cold transportation; they tested two different packaging materials staked on a pallet during transportation. In addition, Berry et al. [32] tested how suitable packaging material of citrus can reduce CLW at the pre-shipping stage.
However, citrus produced in Jordan is mainly for domestic consumption since it covers about 85% of the local demand, while around 20–30% of citrus produced in Jordan is lost at the farm stage [1]. Around 16% of citrus produced is considered a loss in transportation to the central market of fruits and vegetables (CMFV) [30].
Life cycle assessment (LCA) was coined due to the public’s response to awareness. Several life cycle terms have been defined: cradle-to-grave, cradle-to-gate, life cycle analysis, and many others. Initially, it was created as a tool to assess environmental impact. According to ISO 14040 [21], an LCA study has four stages: goal and scope, inventory analysis, impact assessment, and interpretation. The first stage discusses system boundaries, defining the aim, functional unit, and reasons for conducting the study. The system’s material, process, and energy flows are defined in the second stage. Next, the observations made in the LCA inventory are analyzed for impact assessment. Finally, all results are discussed in the interpretation phase [22]. However, extensive literature has been published stating the importance, evolution, and use of LCAs keeping in mind the inclusion of sustainability [3,4,5,6,7,8,9,10,11,12,13,14,15,16,17,18,19,20,21,22,23,24,25,26,27,28,29,30,31,32,33,34,35,36].
Most LCA studies on food packaging do not use real data on FLW [37]. However, some research used an estimated percentage of FLW [34], or results based on questionnaires [19], which might lead to misleading results on the relationship between FLW and environmental impacts of transportation processes when considering packaging material. Although Zheng et al. [18] studied the relationship between packaging design and orange loss and waste (OLW) during transportation. This paper used real experimental data to evaluate OLW during transportation, taking into consideration the associated environmental impact when using two different packaging materials. Therefore, this study compares two different packaging crates used to transport citrus from farms to the CMFV in Amman and then to retailers scattered around Jordan. The study employed the LCA to evaluate the associated environmental impact of the transporting processes with the aim of using proper packaging crates to reduce citrus losses. Nevertheless, to the best of the authors’ knowledge, this study is one of the few to study the environmental impact of packaging materials used to transport citrus to tradeoffs between CLW and the associated environmental impact.

2. Materials and Methods

2.1. Farm

The methodological approach adopted here is based on a recent research paper by Alzubi and Noche [1], which observed the citrus cultivation process during the 2021/2022 season. The agricultural inputs were discussed, such as fertilizers, irrigation, and pesticides needed per tree. The simulation model they introduced can predict the citrus yield and CLW generated at the farm level [1]. For instance, they found that citrus trees require, on average, about 0.45 kg of (N, P) fertilizer, and irrigation water varies between 90 L/week and 180 L/week depending on the temperature, weather conditions, and soil fertility.
In addition, citrus packaging on farms was observed by the authors. The observed data related to the type of packaging materials, packaging capacity, dimensions, and how many layers were filled in the crates. The pre-loading stage was also observed to collect data such as injured and damaged citrus before they were loaded into the truck. However, farmers used to fill more than the capacity when they used polystyrene crates, which led to increased CLW.

2.2. Transportation

In addition to the provided data, we tracked several trucks loaded with citrus from different farms (different distances) in this paper. Since around 90% of citrus farms are in the Jordan Valley, and the yield is transported to the CMFV in Amman, the distance from farms to the CMFV was considered in order to analyze the effect on citrus losses during transportation.
For all transportation activities from the farms to the CMFV and then to retailers, information about the vehicle used to transport citrus was also gathered: truck type, load, cargo box dimensions, and how many crates can be uploaded. Moreover, vehicle velocity during the transportation process was also recorded.

2.3. CMFV and Retailers

The CMFV is an open area where farmers offer their transported produce to retailers. The main issues here are the handling process and crate stacking, which forms stress on layers stacked on the bottom. Nevertheless, information related to the retailer, such as their waste percentages, the truck type, and distance to the CMFV were collected at the CMFV according to interviews with several retailers.
Since we followed the LCA approaches, the detailed analysis is described in Section 3 based on the LCA approach structure, along with the results.

3. LCA and Results

3.1. Goal and Scope Definition Phase

Selecting the proper packaging is key to reducing CLW. The goal of this study is to provide an environmental assessment of two packaging crates used to transport citrus throughout the SC. The study will present a comparative analysis of the environmental impact of using polypropylene (PP) crates instead of polystyrene (PS) crates when transporting citrus products and compare these two packaging crates in terms of CLW. For this purpose, the study provides a comparative LCA to compare both materials in terms of environmental impact and the amount of CLW when using any of them in transportation. The study also evaluates replacing PS crates, used to transport citrus from farms, with reusable packaging crates, which might influence farmers’ profits and the associated environmental impact.
Considering the citrus losses generated through the SC, from the farms to the retailers, the functional unit is defined as 1 kg of citrus sold to consumers at the retailer stage. To allow consumers to buy 1 kg of undamaged citrus at retailers, more than 1 kg of citrus should be transported from the farms to compensate for the losses.

3.2. System Boundaries

The system covered in this study is cradle-to-grave. The citrus supply chain (CSC) stages covered in this study are presented in Figure 1. However, the study assumed that the citrus losses occurred only at farms, the CMFV, retailers, and transportation. Two types of packaging crates were analyzed in scenarios, which are (iI) scenario 1 (S1): representing the currently used PS crates, and (ii) scenario 2 (S2): representing the reusable PP crates.
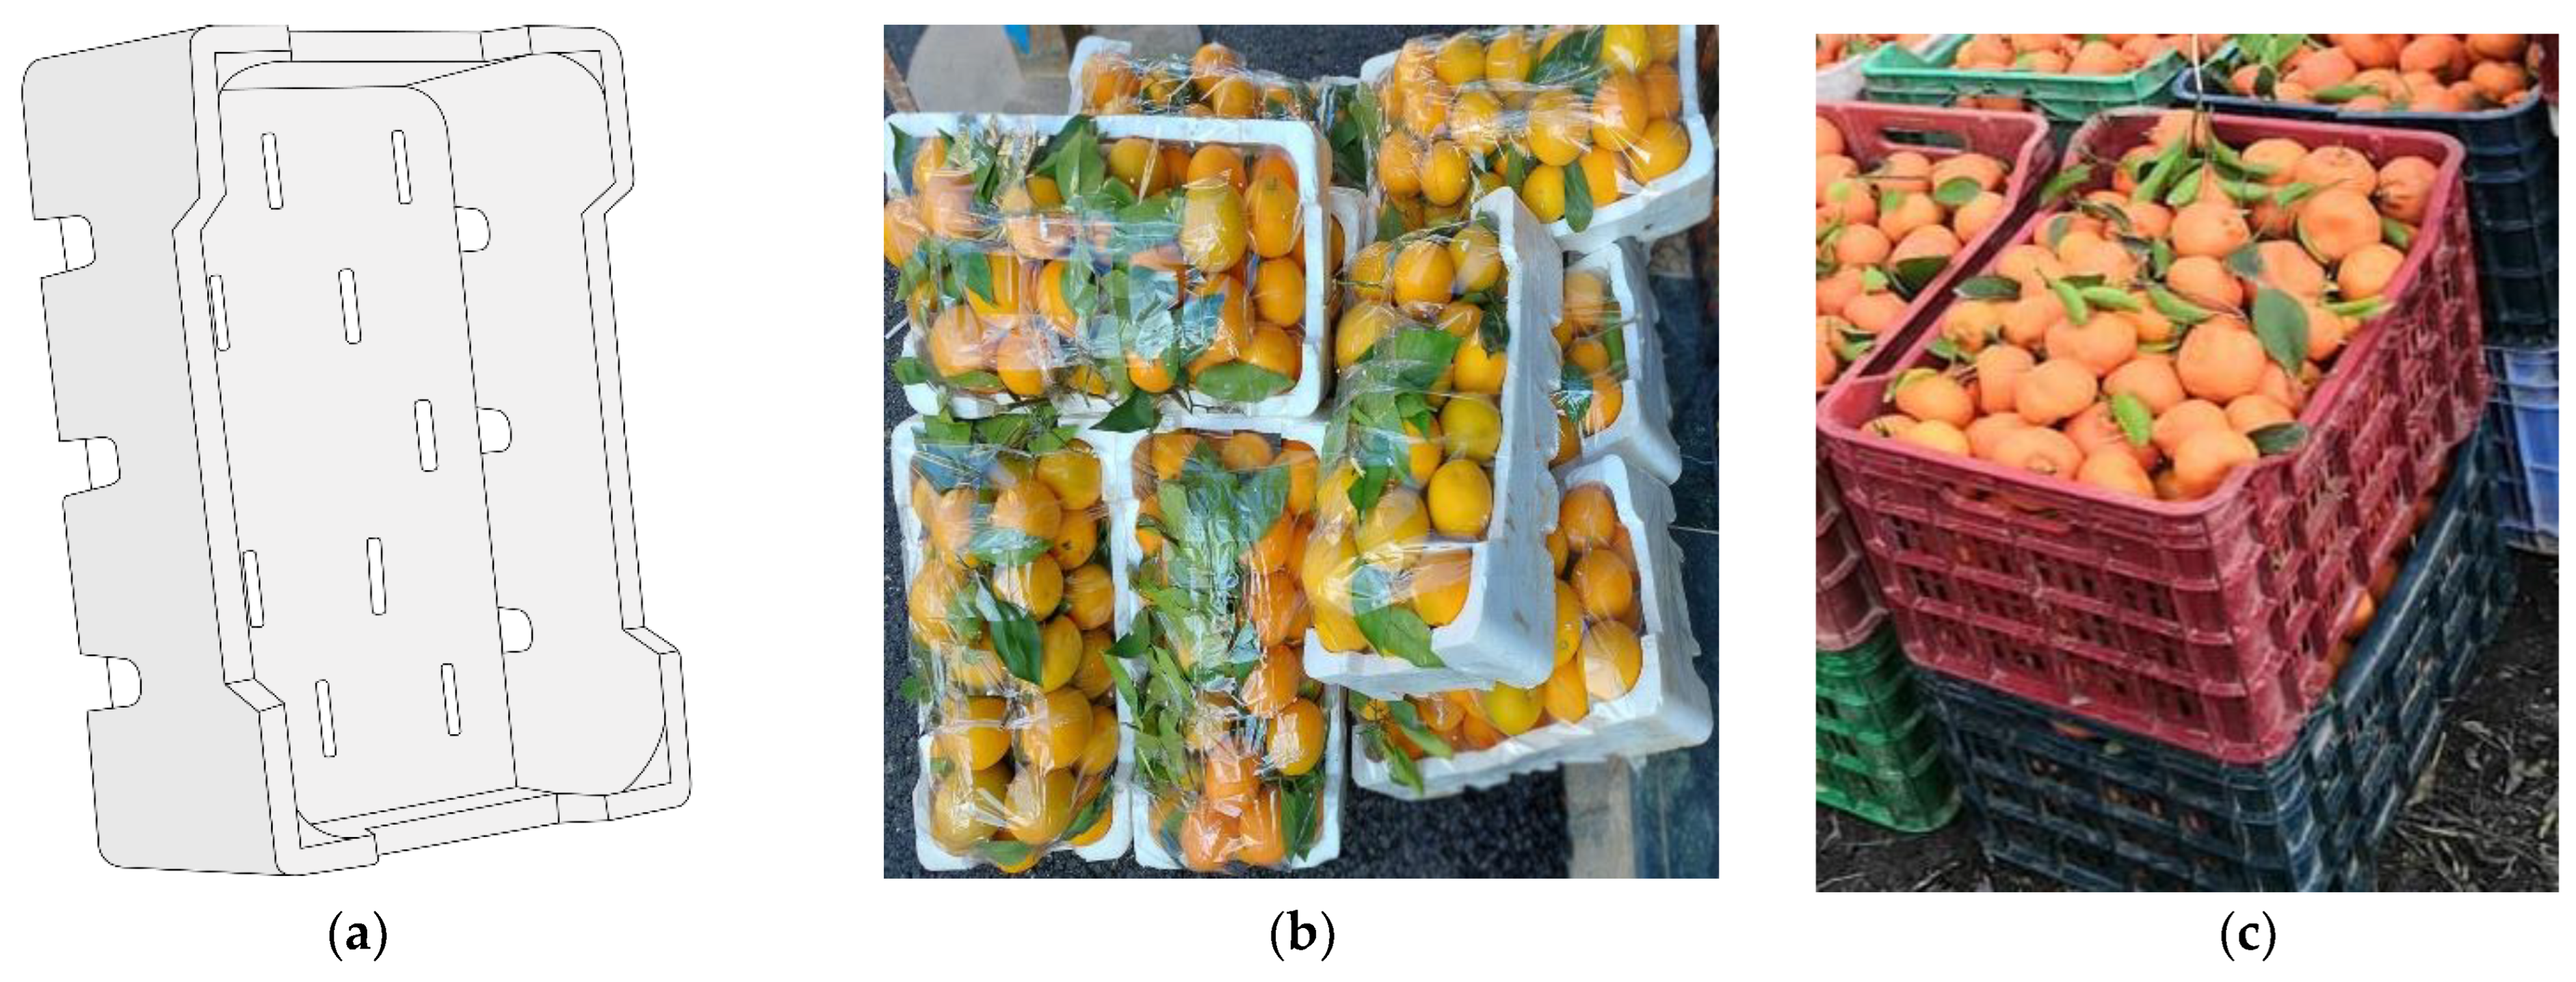
PS crates are widely use by farmers in Jordan to transport fruits and vegetables (Figure 2a). Citrus are transported in such crates and filled in three layers and wrapped in a stretch foil as illustrated in (Figure 2b), where the total weight on average is 5 kg, while the weight of the empty crate is 0.25 kg. Crate dimensions are 60 cm × 40 cm × 15 cm. There are also PP crates, which some farmers use to transport more citrus in one trip (Figure 2c). The crate capacity is up to 20 kg, while the weight of the empty crate is 3.2 kg. Crate dimensions are 60 cm × 40 cm × 34 cm.

3.3. Effect of Vibration and Stress While Transporting Citrus

Several trucks loaded with citrus crates were tracked to record the loss ratios according to the distance traveled from Jordan Valley to Amman’s CMFV. However, four farms with different distances were selected to track their loaded trucks twice, one load with PS crates and the second with PP.
It was found that road defects and longer distances increase the vibration effect while filling citrus more than the maximum crate capacity, as in Figure 2b, increases the stress effects on the citrus fruits.

3.4. Inventory Analysis

Nevertheless, the type of crate material significantly increases the loss ratios since the same vehicle of 5.8 tons was used to transport citrus for both scenarios. Framers use an open truck (Figure 3) for transporting their produce with rear part dimensions of 5.7 m × 2.07 m × 1.80 m. The results revealed that the losses for S1 lie between 11.7–15.9%, while for S2 lie between 3.9–5.1%. Table 1 summarizes all results and related data for both scenarios.
The loss percentages were calculated from the farm to the CMFV only; therefore, an assumption made for the analysis is that similar percentages will be generated when transporting citrus from the CMFV to the retailers.
Furthermore, the effect of the stress was found at a distance of 0 km for S1 because farmers tend to fill the PS crates more than their maximum capacity and stack the filled citrus crates in a preparation step before loading the truck. The average truck speed recorded was 60 km/h. In addition to filling crates more than capacity, the high loss rates are because of (i) stress formed on the first loaded layers, (ii) vibration due to road roughness, road defects, traffic jams, etc., and (iii) weather conditions. However, after separating and weighing the damaged citrus, loss percentage was calculated based on formula (1). It was noticed that the first layer loaded in the truck is the most affected one due to the stress formed by the top layers.
L o s s % = ( w e i g h t   o f   d a m a g e d   t r a n s p o r t e d   c i t r u s t o t a l   w e i g h t   o f   t r a n s p o r t e d   c i t r u s ) × 100 %  
The amount of citrus transported for each distance is listed in Table 2. The total transported citrus was calculated based on the citrus loss%, multiplied by two to cover the citrus loss generated from the CMFV to the retailers. A clear relationship was found between CLW and the distance traveled. For instance, CLW increases as the total transported distance increases because citrus is kept under stress and vibration for a longer time. Therefore, the losses must be compensated by increasing the amount of citrus at the cultivation stage to cover all losses. An example of calculating the total weight needed to be transported from a farm 70 km away from the CMFV is 1.45 kg for S1 and 1.29 for S2 (including the losses from the farm to the CMFV and from the CMFV to the retailers).

3.5. Assumptions

Since PS crates are not reusable, they will not be returned to the farmer; therefore, the assumption was made that: (i) this type of waste goes directly to the landfill. However, according to an interview with a farmer, PP crates could be exchanged at the CMFV; therefore, the assumption was considered that: (ii) PP crates will be transported to the CMFV, where retailers and farmers could exchange empty crates for filled ones. Based on the assumptions mentioned in the previous sections, Table 3 lists the amount of waste at each stage, including the waste generated from the farm to the end-of-use stages based on the functional unit.

3.6. Inventory Analysis

The data was analyzed using OpenLCA software, the ELCD database 3.2 and the LCIA method package OpenLCA LCIA methods v2.0.4. However, the data collected is observational since we tracked the transportation process, while data at the harvest stage were taken from [1].
Several impact categories were extracted from the analysis, which are Acidification (molc H+ eq), Climate change (kg CO2 eq), Freshwater ecotoxicity (CTUe), Freshwater eutrophication (kg P eq), Land use (kg C deficit), Ozone depletion (kg CFC-11 eq), Particulate matter (kg PM2.5 eq), Water resource depletion (m3 water eq), and Resource depletion (kg Sb eq). All extracted results are summarized in Table 4.
For more insights, the percentage differences in the results of both scenarios are illustrated in Table 5, which shows how the environmental impacts of both packaging crates vary. The negative reduction percentages show that the environmental impacts in S2 are lower than in S1.
We followed Sasaki et al. [10] and conducted a hotspot analysis to identify the most relevant impact categories. They considered the definition of a hotspot set by the European Commission in 2018 [38] that identifies the most contributing impact by the cumulative contribution, which is at least 50%.
However, the results showed that Climate change, Resource depletion, and Water resource depletion have a cumulative contribution of 77%; therefore, we consider them the most relevant categories in this paper.
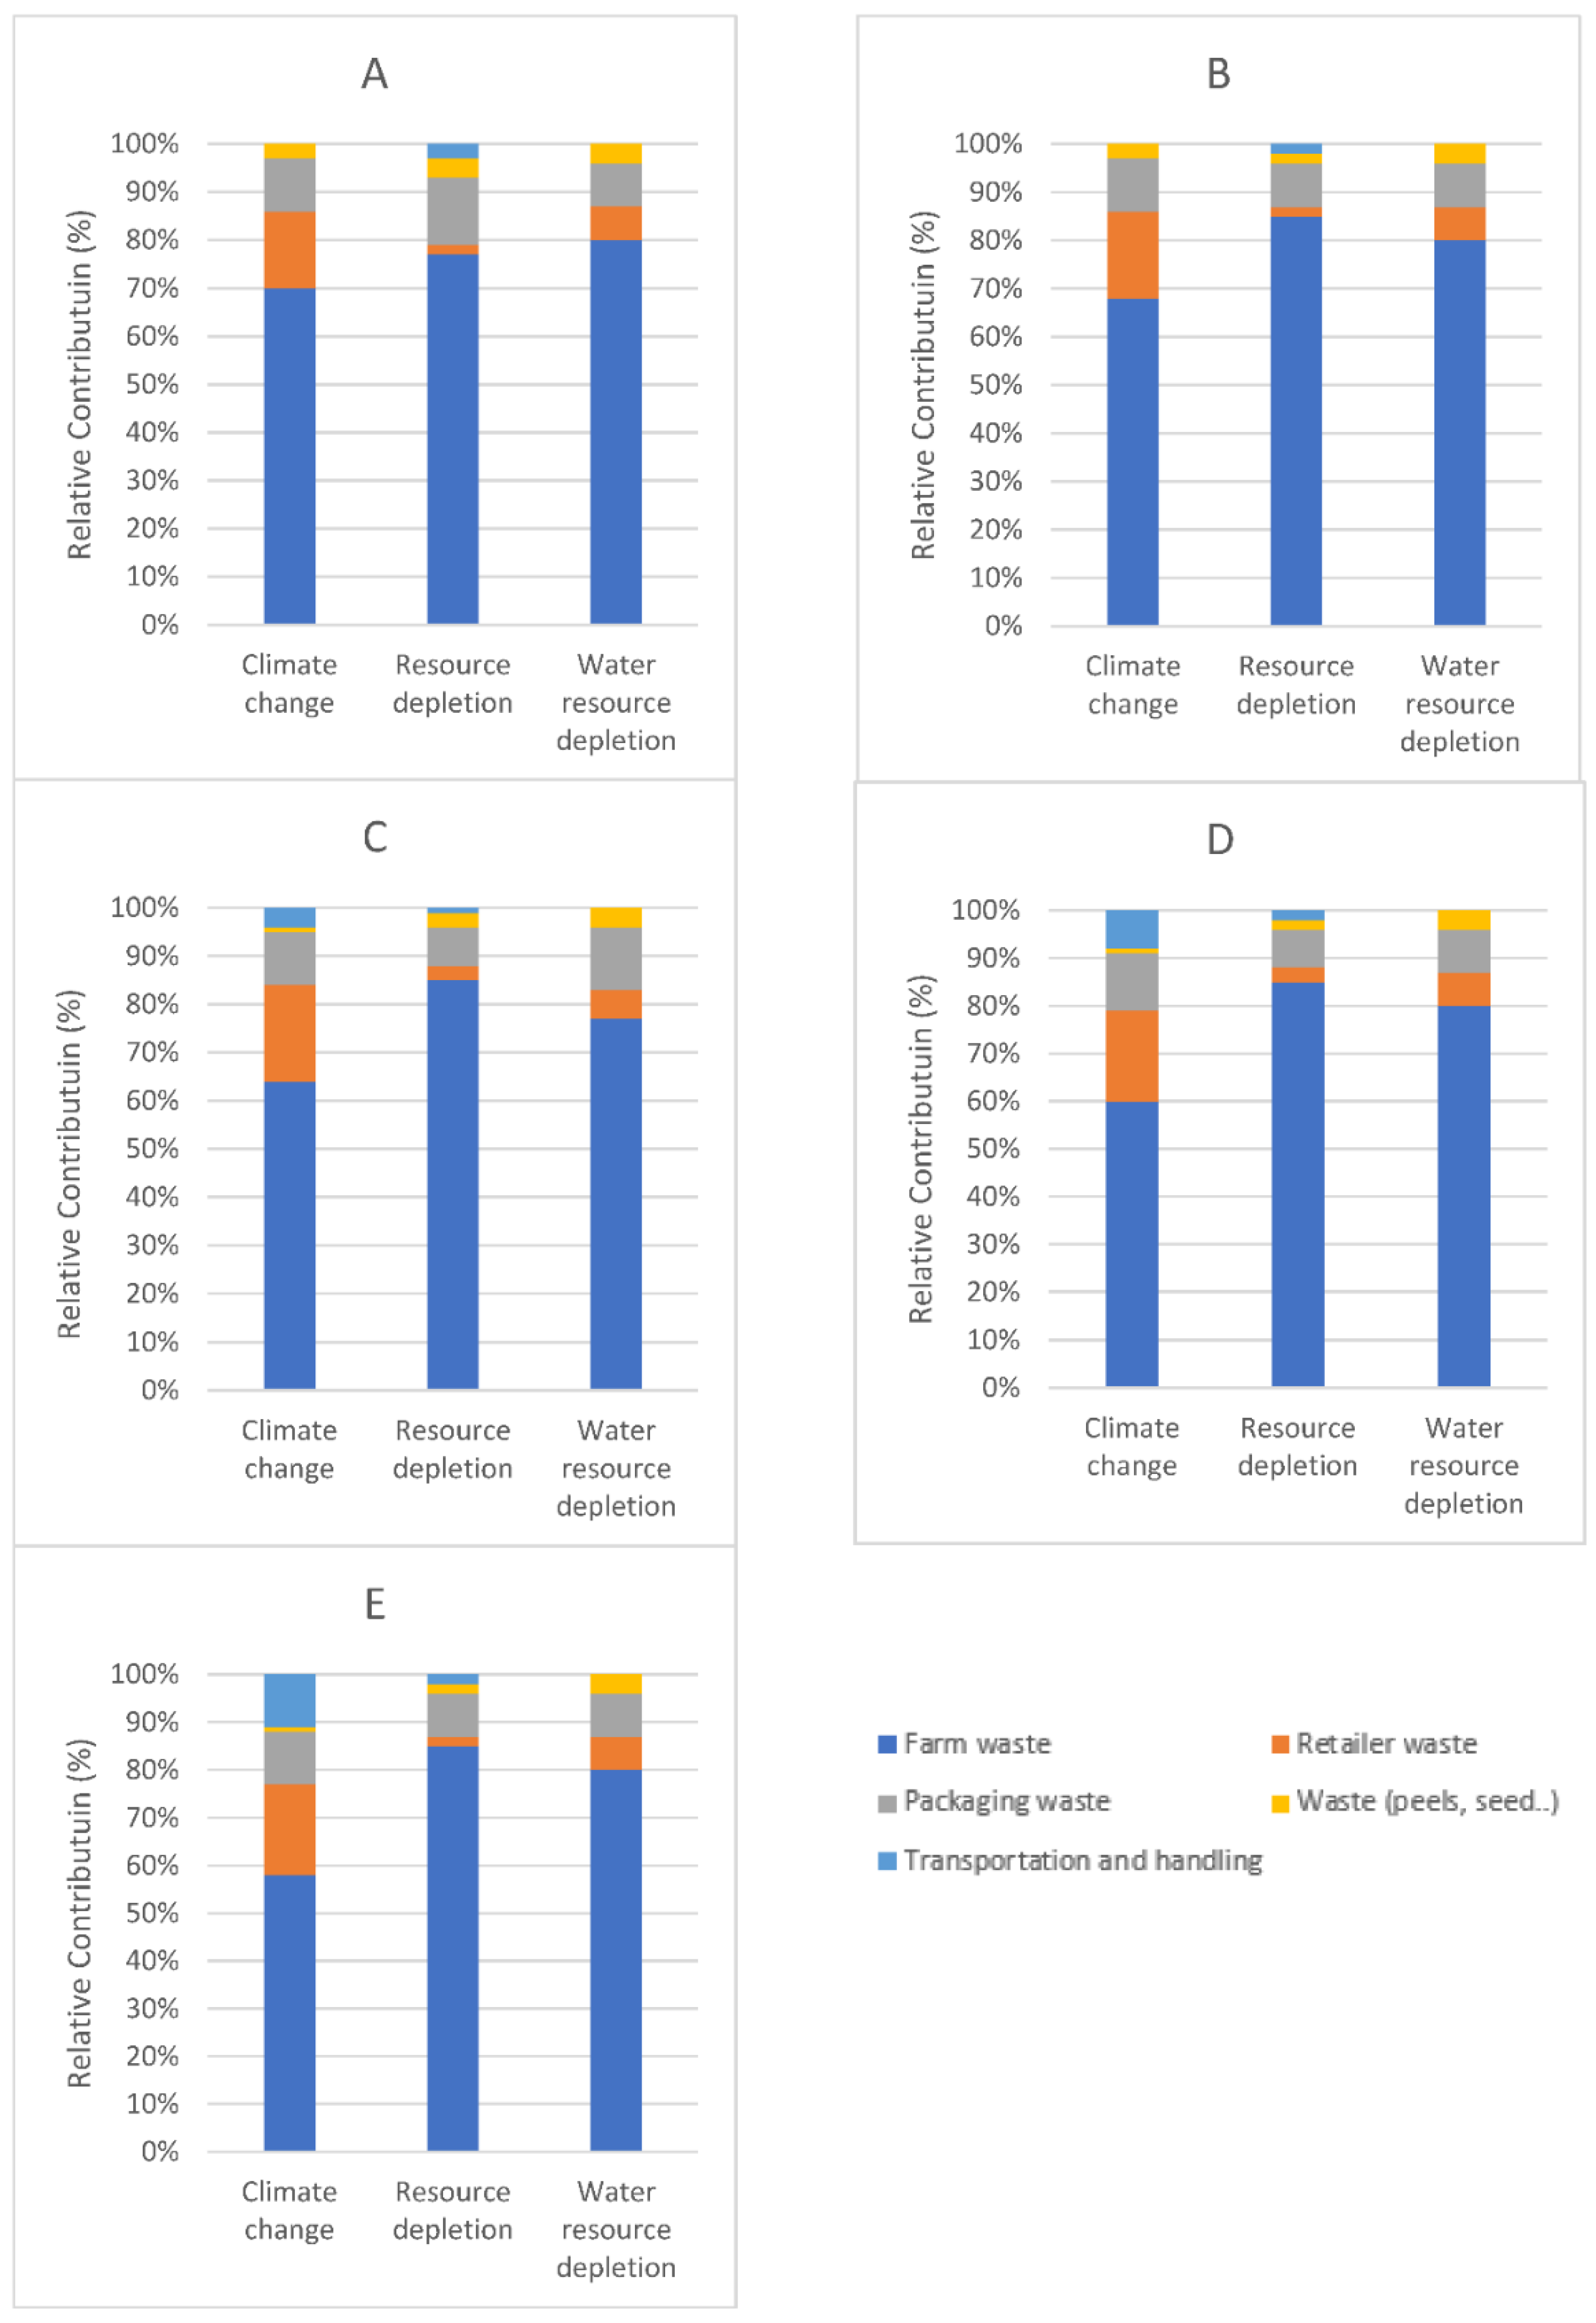
The relative results of these impact categories showed that citrus cultivation on the farm contributes most to all impact categories, as seen in Figure 4A–E. The results in Figure 4A–E represent the relative contribution of CSC stages based on the functional unit (1 kg of citrus sold to consumers at the retailer stage); however, A, B, C, D, and E represent the traveled distances of 0km, 40 km, 70 km, 100 km, and 140 km.

3.7. Relationship to CLW

The results showed a great reduction in CLW through the SC when using PP crates (S2) instead of PS crates (S1). Although the effect of vibration on citrus loss has not been eliminated, the stress effect has been removed to some extent while transporting the yield to the CMFV in Amman.
PP crates helped in reducing the amount of citrus required to be transported to deliver the functional unit (1 kg of citrus sold to consumers at the retailer stage). When comparing the results of both scenarios, the PP crate reduced the citrus required by at least 60%.
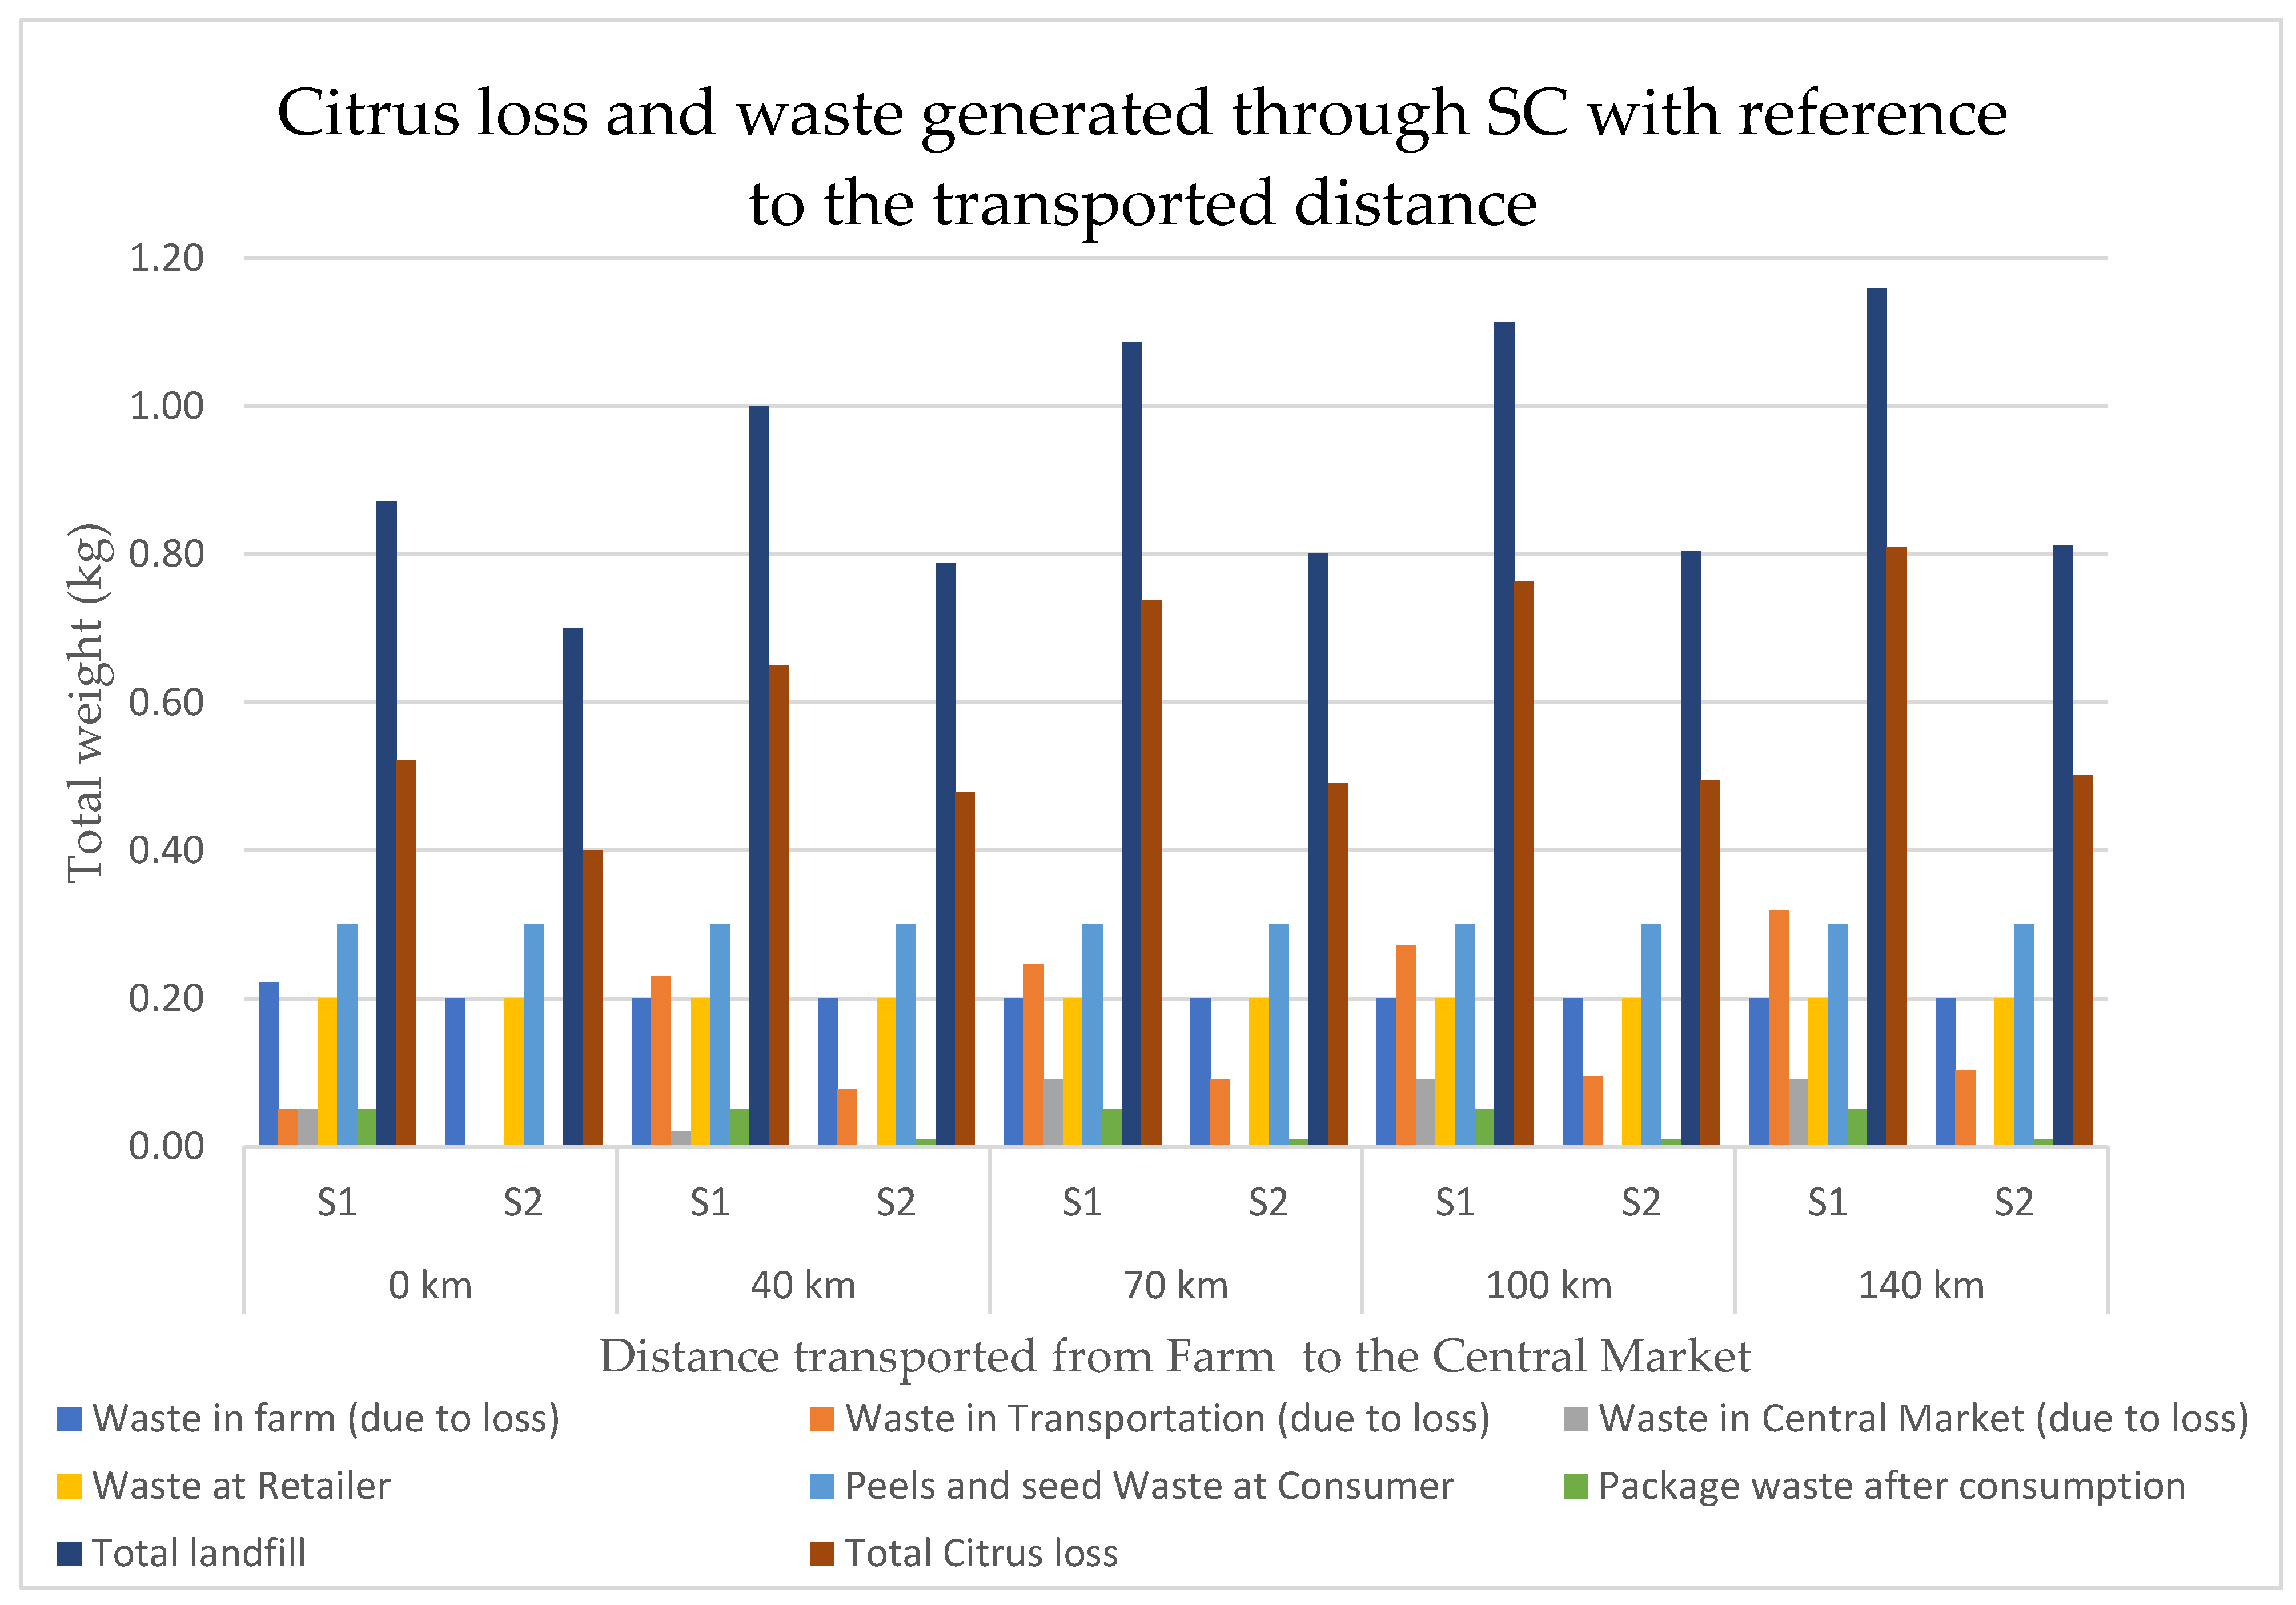
In addition, since PP crates are reusable for at least 5 years, the total amount of waste (including packaging materials) is also reduced. Another waste also considered here is the inedible parts of citrus fruits, such as peels and seeds, which make up around 33% of the net weight, the consumer will buy at the retailing stage [1]. Figure 5 illustrates the total CLW generated through the SC, including packaging material at the end of life, and the inedible parts (Peels and seeds), based on the functional unit and the distance traveled for both scenarios.

3.8. Discussion

The results revealed that selecting the proper packaging materials can dramatically decrease the amount of FLW. The study compared two different packaging crates and their effect on the safety level of citrus products. Suitable packaging crates can protect fruits from being damaged by vibration and stress. However, depending on the distance of travel; the analyzed environmental impact showed that the farm stage is the greatest contributor to all categories analyzed; climate change, resource depletion, and water resource depletion; 58–69%, 77–85%, and 77–81%, respectively as illustrated in Figure 4. Similar results were found by Sasaki et al. [10] on peach production, where the cultivation stage was the greatest contributor to environmental impact in their study. Moreover, waste from packaging and the inedible parts is the second contributor to the environmental impact; of climate change, resource depletion, and water resource depletion; by almost 23%, 11%, and 17%, respectively.
The vibration and stress effects on fruits and vegetables are becoming increasingly discussed in the literature because they increase FLW during transportation, which affects sustainable performance in general. Therefore, using suitable packaging material is important to reduce the CLW, which was reduced by at least 35% during transportation only. Similar conclusions were found in other studies that analyzed other types of fruits and vegetables, such as peaches [10], tomatoes [11], apples [12,13], kiwifruit [14], bananas [15], papayas [16], watermelons [17], oranges [18], and strawberries [19].
The amount of citrus loss increases as the distances from farms to the CMFV increase, due to several factors such as vibration while transporting the yield and the stress generated from the top layers. Around 89% of citrus farms in Jordan are in the Jordan valley [1], where the distance from those farms to the CMFV varies between 35–150 km. Farmers oversee cultivation, collection in crates, and transportation of their yield to the CMFV. Similar conclusions about peach transportation and packaging were found by Sasaki et al. [10].
Retailers are scattered around the country, ranging from less than 5 km to 300 km. In an interview with one of the retailers in Amman, he explained how he determines the demand per a specific time (usually a week) based on his historical records by adding an allowance of about 20%, which led to an increase in the losses at the retailing stage since this 20% might not be sold within the same period, especially when it comes to consumer preferences.
The main factors that might increase the loss at the CMFV are stress formed when stacking crates and temperatures since the CMFV is an open area where farmers and retailers can exchange fruit and vegetable merchandise. Polypropylene crates revealed better performance than PS crates since PP crates have stronger edges that help end the stress effects.
Nevertheless, the capacity of the PP crates is up to 20 kg because of their height, which is 34 cm. Therefore, using PP crates illustrated in Figure 2c improves the safety level of citrus in logistics operations, like the effect of vibration during transportation and stress when stacking and transporting crates. Farmers should keep spaces between stacked crates to eliminate the stress effect formed by other layers when loading the truck to reach the desired level.

4. Conclusions

Major waste could be retraced to packaging methods. Using PP instead of PS crates decreased the CLW during transportation from farms to CMFV. PP crates are shown to be more resilient to vibration and stress loads. The LCA approach was implemented using OpenLCA software to evaluate the environmental impacts of PP and PS crates.
The relevant environmental impact categories were identified by applying a hotspot analysis, which indicated that climate change, resource depletion, and water resource depletion have a cumulative contribution of more than 50%. It has been found that waste at farms was the greatest contributing factor to the hotspot categories, with results of 58–69%, 77–85%, and 77–81%, respectively.
Due to packaging methods selected by farmers, transportation waste and packaging waste contributes to these impact categories. Although PP might be cost-effective in the long-term run since it is reusable and recyclable, farmers tend to use PS crates. However, filling the PS crates more than their capacity increases the citrus damage while transporting it because top layer stress caused 11–16% of CLW. Eight loaded trucks with citrus were observed, from farm to CMFV, to measure the CLW during transportation. It was found that PP crates reduced CLW by at least 60% compared to PS crates, which also can influence the farmers’ profitability since it improved the trip utilization by transporting more citrus per trip.
Limitations of this study are (i) the data collected from retailers were based on the retailers’ approximation, and it excluded the consumer stage from the analysis. (ii) Conducting more experiments related to crates filling up to the maximum capacity, in the case of PS crates, was not possible because of the limited season time and acceptance of the idea by farmers. Therefore, future research might be directed to observe the retailer stage and include the consumer in further analysis. Moreover, finding and optimizing solutions to implement the circular and closed-loop SC concepts enhances SC’s innovation and improves the benefits to all stakeholders.

Author Contributions

Conceptualization, E.A. and A.K.; methodology, E.A.; software, E.A.; validation, E.A. and A.K.; formal analysis, E.A.; investigation, E.A.; resources, E.A.; data curation, E.A.; writing—original draft preparation, E.A.; writing—review and editing, E.A. and A.K.; visualization, A.K.; supervision, B.N. All authors have read and agreed to the published version of the manuscript.

Funding

This research received no external funding.

Conflicts of Interest

The authors declare no conflict of interest.

References

  1. Alzubi, E.; Noche, B. Improving Sustainability of Orange Supply Chain: A System Dynamics Model to Eliminating Pre-Harvesting Loss, Increase Workers, to Improve farmer’ s Profit. In Proceedings of the International Conference on Industrial Engineering and Operations Management Istanbul 2022, Istanbul, Turkey, 7–10 March 2022. [Google Scholar]
  2. FAO. Global Food Losses and Food Waste—Extent, Causes and Prevention; FAO: Düsseldorf, Germany; Available online: http://www.fao.org/3/mb060e/mb060e.pdf (accessed on 1 November 2021).
  3. Hamdi-Asl, A.; Amoozad-Khalili, H.; Tavakkoli-Moghaddam, R.; Hajiaghaei-Keshteli, M. Toward sustainability in designing agricultural supply chain network: A case study on palm date. Sci. Iran. 2021. [CrossRef]
  4. Porat, R.; Lichter, A.; Terry, L.A.; Harker, R.; Buzby, J. Postharvest losses of fruit and vegetables during retail and in consumers’ homes: Quantifications, causes, and means of prevention. Postharvest Biol. Technol. 2018, 139, 135–149. [Google Scholar] [CrossRef] [Green Version]
  5. Alzubi, E.; Atieh, A.M.; Abu Shgair, K.; Damiani, J.; Sunna, S.; Madi, A. Hybrid integrations of value stream mapping, theory of constraints and simulation: Application to wooden furniture industry. Processes 2019, 7, 816. [Google Scholar] [CrossRef] [Green Version]
  6. Viswanadham, N.; Kameshwaran, S. The Supply Chain Ecosystem Framework. In Ecosystem-Aware Global Supply Chain Management; World Scientific Publishing Co. Pte. Ltd.: Singapore, 2013; Chapter 2; pp. 17–44. [Google Scholar] [CrossRef]
  7. Hasan, S.; Haque, M.E.; Afrad, M.S.I.; Alam, M.Z.; Hoque, M.Z.; Islam, M.R. Pest Risk Analysis and Management Practices for Increasing Profitability of Lemon Production. J. Agric. Ecol. Res. Int. 2021, 22, 26–35. [Google Scholar] [CrossRef]
  8. Ademosun, A.O. Citrus peels odyssey: From the waste bin to the lab bench to the dining table. Appl. Food Res. 2022, 2, 100083. [Google Scholar] [CrossRef]
  9. FAO. Food Balances. 2010. Available online: https://www.fao.org/faostat/en/#data/FBS (accessed on 31 August 2022).
  10. Sasaki, Y.; Orikasa, T.; Nakamura, N.; Hayashi, K.; Yasaka, Y.; Makino, N.; Shobatake, K.; Koide, S.; Shiina, T. Life cycle assessment of peach transportation considering tradeoff between food loss and environmental impact. Int. J. Life Cycle Assess. 2021, 26, 822–837. [Google Scholar] [CrossRef]
  11. Al-Dairi, M.; Pathare, P.B.; Al-Mahdouri, A. Impact of vibration on the quality of tomato produced by stimulated transport. IOP Conf. Ser. Earth Environ. Sci. 2021, 653, 012101. [Google Scholar] [CrossRef]
  12. Fadiji, T.; Coetzee, C.; Chen, L.; Chukwu, O.; Opara, U.L. Susceptibility of apples to bruising inside ventilated corrugated paperboard packages during simulated transport damage. Postharvest Biol. Technol. 2016, 118, 111–119. [Google Scholar] [CrossRef]
  13. Vursavuş, K.; Özgüven, F. Determining the effects of vibration parameters and packaging method on mechanical damage in golden delicious apples. Turkish J. Agric. For 2004, 28, 311–320. [Google Scholar] [CrossRef]
  14. Tabatabaekoloor, R.; Hashemi, S.J.; Taghizade, G. Vibration Damage to Kiwifruits during. Int. J. Agric. Food Sci. Technol. 2013, 4, 467–474. [Google Scholar]
  15. Wasala, W.M.C.B.; Dharmasena, D.A.N.; Dissanayake, T.M.R.; Thilakarathne, B.M.K.S. Vibration simulation testing of banana bulk transport packaging systems. Trop. Agric. Res. 2015, 26, 355. [Google Scholar] [CrossRef] [Green Version]
  16. Chonhenchob, V.; Singh, S.P. Packaging performance comparison for distribution and export of papaya fruit. Packag. Technol. Sci. 2005, 18, 125–131. [Google Scholar] [CrossRef]
  17. Shahbazi, F.; Rajabipour, A.; Mohtasebi, S.; Rafie, S. Simulated in-transit vibration damage to watermelons. J. Agric. Sci. Technol. 2010, 12, 23–34. [Google Scholar]
  18. Zheng, D.; Chen, J.; Lin, M.; Wang, D.; Lin, Q.; Cao, J.; Yang, X.; Duan, Y.; Ye, X.; Sun, C.; et al. Packaging Design to Protect Hongmeiren Orange Fruit from Mechanical Damage during Simulated and Road Transportation. Horticulturae 2022, 8, 258. [Google Scholar] [CrossRef]
  19. La Scalia, G.; Aiello, G.; Miceli, A.; Nasca, A.; Alfonzo, A.; Settanni, L. Effect of Vibration on the Quality of Strawberry Fruits Caused by Simulated Transport. J. Food Process Eng. 2016, 39, 140–156. [Google Scholar] [CrossRef]
  20. Chen, X.; Chen, M.; Xu, C.; Yam, K.L. Critical review of controlled release packaging to improve food safety and quality. Crit. Rev. Food Sci. Nutr. 2019, 59, 2386–2399. [Google Scholar] [CrossRef]
  21. Finkbeiner, M.; Inaba, A.; Tan, R.; Christiansen, K.; Klüppel, H.-J. The New International Standards for Life Cycle Assessment: ISO 14040 and ISO 14044. Int. J. Life Cycle Assess. 2006, 11, 80–85. [Google Scholar] [CrossRef]
  22. Muralikrishna, I.V.; Manickam, V. Life Cycle Assessment. In Environmental Management; Elsevier: Amsterdam, The Netherlands, 2017; pp. 57–75. [Google Scholar] [CrossRef]
  23. Ge, C. Theory and practice of cushion curve: A supplementary discussion. Packag. Technol. Sci. 2019, 32, 185–197. [Google Scholar] [CrossRef]
  24. Eriksson, M.; Strid, I.; Hansson, P.A. Waste of organic and conventional meat and dairy products—A case study from Swedish retail. Resour. Conserv. Recycl. 2014, 83, 44–52. [Google Scholar] [CrossRef]
  25. Alzubi, E.; Akkerman, R. Sustainable supply chain management practices in developing countries: An empirical study of Jordanian manufacturing companies. Clean. Prod. Lett. 2022, 2, 100005. [Google Scholar] [CrossRef]
  26. Lacirignola, C.; D’onghia, A.M. The Mediterranean citriculture: Productions and perspectives. Citrus tristeza virus Toxoptera citricidus a serious Threat to Mediterr. Citrus Ind. 2009, 17, 13–17. [Google Scholar]
  27. KNOEMA. World – Citrus fruit production quantity. 2022. Available online: https://knoema.com/atlas/World/topics/Agriculture/Crops-Production-Quantity-tonnes/Citrus-fruit-production (accessed on 15 September 2022).
  28. Statista. World production of citrus fruits in 2020, by region (in thousand metric tons). 2022. Available online: https://www.statista.com/statistics/264002/production-of-citrus-fruits-worldwide-by-region/ (accessed on 15 September 2022).
  29. Zacarias, L.; Cronje, P.J.R.; Palou, L. Postharvest technology of citrus fruits. Genus Citrus 2020, 421–446. [Google Scholar] [CrossRef]
  30. Department of Statistics in Jordan. Dep. Stat. Jordan. 2021. Available online: http://dosweb.dos.gov.jo/product-category/jordan-in-figures (accessed on 11 June 2022).
  31. Defraeye, T.; Lambrecht, R.; Tsige, A.A.; Delele, M.A.; Opara, U.L.; Cronjé, P.; Verboven, P.; Nicolai, B. Forced-convective cooling of citrus fruit: Package design. J. Food Eng. 2013, 118, 8–18. [Google Scholar] [CrossRef] [Green Version]
  32. Berry, T.M.; Defraeye, T.; Wu, W.; Sibiya, M.G.; North, J.; Cronje, P.J.R. Cooling of ambient-loaded citrus in refrigerated containers: What impacts do packaging and loading temperature have? Biosyst. Eng. 2021, 201, 11–22. [Google Scholar] [CrossRef]
  33. Toniolo, S.; Tosato, R.C.; Gambaro, F.; Ren, J. Life cycle thinking tools: Life cycle assessment, life cycle costing and social life cycle assessment. In Life Cycle Sustainability Assessment for Decision-Making: Methodologies and Case Studies; Elsevier: Amsterdam, The Netherlands, 2019; pp. 39–56. [Google Scholar] [CrossRef]
  34. Yang, S.; Ma, K.; Liu, Z.; Ren, J.; Man, Y. Development and applicability of life cycle impact assessment methodologies"," in Life Cycle Sustainability Assessment for Decision-Making: Methodologies and Case Studies; Elsevier: Amsterdam, The Netherlands, 2019; pp. 95–124. [Google Scholar] [CrossRef]
  35. Martin-Gorriz, B.; Maestre-Valero, J.F. Life Cycle Assessment of farming practices that improve citrus orchards sustainability in semiarid areas. In Proceedings of theEuropean Conference on Crop Diversification, Budapest, Hungary, 18–21 August 2019; Volume 24, pp. 1515–1532. [Google Scholar] [CrossRef]
  36. Chen, L. Benefits of Anaerobic Digestion. University of Idaho. 2014. Available online: http://171.67.100.116/courses/2017/ph240/huang1/docs/cis-1215.pdf (accessed on 31 August 2022).
  37. Wikström, F.; Williams, H.; Verghese, K.; Clune, S. The influence of packaging attributes on consumer behaviour in food-packaging life cycle assessment studies—A neglected topic. J. Clean. Prod. 2014, 73, 100–108. [Google Scholar] [CrossRef]
  38. European Commission. PEFCR Guidance Document—Guidance for Product Environmental Footprint Category Rules (PEFCRs). In PEFCR Guide; 2018. Available online: https://ec.europa.eu/environment/eussd/smgp/pdf/PEFCR_guidance_v6.3.pdf (accessed on 29 August 2022).
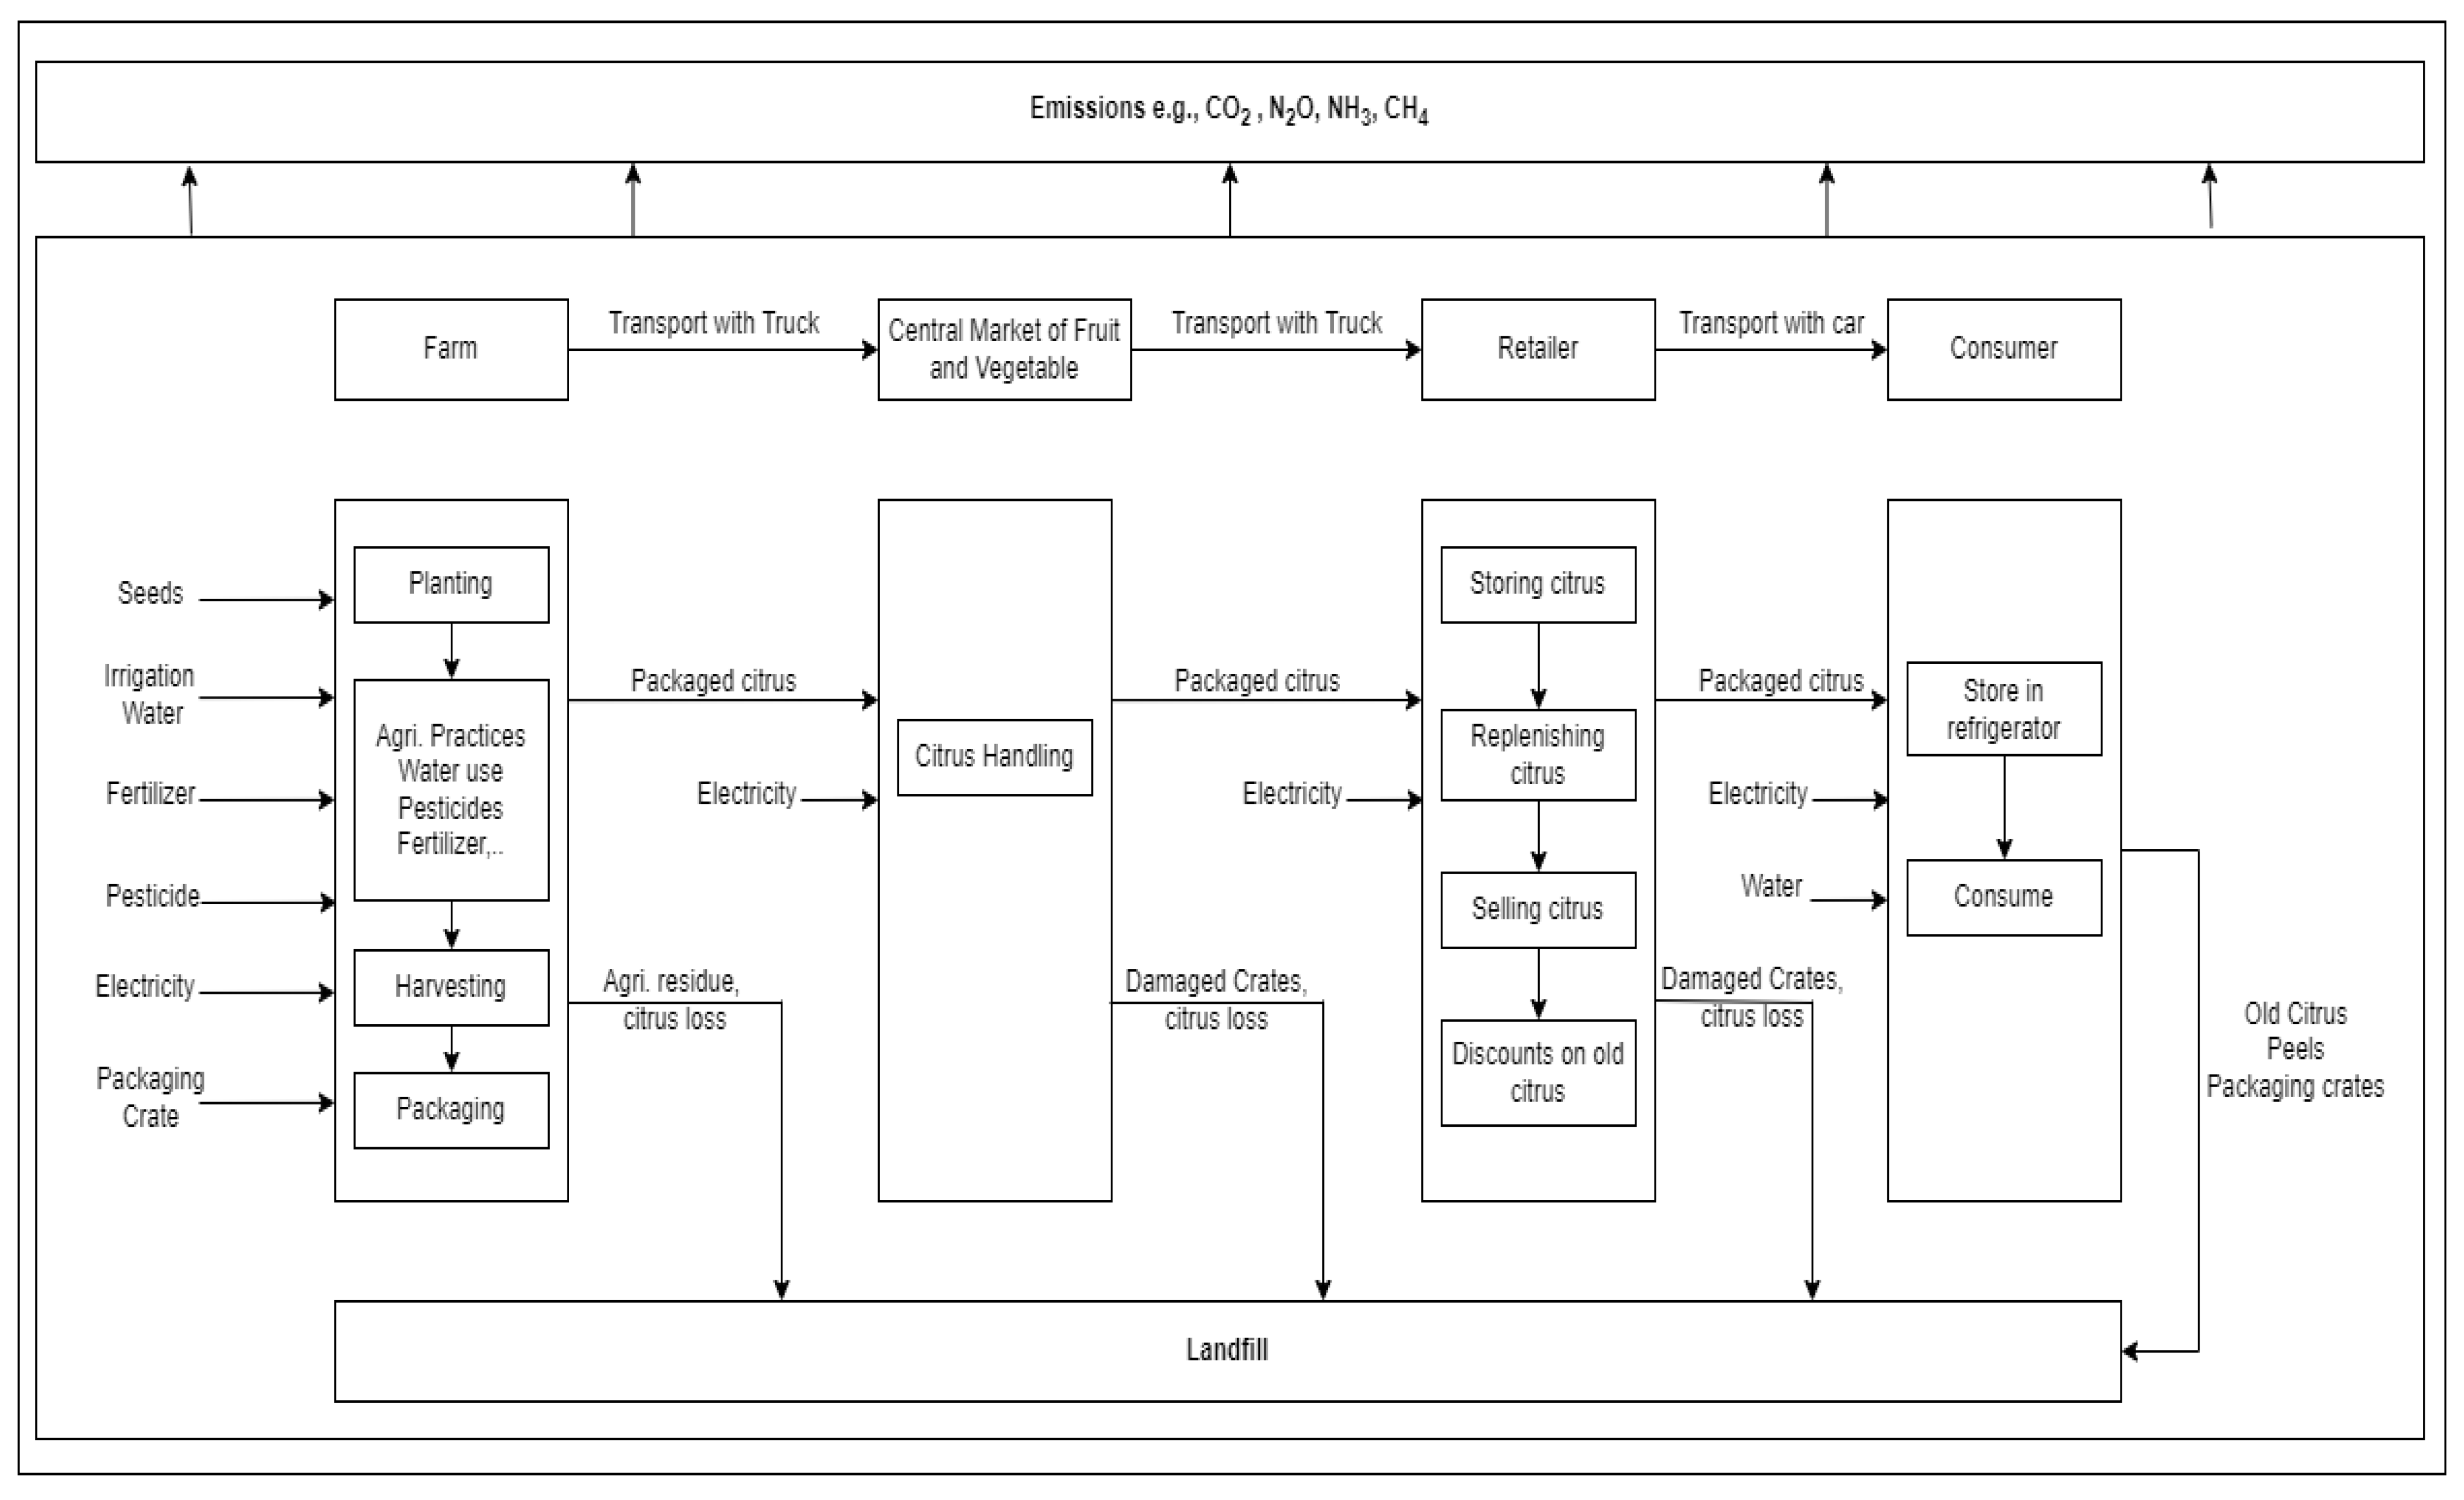
Figure 1. System boundaries of CSC adopted to implement LCA on packaging crates.
Sustainability 14 12644 g001
Figure 2. (a) Empty polystyrene crate (drawn by the authors), (b) stacked filled with citrus PS crates (taken by the authors), (c) stacked filled with citrus PP crate (taken by the authors).
Sustainability 14 12644 g002
Figure 3. 5.8-ton truck used to transport citrus from farm to the CMFV (drawn by the authors).
Sustainability 14 12644 g003
Figure 4. Relative contribution of CSC stages to the environmental impact, based on the functional unit, where (AE) represent distances of 0 km, 40 km, 70 km, 100 km, and 140 km, respectively.
Sustainability 14 12644 g004
Figure 5. Total citrus loss and waste generated through the supply chain, including packaging waste and the inedible parts, based on the functional unit and distance of travel.
Sustainability 14 12644 g005
Table 1. Loss% of citrus transported to the CMFV with reference to the distance traveled.
ScenarioLoaded CratesTotal Crate WeighLayers of Crates Loaded in the TruckLoss% with Reference to
Distance Traveled (km)
04070100140
S1: PS4005 kg82.13%11.71%12.33%13.62%15.92%
S2: PP25020 kg50.00%3.90%4.54%4.75%5.11%
Table 2. Material and energy inputs based on the functional unit in both scenarios are based on distance traveled, including transportation from the CMFV to retailers.
0 km40 km70 km100 km14 km
S1S2S1S2S1S2S1S2S1S2
Farm
Citrus (kg)1.241.201.431.281.451.291.471.301.521.30
Crate Production (kg)0.050.210.050.210.050.210.050.210.050.21
Transportation from the farm to the CMFV
≤7.5 tons truck (kg)1.291.411.481.491.501.501.521.511.571.51
Table 3. The amount of waste and reusable crates transported from CM to retailers is based on the functional unit.
0 km40 km70 km100 km140 km
S1S2S1S2S1S2S1S2S1S2
Waste due to loss (kg) (Landfill) in CM0.020.000.120.040.120.050.140.050.160.05
Transportation from CM to retailers
Citrus (kg)1.271.411.371.451.371.461.391.461.411.46
Waste due to loss (kg) (Landfill)0.020.000.120.040.120.050.130.050.160.05
Waste inedible (kg) (landfill)0.300.300.300.300.300.300.300.300.300.30
Crate material
Waste (kg) (Landfill)0.050.000.050.000.050.000.050.000.050.00
Reusable crates to farm (kg)-0.21-0.21-0.21-0.21-0.21
Table 4. Impact assessment results for both scenarios with reference to the distance traveled and functional unit.
0 km40 km70 km100 km140 km
S1S2S1S2S1S2S1S2S1S2
Acidificationmolc H+ eq×10−44.32.65.41.58.31.58.51.58.51.5
Climate changekg CO2 eq×10−11.71.42.01.03.31.03.86.34.56.3
Freshwater ecotoxicityCTUe×10−22.05.62.02.12.32.12.31.22.31.2
Freshwater eutrophicationkg P eq×10−45.85.45.87.96.68.75.98.86.88.9
Land usekg C deficit×10−45.25.25.82.46.11.36.21.46.21.2
Ozone depletionkg CFC-11 eq×10−91.61.51.62.21.62.21.62.21.62.2
Particulate matterkg PM2.5 eq×10−53.35.83.33.35.83.33.35.83.35.8
Water resource depletionm3 water eq×10−31.01.71.03.71.03.71.03.71.03.7
Resource depletionkg Sb eq×10−75.42.14.4−2.74.2−2.73.2−2.72.3−2.7
Table 5. Reduction percentages in the impact categories of both scenarios.
0 km40 km70 km100 km140 km
Acidification−38.6%71.7%81.6%81.9%82.5%
Climate change−16.5%47.7%68.2%83.3%85.9%
Freshwater ecotoxicity−7.6%6.1%7.6%6.2%6.2%
Freshwater eutrophication−7.2%35.8%31.9%48.1%29.9%
Land use0.0%59.3%78.4%77.6%81.0%
Ozone depletion−5.1%43.2 %85.6%85.6%85.6%
Particulate matter76.9%76.8%82.3%82.3%82.3%
Water resource depletion70.6%63.4%63.2%63.2%63.2%
Resource depletion−60.2%160.7%163.4%183.7%216.8%
Publisher’s Note: MDPI stays neutral with regard to jurisdictional claims in published maps and institutional affiliations.