Article

Research on Optimization Method and Algorithm Design of Green Simultaneous Pick-up and Delivery Vehicle Scheduling under Uncertain Demand

1
School of Computer and Information, Qiannan Normal University for Nationalities, Duyun 558000, China
2
Key Laboratory of Complex Systems and Intelligent Optimization of Guizhou Province, Duyun 558000, China
3
Key Laboratory of Complex Systems and Intelligent Optimization of Qiannan, Duyun 558000, China
4
School of Economics & Management, Shaoyang University, Shaoyang 422099, China
5
School of Electric and Information Engineer, Zhongyuan University of Technology, Zhengzhou 450007, China
*
Author to whom correspondence should be addressed.
Sustainability 2022, 14(19), 12736; https://doi.org/10.3390/su141912736
Submission received: 11 September 2022 / Revised: 25 September 2022 / Accepted: 26 September 2022 / Published: 6 October 2022
(This article belongs to the Section Sustainable Engineering and Science)

Abstract

:
In order to solve the problem that the existing low-carbon vehicle scheduling model ignores the economic benefits of enterprises and cannot fully reflect the fuzzy needs of customers, the green simultaneous pick-up and delivery vehicle scheduling problem is studied here. With the goal of minimizing the total cost composed of service cost, fuel consumption cost, and carbon emission cost, a multi-objective comprehensive model of green simultaneous pick-up and delivery under fuzzy demand is established. In order to fully consider the objective uncertainty of customer demand and customer service time, triangular fuzzy numbers are introduced and simultaneous delivery demand is considered. An improved genetic tabu search algorithm is proposed to solve this problem. In the improved GA-TS algorithm, the penalty factor is introduced into the fitness function, the selection operator combined with elite strategy is adopted, and a mutation operator combined with tabu search algorithm is proposed. The Taguchi analysis method is used to obtain reasonable parameter settings of the GA-TS algorithm. Finally, a case study is used to verify the effectiveness of the model and hybrid algorithm. The experimental results show that the proposed comprehensive model can effectively optimize the scheduling of low-carbon simultaneous pick-up and delivery vehicles under fuzzy demand, and the effectiveness and feasibility of genetic tabu search algorithm are verified by comparing the experimental results of different algorithms and different case sizes.

1. Introduction

1.1. Background

With the rapid development of society and economy, the emission of greenhouse gases has increased dramatically. The problem of global warming has become increasingly prominent, and environmental pollution has attracted much attention from countries all over the world [1]. As a highly energy dependent industry, according to relevant statistics, the logistics and transportation industry accounts for 18% of the global total carbon emissions [2]. Under the background of vigorously promoting energy conservation and emission reduction, reasonable vehicle scheduling can not only help enterprises effectively reduce logistics and transportation costs but also help reduce energy consumption, so as to reduce carbon emissions and bring better environmental and economic benefits [3]. The transportation industry is one of the main sources of greenhouse gases, in which logistics transportation accounts for the largest proportion of carbon emissions in the transportation industry, facing huge pressure to reduce emissions. Therefore, it is of great practical significance to reduce carbon emissions in logistics transportation and realize green logistics [4].
At present, the emission of carbon dioxide has become the focus of attention all over the world. The Chinese government has proposed that by 2025, the ecological environment will continue to improve, the total emission of major pollutants will continue to decline. This has posed new challenges to Chinese enterprises, as energy conservation and emission reduction are imperative. In 2020, China’s carbon dioxide emissions were 9893.5 million tons, ranking first in the world. Carbon dioxide emissions accounted for 30.93% of the total global carbon dioxide emissions. The United States’ carbon dioxide emissions were 4432.2 million tons, ranking second in the world [5,6]. Logistics activities are important economic activities, and as major energy consumers and carbon emitters, it is a social responsibility that enterprises must undertake to use advanced energy conservation and emission reduction technologies to reduce the consumption of high carbon energy in logistics activities [7].
The vehicle scheduling problem (VSP) has always been an important problem in logistics distribution activities. To promote low-carbon logistics, the key issue is to effectively realize the optimization of low-carbon vehicle scheduling. For the change of information in the distribution process, logistics enterprises need to timely dispatch vehicles. Unreasonable transportation planning reduces the efficiency of logistics distribution and reduces the competitiveness of enterprises [8]. The vehicle scheduling problem is an effective means to study the rationalization of transportation, while the traditional VRP problem only aims at minimizing the economic cost, which cannot meet the existing low-carbon logistics development concept. Therefore, this study expands the VRP problem, establishes an optimization problem that transforms multiple components into a single objective, and strives to achieve an effective balance between enterprises, society, and the environment, which has important practical value.
At present, there are many studies on the vehicle scheduling of low-carbon simultaneous pick-up and delivery, but vehicle scheduling optimization that comprehensively considers the three important factors of fuzzy demand, low-carbon, and simultaneous pick-up and delivery is still less. However, the current vehicle scheduling problem in logistics enterprises is often a combination of the above three problems. Therefore, this study comprehensively considers the fuzzy needs of low-carbon transportation, simultaneous pick-up and delivery and customers, and sets the customer needs as triangular fuzzy numbers to make the problem more in line with the actual situation. The structure of this paper is as follows: Literature review (Section 1.2) summarizes the current research related to low-carbon vehicle scheduling, makes a horizontal comparison, and proposes the research direction of this paper. Problem description and model construction (Section 2) summarizes the distribution system strategy and the concept of fuzzy demand, introduces triangular fuzzy numbers, and establishes a comprehensive model. Model solving algorithm design (Section 3) summarizes the advantages and disadvantages of traditional algorithms and proposes and defines a genetic tabu search algorithm. The case study (Section 4) verifies the proposed method by designing an actual case and verifies the solution effect of the algorithm by comparing different algorithms. The discussion (Section 5) discusses the case analysis and algorithm comparison experimental results. The conclusion (Section 6) summarizes the conclusions of the paper and the key research directions for the next step.

1.2. Literature Review

1.2.1. The Application of Low Carbon Target Model

At present, the low-carbon research of vehicle scheduling problem has attracted the extensive attention of scholars. Jiang et al. [9] proposed a multi-objective mathematical model to improve transportation efficiency, reduce energy consumption, carbon emissions, and design a multi-objective tabu search (mots) algorithm solution model based on Pareto. Enzo et al. [10] analyzed the logistics performance and carbon dioxide emissions of countries around the world and put forward the concept of low-carbon logistics model. Song et al. [11] analyzed how to achieve the corresponding emission reduction target under the condition of limited total cost input and established the e-commerce low-carbon supply chain decision-making model under three conditions. Li et al. [12] proposed the establishment of a mathematical model based on the cost of low-carbon logistics to achieve the best low-carbon vehicle route. Jiang et al. [13] studied the design of multi-city regional low-carbon logistics network and established a low-carbon logistics model based on the non-budget sharing mechanism. Wang et al. [14] proposed a low-carbon economic operation model of integrated energy system considering carbon capture technology to solve the problem of high carbon emissions in logistics and transportation. Zhu et al. [15] discussed CVRP returning from multiple warehouses from a low-carbon perspective. This problem requires that the carbon emissions of the fleet needed to deliver the goods required by customers be minimized. Zhang et al. [16] introduced the concept low-carbon logistics, converted carbon emissions into carbon emission costs, and established a vehicle scheduling optimization model with low-carbon emission costs as the goal. Yue et al. [17] proposed a low-carbon economic planning model of integrated electricity gas system with high penetration rate of wind power generation for a variety of low-carbon technology models. Zhang et al. [18] studied the problem of low-carbon travel of Chinese rural residents and established a complex system dynamics model of low-carbon rural travel. Yi et al. [19] established a low-carbon positioning vehicle scheduling objective function and formulated a three-stage Stackelberg game model. Wu et al. [20] constructed a ceuc model with dynamic reward and penalty pricing mechanism (drppm). Tomasi et al. [21] established a low-carbon logistics target model for fuel vehicles in order to make carbon emissions proportional to fuel consumption.
It can be concluded from the above literature that the current research on the low-carbon target model is mainly divided into two categories: 1. Optimize vehicle scheduling from the perspective of economic benefits. This research method mainly considers the economic benefits of enterprises to achieve cost reduction and efficiency increase but does not consider environmental benefits. 2: Optimizing vehicle scheduling from the perspective of environmental benefits can promote the sustainable development of enterprises, but it ignores some additional costs in the actual process, resulting in low profits of enterprises. In addition to the above two research directions, with the development of society, new changes have taken place in social needs. At present, customers have higher requirements for vehicle scheduling, such as fuzzy demand problem and simultaneous pick-up and delivery problem. Based on this, for the vehicle scheduling problem, it is necessary to explore a more scientific low-carbon target model from a new perspective, integrate the three elements of economic benefits, environmental benefits, and social needs and consider the constraints of fuzzy demand, carbon emissions, and simultaneous delivery. This is a problem that needs to be studied urgently at present.

1.2.2. The Solutions of Vehicle Scheduling Problems

The solution methods of vehicle scheduling problems are mainly divided into two types, accurate algorithm and approximate algorithm. Precise algorithm usually refers to the algorithm that can find the global optimal solution, such as linear programming method dynamic programming algorithm, etc. [22]. Since the vehicle scheduling problem belongs to NP hard problem, the amount of calculation will increase exponentially with the increase of the problem scale. Therefore, for the solution of large-scale vehicle scheduling problem, scholars mainly use approximate algorithms, such as genetic algorithm (GA) [23] and artificial bee colony algorithm [24], tabu search algorithm, etc. [25]. Zhou et al. [26] studied the optimization of rescue vehicle scheduling and proposed an improved genetic algorithm. Anokić et al. [27] designed two meta heuristic methods, variable neighborhood search (VNS), and greedy random adaptive search program (grasp), to solve the vehicle scheduling problem caused by sugar beet transportation. César et al. [28] proposed an improved genetic algorithm to solve the multi warehouse vehicle scheduling problem. Wen et al. [29] discussed the electric vehicle scheduling problem (e-vsp) and proposed the mixed integer programming formula of e-vsp and the ALNs heuristic algorithm to optimize the scheduling problem. Xu et al. [30] created two artificial ant colonies, one of which is used to minimize the number of vehicles, and the other is used to minimize the total length of the road. Noman et al. [31] proposed a TS algorithm based on the lower bound (LB) solution and the exact algorithm (EA) solution and developed the LB algorithm by reducing the optimization cycle of the optimal solution. The above optimization problems for the vehicle scheduling model generally use a single optimization algorithm to solve the model. However, with the gradual increase of the scale of the solution problem, the single algorithm has certain limitations, such as premature, early convergence, and parameter setting results have a greater impact.
In recent years, scholars have gradually deepened the research on hybrid algorithms to overcome the limitations of a single algorithm. Guo et al. [32] proposed the hybrid tabu search method for the optimization of distribution vehicle scheduling. Asma et al. [33] developed a hybrid method combining genetic algorithm and tabu search meta heuristic. Li et al. [34] improved the ant colony algorithm, introduced the max–min ant system and the ant system based on sorting, and improved the heuristic factor and initialization to study VRPSPD with vehicle travel constraints. Liang et al. [35] studied a hybrid algorithm and applied it to complex multi-product scheduling problems. Pan et al. [36] constructed a multi-objective hybrid algorithm with tabu table embedded to solve the multi-objective VRPSPD problem. The vehicle scheduling problem is a typical combinatorial optimization problem. In terms of solving strategies, the current research direction mainly focuses on analyzing the uncertainty and complexity of the problem and constructing different strategy algorithms to solve it. It is mainly divided into two categories: 1. The genetic algorithm, ant colony algorithm, tabu search algorithm, and other single artificial intelligence algorithms, which can effectively solve vehicle scheduling problems and obtain the optimal solution in the local range, but there are also problems such as poor global search ability and the ease of falling into local optimization. 2. Hybrid algorithms, such as hybrid tabu search method and genetic ant colony, can better overcome the shortcomings of a single algorithm. When solving vehicle scheduling problems, such hybrid algorithms have the advantages of strong global optimization ability and no special requirements for search space. However, there are also problems such as high dependence on algorithm parameter settings and initial solutions. Based on this, for the vehicle scheduling problem, it is necessary to study a hybrid algorithm with strong global search ability and low dependence on parameter settings and initial solutions.

1.2.3. Research Gaps

To sum up, there are three main problems in vehicle scheduling optimization research, fuzzy customer demand, carbon emissions, and simultaneous vehicle pick-up and delivery. However, current research generally only considers one or two of these issues. Limited literature fully considers the characteristics of the three issues. In addition, most of the existing literature converts the carbon emission problem in low-carbon allocation research into a part of the cost and establishes a single-target model with the minimum total cost. However, the comprehensive consideration of fuzzy demand, carbon emissions, and simultaneous pick-up and delivery is an urgent problem to be solved. Accordingly, a vehicle scheduling problem with the overall goal of minimizing carbon emissions, fuel consumption, and total service cost is proposed in this study, through comprehensively considering customers’ fuzzy demands, carbon emissions, and simultaneous pick-up and delivery to create a comprehensive optimization model. In order to solve this problem, an improved hybrid algorithm strategy, the genetic algorithm of tabu search (GA-TS), is proposed to solve this problem. The sub-combination with the elite strategy accelerates the convergence speed, thereby improving the local search ability of the algorithm. Finally, the effectiveness and feasibility of the method adopted in this study are verified by design case verification and comparison between different algorithms. To sum up, the comparison of the existing relevant literature and the research direction of this paper are shown in Table 1.

2. Problem Description and Model Construction

The green simultaneous pick-up and delivery vehicle scheduling problem under fuzzy demand can be described as: the distribution center uses a single type of vehicle to serve customers and meet the customer’s pick-up and delivery demand simultaneously. Each customer can only visit the distribution center once [37,38]. The objective function considers not only the time-related service cost but also the fuel consumption and carbon emission cost, so as to carry out reasonable vehicle scheduling path planning and minimize the total cost. According to the number of distribution centers in the logistics distribution system, VRP can be divided into single distribution center problem and multi distribution center problem. However, in the actual distribution process, there are often multiple distribution centers. For the VRP of multiple distribution centers, which cannot simply use the research ideas and methods of a single distribution center to solve the problem of multiple distribution centers. It is necessary to select appropriate methods to solve the problem on the basis of in-depth research on the VRP of multiple distribution centers, so as to achieve the purpose of reducing the waste of transportation capacity, improving the transportation efficiency, and reducing the carbon emission cost.
For the purpose to simplify the problem, the multi distribution center problem needs to be simplified to a single distribution center problem. Therefore, all distribution centers can be regarded as a whole, all distribution centers can be abstracted into a large distribution center system. The specific information of the customer is known, including customer location, service time, etc.; the maximum loading capacity of the vehicle can meet the two demands of any customer simultaneously; and the total number of trucks can meet the total needs of all customers, each customer is served only once. The distribution center system strategy is only a conceptual abstraction for the problem. It does not need to move the distribution center geographically. It just treats all the distribution centers as a distribution center system when dealing with the problem, as shown in Figure 1.

2.1. Expectation Fuzzy Demand

In practical applications, it is often difficult for customers to give a very accurate demand and pick-up volume. Customers often give a rough range based on experience and take the most possible value in the range, which leads to great ambiguity. For instance, the demand of this month is between 1.0 tons and 1.5 tons, and the most likely value is 1.3 tons. The “randomness” of probability theory research, although the occurrence of the event is uncertain, the result of the event is clear. For example, this event either occurs or does not occur, which is a random event. The customer’s demand and pick-up volume are not clear. There is no exact meaning in quality and no clear boundary in quantity. This fuzzy concept with unclear boundary is fuzzy demand, which is not caused by people’s subjective understanding failing to reach the objective reality but an objective attribute of things. Accordingly, fuzzy mathematics can be used as a tool for research [39].
The fuzzy variables is introduced, sets the demand as a triangular fuzzy number, and converts the fuzzy uncertain demand into a certain value. Let the minimum demand be the lower bound of the triangular fuzzy number a , the maximum demand be the upper bound of the triangular fuzzy number b , and the most likely demand be the middle value of the triangular fuzzy number c . Therefore, customers’ demands i can be expressed as triangular fuzzy numbers ( a i , c i , b i ) . It is a complex problem to deal with uncertain variables. In this study, the expected value A is used to deal with fuzzy requirements A = ( a , c , b ) . It may be set as a triangular fuzzy number 0 < a c b , where the membership function is as follows:
F A ( x ) = ( x a ) / ( c a ) , a x c ( x b ) / ( c b ) , c x b 0 , o t h e r s
where a and b are the lower and upper limits of triangular fuzzy numbers, respectively, and c is the most likely values of triangular fuzzy numbers.
Definition 1:
the center of the expected interval of a fuzzy number A is called the expected value of the number E V ( A ) :
E V ( A ) = E S 1 + E S 2 2
Lemma 1:
let A be a triangular fuzzy number A = ( a , c , b ) with edges f A and g A , and an interval random set S R I ( A ) , then:
E S 1 = c a c f A ( x ) d x
E S 2 = c + c b g A ( x ) d x
From Definition 1 and Lemma 1, the following inference is obtained.
It is inferred that A is a triangular fuzzy number with edges f A and g A , from the geometric meaning of definite integral, the definite integral parts in E S 1 and E S 2 are the areas of triangle Δ a c d and triangle Δ d c b , respectively. Therefore, the expected values are expressed as follows:
E V ( A ) = E S 1 + E S 2 2 = a + 2 c + b 4
Thus, the fuzzy demand is transformed into the expected value.

2.2. Carbon Emission Calculation Method

It is unrealistic to directly measure carbon emissions, which are usually estimated based on fuel consumption. According to the research of Wang et al. [40], fuel consumption is in direct proportion to carbon emission. Assuming that C E is carbon emission, F C is fuel consumption, and ε is fuel emission factor (emission per unit fuel C O 2 consumption), it can be expressed as:
C E = F C × ε
Among them, the fuel emission factors of different fuels are also different. This study refers to the European carbon emission calculation standard, taking ε = 2.63   kg ( L ) , the fuel consumption of a vehicle is not only related to the driving distance but also to the load, speed, model, road conditions, fuel type, air density, etc. Considering different influencing factors, many different fuel consumption calculation models have been produced. Common fuel consumption calculation models include:
(1)
Instantaneous fuel consumption model. The model takes into account the vehicle mass, performance, traction, air resistance, and other factors, which is suitable for the calculation of fuel consumption when the vehicle travels a short distance and the distribution scale is small.
(2)
Four stage model. According to different driving states of the vehicle, the model establishes fuel consumption calculation models under four modes, acceleration mode, deceleration mode, idling mode, and roaming mode. The model is more accurate, but it is still only applicable to the fuel consumption calculation of short distance transportation.
(3)
Integrated model. This model takes more explicit consideration of vehicle parameters, such as engine speed, displacement, friction coefficient, air resistance coefficient, etc. Therefore, the calculation result of the fuel consumption model is relatively accurate. The specific model is as follows:
F R = w ( μ N E + P / η ) λ
P = P t θ + P a c c
P t = ( M a + M g sin α + 0.5 C d A ρ v 2 + M g C r cos α ) v 1000
where F R is the fuel consumption rate; P is the total traction power of the engine; P t is the effective power; ω is the mass ratio of fuel to air; μ is the friction coefficient of automobile engine; η is the efficiency parameter of diesel engine; λ is the calorific value of diesel oil; N is the engine speed; E is the engine displacement; θ is the transmission efficiency of freight cars; M is the total mass of the truck; a is the acceleration of the truck; g is the gravitational acceleration; α is the road slope; C d is the air resistance coefficient; ρ is the air density; A is the windward area of the truck; v is the running speed of the vehicle; C r is the rolling resistance coefficient of freight car; and P a c c is the other power demand of the truck, generally taken as 0.
Logistics transportation mainly adopts large trucks, and the engines used on trucks are mainly national five diesel engines. Take Foton Cummins ISGe5-400 national five diesel engine series as an example, the general values of relevant parameters are shown in Table 2.
Based on the above three models, the application scope of the comprehensive model is wider and the calculation results are more accurate. Therefore, using a comprehensive model to calculate fuel consumption, and then calculate carbon emissions. Assuming that it takes t i j for the vehicle to travel from customer point i to customer point j , the calculation formula of fuel consumption as follows:
F C = F R × t i j / ζ
The carbon emission calculation is publicized as:
C E = F R × t i j × ε / ζ
where ζ is the unit conversion coefficient (converting g / s to L / s ), which usually takes 737.
Based on the above comparative analysis, using the above Equations (10) and (11) to calculate fuel consumption and carbon emissions can obtain relatively accurate values, which can be accurately calculated under different working conditions and can be classified for different vehicle types and fuel types.

2.3. Mathematical Model

The symbols required for the model are as follows:
A : Customer and warehouse set A = { 0 , 1 , , n } , where 0 represents the warehouse;
C : Customer collection C = { 1 , 2 , , n } ;
V : Vehicle assembly V = { 1 , 2 , , K } ;
n : Number of customers;
Q : Maximum load capacity of vehicle;
C s : Service cost per unit time;
C f : Unit fuel consumption cost;
C e : CO2 emission cost per kilogram;
d i : Delivery demand of customer i ;
p i : Pick-up demand of customer i ;
q i j k : Load capacity of vehicle k after visiting i and before visiting j ;
d i j : Distance between customer i and customer j ;
t i : Start time of vehicle service to customer i ;
s i : Service time of vehicle in customer i ;
t i j : Transportation time from customer i to customer j ;
x k j : 0-1 variable, if customer j is served by vehicle k , it is 1, otherwise it is 0;
x i j k : 0-1 variable, if the service from customer i to customer j is provided by vehicle k , it is 1, otherwise it is 0.
Based on the comprehensive carbon emission calculation model, considering the constraints related to the problem of simultaneous pick-up and delivery, the mathematical model is established as follows:
(a)
Total service cost C
C = k = 1 K i = 0 n j = 0 n C s t i j x i j k + k = 1 K i = 0 n j = 0 n C s s i x i j k
(b)
Fuel consumption cost W
W = k = 1 K i = 0 n j = 0 n C f × F C × x i j k
(c)
Carbon emission cost E . The cost of carbon dioxide emission per kilogram is C e , and the calculation formula of carbon emission is as described above, which can be calculated by fuel consumption, so the carbon emission cost of the vehicle in the specific transportation process is as follows [40]:
E = k = 1 K i = 0 n j = 0 n C e × C E × x i j k
The model is created with the goal of minimizing the total cost of service cost, fuel consumption cost, and carbon emission cost. The comprehensive scheduling optimization model is as follows:
min Z = k = 1 K i = 0 n j = 0 n [ C s ( t i j + s i ) + C f × F C + C e × C E ] x i j k
Constraint condition. Equation (16) is the maximum load limit of the vehicle.
i = 1 n d i ~ x k j Q , k V
Equation (17) is the constraint of the pick-up service process, ensuring that the load of each vehicle on any road section shall not exceed the maximum load limit of the vehicle and shall not be negative
0 q i j k Q , i , j A , k V
Equations (18) and (19) indicate that each customer is served only once.
k = 1 K i = 0 n x i j k = 1 , j C
k = 1 K j = 0 n x i j k = 1 , i C
Equation (20) means that customers j can only be served by the same vehicle.
k = 1 K x k j = 1 , j C
Equation (21) indicates that each vehicle can only be used once at most.
i A x 0 i k 1 , k V
Equation (22) indicates that one vehicle can serve multiple customers, while one customer can only be served by one vehicle.
x i j k x k j , k V , i , j C
Equation (23) indicates that the carrying capacity of the vehicle when it departs from the warehouse is equal to the sum of the delivery demand of the customers it serves.
j = 0 n q 0 j k = i = 0 n j = 0 n x i j k d j ~ , k V
Equation (24) means to ensure that the carrying capacity of the vehicle returning to the warehouse is the sum of the pick-up demands of the served customers.
i = 0 n q i 0 k = i = 0 n j = 0 n x i j k p j ~ , k V
Equation (25) indicates that the vehicle must return to the distribution center after completing the task.
j = 0 n x j 0 k = 1 , k V
Equations (26) and (27) indicate that x k j and x i j k are 0–1 variables.
x i j k = { 0 , 1 } , k H , i , j A
x k j = { 0 , 1 } , k H , j C
Equation (15) establishes a comprehensive cost optimization model for vehicle scheduling in a low-carbon environment, including vehicle fixed use costs, depreciation costs, tire consumption costs, driver wages, fuel consumption costs, and carbon dioxide emissions. However, in an actual situation, there are many factors that affect transportation carbon emissions, such as the carrying capacity, driving distance, road conditions, vehicle types, and driving speed, etc. Equations (16)–(27) are used to realize the scheduling optimization comprehensive model as closely as possible to the actual situation with constraints, so as to achieve the most ideal optimization effect.

3. Model Solving Algorithm Design

The research method can be divided into two stages as a whole. The first stage is to abstract multiple distribution centers into a distribution center system. In the second stage, according to the actual needs of customers, including simultaneous pick-up and delivery demands and fuzzy demands, a comprehensive optimization model is established with the optimization of service costs and carbon emissions as the optimization objectives, and a hybrid algorithm is used to solve the model. The most valuable scheduling results are output and fed back to the logistics enterprise for implementation. The overall framework of this study is shown in Figure 2.
The traditional genetic algorithm is carried out by three operators: selection, crossover, and mutation. Due to the poor local search ability and other defects, the traditional genetic algorithm is often difficult to converge to the global optimal solution [41]. Tabu search algorithm is developed from local search, which is a global step-by-step optimization algorithm. The most important idea of the tabu search algorithm is to mark some objects corresponding to the searched local optimal solution and try to avoid these objects in further iterative search. It can not only prevent unnecessary cycles but also forcibly revisit the visited population optimal solution before accessing other solutions [42]. The contempt criterion in tabu algorithm can make the algorithm search for a better solution in the candidate set and replace the historical optimal solution. Accordingly, the tabu search algorithm with strong local search ability can be combined with genetic algorithm to obtain a hybrid genetic tabu search algorithm. According to the references [43,44,45], there have been many studies using the GA-TA hybrid algorithm for vehicle scheduling and traveling salesman problems. By improving the hybrid algorithm, good results have been achieved. As the selection operation of GA, tabu can obtain the optimal individual of each generation, and the diversity of solution space in tabu algorithm can be improved through the mutation operator in genetic algorithm.
The basic idea of the algorithm is: first, the initial population is obtained by using sweep algorithm and random permutation operator; Then, in the process of evolution, the tabu search algorithm is used to randomly optimize the population individuals, and the optimization results are regarded as reserved elites; finally, the traditional crossover operator is improved to improve the diversity of the population.

3.1. Coding Method and Initial Population Generation

Natural number coding structure is adopted. The vehicle path is expressed as a vector with length n + m + 1 , such as ( 0 , i 1 , i 2 , , i e , 0 , i f , , i k , 0 , , 0 , i p , , i n , 0 ) . Where i j represents the demand point j on a line and 0 represents the distribution center. This study adopts the natural number coding mechanism. The specific coding method is as follows: suppose there are nine customers and three distribution vehicles. First, generate a customer’s random vector 853762149, and then generate a vehicle’s random vector 121312233. The two sets of vectors correspond to each other. The vehicle vector value at the corresponding position of the customer vector is the vehicle serving the customer. The first car serves customer 8, customer 3, and customer 6, the second car serves customer 5, customer 2, and customer 1, and the third car serves customer 7, customer 4, and customer 9. The service sequence is based on the sequence in the random customer vector. Therefore, three lines are obtained after decoding. Vehicle 1 is 8 → 3 → 6, vehicle 2 is 5 → 2 → 1, and vehicle 3 is 7 → 4 → 9.
This coding method ensures that each vehicle can serve multiple customers and is only arranged once, and each customer is only served once by one vehicle. There are two ways to generate the initial solution, random generation, and heuristic generation. The initial solution generated by heuristic is better than generated by random individuals, but the individuals are more concentrated, which makes it easier for the algorithm fall into local extreme points. In order to ensure the diversity of individuals, the initial solutions are distributed as far as possible in the entire solution space, using the method of random generation to generate the initial solution.
For the purpose to improve the quality of the initial population, sweep algorithm and random permutation operator are used to generate the initial population. The steps of sweep algorithm are as follows: using the ray with the origin of the coordinate axis as the starting point, and the origin pointing to the distribution center as the direction. Then scan all demand points in a counterclockwise direction, calculate the angle of each demand point, and arrange it into a circle covering all demand points from small to large. The steps of random full permutation operator are as follows: randomly generate a natural number not greater than the number of demand points and take this as the cut-off point to generate a route with start and end points. Then, according to the load capacity of vehicles, vehicles are allocated to the route to generate a distribution path that meets the constraints. This is repeated until the number of individuals reaches the initial population size.

3.2. Fitness Function

Generally, the solution is judged by solving the fitness value, and then the selection operation is carried out. In view of the characteristics of VRPSPD, considering the loading capacity limit of vehicles, in order to ensure that the total delivery demand of each route, and the load after picking up goods at each customer point will not exceed the maximum load limit of vehicles, avoid generating infeasible paths, this study adds a higher penalty cost to the fitness function. Accordingly, the fitness function is as follows:
f i = 1 z i + M × λ
where z i is the value of the objective function corresponding to chromosome i , M is the sufficiently large penalty cost incurred when the vehicle is overloaded, λ is the excess load (when not overloaded λ = 0 ), and f i is the fitness value corresponding to the chromosome. When calculating the target value, the travel time from the distribution center and back to the distribution center shall be considered. The return load and departure load shall be equal to the customer’s total demand for pick-up and delivery, so as to meet the algorithm constraints. According to the fitness value, individuals with higher fitness value will survive and individuals with lower fitness value will die, solutions with higher cost will be removed from the population, while other solutions will remain.

3.3. Selection Operator

According to the fitness value, the selection operator selects good individuals from old individuals. However, this method can easily lead to a large number of individuals with high fitness, which makes the search scope of the algorithm too limited. Therefore, the improved roulette method [46] in combination with the best retention strategy for selection is introduced. The specific steps are as follows:
Step 1: Sort the population according to the fitness value.
Step 2: Calculate the individual selection probability P i = z ( 1 z ) i 1 , where z = 0.1 1 0.9 n and n are the number of individuals in the population.
Step 3: Randomly generate a selection number x between [ 0 , 1 ] , and calculate the individual i cumulative probability Q i = j = 1 i P j , when the cumulative probability is 1, the operation is stopped. If Q i 1 < x Q , select individual i .
Step 4: Find out the individual with the best fitness in the current population and compare it with the fitness of the best individual so far. If the fitness of the current best individual is better, replace the original best individual. The original best individual replaces the worst individual in the current population.
Step 5: Repeat step 3 and step 4 for n times until a new population is selected.

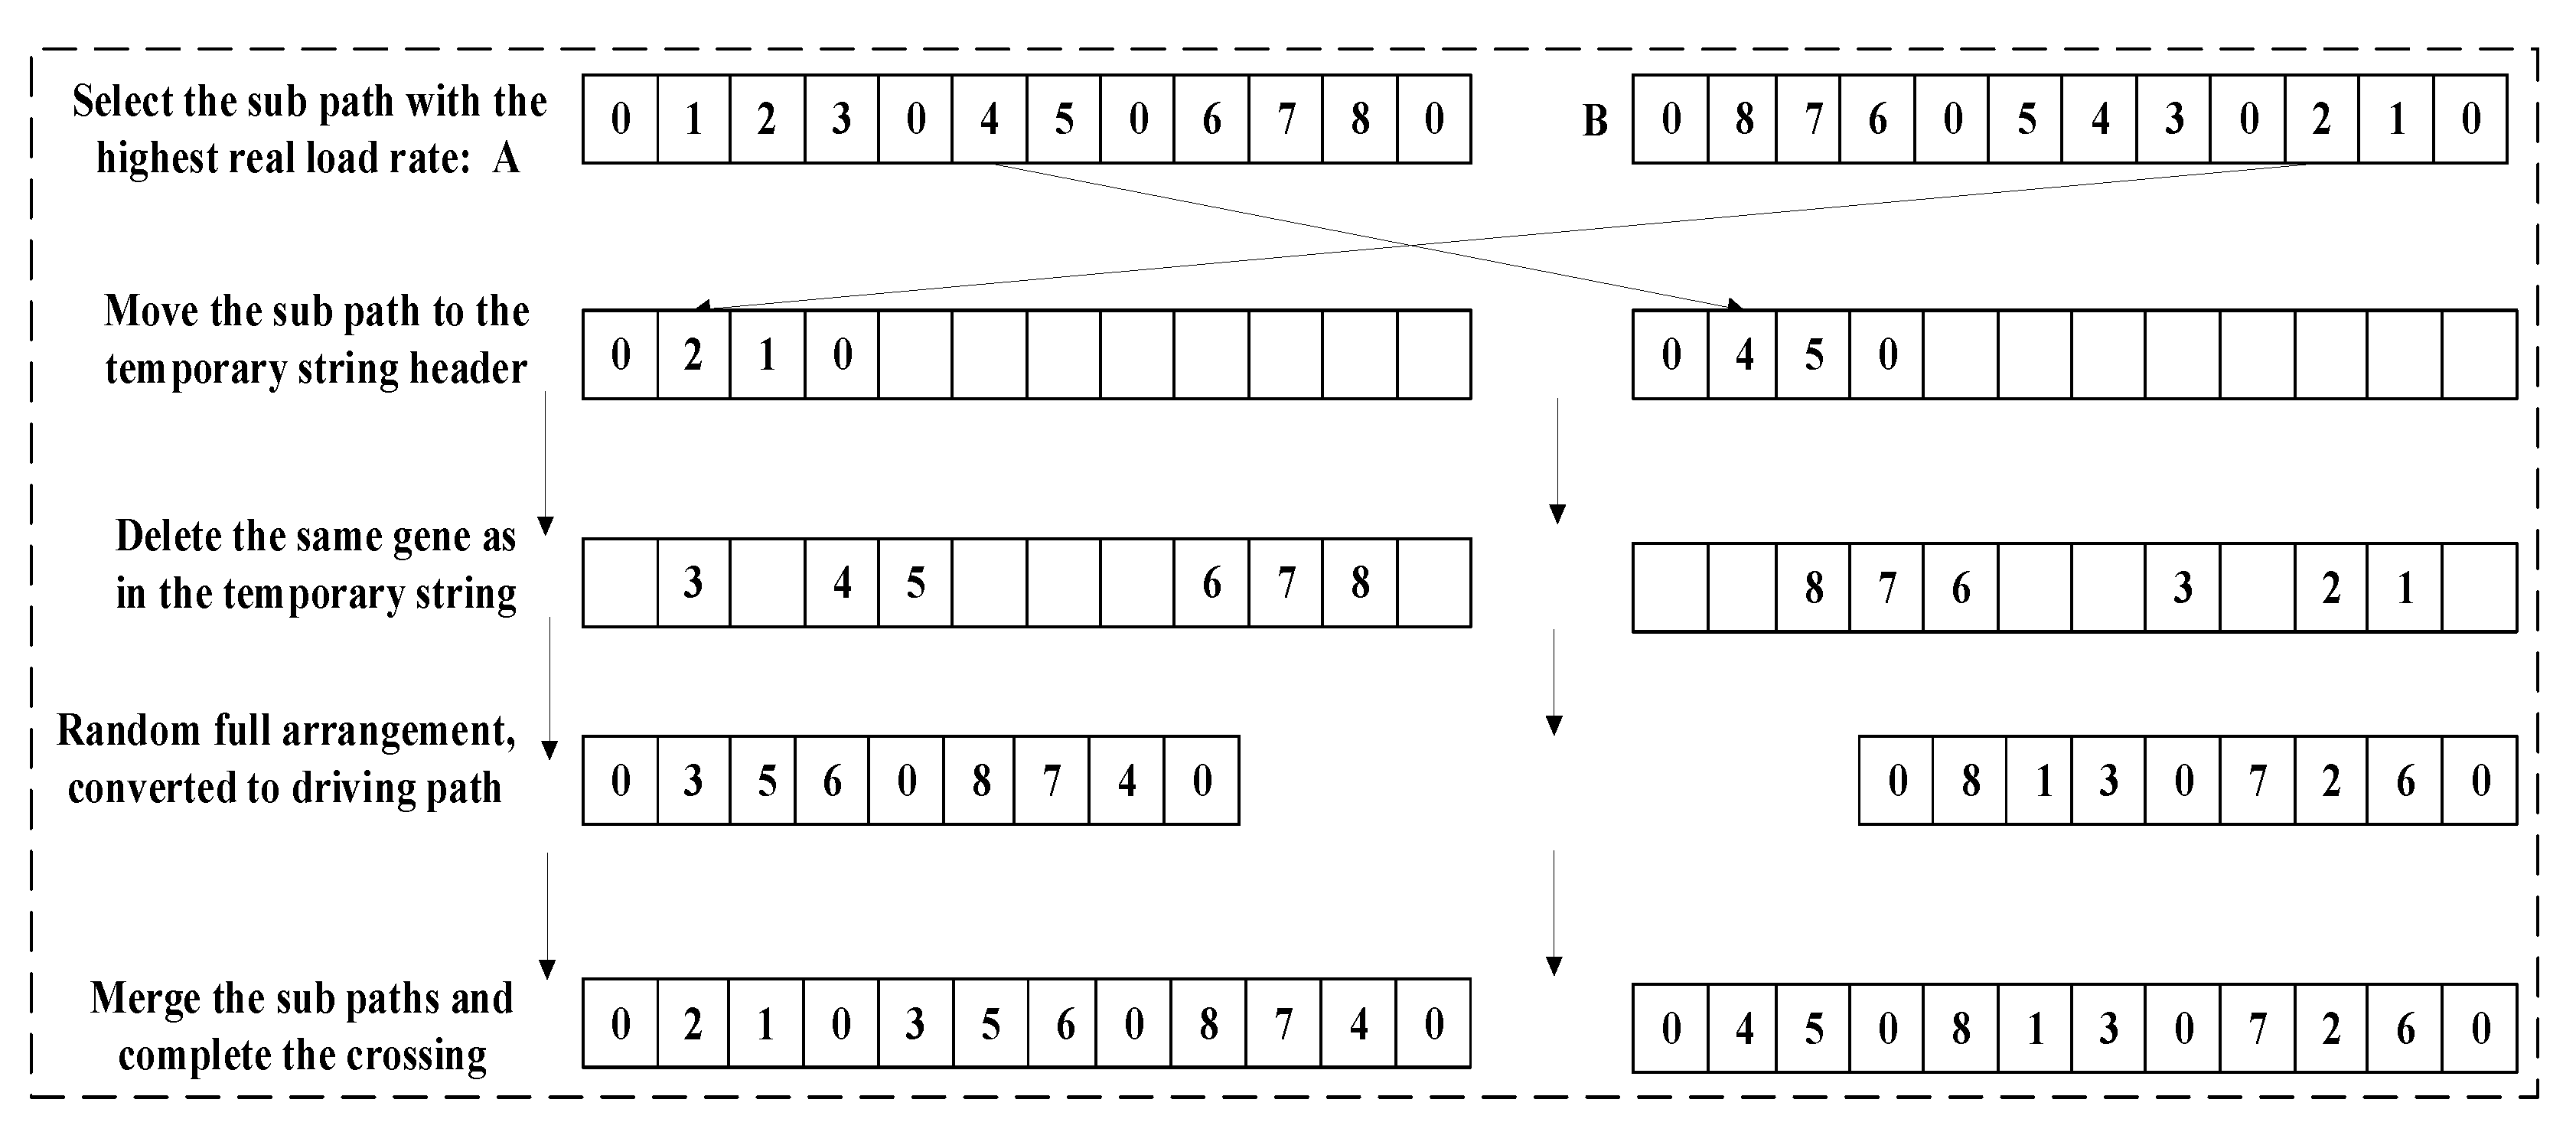
3.4. Crossover Operator

The vehicle scheduling problem has the characteristics of disorder between groups and order within groups. If the traditional crossover operator is used, when the parent individuals are the same, no new individuals can be generated, and the excellent substring will be destroyed [47]. As shown in Figure 3, this study proposes a new crossover operator: first, select the sub-path with the highest vehicle load rate and move it to the first place of the temporary string of another parent individual; second, delete the same gene as the temporary string in the parent; finally, the remaining genes are transformed into driving paths by random permutation operator and merged into temporary strings. A better child path is retained, and when the two parent individuals are identical, new individuals can still be generated.

3.5. Mutation Operator

Mutation operator is closely related to the local search ability of the algorithm. By changing some gene loci on the chromosome, a new chromosome is formed, so as to maintain the diversity of the population, prevent premature convergence, and improve the local search ability of the algorithm. The usual mutation operations include exchange mutation, inversion mutation, insertion mutation and so on, but these basic mutation operations are limited to improve the local search ability. The operation of mutation operator is shown in Figure 4.
Tabu search algorithm has unique memory ability and strong local search ability. Accordingly, this study introduces the tabu idea into genetic algorithm and uses the tabu search algorithm as mutation operator to further improve the climbing ability of the algorithm. The neighborhood function is constructed by the λ exchange method [48]. It can be determined that the defiance criterion is that when a gene motion produces a solution that is better than the current best solution, the motion is accepted as the new current solution, regardless of whether the gene motion is in a taboo state. The specific steps are as follows:
Step 1: Determine the initial solution of the tabu algorithm, and select the better solution generated after the crossover operation as the initial solution X .
Step 2: Neighborhood structure design: use neighborhood function to generate several neighborhood solutions for X and determine candidate solution sets.
Step 3: Judge whether the candidate solution set is empty. If it is not, select the optimal solution S in the candidate solution set, and go to step 4; If yes, then enter the next iteration.
Step 4: Judge whether S meets the contempt criteria. If yes, make X = S and add S to the taboo list; if not, go to step 5.
Step 5: Determine the taboo attribute of S . If S belongs to the taboo list, delete S and return to step 3; if not, make X = S and add S to the taboo list.
Step 6: Set the number of iterations g e n = g e n + 1 and enter the next iteration.
The idea of tabu search is integrated into genetic algorithm to improve the local search ability of genetic algorithm. The specific implementation process of the genetic tabu search algorithm is shown in Figure 5.

4. Case Study

In the part of case study, triangular fuzzy number is introduced to describe the needs of customers, which makes it more in line with the actual situation, and the calculation results are analyzed. Then through the comparison of different algorithms, the rationality of the model and the effectiveness of the algorithm are verified. All heuristic algorithms were executed on ASUS computer (Taipei, Taiwan) using Matlab R2012a (Natick, MA, USA), specifically configured as 1.70 GHz inter ® Coretm i5-4210u processor (Intel Corporation: Santa Clara, CA, United States), 4 GB memory, 64 bit windows 10 operating system.
This case randomly generated 30 customer points through MATLAB, and customer demand is determined based on triangular fuzzy numbers. The customer location coordinates, service time, pick-up volume p i ~ and delivery requirements d i ~ are shown in Table 3. According to the actual situation, the decision-maker determines that six trucks with a weight of 2.5 tons and a load capacity of 6 tons are driving in different distribution centers in the urban area. The Weichai WP2.3 (WEICHAI POWER CO.,LTD: Weifang, China) series engine is used as the truck engine. The acceleration of the truck is 6.7 m/s2, and the road gradient is 30° to 16°. Since the driving speed of the truck in urban areas does not exceed 60 km/h and considering that a light truck has the best fuel economy at the speed of 60 km/h–80 km/h, the driving speed of the truck is set at 60 km/h. The cost part includes service cost and transportation cost (fuel consumption fee and carbon emission fee). In general, the service cost is mainly composed of two parts, the vehicle rental fee and the driver’s salary. Referring to the domestic market, the rental fee of light trucks is usually CNY 360 per day, and the average salary of truck drivers is CNY 720 per day. The working hours usually are 12 h per day. According to the calculation, the vehicle rental fee is 30 CNY/h, and the driver’s salary is 60 CNY/h. Therefore, the service cost is set at 90 CNY/h. The latest diesel price is 6.5 CNY/liter, and the carbon emission price is 0.6 CNY/kg.
In real life, there are many factors that affect the carbon emissions of transportation, such as the carrying capacity of transportation vehicles, the distance traveled, road conditions, vehicle types, and driving speeds. This study refers to carbon emission calculation method of reference [49], and the carbon emission mainly includes: the transported goods production, the raw carbon dioxide, and the carbon dioxide generated by the transport vehicle itself during the transport process. As for the calculation of the carbon emission cost, the carbon emission of light trucks is positively related to fuel consumption, and the corresponding fuel consumption rate is positively related to speed and load capacity. The carbon emission is used as the basis for tax recording in the form of a rated tax rate. The carbon emission cost calculation method in reference [50] can be determined.

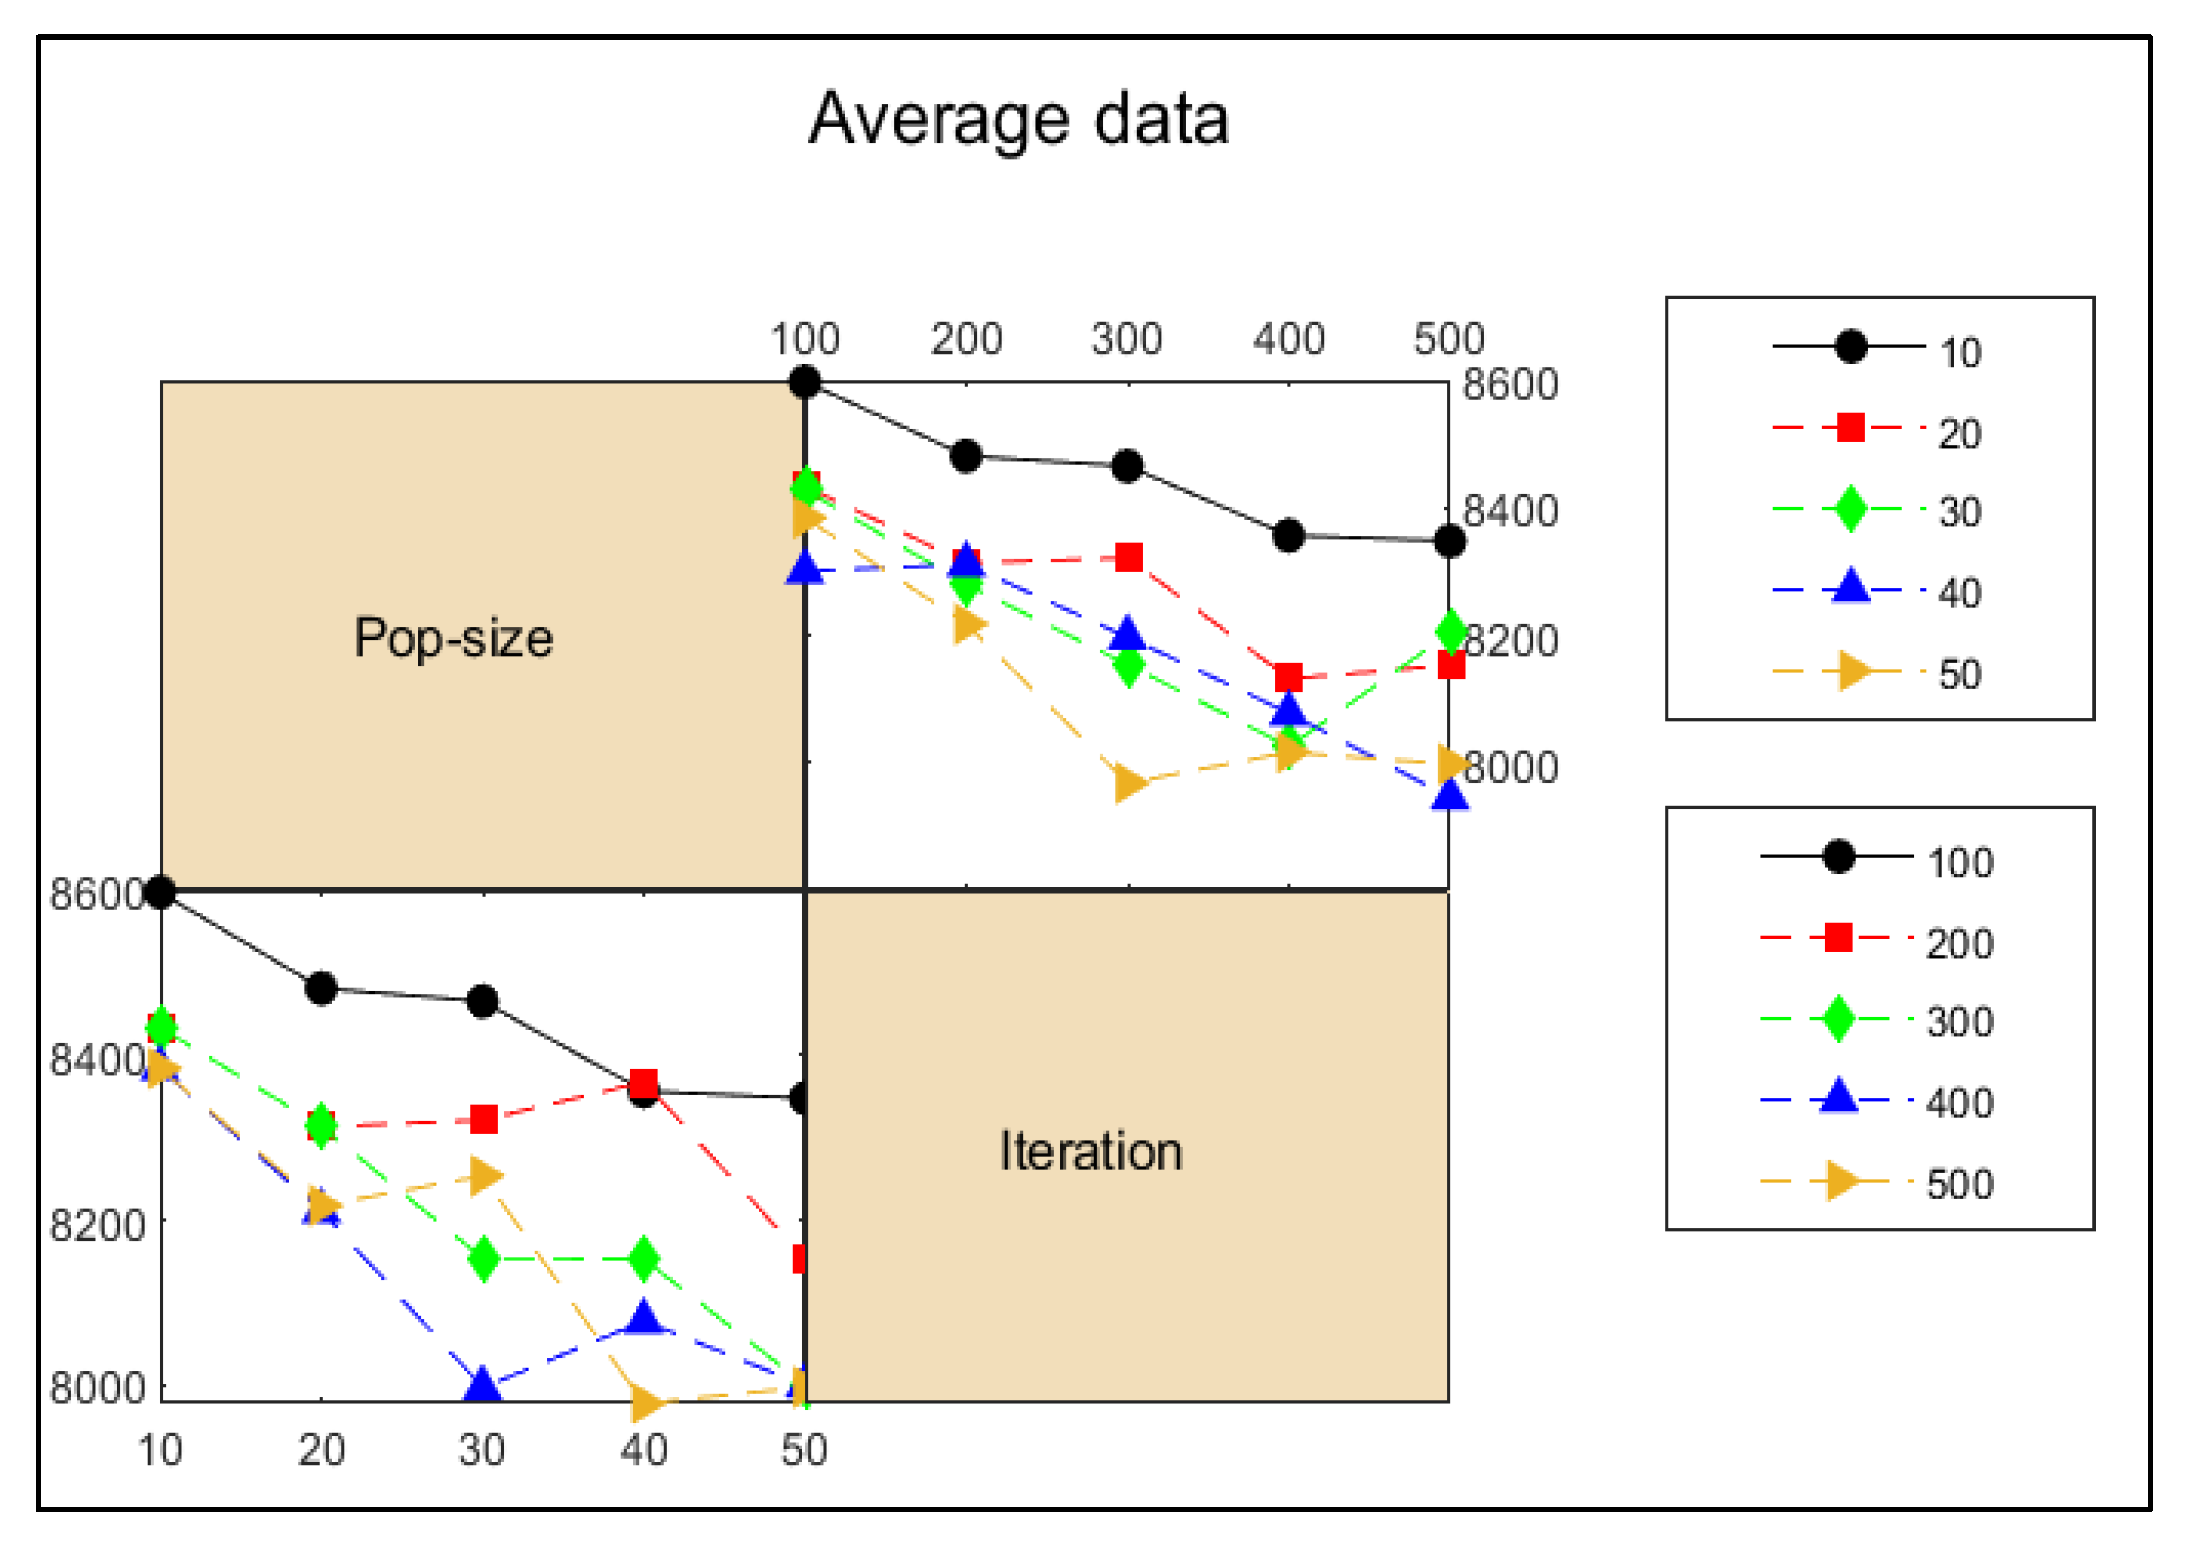
4.1. Parameter Setting of Taguchi Method

The algorithm is very sensitive to the setting of parameters. Different parameter values can determine the effectiveness of the algorithm, so it is essential to determine the reasonable parameter values before running the algorithm. As a meta heuristic algorithm, the parameter setting of genetic algorithm includes iteration times, population size, crossover probability, mutation probability, and so on. According to the previous experience of genetic taboo parameter setting [51,52], the crossover probability is set to 0.85, and the mutation probability is set to 0.15. The optimal iteration times and population size of the algorithm are optimized by the experimental method designed by Taguchi to determine its value.
The Taguchi design method is based on probability and statistics on the basis of an orthogonal test, starting from the concept of cost-effectiveness, which aims to select parameters and design test parameter values through the determination of test purpose and target value. Using limited test times to minimize variation and avoid the influence of uncontrollable noise factors. The tuning parameters obtained through Taguchi’s actual analysis can not only make the output performance of the algorithm reach the target value but also make it have small fluctuation, low sensitivity, and good stability under various conditions [53,54].
Taguchi defines the signal-to-noise ratio (S/N) as the change measure. This transformation method also makes the parameter design robust, and the corresponding signal-to-noise ratio is given by reference [55] as follows:
S / N = 10 × lg ( i = 1 n F t 2 / n )
where n is the execution times of the algorithm at each parameter level and F t is the response value, the objective function value of the t t h experiment. The population size was set as 10, 20, 30, 40, and 50, and the iteration times were 100, 200, 300, 400, and 500. Ten experiments were conducted for each category, and a total of 250 tests were conducted. Then, the Taguchi design is created, and the 250 total cost experimental values generated are used as the response values for Taguchi design analysis. The analysis results are shown in Table 4.
The corresponding signal-to-noise ratio and mean value are shown in Figure 6 and Figure 7.
It can be concluded from Figure 6, when the population size is 40 and the number of iterations is 500, the signal-to-noise ratio is the largest. Similarly, in Figure 7, when the population size is 40 and the number of iterations is 500, the average total cost is the smallest. Therefore, according to the analysis of the Taguchi experiment, the parameter population size is set to 40 and the number of iterations is 500.

4.2. Analysis of Calculation Results

Based on the above data, the algorithm is run 30 times, and the best vehicle scheduling optimization result is obtained. The minimum total cost is CNY 7525.3, the fuel consumption is 254.74 L, and the carbon emission is 667.41 kg. The specific solution results are shown in Table 5, and the optimal scheduling scheme is as follows:
Vehicle 1:22→9→26
Vehicle 2:3→11→17→30
Vehicle 3:4→23→6→2→18→28
Vehicle 4:21→16→27→19→8
Vehicle 5:29→13→24→5→12→14
Vehicle 6:1→10→25→7→20→15
Generally, the longer the travel time, the higher the total cost. However, when comparing vehicle 1 with vehicle 2, it was found that vehicle 1 has less travel time than vehicle 2, but the total cost is higher than vehicle 2. Moreover, vehicle 1 has the least number of customers and the shortest travel time, but its fuel consumption and carbon emissions are higher than those of vehicles 2–4. This is because the total service time of vehicle 1 at the customer point is relatively short (accounting for 45.42% of the total travel time), while the total service time of vehicles 2–4, respectively, accounts for 54.99%, 64.52%, and 56.75%. The driving time of vehicle 1 on the road is relatively long, i.e., 4.17 h, whereas vehicle 2 is 3.52 h, vehicle 3 is 3.74 h, and vehicle 4 is 3.94 h. Therefore, the fuel consumption and carbon emissions of vehicle 1 are higher than those of vehicles 2–4.

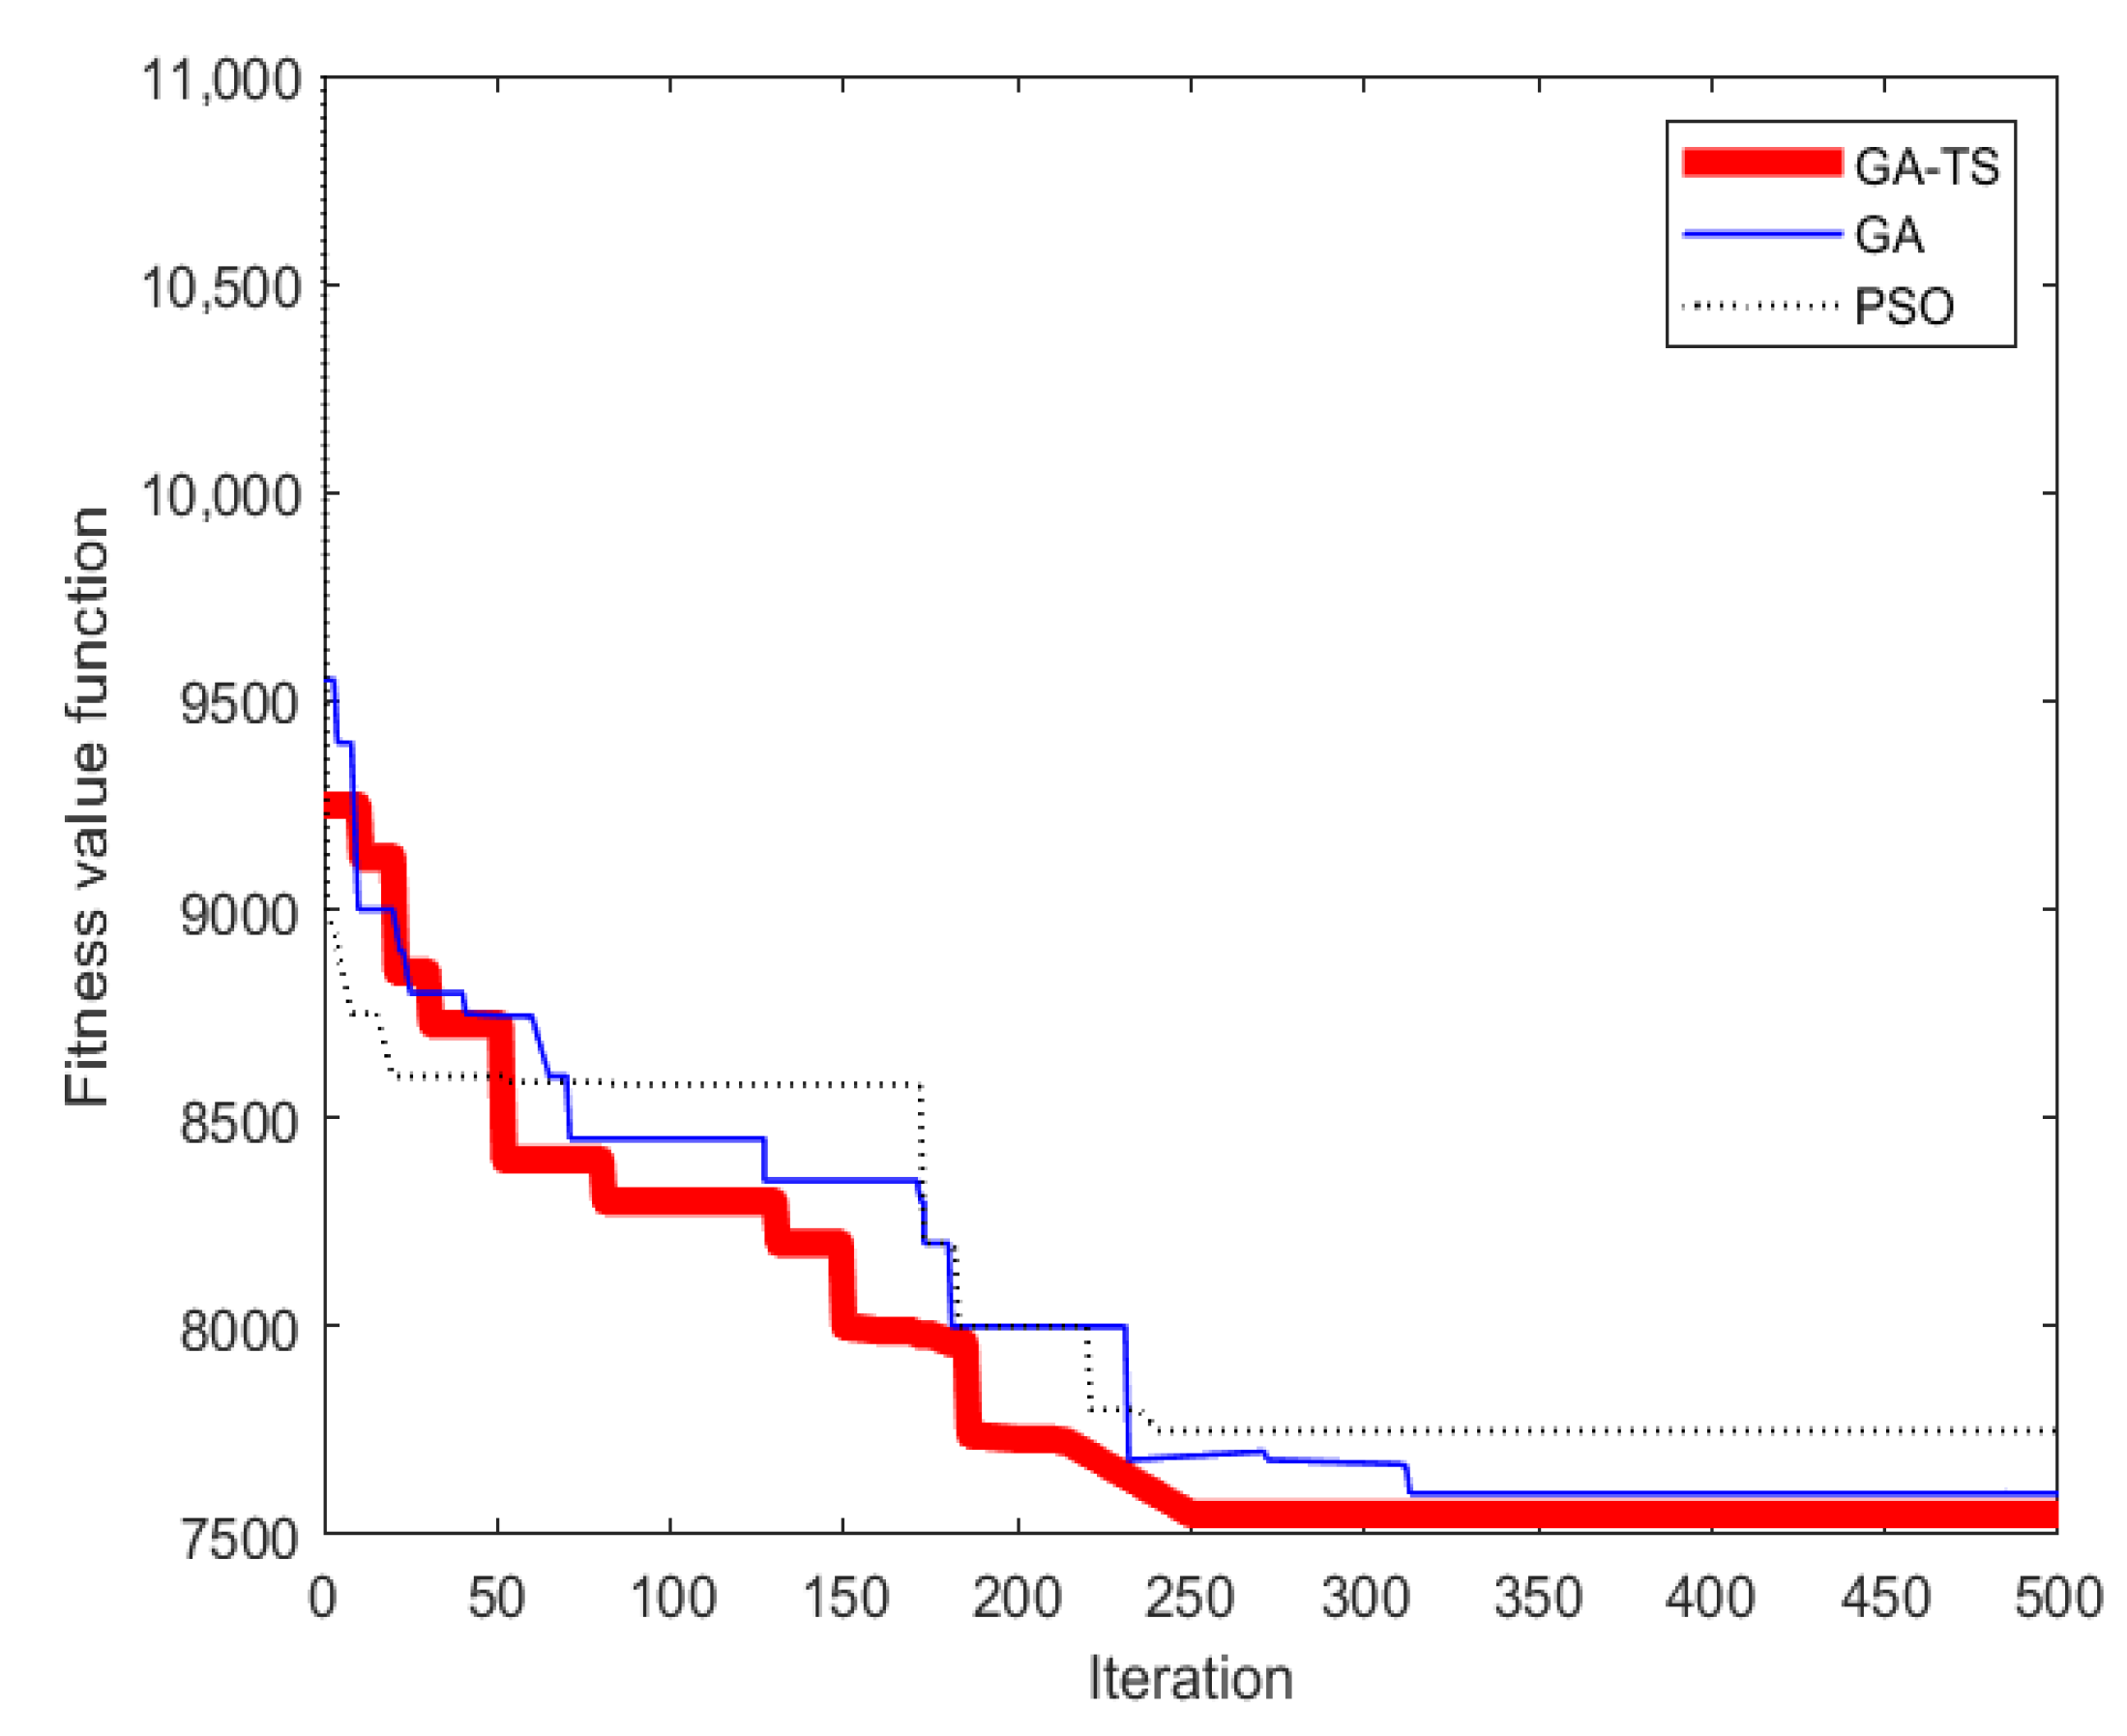
4.3. Algorithm Comparison and Analysis

For the sake of verifying the feasibility and effectiveness of the improved GA-TS algorithm, the genetic algorithm and particle swarm algorithm that have been widely used in solving vehicle scheduling problems were adopted to solve this problem [43]. In addition, considering that different customer sizes have a great impact on the solution performance of the algorithm, in order to verify that the genetic tabu algorithm proposed in this study can effectively solve the number of customer nodes of different sizes, references [56,57] divide customers into three sizes, 30, 60, and 90, and run each algorithm 30 times, respectively, to obtain the optimal solutions of each algorithm, so as to verify the solution performance of the algorithm under the conditions of customers of different sizes. The parameter settings of each algorithm are shown in Table 6, where P is the population size, G is the number of iterations, CP is the crossover rate, MP is the mutation rate, TG is the tabu algebra, CS is the candidate set, TL is the tabu length, W is the inertia weight, and C is the acceleration factor. Take the optimal solution of each algorithm, respectively, and give the iterative effect pictures of three algorithms.
The comparison of algorithm calculation results under different case sizes is shown in Table 7, Table 8 and Table 9. With regard to algorithm comparison and validation, when the number of customers is 30, it can be seen from Table 7 that compared with the traditional genetic algorithm, the optimal solution of this algorithm can reduce the total cost by 1.6%, the carbon emission by 2.2%, and the total travel time by 0.82 h. Compared with the particle swarm optimization algorithm, it can reduce the total cost by 3.4%, carbon emissions by 5.0%, and the total travel time by 1.71 h.
The comparison of algorithm iteration effect is shown in Figure 8.
When the number of customers is 60, it can be seen from Table 8 that the optimal solution of this algorithm can reduce the total cost by 4.8%. Compared with the traditional genetic algorithm, the carbon emission is reduced by 6.7%, and the total travel time is reduced by 5.28 h. Compared with particle swarm optimization algorithm, the total cost can be reduced by 12.7%, carbon emissions can be reduced by 35.4%, and the total travel time can be reduced by 4.19 h.
When the number of customers is 90, it can be seen from Table 9 that compared with the traditional genetic algorithm, the optimal solution of this algorithm can reduce the total cost by 31.1%, and compared with the particle swarm optimization algorithm, it can reduce the total cost by 60.03%. Additionally, compared with the other two algorithms, the GA-TS algorithm also has better comprehensive performance in terms of carbon emissions and travel time, which proves that the algorithm has strong solution performance in the case of a large number of customers, and can still obtain better feasible solutions.
It can be seen from Figure 8 that with the increase of the iterations number, the solution tends to be stable and gradually becomes better. The characteristics of three algorithms are as follows: GA has good solution effect and strong global optimization ability, but it has the problems of long calculation time and slow convergence; PSO solution time is short, but the algorithm can easily fall into a local optimal solution and the mining ability is poor; GA-TS algorithm has better global convergence ability and robustness, and the convergence speed is faster. Therefore, it can be proved that the GA-TS algorithm proposed in this study is effective for solving the model. To sum up, when customers are in different scales, the hybrid algorithm proposed in this study is better than the genetic algorithm and particle swarm optimization algorithm in solving the integrated model. As a consequence, the case study verifies the feasibility and effectiveness of the integrated model and hybrid algorithm in dealing with the green simultaneous pick-up and the delivery vehicle scheduling problem under fuzzy demand.

5. Discussion

Aiming at the problem that economic benefits, environmental benefits, and customer needs are rarely considered comprehensively in the current vehicle scheduling optimization research, this study proposes a vehicle scheduling problem with the overall goal of minimizing carbon emissions, fuel consumption, and total service costs by considering the three factors comprehensively, several discussion can be drawn as follows:
  • There are three main problems in the research of vehicle scheduling optimization: fuzzy customer demand, carbon emissions, and simultaneous vehicle pick-up and delivery. The current research generally only studies one or two of these problems, and few studies fully consider the characteristics of these three problems. In this study, fuzzy customer demand, carbon emissions, and simultaneous vehicle pick-up and delivery are comprehensively considered, and a low-carbon vehicle scheduling model for simultaneous pick-up and delivery is established. Constraints are added according to the actual situation. In view of the quantitative problem of carbon emissions, the carbon emission problem is converted into a part of the cost through calculation, thereby establishing a single objective model with the minimum total cost.
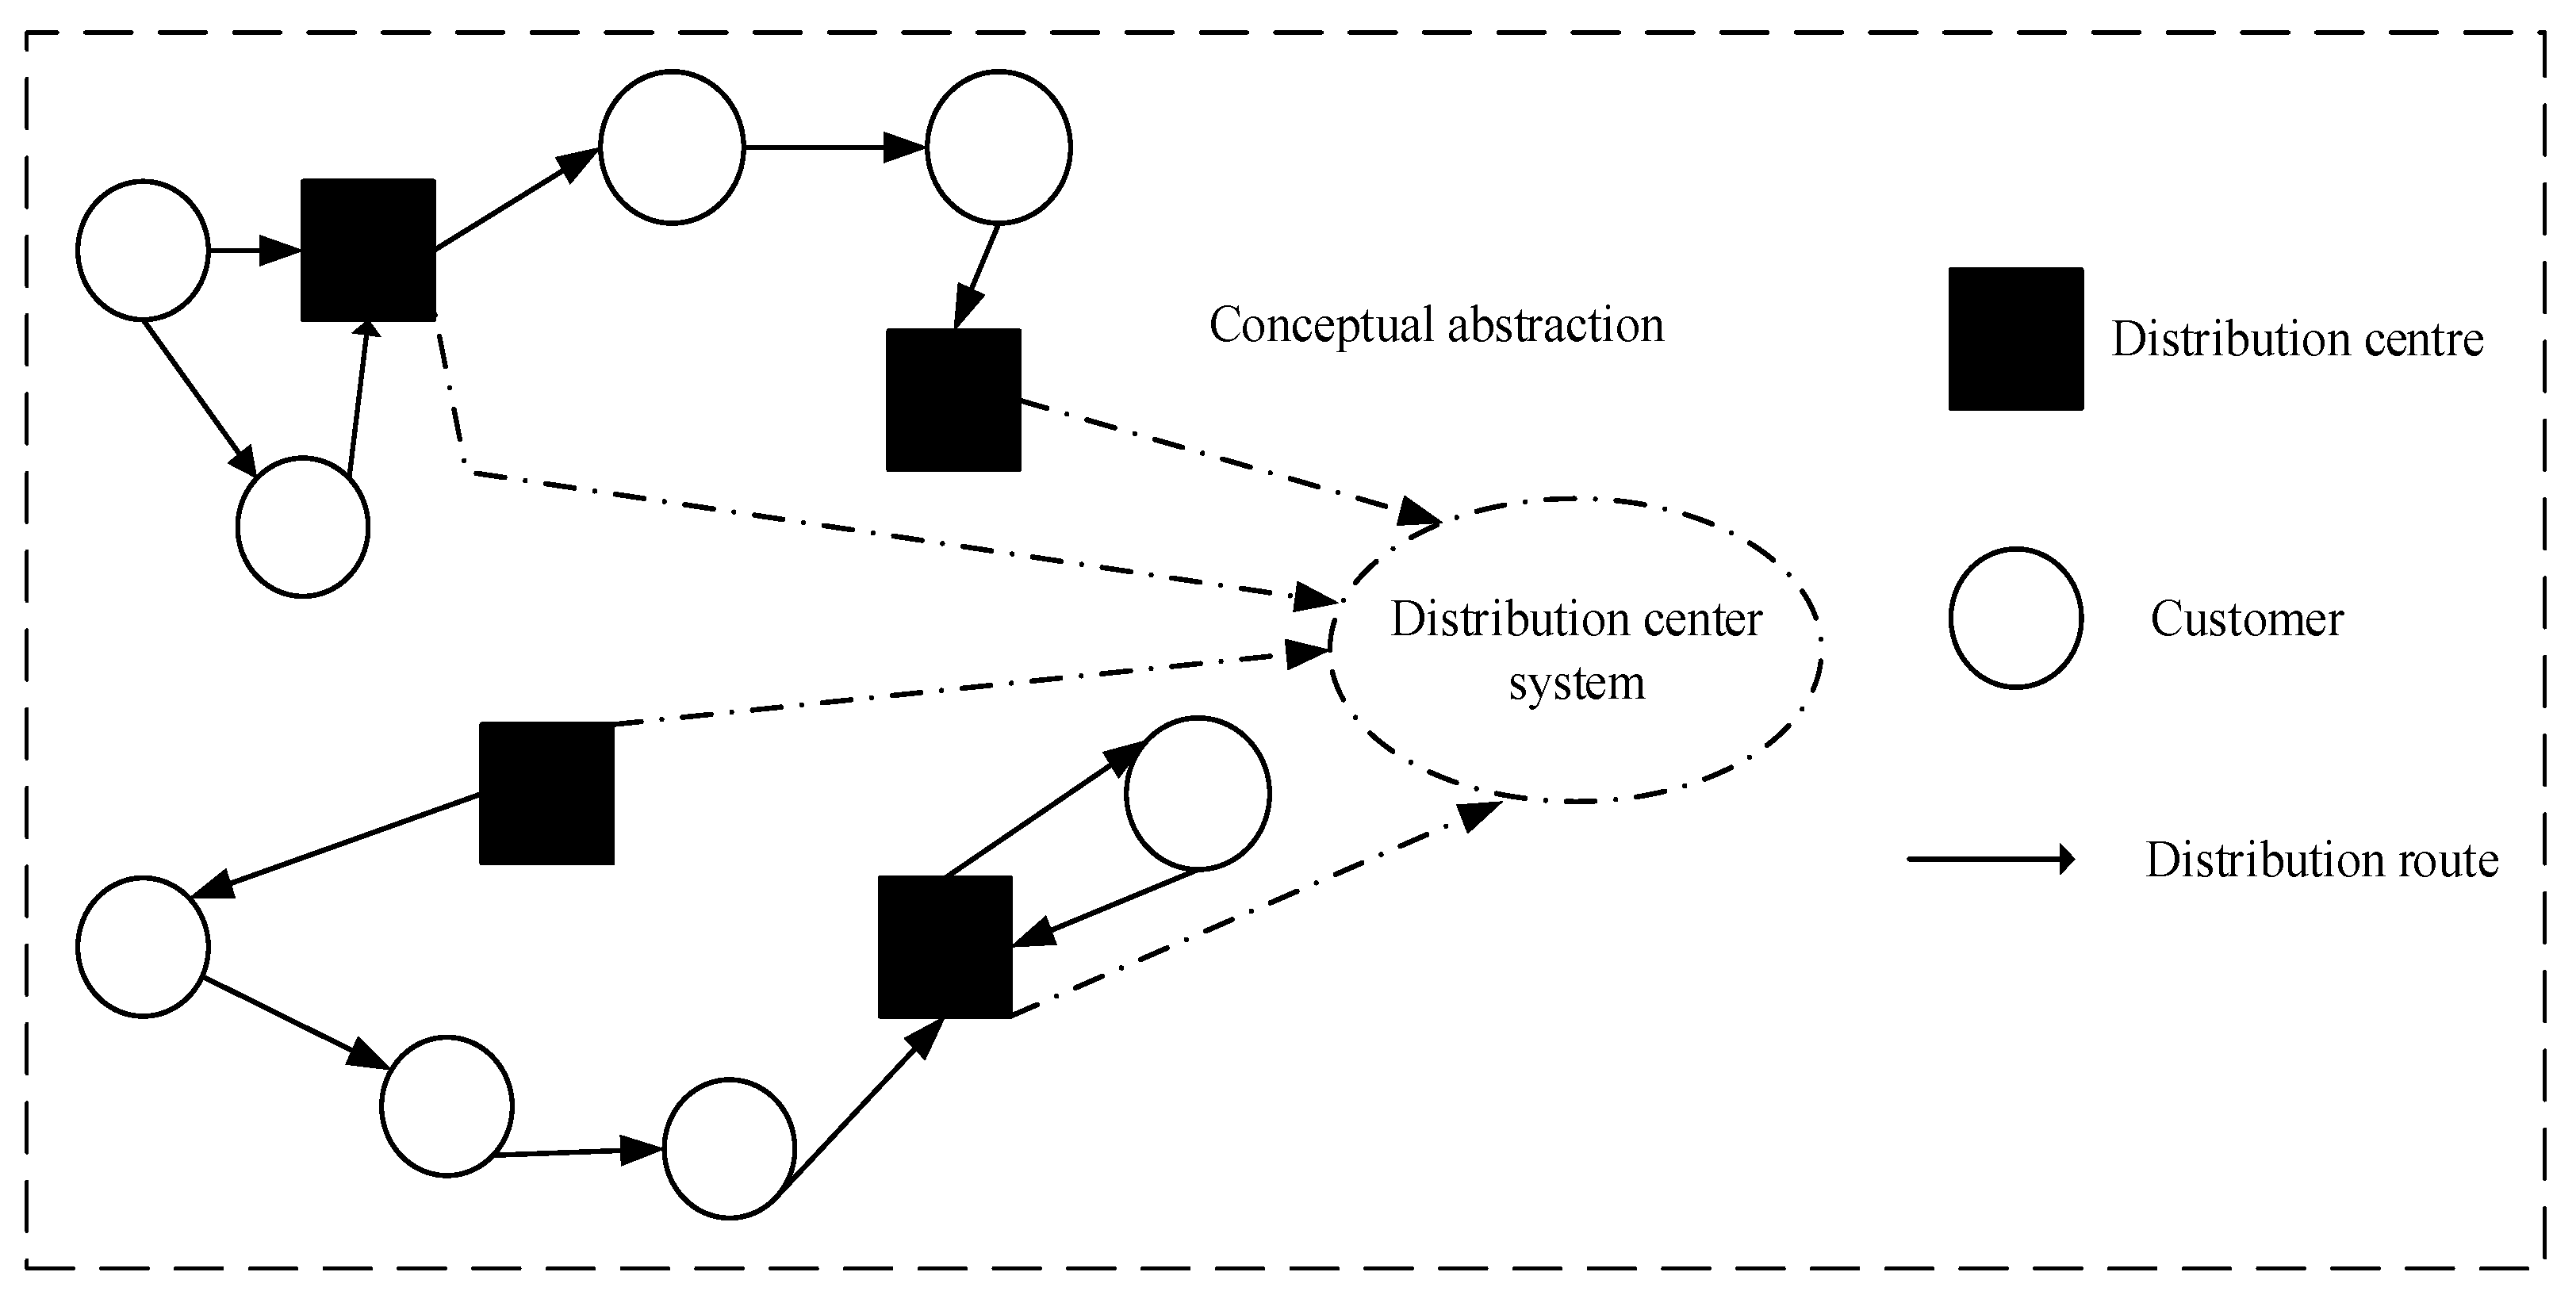
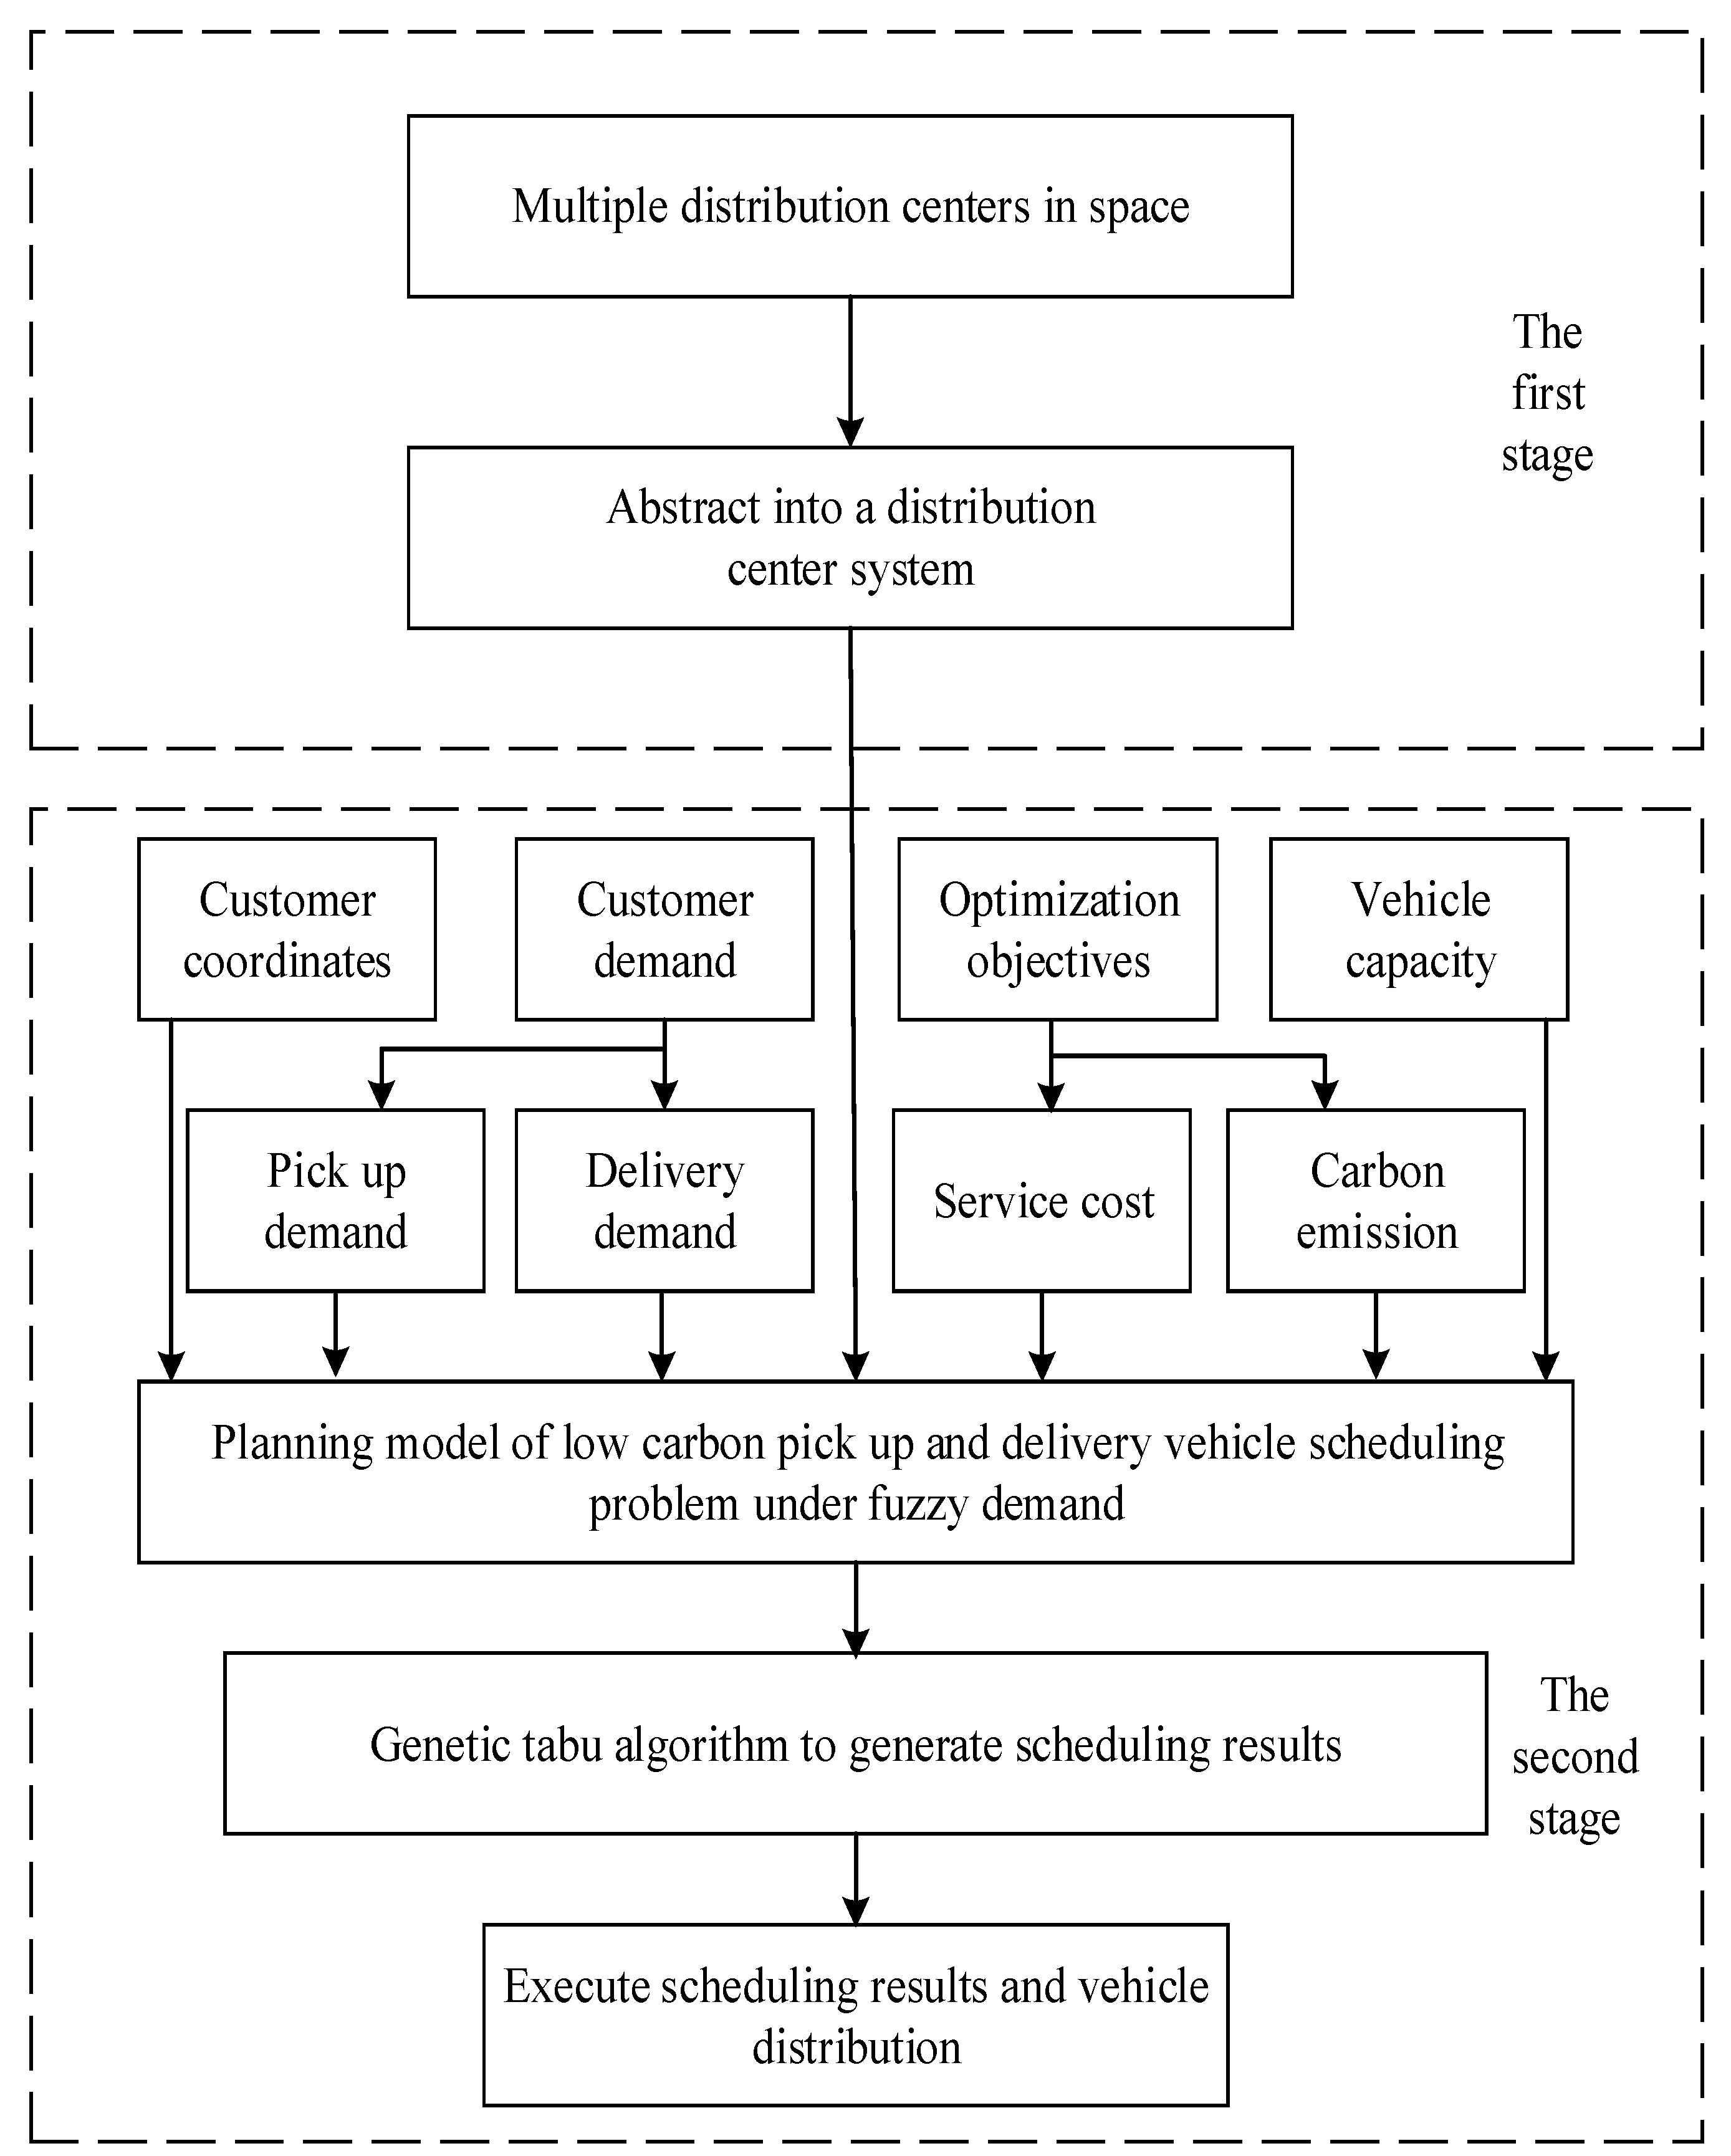
  • In view of the existing problem of multiple distribution centers, the previous research often led to the problem that it was difficult to solve accurately due to the uneven distribution centers. In this study, the strategy of abstracting multiple distribution centers into a distribution center system is proposed, and a multi-objective optimization model of low-carbon VRP with multiple distribution centers picking up and delivering goods at the same time is established, which effectively simplifies the computational complexity of the model.
  • The Taguchi method is introduced to determine the calibration of the algorithm parameters. Compared with previous experience, this study obtains scientific algorithm parameter values through Minitab analysis and obtains the best algorithm parameters via signal-to-noise ratio interaction graph, so as to accurately solve the model. It is proved that Taguchi method is a good parameter calibration method, which provides a certain theoretical reference for the follow-up research on vehicle scheduling.

6. Conclusions

Vehicle scheduling problem is the key link of modern logistics system optimization, which directly determines the customer satisfaction, economic benefits, and carbon emissions of logistics enterprises. Therefore, it is of great significance to carry out optimization research. In recent years, there are three main problems in the research of vehicle scheduling optimization, fuzzy customer demand, carbon emissions, and simultaneous vehicle access. Vehicle scheduling optimization usually considers only one or two of these problems. On this basis, this study proposes a green simultaneous receipt and delivery vehicle scheduling optimization method based on fuzzy demand. Taking these three factors into account, the relevant conclusions can be drawn as follows:
(1)
The economic benefits, environmental benefits, and social needs pursued by logistics enterprises are considered comprehensively. From the perspective of low-carbon vision, the uncertainty of customer demand and customer service time, as well as the problem of picking up and delivering goods at the same time are considered. With the overall goal of minimizing carbon emissions, fuel consumption costs, and service costs, a comprehensive optimization model is created.
(2)
For the vehicle scheduling problem of multiple distribution centers picking and delivering goods at the same time, the “distribution center system strategy” is adopted, and the multi-distribution center problem is assumed to be a single distribution center problem, and the objective optimization model of the multi distribution center simultaneous pick-up and delivery problem is established. The experimental results show that the total travel time of vehicles and fuel consumption are not simply linear and the service time of vehicles at each customer point needs to be considered.
(3)
In order to solve the vehicle scheduling model, an improved hybrid algorithm strategy, the Tabu Search Genetic Algorithm (GA-TS) is proposed. Through the sub-combination of elite strategy, this method accelerates the convergence speed and improves the local search ability of the algorithm. Through the verification of design examples and the comparison between different algorithms, the experimental results show that the improved GA-TS algorithm is superior to the traditional algorithm in solving different customer sizes in terms of solution effect and convergence, thus verifying the effectiveness and feasibility of the hybrid algorithm.
(4)
Taking low carbon as the research goal, and the established model and solution algorithm provide optimization support for logistics enterprises to carry out logistics distribution under the background of green and sustainable development, and also provide some references for relevant government departments to formulate energy conservation and emission reduction policies.
However, this study also has some limitations, which are also the directions that need to be studied in the future:
(1)
Carbon dioxide emissions belong to the theoretical calculation results. In the future, we can collect the carbon dioxide emissions of vehicles in combination with the actual situation and verify the effectiveness of the model and algorithm according to the comparison between the theoretical results and the actual results.
(2)
There is no choice of different types of models according to customer size and customer needs, and there is a lack of time window requirements for customers. Additionally, when solving the fuzzy demand low-carbon simultaneous pick-up and delivery vehicle scheduling model, the GA-TS algorithm is introduced. The mathematical basis of this algorithm, such as asymptotic analysis and the accuracy and scope of application of the solution, which need to be further studied.

Author Contributions

Conceptualization, Y.X., J.Z. and X.Z.; methodology, Y.X. and J.Z.; software, X.Z. and F.Y.; validation, F.Y.; formal analysis, Y.X.; visualization, J.Z. and X.Z.; supervision, J.Z. and X.Z.; project administration, F.Y. and Y.X.; funding acquisition, J.Z., X.Z. and Y.X. All authors have read and agreed to the published version of the manuscript.

Funding

The authors are grateful for National Science Foundation, China (No.s 61862051, 51975432); Natural Science Foundation of Hunan Province, China (No. 2022JJ50244); China Education Department of Hunan Province (No. 21B0695); Project of Hunan social science achievement evaluation committee in 2022 (No. XSP22YBC081); the Science and Technology Foundation of Guizhou Province under Grant (No. [2019]1299); the Top-notch Talent Program of Guizhou province under Grant (No. KY [2018]080); the Program of Qiannan Normal University for Nationalities under Grant (Nos. QNSY2018JS013, QNSYRC201715).

Institutional Review Board Statement

Not applicable.

Informed Consent Statement

Not applicable.

Data Availability Statement

Not applicable.

Conflicts of Interest

The authors declare no conflict of interest.

References

  1. Jiménez, M.; Manuela, G.; Isabel, B. Socio-Ecological Controversies in the News as Trigger of a Model-Based Inquiry Instructional Sequence about the Effect of Global Warming on the Great Barrier Reef. Sustainability 2020, 12, 4676. [Google Scholar] [CrossRef]
  2. Shen, Y.B.; Liu, J.L.; Tian, W. Interaction between international trade and logistics carbon emissions. Energy Rep. 2022, 8, 10334–10345. [Google Scholar] [CrossRef]
  3. Liu, Z.; Tsai, S. Rotary Kiln Thermal Simulation Model and Smart Supply Chain Logistics Transportation Monitoring Management. J. Adv. Transp. 2022, 2022, 2116280. [Google Scholar] [CrossRef]
  4. Yang, Y.F.; Zhang, M.Z.; Lin, Z.Y.; Bae, K. Green logistics performance and infrastructure on service trade and environment-Measuring firm’s performance and service quality. J. King Saud Univ. Sci. 2022, 34, 101683. [Google Scholar]
  5. Kexin, B.; Yang, M.K.; Latif, Z.; Zhou, X.G. A New Solution for City Distribution to Achieve Environmental Benefits within the Trend of Green Logistics: A Case Study in China. Sustainability 2020, 12, 8312. [Google Scholar]
  6. Tsai, S.B.; Wang, K. Using a Novel Method to Evaluate the Performance of Human Resources in Green Logistics Enterprises. Ecol. Chem. Eng. S 2019, 26, 629–640. [Google Scholar] [CrossRef] [Green Version]
  7. Yang, Z.M. The Impact of Economic Growth, Industrial Transition, and Energy Intensity on Carbon Dioxide Emissions in China. Sustainability 2022, 14, 4884. [Google Scholar] [CrossRef]
  8. Chen, K.W.; Dong, F.Y.; Wang, X.S.; Zhu, Y.C.; Chu, X.M.; Kaoru, H. Research on Vehicle Scheduling Problem of Multi Warehouse Collaborative Distribution and Its Application. Sci. Discov. 2021, 9, 401–409. [Google Scholar] [CrossRef]
  9. Jiang, Z.; Chen, Y.; Li, X.; Li, B. A heuristic optimization approach for multi-vehicle and one-cargo green transportation scheduling in shipbuilding. Adv. Eng. Inform. 2021, 49, 101306. [Google Scholar] [CrossRef]
  10. Mariano, E.B.; Gobbo, J.J.; Castro, C.F.; Rebelatto, D. CO2 emissions and logistics performance: A composite index proposal. J. Clean. Prod. 2016, 163, 166–178. [Google Scholar] [CrossRef]
  11. Song, L.; Xin, Q.; Wu, C.M. Pricing Problem in the E-Commerce Low-Carbon Supply Chain under Asymmetric Fairness Preferences. Math. Probl. Eng. 2022, 2022, 3268130. [Google Scholar] [CrossRef]
  12. Li, Y.; Lim, K.; Hu, J.Y.; Tseng, M.L. Investigating the effect of carbon tax and carbon quota policy to achieve low carbon logistics operations. Resour. Conserv. Recycl. 2020, 154, 104535. [Google Scholar] [CrossRef]
  13. Jiang, J.H.; Zhang, D.Z.; Meng, Q. Impact analysis of investment coordination mechanisms in regional low-carbon logistics network design. Transp. Res. Part D 2021, 92, 102735. [Google Scholar] [CrossRef]
  14. Wang, R.T.; Wen, X.Y.; Wang, X.Y.; Fu, Y.B.; Zhang, Y. Low carbon optimal operation of integrated energy system based on carbon capture technology, LCA carbon emissions and ladder-type carbon trading. Appl. Energy 2022, 311, 118664. [Google Scholar] [CrossRef]
  15. Zhu, X.N.; Zhao, Z.Q.; Yan, R. Low Carbon Logistics Optimization for Multi-depot CVRP with Backhauls—Model and Solution. Teh. Vjesn. 2020, 27, 1617–1624. [Google Scholar]
  16. Zhang, Q.Y.; Mai, J.S.; Li, Y.L. Three-stage DEA Model on the Low-carbon Logistics Efficiency in Ten Coastal Provinces of China. J. Phys. Conf. Ser. 2021, 1910, 012032. [Google Scholar] [CrossRef]
  17. Yue, X.; Guo, Y.T.; Wu, G.; Liu, J.Y.; Sun, W.; Lei, Y.T.; Zeng, P.L. Low-carbon economic planning of integrated electricity-gas energy systems. Energy 2022, 249, 123755. [Google Scholar]
  18. Zhang, W.; Zhang, M.Y.; Wu, G.D. How to realize low-carbon travel in rural areas? Evidence from China. Transp. Res. Part D 2022, 105, 103224. [Google Scholar] [CrossRef]
  19. Yi, W.; Zhen, L.; Jin, Y. Stackelberg game analysis of government subsidy on sustainable off-site construction and low-carbon logistics. Clean. Logist. Supply Chain 2021, 2, 100013. [Google Scholar] [CrossRef]
  20. Wu, Y.J.; Shi, Z.Y.; Lin, Z.W.; Zhao, X.; Xue, T.; Shao, J.J. Low-Carbon Economic Dispatch for Integrated Energy System Through the Dynamic Reward and Penalty Carbon Emission Pricing Mechanism. Front. Energy Res. 2022, 10, 843993. [Google Scholar] [CrossRef]
  21. Tomasi, S.; Zubaryeva, A.; Pizzirani, C.; Dal, C.M.; Balest, J. Propensity to Choose Electric Vehicles in Cross-Border Alpine Regions. Sustainability 2021, 13, 4583. [Google Scholar] [CrossRef]
  22. Alexandre, M.F.; Richard, F.H.; Stefan, M. New Exact Algorithm for the Vehicle Routing Problem with Stochastic Demands. Transp. Sci. 2020, 54, 855–1152. [Google Scholar]
  23. Zhu, A.; Bian, B.; Jiang, Y.V.; Hu, J. Integrated Tomato Picking and Distribution Scheduling Based on Maturity. Sustainability 2020, 12, 7934. [Google Scholar] [CrossRef]
  24. Hao, Y.S.; Chen, Z.; Sun, L.; Liang, J.; Zhu, H. Multi-Objective Intelligent Optimization of Superheated Steam Temperature Control Based on Cascaded Disturbance Observer. Sustainability 2020, 12, 8235. [Google Scholar] [CrossRef]
  25. Wang, Y.; Lü, Z.P.; Su, Z.H. A two-phase intensification tabu search algorithm for the maximum min-sum dispersion problem. Comput. Oper. Res. 2021, 135, 105427. [Google Scholar] [CrossRef]
  26. Zhou, Y.; Sun, L.C.; Zhou, X.; Parmar, M.L.; Wang, L.P. An Improved Genetic Algorithm to Optimize Vehicle Scheduling for Relief Efforts. Int. J. Perform. Eng. 2019, 15, 2356–2363. [Google Scholar]
  27. Ana, A.; Zorica, S.; Đorđe, S.; Tatjana, D. Metaheuristic approaches to a vehicle scheduling problem in sugar beet transportation. Oper. Res. 2019, 21, 2021–2053. [Google Scholar]
  28. César, A.M.; Luis, M.E.; Rubén, L.B.; Anand, S. A hybrid algorithm for the multi-depot vehicle scheduling problem arising in public transportation. Int. J. Ind. Eng. Comp. 2019, 10, 361–374. [Google Scholar]
  29. Wen, M.; Linde, E.; Ropke, S.; Mirchandani, P.A.; Larsen, A. An adaptive large neighborhood search heuristic for the Electric Vehicle Scheduling Problem. Comput. Oper. Res. 2016, 76, 73–83. [Google Scholar] [CrossRef] [Green Version]
  30. Xu, W.; Huang, L.; Wang, H. Ant Colony Algorithm and Its Application in the Fruit and Vegetable Wholesale Market in Vehicle Scheduling. Adv. Sci. Lett. 2015, 21, 3384–3387. [Google Scholar] [CrossRef]
  31. Noman, M.; Alatefi, M.; Al-Ahmari, A.M.; Ali, T.; Su, J.F. Tabu Search Algorithm Based on Lower Bound and Exact Algorithm Solutions for Minimizing the Makespan in Non-Identical Parallel Machines Scheduling. Math. Probl. Eng. 2021, 2021, 11421. [Google Scholar] [CrossRef]
  32. Guo, J.J.; Zhang, H.Y.; Sun, G.; Mu, Z.D. Transportation Path Optimization of Modern Logistics Distribution considering Hybrid Tabu Search Algorithm. Adv. Multimed. 2021, 2021, 402246. [Google Scholar] [CrossRef]
  33. Asma, F.; Hatem, H.; Imed, K.; Atidel, B.; Hadj, A. A hybrid genetic Tabu search algorithm for minimising total completion time in a flexible job-shop scheduling problem. Eur. J. Ind. Eng. 2021, 14, 763–781. [Google Scholar]
  34. Li, T.; Yang, W.Y. Supply Chain Planning Problem Considering Customer Inventory Holding Cost Based on an Improved Tabu Search Algorithm. Appl. Math. Nonlinear Sci. 2020, 5, 557–564. [Google Scholar] [CrossRef]
  35. Liang, Z.Y.; Liu, M.; Zhong, P.; Zhang, C.; Wang, X.; Yin, P.Y. Hybrid Algorithm Based on Genetic Simulated Annealing Algorithm for Complex Multiproduct Scheduling Problem with Zero-Wait Constraint. Math. Probl. Eng. 2021, 2021, 1–9. [Google Scholar] [CrossRef]
  36. Pan, J.; Fu, Z.; Chen, H.W. A Tabu Search Algorithm for the Discrete Split Delivery Vechicle Routing Problem. J. Eur. Des. Syst. Autom. 2019, 52, 97–105. [Google Scholar] [CrossRef]
  37. Elgharably, N.; Easa, S.; Nassef, A.; Elf, D.A. Stochastic Multi-Objective Vehicle Routing Model in Green Environment With Customer Satisfaction. IEEE Trans. Intell. Transp. Syst. 2022, 3, 1–19. [Google Scholar] [CrossRef]
  38. Rollieza, G.M.; Dau, T. Research on Optimization of Logistics Vehicle Transportation Path Based on Customer Fuzzy Demand Perspective. Indian J. Public Health Res. Dev. 2019, 5, 1–9. [Google Scholar]
  39. Asif, I.M.; Byung, S.K. A multi-constrained supply chain model with optimal production rate in relation to quality of products under stochastic fuzzy demand. Comput. Ind. Eng. 2020, 149, 106814. [Google Scholar]
  40. Wang, M.X.; Wang, Y.J.; Chen, L.; Yang, Y.Q.; Li, X. Carbon emission of energy consumption of the electric vehicle development scenario. Environ. Sci. Pollut. Res. 2021, 28, 42401–42413. [Google Scholar] [CrossRef]
  41. Coutinho, D.P.; Rodrigues, J.A.; Santos, A.J.; Semiao, V.S. Thermoeconomic analysis and optimization of a hybrid solar-thermal power plant using a genetic algorithm. Energy Convers. Manag. 2021, 247, 114669. [Google Scholar] [CrossRef]
  42. Alotaibi, Y. A New Meta-Heuristics Data Clustering Algorithm Based on Tabu Search and Adaptive Search Memory. Symmetry 2022, 14, 623. [Google Scholar] [CrossRef]
  43. Xue, G.Q.; Wang, Y.; Guan, X.Y.; Wang, Z. A combined GA-TS algorithm for two-echelon dynamic vehicle routing with proactive satellite stations. Comput. Ind. Eng. 2022, 164, 107899. [Google Scholar] [CrossRef]
  44. Thamilselvan, R.; Balasub, D.P. A genetic algorithm with a tabu search (GTA) for traveling salesman problem. Int. J. Recent Trends Eng. 2009, 1, 607–610. [Google Scholar]
  45. Ismail, Z. Solving the vehicle routing problem with stochastic demands via hybrid genetic algorithm-Tabu search. J. Math. Stat. 2008, 4, 161–167. [Google Scholar] [CrossRef] [Green Version]
  46. Zhou, Q.; Lv, Y.J. Research Based on Lee Algorithm and Genetic Algorithm of the Automatic External Pipe Routing of the Aircraft Engine. Int. J. Mech. Eng. Appl. 2020, 8, 40–44. [Google Scholar] [CrossRef]
  47. Yu, X.; Zhu, H.K.; Liang, J.Y.; Słowi, A. Adaptive crossover operator based multi-objective binary genetic algorithm for feature selection in classification. Knowl.-Based Syst. 2021, 227, 38–44. [Google Scholar]
  48. Atthaphon, A.; Masahiro, K. Multi-modal distribution crossover method based on two crossing segments bounded by selected parents applied to multi-objective design optimization. J. Mech. Sci. Technol. 2015, 29, 1443–1448. [Google Scholar]
  49. Kirby, H.R.; Hutton, B.; Mcquaidrw, R.W.; Zhang, X. Modeling the effects of transport policy leverson fuel efficiency and national fuel consumption. Transp. Res. Part D Transp. Environ. 2000, 5, 265–282. [Google Scholar] [CrossRef]
  50. Zheng, Y.L.; Jiang, T.H. Inventory management for one warehouse multi-retailer systems with carbon emission costs. Comput. Ind. Eng. 2019, 130, 565–574. [Google Scholar]
  51. Wei, S.; Deng, J.; Wei, W.; Chen, X. Vehicle Packing Layout Optimization Based on Genetic Taboo Hybrid Search Algorithm. J. Phys. Conf. Ser. 2021, 1910, 012004. [Google Scholar] [CrossRef]
  52. Li, F.M.; Feng, J.; Liu, J.H.; Lu, S.X. Defect profile reconstruction from MFL signals based on a specially-designed genetic taboo search algorithm. Insight 2016, 58, 380–387. [Google Scholar] [CrossRef]
  53. Thokchom, S.S.; Tikendra, N.V. Taguchi design approach for extraction of methyl ester from waste cooking oil using synthesized CaO as heterogeneous catalyst: Response surface methodology optimization. Energy Convers. Manag. 2019, 182, 383–397. [Google Scholar]
  54. Peng, X.H.; Zheng, R.; Liu, J.F. Variable Screening Optimization Algorithm for Mahalanobis-Taguchi System. J. Phys. Conf. Ser. 2022, 2179, 1–17. [Google Scholar] [CrossRef]
  55. Yuan, J.; Yu, B.; Yan, C.X.; Zhang, J.Q.; Ding, N.; Dong, Y.Z. Strategies for the Efficient Estimation of Soil Moisture through Spectroscopy: Sensitive Wavelength Algorithm, Spectral Resampling and Signal-to-Noise Ratio Selection. Appl. Sci. 2022, 12, 826. [Google Scholar] [CrossRef]
  56. Dethlof, J. Vehicle routing and reverse logistics: The vehicle routing problem with simultaneous delivery and pick-up. OR-Spektrum 2001, 23, 79–96. [Google Scholar] [CrossRef]
  57. Nazif, H. Solving job shop scheduling problem using an ant colony algorithm. J. Asian Sci. Res. 2015, 5, 261–268. [Google Scholar] [CrossRef]
Figure 1. Distribution center system strategy.
Sustainability 14 12736 g001
Figure 2. Flow chart of research method.
Sustainability 14 12736 g002
Figure 3. Crossover operator.
Sustainability 14 12736 g003
Figure 4. Mutation operator.
Sustainability 14 12736 g004
Figure 5. Algorithm flow chart.
Sustainability 14 12736 g005
Figure 6. Signal-to-noise ratio interaction diagram.
Sustainability 14 12736 g006
Figure 7. Mean interaction diagram.
Sustainability 14 12736 g007
Figure 8. Comparison diagram of algorithm iteration.
Sustainability 14 12736 g008
Table 1. Compare and summarize existing studies.
Research ProblemFuzzy DemandCarbon EmissionPick up and Deliver SimultaneouslySingle AlgorithmHybrid AlgorithmReference(s)Published Year
Low carbon routing problem [10,11]2021, 2016
Vehicle routing
problem with simultaneous pick-up and delivery
[12,15]2020, 2020
Low carbon pick-up and delivery vehicle scheduling under fuzzy demand [13,14]2021, 2022
Pick-up and delivery vehicle scheduling under fuzzy demand [24,25]2020, 2021
A hybrid algorithm is considered to solve the pick-up and delivery vehicle scheduling with fuzzy demand [32,36]2021, 2019
Table 2. Model parameter values.
ParameterMeaningValue
W Mass ratio of fuel to air1
M Automobile   engine   friction   ( k J / ( r L ) ) 0.2
η Efficiency parameters of diesel engine0.8
λ Diesel   calorific   value   ( k J g 1 ) 43
N Engine   speed   ( r s 1 ) 35
E Engine   displacement   ( L ) 6
θ Transmission efficiency of freight cars0.4
g Gravitational   acceleration   ( m / s 2 ) 9.8
C d Air drag coefficient0.7
ρ Air   density   ( k g / s 2 ) 1.2041
A Windward   area   of   freight   car   ( m 2 ) 3.921
C r Rolling resistance coefficient of freight car0.01
Table 3. Customer information sheet.
Customer PointCoordinate XCoordinate YService Time/hDelivery Demand/tPick-up Demand/t
178.6990.230.61(1.38, 1.45, 1.49)(0.027, 0.038, 0.079)
221.3991.181.28(0.59, 0.75, 0.91)(0.010, 0.016, 0.039)
365.8918.960.58(0.57, 0.69, 0.65)(0.047, 0.054, 0.079)
434.0959.210.54(0.79, 1.00, 1.72)(0.035, 0.040, 0.082)
596.2296.751.12(0.49, 0.53, 0.76)(0.059, 0.066, 0.085)
623.1896.340.61(0.84, 0.86, 1.52)(0.056, 0.065, 0.091)
796.1253.661.54(0.86, 0.97, 1.25)(0.058, 0.059, 0.104)
881.1222.661.58(1.21, 1.28, 1.65)(0.005, 0.008, 0.018)
947.8791.481.39(0.88, 0.94, 1.27)(0.012, 0.016, 0.036)
1081.2896.330.65(0.76, 0.87, 1.02)(0.029, 0.036, 0.052)
1168.0911.281.29(1.00, 1.06, 1.53)(0.050, 0.053, 0.081)
1286.4193.361.25(0.98, 1.13, 1.58)(0.056, 0.068, 0.091)
1371.1278.181.69(0.87, 1.04, 1.12)(0.038, 0.044, 0.069)
1477.8145.211.32(0.64, 0.77, 1.16)(0.048, 0.069, 0.132)
1568.7725.341.53(0.54, 0.61, 0.80)(0.047, 0.051, 0.128)
1673.5812.791.08(0.79, 1.00, 1.49)(0.065, 0.076, 0.168)
1732.9113.191.05(0.61, 10.63, 1.14)(0.039, 0.039, 0.106)
1818.7383.271.53(0.47, 0.49, 0.63)(0.026, 0.031, 0.062)
1972.6738.530.58(1.04, 1.13, 1.62)(0.010, 0.015, 0.036)
2094.4812.990.59(0.63, 0.69, 0.84)(0.046, 0.051, 0.086)
2149.4844.280.71(0.79, 0.86, 1.18)(0.049, 0.066, 0.125)
2277.8980.541.02(1.00, 1.14, 1.47)(0.039, 0.045, 0.066)
2325.8653.091.59(0.76,0.84,0.95)(0.007,0.012,0.045)
2449.1067.181.53(1.19,1.19,1.41)(0.017,0.024,0.048)
2572.8876.920.58(0.69,0.84,1.13)(0.009,0.013,0.041)
2633.8671.161.01(0.97,1.05,1.64)(0.021,0.027,0.081)
2768.9924.861.19(1.00,1.15,1.54)(0.033,0.039,0.084)
2819.7554.831.03(0.77,0.89,1.14)(0.045,0.056,0.083)
2995.3439.631.33(0.44,0.49,0.66)(0.027,0.035,0.100)
3061.6730.121.31(0.65,0.79,1.05)(0.074,0.088,0.114)
Table 4. Analysis results of Taguchi design.
Pop-SizeIterationSignal to Noise RatioMean ValueStandard DeviationLogarithmic
Standard Deviation
10100−78.67758587.36145.3134.87575
200−78.56088479.10188.1315.22181
300−78.54468468.22186.8095.22415
400−78.43188349.47159.8415.08328
500−78.43298348.82198.8675.28318
20100−78.51258439.61205.1415.22313
200−78.37748323.24183.6285.21244
300−78.40468319.29167.9815.12374
400−78.20448132.91168.6685.12684
500−78.22798149.80180.1905.28301
30100−78.51398427.06173.3915.15445
200−78.35168277.72202.2175.30824
300−78.22738149.76135.2864.80711
400−78.08428024.19317.0785.65233
500−78.27398103.70262.4895.46304
40100−78.37548300.50276.1745.71103
200−78.38418312.24175.5365.15718
300−78.26598189.81233.4735.44364
400−78.13688068.73178.7525.17635
500−78.00497945.59212.1145.30767
50100−78.52528379.9775.9294.31994
200−78.37188218.54232.4845.44686
300−78.21797967.04188.6085.24548
400−78.08518015.43163.3325.08583
500−78.27397998.74256.6175.54151
Table 5. Optimal solution results.
VehicleTravel Time (h)Service Duration (h)Total Cost (CNY)Oil Consumption (L)Carbon Emission (kg)Outbound Load (t)Load Change after Serving Each Customer (kg)
16.843.51982.337.7998.153.342.19, 1.24, 0.11
27.794.29949.231.2881.243.392.79, 1.69, 1.01, 0.26
310.536.791223.835.4391.235.284.11, 3.26, 2.29, 1.63, 1.14, 0.26
49.225.211124.737.7798.225.744.88, 3.99, 2.879, 1.59, 0.25
514.598.291799.259.25156.835.454.88, 4.01, 2.79, 2.28, 1.12, 0.35
610.095.611415.351.13135.255.664.25, 3.39, 2.53, 1.56, 0.88, 0.31
Table 6. Algorithm parameter settings.
AlgorithmPGCPMPTGCSTLWC
GA-TS405000.850.1550203--
GA405000.850.15-----
PSO40500-----0.91.5
Table 7. Comparison of calculation results of 30 customer algorithms.
AlgorithmPTotal Cost (CNY)Carbon Emissions (kg)Travel Time (h)
GA-TS67424.3665.3160.75
GA67539.7679.3861.55
PSO67681.6701.7762.48
Table 8. Comparison of calculation results of 60 customer algorithms.
AlgorithmNumber of VehiclesTotal Cost (CNY)Carbon Emissions (kg)Travel Time (h)
GA-TS1216,721.61614.89131.88
GA1217,568.51712.93137.43
PSO1218,894.32164.88136.23
Table 9. Comparison of calculation results of 90 customer algorithms.
AlgorithmNumber of VehiclesTotal Cost (CNY)Carbon Emissions (kg)Travel Time (h)
GA-TS1735,621.32713.1210.60
GA1746,719.32728.7208.11
PSO1757,159.82739.9210.16
Publisher’s Note: MDPI stays neutral with regard to jurisdictional claims in published maps and institutional affiliations.

