Abstract
Urban resilience refers to the capacity of an urban system to fully recover from unforeseen calamities. This study aims to assess the physical resilience indicators used to measure urban resilience in Tehran, the political and economic capital of Iran, and to pinpoint the most significant direct and indirect influences on urban resilience. The research process divided into two parts. The environmental scanning approach (reviewing papers and published sources, interviewing specialists, and monitoring conferences) and the literature review were employed in the first part to compile a database of the key information on the elements impacting physical resilience. The most significant factors impacting physical resilience over the next ten years were requested to be identified by specialists and intellectuals in the second part. Finally, the MicMac program was used to analyze the data after 29 variables were specified in Delphi. In light of the trace-analysis-dependence diagram, which depicts the instability of the influential factors and the persistence of their impact on other variables, the results demonstrate that Tehran’s physical resilience is in an unstable condition. According to the results, the factors that have the maximum impact on other variables are granularity drivers, emergency evacuation capacity, rescue and security spaces (emergency, fire station, and police station), impermeability, rate of the amendment and retrofitting measures in the buildings of each zone, building age, and the compatibility of land uses. The variables that are most susceptible to change from other variables include the distribution status of dangerous land uses, the quality of the buildings, the rate of historically vulnerable buildings, the vulnerability of internal and external roads, the rate of improvements and retrofitting measures in buildings in each zone, as well as historically vulnerable historical buildings.
1. Introduction
Cities are always undergoing a variety of changes, which may be abrupt or gradual [1]. A city has to be able to continually assess its varied implementation circumstances, but it also needs to take into account any potential trends that might have an impact [2]. Natural, technical, economic, and human factors all have a role in the decline or abolition of the balance of civilizations [3]. To safeguard their lives, possessions, and families, humans have long strived to make safe environments and to be ready for any mishaps [4]. The process of achieving sustainable development in human societies has become challenging as the world becomes an urbanized place [5]. Predictions indicate that more than 68% of the world’s population will reside in cities by 2050 [6], which is in addition to the rise in the number and variety of natural disasters in human societies [7]. Natural catastrophes around the world have led to an economic loss of USD 75 billion (EUR 73 billion) in the first half of 2022, according to Swiss Re Institute’s preliminary estimates [8].
Despite its complex philosophical aspects, the lack of clarity and common understanding of it, and, most importantly, the confusion regarding its implications for urban planning and crisis management, the concept of resilience is now largely acknowledged in the achieving sustainable development [9,10]. Because urban resilience in the face of disaster can lead to actions such as improving the resilience capacity and adapting urban communities to the livelihoods of their citizens [11,12], it is crucial to put a direct focus on making urban communities resilient rather than addressing their susceptibilities [13].
Tehran’s route to resilience is made more challenging by its placement on more than 60 faults, which now offers the potential for an earthquake of magnitude of six to eight on the Richter scale [14]. In the interim, managers’ and urban planners’ emphasis on timing and preventative actions has become increasingly evident. A critical concern for municipal management is that unstable and dangerous projects are becoming increasingly frequent in the Tehran metropolis. Natural disasters are a severe and fundamental threat to the occurrence of human catastrophe in poorly functioning communities and urban areas for a variety of reasons, including special settlement conditions, high population density, deteriorating access networks, and natural calamities, which pose a severe and fundamental danger to the possibility of a human catastrophe. Accordingly, the present study aims to investigate the main factors influencing Tehran’s physical resilience. By addressing this study question, which may be used in many aspects of urban and regional decision-making, it can reflect the contribution of important elements in physical resilience. Therefore, the research leads us to question what role the key driving forces have in the physical resilience of Tehran.
2. Literature Review
2.1. The Concept of Resilience
Both scientific research and political discourse now place a high value on resilience and “resilience thinking.” Resilience is defined as a strategy, or a subset of a strategy, that can cope with the high degree of uncertainty existing in complex urban situations [15]. The capacity of a community to anticipate threats, adjust to changing conditions, withstand disturbances, and swiftly recover from them is known as community resilience [16]. As defined by the UN, a resilient city has inclusive, capable, and responsible local governments that are concerned with sustainable urbanization [17]. In addition, governments feel obligated to provide the essential resources for management and organizational capacities before, during, and after a tragic natural disaster [18]. Cities all across the world have grown more robust to the ecological, social, and economic problems that are a part of 21st-century problems thanks to the “resistant or resilient cities” approach [19]. The term “resilience” is most commonly used regarding the stability of ecosystems and a system’s ability to recover from particular shocks or disruptions in ecology and complicated studies of adaptive systems [20]. For “social-environmental systems”, resilience is described as “an urban system’s ability—and all its constituent socio-ecological and socio-technical networks, temporally and spatially—to maintain or accelerate in the case of a disruption to return to desired functions in order to adapt itself to it [21].
Resilience refers to the capacity to fully recover from an unforeseen circumstance or occurrence, as well as the degree of disturbance that a system can tolerate before altering the variables and processes that govern its behavior [22,23]: it increases people’s quality of life [24] and people’s proper access to resources [25]. Higher resilience levels help society recover from dangerous situations [13] and takes society towards sustainability [26]; however, if environmental and social conditions are not considered, efforts to achieve sustainability are incomplete [27,28,29]. Resilience is understood to be the systems’ and the risk-exposed cities’ prospective capacity to adjust to or resist change to reach or sustain an adequate level of performance and structure [30,31] where risk and uncertainties are growing. Resilience is a notion for coping with disruptions, shocks, and changes that are presented in circumstances when risk and uncertainty are rising [32,33]. An important limitation of cities is that risks affecting sustainability, which cover a wide range, are not easily identified and their effects are often ambiguous [34,35], affecting urban resilience.
Urban resilience is the capacity of a city to tolerate change before reorganizing into new systems of structures and procedures [36,37].
Therefore, all aspects should be studied, especially since social sustainability can be one of the important aspects of resilience [38]. In fact, resilient cities are designed to anticipate, overcome, and recover from the effects of natural or technical hazards, and the physical and social systems in such a city are able to survive and function under pressure and crisis conditions. As urban-land-use patterns are the basis for these physical and social components, the compatibility of these patterns with hazards and attention to natural hazards in their design plays an important role in maintaining the resilience of these components and, as a result, the resilience of the city [39]. Change thresholds, the ability to reorganize one’s resilience, recovering from shock and stress to learn and adapt, the unit of exposure (analysis unit) of resilience, natural ecosystems, or human and environmental systems, are the main characteristics of resilience [40].
2.2. Resilience Measurement and Analysis Models
One of the fundamental components of studies and research in the area of resilience is the development of the proper way to assess resilience. Numerous models have been presented by researchers, each of which focuses on a different component of catastrophe resilience [41]. All of these models share the idea of social capital. Additionally, they examine a few resilience-related topics, including the linear-temporal model [42], the spatial model [13], the Tobin model [41], the sustainable livelihood model [43] and the PEOPLES model. Here, considering the wide range of models, we explain the PEOPLES model.
In an article, Cimellaro and colleagues sought to achieve a framework to evaluate community resilience in different spatial and temporal scales that included different dimensions and components. Cimellaro called this framework “PEOPLES”, where each letter represents one of the components. Respectively, these components are: (1) P: population and demographics; (2) E: environmental and ecosystem; (3) O: organized governmental services; (4) P: physical infrastructures; (5) L: lifestyle and community competence; (6) E: economic development; and (7) S: social-cultural capital.
In this framework, each dimension is characterized by a separate performance measure, which is combined with other dimensions using a multi-layered approach; therefore, once a composite model of the community is defined, the proposed framework can be used to measure its performance against any type of extreme event during the emergency and in the long-term stages after the injury [44].
Because there is a scholarly agreement in this area on the multiple characteristics of resilience (socioeconomic, institutional, and physical-environmental), it is necessary to present and suggest models. Cutter’s spatial model (2008 and 2010) focuses on the three components of resilience (socioeconomic, institutional, and physical-environmental). In addition, the community-based disaster model (CBDM) highlights the involvement of communities in the disaster management process and their crucial role. The model mentioned above aims to decrease society’s susceptibility by strengthening people’s collaboration and preparedness to deal with the hazards of natural catastrophes [45]. These two models can therefore be used to measure and assess resistance to natural catastrophes. A bottom-up management strategy that emphasizes people’s collaboration in addressing natural catastrophe situations is the community-based disaster model [46].
Considering that this article has a scenario approach, we decided to use another model aside from these models. Of course, we had help from these models in the form of study indicators.
3. Methodology
The research process was applied in terms of purpose, and the research method was descriptive–analytical, with a “heuristic approach” to the future. The research process was divided into two sections. In the first section, environmental scanning techniques (reviewing articles and published sources, interviews with experts, and conference monitoring) and a literature review were used to develop a database of the factors that affect urban resilience (data collection and information). Information was gathered for this purpose from survey, library, and documentary sources, and it was integrated with data from expert and specialist interviews in the field of urban-resource planning. We asked 25 experts and intellectuals to identify the most significant critical variables impacting Tehran’s physical resilience over the next ten years in the second section.
In this article, the panel members were selected through targeted non-probability sampling, in which 25 people who had sufficient expertise in the research topic were selected. In a Delphi study, if the participants are homogeneous, 10 to 20 people will be enough to perform the Delphi technique [47].
After determining the panel members, three rounds of the Delphi method were implemented. Questionnaires were also distributed by both face-to-face and electronic methods. In the first round, a list of factors affecting the resilience of the city of Tehran, which was extracted from theoretical studies, was provided to the panel members to determine the importance of each one. Additionally, they were asked to suggest and add their desired variables to this list in addition to the existing variables. Examining the answers to the open questions showed that the variables proposed by the respondents are the same as the existing factors identified from the theoretical texts. Therefore, these variables were integrated and combined with the existing variables. Finally, the subject of the two phases of the 29 Delphi variables was established, as detailed in Table 1, following the interviews with the experts.

Table 1.
Key forces related to the physical resilience dimension of the Tehran metropolis.
In next stages, the importance of the variables was determined using MicMac software (Version 6.1.2, creator by Michel Godet and François Bourse; The new Micmac software has been developed by a French Computer Innovation Institute 3IE (Institut d’Innovation Informatique pour l’Entreprise) under the supervision of its conceptual creators LIPSOR Prospective (foresight) Strategic and Organisational Research Laboratory). In the MicMac method, a list of key variables is provided to conduct the initial research, which can be derived from the opinions of experts or other sources. Then, according to the number of key variables, n*n matrix houses of influential variables are scored. This matrix is called the matrix of direct effects and each mij component represents the effect of variable i on variable j and its value can be 0, 1, 2, 3, or 4 (p) depending on the effect. In this method, 1 indicates weak effects, 2 indicates moderate effects, and 3 indicates severe or strong effects. The number 4 indicates that, according to the experts and specialists participating in the research, the effect of two variables on each other is possible, in the sense that there may or may not be influence or effectiveness. By changing the components of code 4 or P in the analysis stage of the software, possible effects can also be identified. Then, in the third step, using one of the two direct or indirect methods, the amount of influence can be determined.
In the direct method, the direct effect of variable K on other variables is the sum of all values of row K of matrix M, and the influence of variable K on other variables is the sum of values of column K. In this way, the ranking of σDM and σIM is obtained for each variable, and the importance of each variable is calculated from the sorting of these values. The following formulas show the mathematical algebra of this process [48].
After this stage, the indirect effects can be identified with the help of the MicMac software. The basis of this work in calculating indirect effects is to multiply the matrix by itself several times or, in other words, to raise the matrix of direct effects to the nth power. After each order of matrix multiplication, the row and column sum of the effects are calculated, and the variables are ranked. This process continues iteratively until the rank of all the variables in step K−1 does not differ from their rank when the matrix reaches the power of K+1. In this way, the sum of indirect effects of the first degree is obtained. First-order effects mean that, in this method, only the indirect effects of a variable through a mediating variable (not more mediating variables) are calculated. In practice, the effects of higher degrees are so weak that they can be ignored. In the MicMac method, the power of the n value is usually equal to 7 or 8, which means that by multiplying the matrix of direct effects by itself 7 or 8 times, the rank of the variables remains unchanged, the results reach stability, and the repeated mathematical process is completed. With the help of MicMac software, the above mathematical operations can be performed. This software also has an algorithm to determine the position of each variable on the maps of direct and indirect effects. The most important maps of direct and indirect effects, which help to interpret the results faster and more accurately, locate the sum of the effects resulting from row and column summation on the two axes of influence and dependence. Additionally, by raising the two-dimensional space of the map, it is possible to judge the role of each effect, which is mentioned in the rest of this article. In this way, MicMac software provides basic visual maps that can be optimized using external visualization software.
MicMac software was used in conjunction with the cross-impact technique to pinpoint the primary elements that are the driving forces behind others. In a cross-matrix, the total of the rows for each component indicates its level of influence, while the sum of its columns indicates the extent to which other factors have an impact. Based on the first matrix of cross impacts generated from 812 values by experts and specialists, 446 instances were determined to have a high impact, 327 cases were determined to have a medium impact, 30 cases were determined to have a low impact, and 29 cases were determined to be ineffective. The acceptable validity of the questionnaire and the responses is shown by the matrix’s 98 percent desirability and optimization within two data cycles.
Study Area
Tehran, the capital of Iran, is located in a geographical position of 51° and 5′ to 51° and 36′ east longitude and 35° and 35′ to 35° and 50′ north latitude (Figure 1). According to the most recent census and housing population of Iran, Tehran is now the largest city in the Middle East and is rated 16th among the most populated cities in the world with a population of 8,693,706 [49].
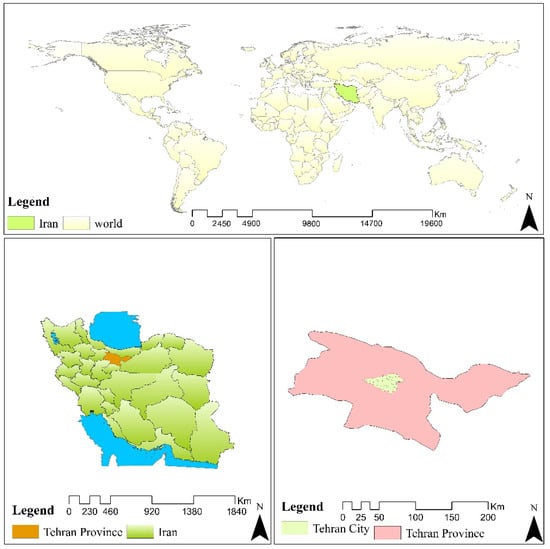
Figure 1.
The study area’s geolocation map. Drawing authors, 2022.
Tehran, the country’s commercial hub, is regarded as Iran’s first industrial zone. According to statistics from 2016, Tehran contributed 21 percent of Iran’s overall GDP, and by hosting half of the nation’s industrial sector, it has a significant impact on the country’s economy [50].
4. Results
4.1. Trace Analysis-Dependence Matrix and Physical Resilience Indices’ Dispersion
In the analysis of the effect-dependency matrix, attention should be paid to the arrangement of the resilience indicators of the Tehran metropolis in the framework of Figure 2. The pattern of this distribution has a very direct relationship with the stability or instability of resilience in the Tehran metropolis with a scenario approach. In the way that stable systems have indicators with a high degree of influence and effectiveness, the variables also have a normal distribution in other levels of the diagram.
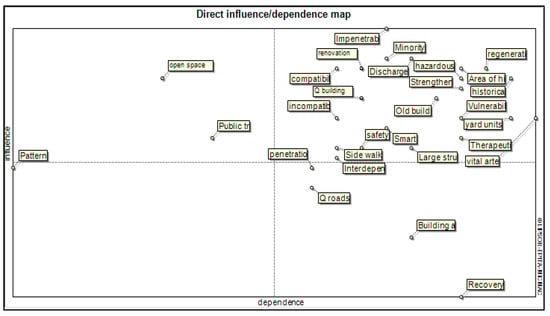
Figure 2.
The position of each physical resilience factor in direct influence/dependence map.
The distribution of variables in unstable systems does not follow a regular pattern, and the majority of indices skew upward or downward. Therefore, according to Figure 2 and the analyses made, it can be seen that the resilience system of the Tehran metropolis is in an unstable state considering the effect-dependency analysis diagram.
The results Table 2 show that Impenetrability (79), Minority and Emergency evacuation capacity and rescue and security facilities (emergency, fire and police) (76), Improvement and regeneration measures in the buildings of each zone (75), Buildings in which renovation measures have been carried out in relation to the whole building (locally or in general) (75), Area of historic buildings to the total number of buildings in each zone and Land use compatibility (75), Distribution status of hazardous land use (such as power plants, industrial uses, and flammable material stores), Vulnerable historical buildings, Existence of open space and temporary accommodation spaces (74) had the maximum effectiveness factor on other variables. In addition, the variables that had maximum susceptibility from other variables are Vulnerability of vital arteries (water, electricity, gas, etc.) (76), Percentage of yard units (75), Vulnerable historical buildings (75), Improvement and regeneration measures in the buildings of each zone (74), Distribution status of hazardous land use (such as power plants, industrial uses, and flammable material stores) (73), Vulnerability of roads (inside and near the market), Area of historic buildings to the total number of buildings in each zone, Recovery capacity (73).
Table 2.
The rate of direct effectiveness and susceptibility of physical resilience factors.
4.2. Trace-Matrix-Indirect Dependence and Dispersion of Physical Resilience Indices
Figure 3 shows the dispersion of two-dimensional variables and the effectiveness factors in the northeast of zone 2 and the northwest of zone 1, respectively. Such variables are more effective than susceptibility ones and are classified as the most critical components. Furthermore, environmental variables are more evident and cannot be controlled by the system. Additionally, the independent variables are shown in the southwest of area 4. These variables exhibit a configuration and are not impacted by, or have no effect on, other system variables (in the center of the center axis of the circuit). Such variables can be enhanced by effective variables, determinants with target, and risk variables based on the policies that planners apply to their aims. The susceptibility factors are situated in zone 3, which is in the southeast. Only the recovery capacity and building area variables are present in this region.
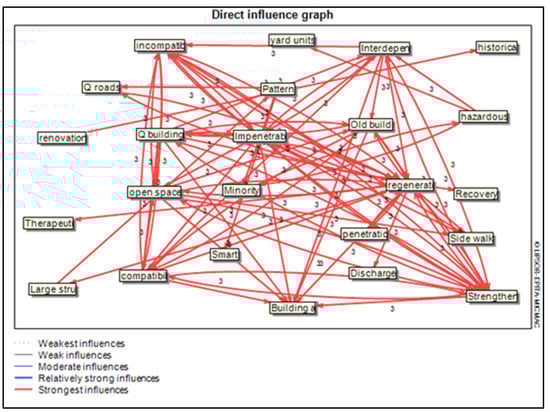
Figure 3.
The position of each physical resilience factor in direct influence graph.
The impermeability index, which has the biggest indirect influence on Tehran’s physical resistance among the collection of factors in Table 3 with a total of 385,014 computed line values, should also be mentioned. Additionally, the granularity, emergency evacuation capability, and security and rescue space variables (emergency, fire station, and police station), land-use compatibility, and the proportion of historic buildings to all buildings in each zone with 370,024, 369,352, 366,365, and 366,160 row points, respectively, have the maximum indirect effectiveness coefficients on other variables. The variables of lifeline vulnerabilities (water, electricity, gas, etc.), rate of bungalows, vulnerable historical buildings, improvement and retrofitting measures in the buildings of each zone and distribution status of hazardous land uses (such as power plants, industrial landfills, and flammable material stores) with 370,641, 365,585, 364,873, 358,656, and 356,527 column values, respectively, have the maximum susceptibility from other variables. The retrieval capacity variable had the least impact on the indirect effect-dependence assessment, such as what occurred surrounding the direct sample, while the texture and urban pattern variables (height, order, etc.) had the least influence.
Table 3.
Calculated row values of physical resilience factors with indirect effectiveness and susceptibility.
4.3. The Contribution of Comparative Direct and Indirect Physical Resilience Effectiveness and Susceptibility
Because the software is raised to power several times in calculating the indirect effects, the total indirect effectiveness and susceptibility result in multi-digit numbers, making it difficult to compare it with direct effects. Table 3 displays the direct and indirect contributions of many parameters on overall effectiveness and susceptibility. The ten criteria listed in the effectiveness column had the highest percentage of direct effectiveness. Additionally, it can be claimed that, in terms of the effectiveness matrix and the possibility for direct and indirect dependence, the vulnerability index ranked first for indirect effectiveness while the impermeability index ranked similarly for direct effectiveness. Additionally, the susceptibility variable ranked first in the rate of indirect dependence and maximum direct dependence. Moreover, the evacuation capacity and rate of improvement and retrofitting measures in each zone’s buildings ranked next in direct effectiveness. The driving forces can be introduced in terms of effectiveness and susceptibility considering the findings of Table 3 and Figure 4 and Figure 5. Accordingly, 29 key driving forces were presented in order of importance given 29 investigated general variables.
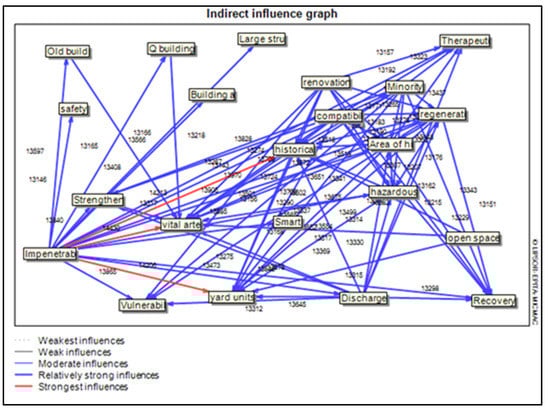
Figure 4.
The position of each physical resilience factor in indirect influence graph.
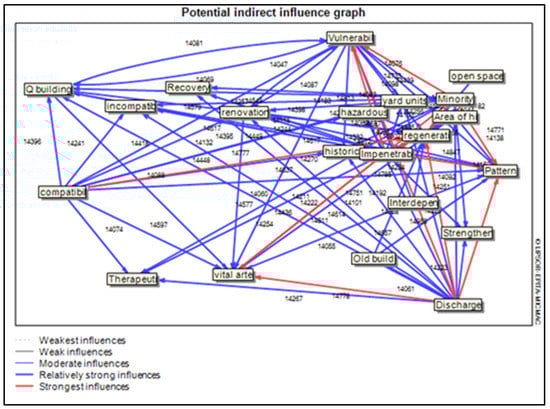
Figure 5.
The position of each potential physical resilience factor in indirect influence graph.
4.4. Analyzing the Physical Resilience Variables’ Effectiveness and Susceptibility
The degree of stability and instability of the system may be determined by assessing the effectiveness and susceptibility of the distribution and dispersion of variables in the dispersion plot. There are a total of two different dispersal types in interaction analysis using the MicMac program. The distribution of variables in stable systems is L-shaped, which means that certain factors are highly effective while others are highly susceptible. Highly effective variables, independent variables, and system output variables all fall into one of three groups in stable systems. The variables in an unstable system are frequently intermediate and dispersed along the diagonal axis of the plane. Effectiveness, two-dimensional (risk and objective variables), regulatory, susceptible or system outcomes, and independent variables are all present in an unstable system. The system is in an unstable condition, which is evident from the dispersion plane of factors influencing the future state of the Tehran metropolis’ physical resilience. The diagonal axis of the plane serves as the center for the majority of variables. All other variables are in a similar condition, except for a few variables that show substantial impacts.
5. Conclusions
According to the data from Figure 6, the Tehran metropolis’ physical resilience is unstable, and if the current trend is allowed to continue, it will result in the development of a catastrophic scenario. In the optimal case, physical resilience in the Tehran metropolis will lead to a weakened vulnerability rise, reduced lifeline diffusion coefficient, decreased improvement and retrofitting measures, the vulnerability of historic buildings, increased distribution of incompatible uses, lowered building quality, etc., if the current condition continues. The evaluation results are in line with the realities concerning urban resilience in Tehran, while the general status of resilience can be analyzed in the framework of future studies utilizing the scenario-planning approach. Furthermore, its stability and instability pattern can be obtained from the variables’ spatial distribution in the level of graphs and the output figures from the MicMac software. Additionally, the almost high degree of fill factor (98%) in the study variables shows the validity and reliability of the research instruments. The current study has included the variables in the spatial configuration of the variables, the formulation of significant driving forces, and the development of final scenarios, in addition to measuring the direct effects of the variables on the dimensions of effectiveness susceptibility and potential dependence. Considering that this article is a scenario method, it provides suggestions for increasing urban resilience, which are derived from the opinions of experts in the field of urban planning. Among these measures, the following can be mentioned.
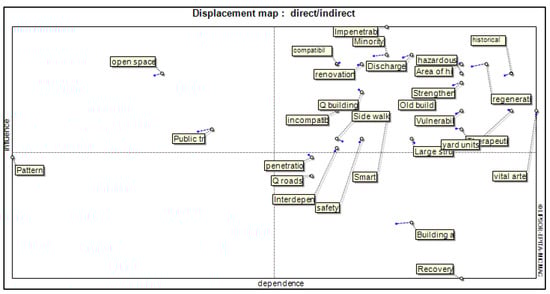
Figure 6.
The diagram of the physical resilience system’s instability.
Developing security (emergency, fire station, and police station) and expanding the capacity of emergency evacuation and rescue spaces, especially in the southern sections of the city where pressure and social harm are being increased owing to the areas’ physical and demographic position.
Planning to develop the physical resilience structure of land use as the primary goal of urban planning.
Increasing the number of renovations and retrofits in each zone’s buildings, while paying close attention to the planning to dispose of any roadblocks already there.
Allocating financial resources and essential infrastructure to structures that have not undergone seismic rehabilitation, as well as making plans to make the situation better.
Author Contributions
E.F. contributed to the data collection, analysis, and manuscript writing. A.P., K.Z., H.F.S. and S.T. supervised the article and provided the necessary guidance for analyzing and using the model. All authors have read and agreed to the published version of the manuscript.
Funding
The authors declare that they have no funding source.
Informed Consent Statement
Not applicable.
Data Availability Statement
The data are available on request from the corresponding author.
Conflicts of Interest
All authors certify that they have no affiliation with or involvement in any organization or entity with any financial interest or non-financial interest in the subject matter or materials discussed in this manuscript.
References
- Carter, J.G.; Cavan, G.; Connelly, A.; Guy, S.; Handley, J.; Kazmierczak, A. Climate change and the city: Building capacity for urban adaptation. Prog. Plan. 2015, 95, 1–66. [Google Scholar] [CrossRef]
- Bibri, S.E.; Krogstie, J.; Kärrholm, M. Compact city planning and development: Emerging practices and strategies for achieving the goals of sustainability. Dev. Built Environ. 2020, 4, 100021. [Google Scholar] [CrossRef]
- Motesharrei, S.; Rivas, J.; Kalnay, E. Human and nature dynamics (HANDY): Modeling inequality and use of resources in the collapse or sustainability of societies. Ecol. Econ. 2014, 101, 90–102. [Google Scholar] [CrossRef]
- Jain, N.; Burman, E.; Stamp, S.; Shrubsole, C.; Bunn, R.; Oberman, T.; Barret, E.; Aletta, F.; Kang, J.; Raynham, P.; et al. Building performance evaluation of a new hospital building in the UK: Balancing indoor environmental quality and energy performance. Atmosphere 2021, 12, 115. [Google Scholar] [CrossRef]
- Tan, X.; Wu, Q.; Shao, H. Global commitments and China’s endeavors to promote health and achieve sustainable development goals. J. Health Popul. Nutr. 2018, 37, 8. [Google Scholar] [CrossRef]
- Department of Economic and Social Affairs, U.N. UN Department of Economic and Social Affairs; Revision of World Urbanization Prospects; DESA U.N.: New York, NY, USA, 2018. [Google Scholar]
- United Nations Office for Disaster Risk Reduction. The Human Cost of Natural Disasters: A Global Perspective; UNISDR: New York, NY, USA, 2015. [Google Scholar]
- Available online: https://www.laprensalatina.com/natural-disasters-caused-global-losses-of-72-billion-in-first-half-of-2022/ (accessed on 1 January 2020).
- Zeng, X.; Yu, Y.; Yang, S.; Lv, Y.; Sarker, M.N.I. Urban resilience for urban sustainability: Concepts, dimensions, and perspectives. Sustainability 2022, 14, 2481. [Google Scholar] [CrossRef]
- Jabareen, Y. Planning the resilient city: Concepts and strategies for coping with climate change and environmental risk. Cities 2013, 31, 220–229. [Google Scholar] [CrossRef]
- Kapucu, N.; Martín, Y.; Williamson, Z. Urban resilience for building a sustainable and safe environment. Urban Gov. 2021, 1, 10–16. [Google Scholar] [CrossRef]
- Zhao, J.; Liu, H.; Dong, R. Sustainable urban development: Policy framework for sustainable consumption and production. Int. J. Sustain. Dev. World Ecol. 2008, 15, 318–325. [Google Scholar]
- Mayunga, J.S. Understanding and Applying the Concept of Community Disaster Resilience: A Capital-Based Approach, Department of Landscape Architecture and Urban Planning, Hazard Reduction & Recovery Center, Texas A&M University. 2006. Available online: https://www.ucursos.cl/usuario/3b514b53bcb4025aaf9a6781047e4a66/mi_blog/r/11._Joseph_S._Mayunga.pdf (accessed on 1 January 2020).
- Kamranzad, F.; Memarian, H.; Zare, M. Earthquake risk assessment for Tehran, Iran. ISPRS Int. J. Geo. Inf. 2020, 9, 430. [Google Scholar] [CrossRef]
- Wardekker, A.; Wilk, B.; Brown, V.; Uittenbroek, C.; Mees, H.; Driessen, P.; Wassen, M.; Molenaar, A.; Walda, J.; Runhaar, H. A diagnostic tool for supporting policymaking on urban resilience. Cities 2020, 101, 102691. [Google Scholar] [CrossRef]
- Serre, D.; Heinzlef, C. Assessing and mapping urban resilience to floods with respect to cascading effects through critical infrastructure networks. Int. J. Disaster Risk Reduct. 2018, 30, 235–243. [Google Scholar] [CrossRef]
- Bexell, M.; Jönsson, K. Responsibility and the United Nations’ Sustainable Development Goals. Forum Dev. Stud. 2016, 44, 13–29. [Google Scholar] [CrossRef]
- Pede, E. Planning for Resilience: New Paths for Managing Uncertainty, 1st ed.; Springer Briefs in Geography; Springer: Berlin/Heidelberg, Germany, 2020. [Google Scholar]
- Rockefeller Foundation. 100 Resilient Cities Initiative. 2019. Available online: http://www.100resilientcities.org (accessed on 25 February 2019).
- Matyas, D.; Pelling, M. Positioning resilience for 2015: The role of resistance, incremental adjustment and transformation in disaster risk management policy. Disasters 2015, 39, S1–S18. [Google Scholar] [CrossRef]
- Meerow, S.; Newell, J.P. Urban resilience for whom, what, when, where, and why? Urban Geogr. 2019, 40, 309–329. [Google Scholar] [CrossRef]
- Holling, C.S.; Gunderson, L.H. Resilience and adaptive cycles. In Panarchy: Understanding Transformations in Human and Natural Systems; Island Press: Washington, DC, USA, 2002; pp. 25–62. [Google Scholar]
- Francis, R.; Behailu, B. A metric and frameworks for resilience analysis of engineered and infrastructure systems. Reliab. Eng. Syst. Saf. 2014, 121, 90–103. [Google Scholar] [CrossRef]
- Hataminejad, H.; Abdul, A.Y.; Farhadi, E.; Hossaini, F. An investigation of the life quality indices for improving the mental health of the citizens of Kaleybar in Iran. Int. J. Sci. Res. Sci. Eng. Technol. 2016, 1, 571–581. [Google Scholar]
- Hussaini, F.; Farhadi, E.; Pourahmad, A.; Tondelli, S. Spatial justice in relation to the urban amenities distribution in Austin, Texas. Spat. Inf. Res. 2022, 1–12. [Google Scholar] [CrossRef]
- Safdari Molan, A.; Farhadi, E.; Saganeiti, L.; Murgante, B. Border Tourism Development Strategies in Kaleybar Compared to Regional Rivals. Sustainability 2021, 13, 11400. [Google Scholar] [CrossRef]
- Blaauw, S.A.; Maina, J.W. Life Cycle Inventory for Pavements—A Case Study of South Africa. Transp. Eng. 2021, 3, 100049. [Google Scholar] [CrossRef]
- Aqbelaghi, A.S.; Ghorbani, M.; Farhadi, E.; Shafiee, H. Environmental approach in modelling of urban growth: Tehran City, Iran. Asian J. Water Environ. Pollut. 2018, 15, 47–56. [Google Scholar] [CrossRef]
- Blaauw, S.A.; Maina, J.W.; Mturi, G.A.; Visser, A.T. Flexible pavement performance and life cycle assessment incorporating climate change impacts. Transp. Res. Part D: Transp. Environ. 2022, 104, 103203. [Google Scholar] [CrossRef]
- UN/ISDR. Living with Risk—A Global Review of Disaster Reduction Initiatives, Inter-Agency Secretariat of the International Strategy for Disaster Reduction. 2004. Available online: http://www.unisdr.org/eng/about_isdr/bd-lwr-2004-eng.htm (accessed on 1 January 2020).
- Prieto Velandia, J.A. Risk-based resource allocation for management and pandemic response: The COVID-19 Case in Bogotá, Colombia. Master’s Thesis, Universidad Nacional de Colombia, Bogota, Colombia, 2022. [Google Scholar]
- Mitchell, T.; Harris, K. Resilience: A Risk Management Approach; ODI Background Note; Overseas Development Institute: London, UK, 2012; pp. 1–7. [Google Scholar]
- Wardekker, J.A.; de Jong, A.; Knoop, J.M.; van der Sluijs, J.P. Operationalising a resilience approach to adapting an urban delta to uncertain climate changes. Technol. Forecast. Soc. Change 2010, 77, 987–998. [Google Scholar] [CrossRef]
- Blaauw, S.A.; Maina, J.W.; Grobler, L.J.; Visser, A.T. A cumulative risk and sustainability index for pavements. Transp. Res. Part D Transp. Environ. 2022, 105, 103221. [Google Scholar] [CrossRef]
- Arvidsson, N.; Woxenius, J.; Lammgård, C. Review of road hauliers’ measures for increasing transport efficiency and sustainability in urban freight distribution. Transp. Rev. 2013, 33, 107–127. [Google Scholar] [CrossRef]
- Ainuddin, S.; Routray, J.K. Community resilience framework for an earthquake prone area in Baluchistan. Int. J. Disaster Risk Reduct. 2012, 2, 25–36. [Google Scholar] [CrossRef]
- Liao, K.H. A theory on urban resilience to floods—A basis for alternative planning practices. Ecol. Soc. 2012, 17, 48. [Google Scholar] [CrossRef]
- Blaauw, S.A.; Maina, J.W.; Grobler, L.J. Social life cycle inventory for pavements—A case study of South Africa. Transp. Eng. 2021, 4, 100060. [Google Scholar] [CrossRef]
- Allan, P.; Bryant, M. The critical role of open space in earthquake recovery: A case study. In Proceedings of the 2010 NZSEE Conference, Wellington, New Zeeland, 26–28 March 2010; pp. 1–10. [Google Scholar]
- Nelson, V.; Lamboll, R.; Arendse, A. Climate change adaptation, adaptive capacity and development discussion paper. In Proceedings of the DSA-DFID Policy Forum, Brussels, Belgium, 23 June 2008. [Google Scholar]
- Tobin, G. Sustainability and community resilience: The holy grail of hazards planning? Environ. Hazards 1999, 1, 13–25. [Google Scholar]
- Davis, I.; Izadkhah, Y.O. Building Resilient Urban Communities. Open House Int. 2006, 31, 11–21. [Google Scholar] [CrossRef]
- Department of Internation Development. Sustainable Livelihoods Guidance Sheets; DFID: London, UK, 2005.
- Cimellaro, G.P.; Renschler, C.; Reinhorn, A.M.; Arendt, L. PEOPLES: A framework for evaluating resilience. J. Struct. Eng. 2016, 142, 04016063. [Google Scholar] [CrossRef]
- Yodmani, S. Disaster Risk Management and Vulnerability Reduction: Protecting the Poor; Paper Presented at The Asia and Pacific Forum on Poverty; Asian Development Bank: Mandaluyong, Philipines, 2000. [Google Scholar]
- Buckle, P. New approaches to assessing vulnerability and resilience. Aust. J. Emerg. Manag. 2000, 15, 8–15. [Google Scholar]
- Skulmoski, G.J.; Hartman, F.T.; Krahn, J. The Delphi method for graduate research. J. Inf. Technol. Educ. 2007, 6, 1–21. [Google Scholar] [CrossRef]
- Godet, M.; Durance, P. Strategic Foresight for Corporate and Regional Development; Dunod: Malakoff, France; UNESCO: Paris, France, 2011. [Google Scholar]
- Hosseini, A.; Farhadi, E.; Hussaini, F.; Pourahmad, A.; Akbari, N.S. Analysis of spatial (in) equality of urban facilities in Tehran: An integration of spatial accessibility. Environ. Dev. Sustain. 2021, 24, 6527–6555. [Google Scholar] [CrossRef]
- Safdari Molan, A.; Farhadi, E. Spatial Analysis of the Proximity Effects of Land Use Planning on Housing Prices (Case Study: Tehran, Iran). In Proceedings of the ICCSA 2019: Computational Science and Its Applications, Saint Petersburg, Russia, 1–4 July 2019. [Google Scholar] [CrossRef]


Publisher’s Note: MDPI stays neutral with regard to jurisdictional claims in published maps and institutional affiliations. |
© 2022 by the authors. Licensee MDPI, Basel, Switzerland. This article is an open access article distributed under the terms and conditions of the Creative Commons Attribution (CC BY) license (https://creativecommons.org/licenses/by/4.0/).