3.3. Effect of Initial Asphaltene Concentrations on Adsorption
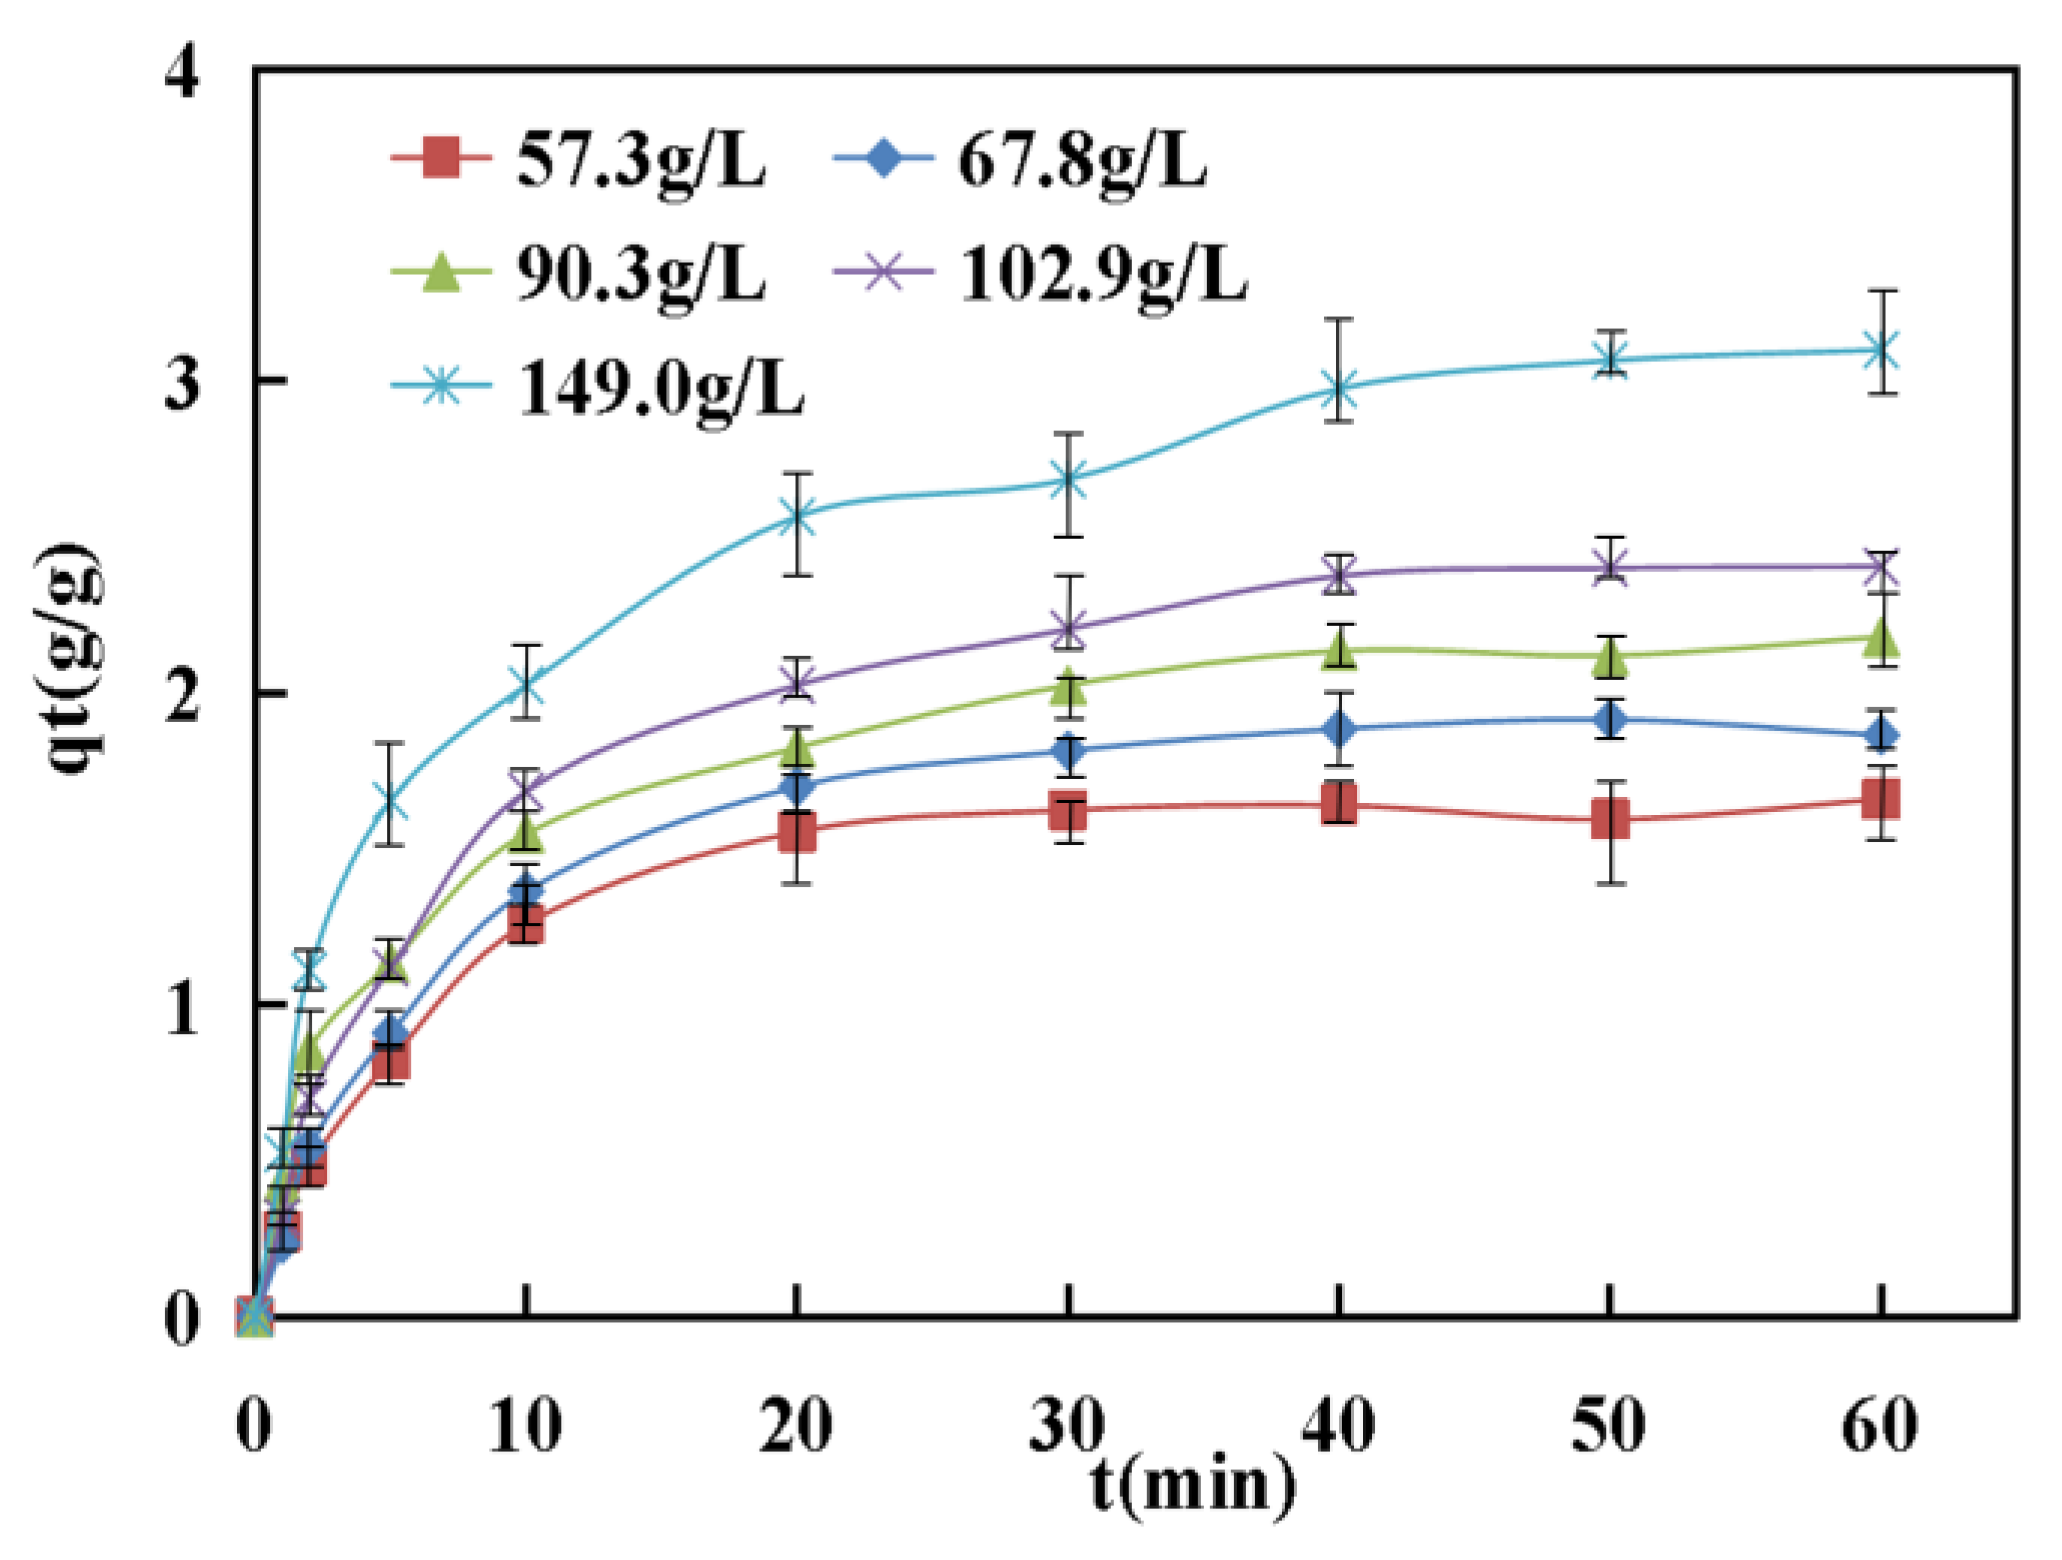
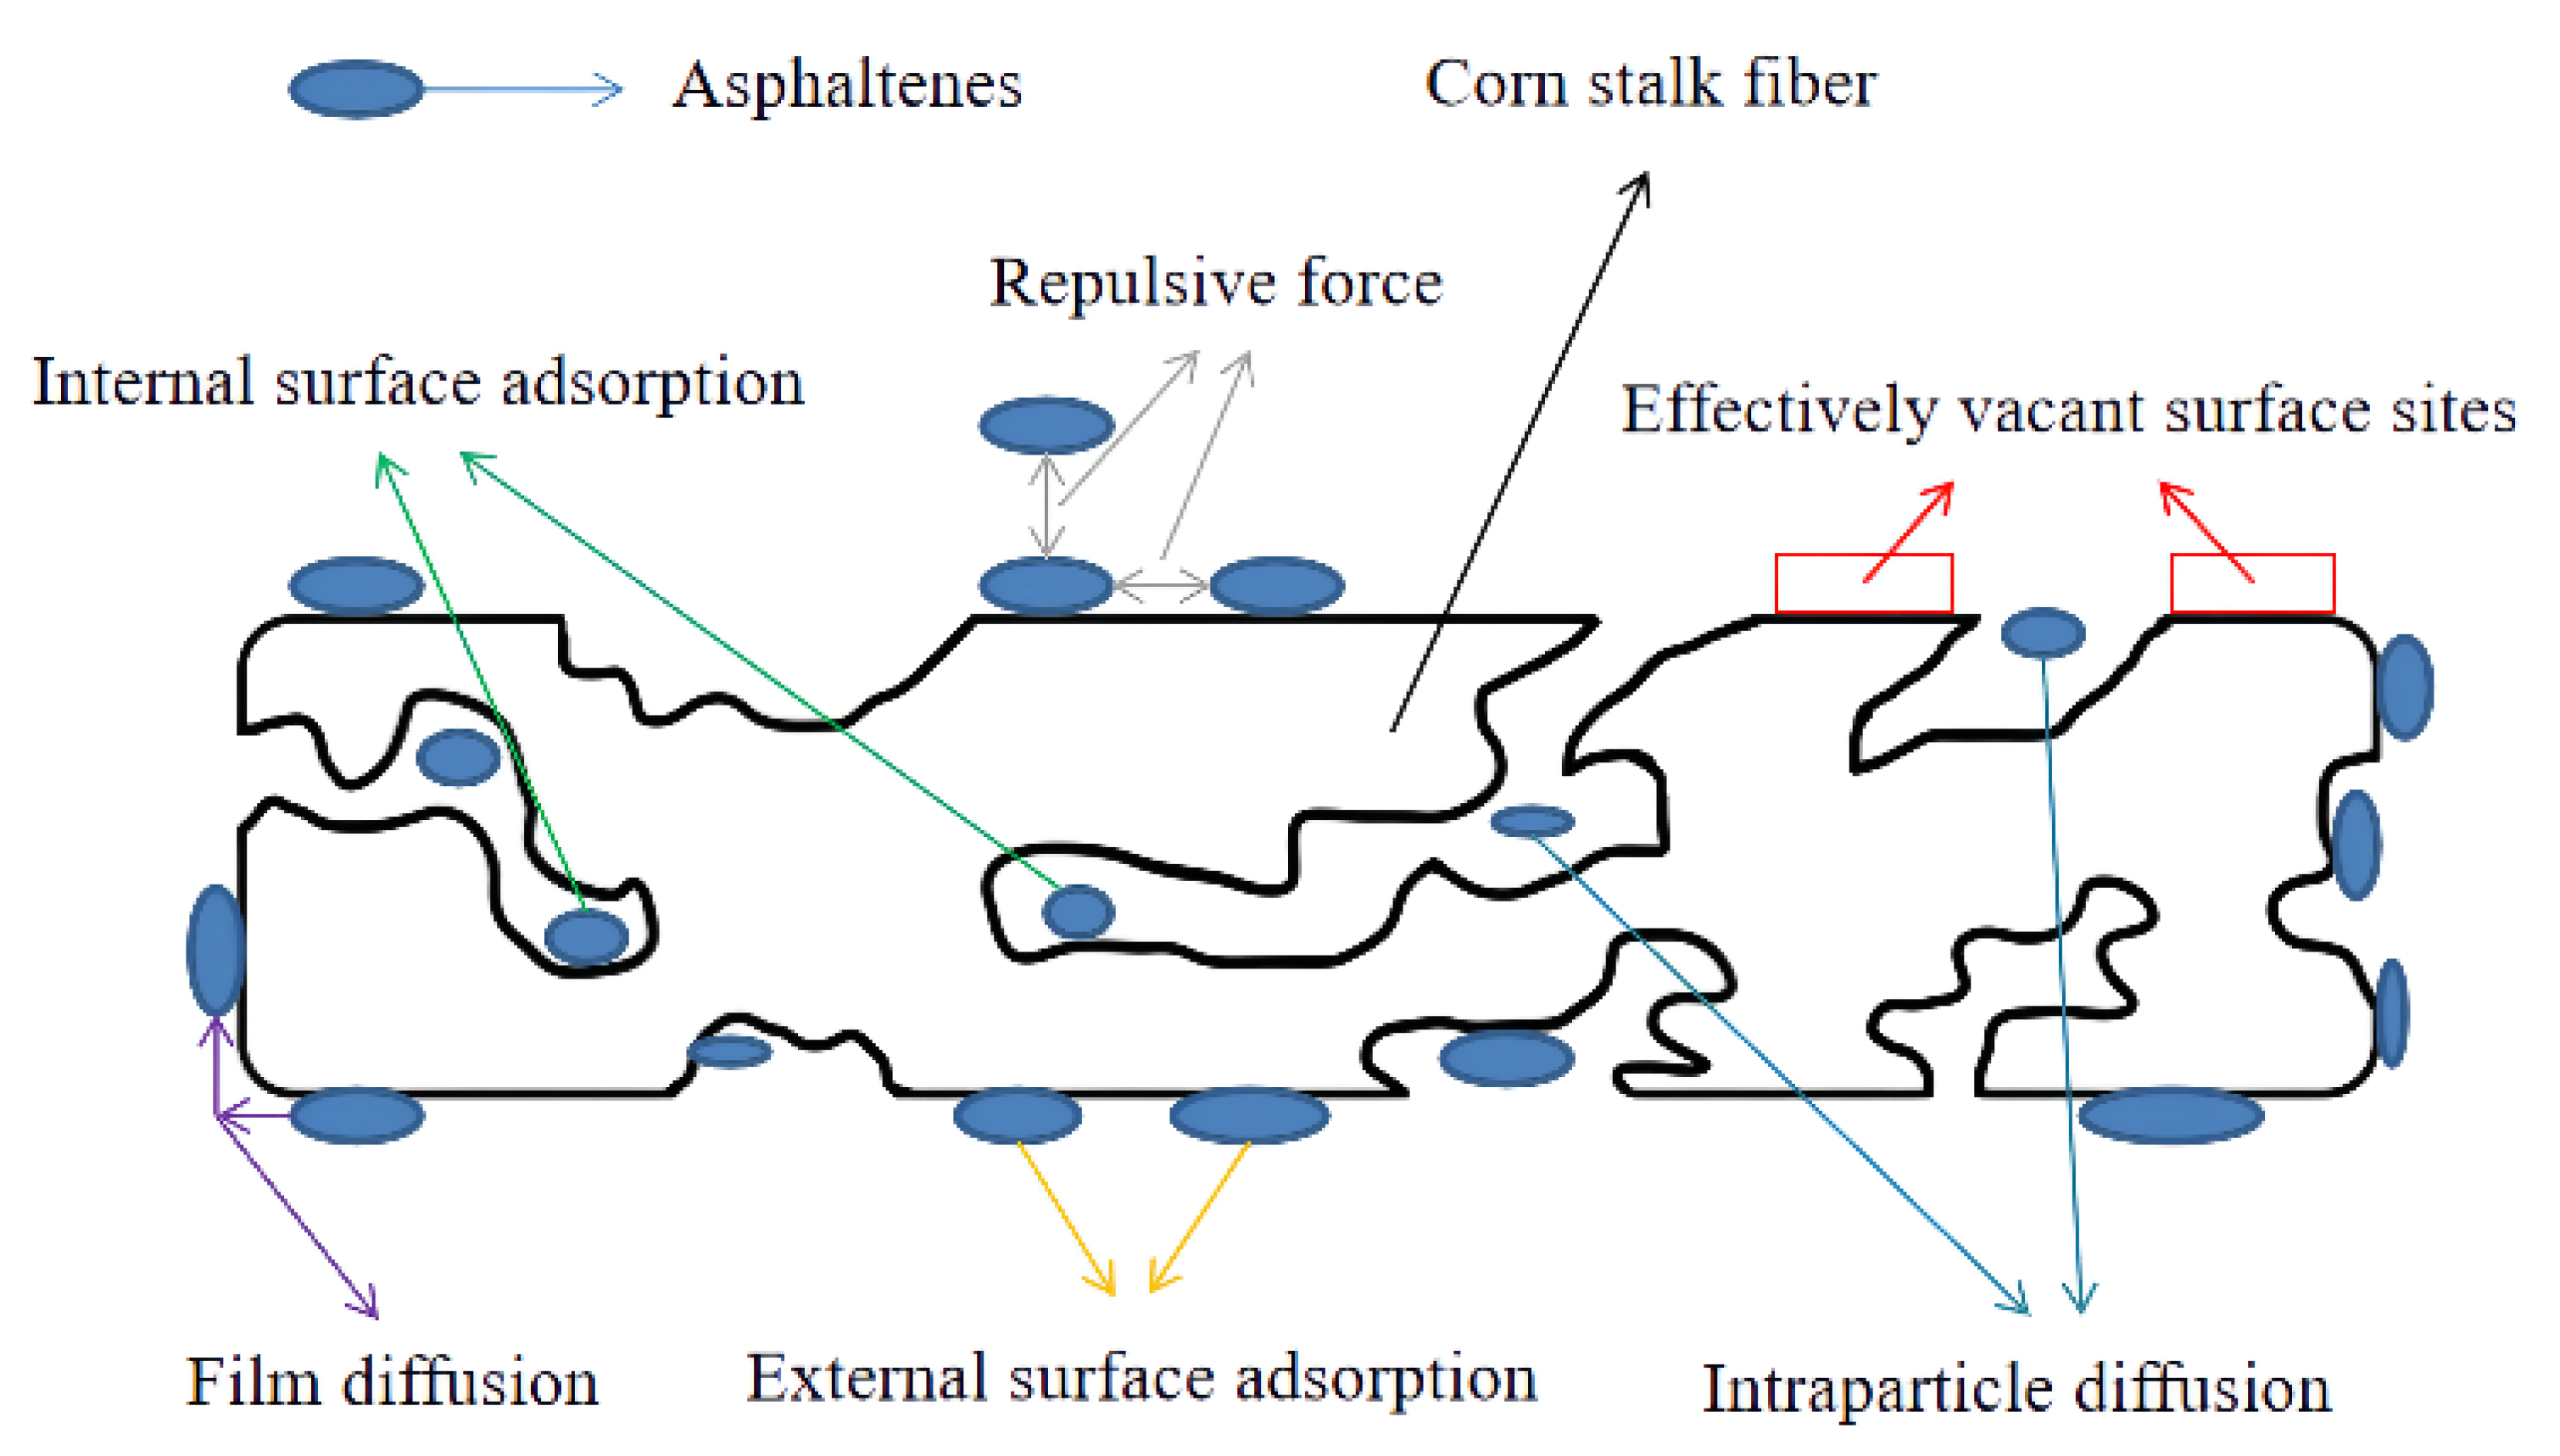
Figure 7 demonstrates that the adsorption of asphaltenes increased with increasing time and reached a constant value that fluctuated slightly with increasing time, indicating that the corn stalk fibers did not further adsorb asphaltene from the asphalt solution. This constant value was the dynamic equilibrium point of asphaltene adsorption and illustrated the maximum adsorption capacity of the corn stalk fibers. The adsorption curves of asphaltenes increased quickly at the beginning of the contacting phases, after which the increasing rate of the curve decreased until the value of the curve barely grew. The high rate of adsorption at the initial stage occurred because the adsorption of asphaltenes was caused by the exterior surface area of corn stalk fibers. When the exterior surface of adsorbents reached saturation, the asphaltenes entered the porous structure of the corn stalk fibers and were adsorbed by the interior surface areas of the adsorbents [
34]. This situation also indicated that many effectively vacant surface areas could be occupied by asphaltenes on the corn stalk fibers during the early period, and thereafter, the remaining vacant surface areas were hard to occupy because of repulsive forces between the asphaltenes on the corn stalk fibers and on the asphalt solutions [
35].
In this study, it can be seen from
Figure 7 that the values of
qe at equilibrium increased from 1.64 g/g to 3.1 g/g with an increase in the initial concentration of asphaltenes from 57.3 g/L to 149.0 g/L. This was due to an increase in the number of asphaltenes transferred to the electively vacant surface and interior areas.
Figure 7 also shows that the contact time to reach equilibrium for asphaltene adsorption increased with increasing initial asphaltene concentration. This phenomenon was illustrated by the following facts about adsorbate adsorption. First, the asphaltenes were subject to the influence of the corn stalk fiber boundary layer, after which they entered the surface areas and ultimately diffused into the pores of the corn stalk fibers [
36]. Therefore, the adsorption process of higher initial asphaltene concentrations required a longer contact time to reach equilibrium because more asphaltenes were adsorbed by corn stalk fibers.
3.4. Adsorption Isotherm Models
In this study, to optimize the asphaltene adsorption process, it would be necessary to set up a suitable correlation for the adsorption equilibrium data. Three models were used to suit the data of adsorption equilibrium: Langmuir, Freundlich and Redlich-Peterson.
The Langmuir model has three assumptions: first, the surface of the adsorbent is homogeneous; second, the free energy is constant; and finally, the adsorbed substance would not migrate on the adsorbent [
37]. The Langmuir model can be written as the Equations (4) and (5).
where
Ce (g/L) is the equilibrium concentration of the asphaltenes in the liquid phase.
qe (g/g) is the weight of asphaltenes adsorbed per gram of corn stalk fibers at equilibrium.
qm and
KL are Langmuir parameters, which reflect the adsorption capacity and the free energy of adsorption, respectively. The Langmuir parameters can be obtained from linear regression analysis by the adsorption data curve of
Ce/
qe against
Ce.
RL is the separation factor of the Langmuir isotherm.
C0 (g/L) is the initial concentration of the asphaltenes.
The Freundlich model is based on the hypothesis that adsorption is caused by the heterogeneous surface area of the adsorbent, which means different adsorption capacities in the surface areas of the adsorbent [
36]. It is shown as the Equation (6).
where
qe (g/g) is the weight of asphaltenes adsorbed per gram of corn stalk fiber at equilibrium.
Ce (g/L) is the equilibrium concentration of the asphaltenes.
KF ((g/g) (L/g)
1/n) is the Freundlich parameter, which represents the adsorption capacity of corn stalk fibers.
n is also a Freundlich parameter, as a heterogeneous factor of the adsorbent, which indicates the level of adsorption. The values of the Freundlich parameters were generated from linear regression analysis, using the plots of lnqe against ln
Ce.
The Redlich-Peterson model combines three parameters in this model [
38]. It is written as the Equation (7).
Because this model has three parameters, it is impossible to perform linear regression analysis. Therefore, this study transformed this formula into a logarithmic formula [
31,
39], which is written as the Equation (8).
where
Ce (g/L) is the equilibrium concentration of the asphaltenes in the liquid phase.
qe (g/g) is the weight of asphaltenes adsorbed per gram of corn stalk fibers at equilibrium.
X (L/g),
Y (L/g)
α and are three parameters from Equation (8). The Redlich-Peterson parameters can be acquired from the pseudolinear plots of ln (
XCe/
qe − 1) against ln
Ce regression analysis. The values of
X and
R2 are chosen to be the most optimized.
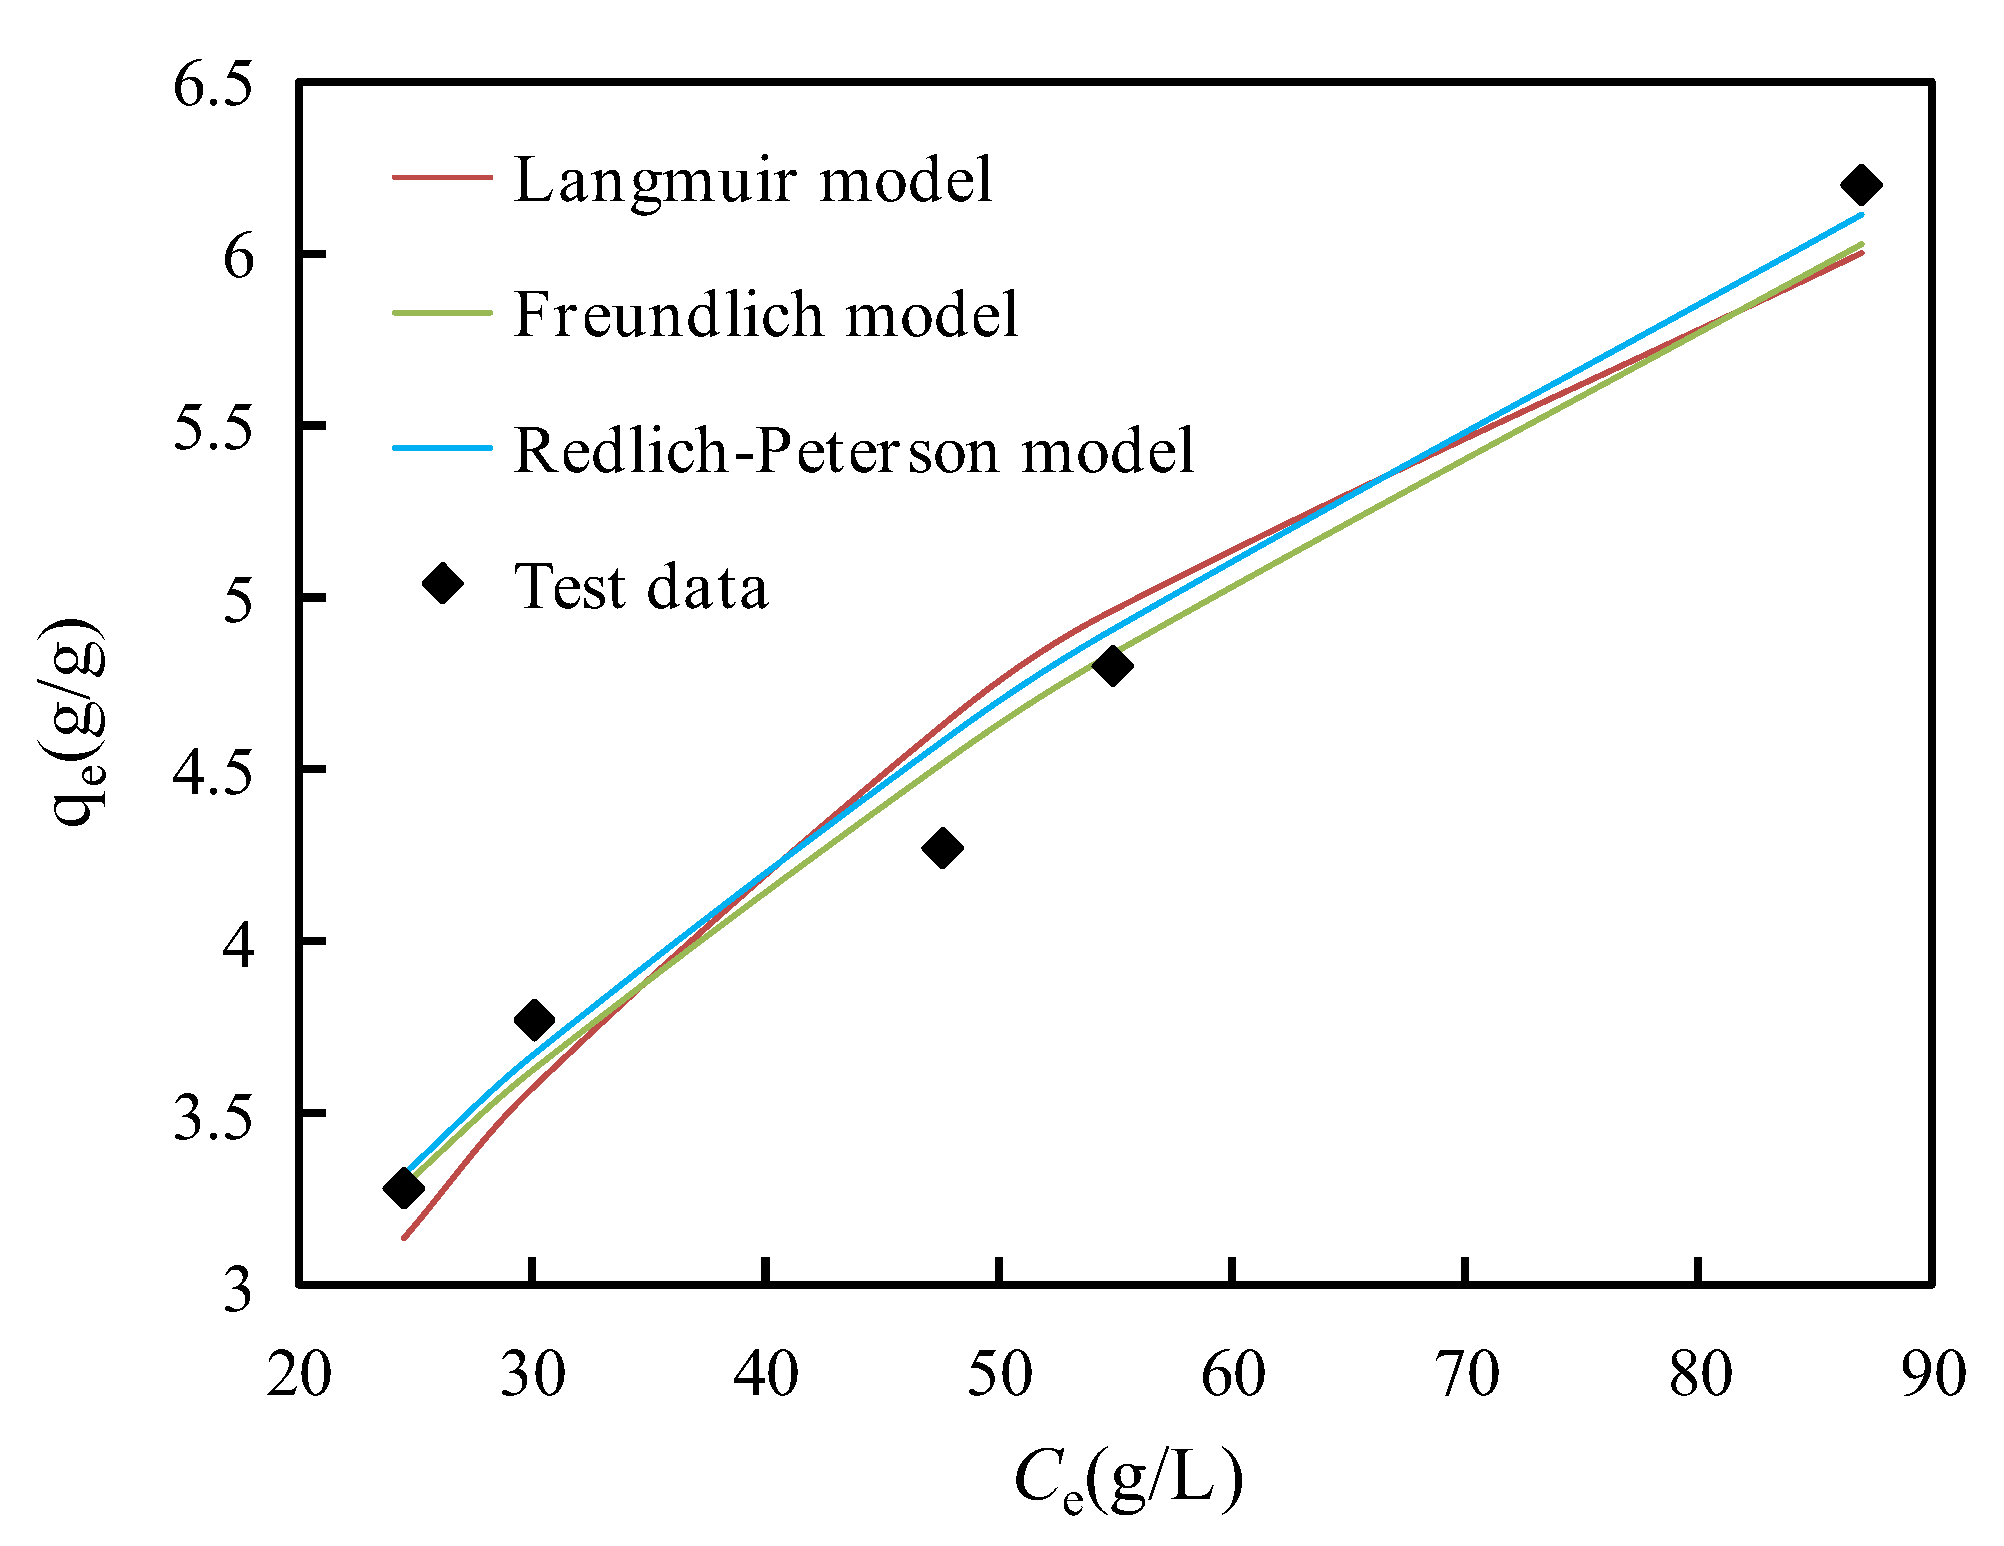
Figure 8 shows that the Langmuir, Freundlich and Redlich-Peterson adsorption isotherms of asphaltenes on corn stalk fibers are related to
qe and
Ce at 135 °C. All the correlation coefficients (
R2) and parameters of the three isotherm models are presented in
Table 3. The
R2 value of the Redlich-Peterson model was the highest (0.979), indicating that the adsorption process of asphaltenes on corn stalk fibers was best described by the Redlich-Peterson model. The next best model was the Freundlich model (0.976), and the last was the Langmuir model (0.952). This phenomenon illustrated that the adsorption process of asphaltenes was more likely to be caused by the heterogeneous surface of corn stalk fibers and involved with multilayer adsorption [
40].
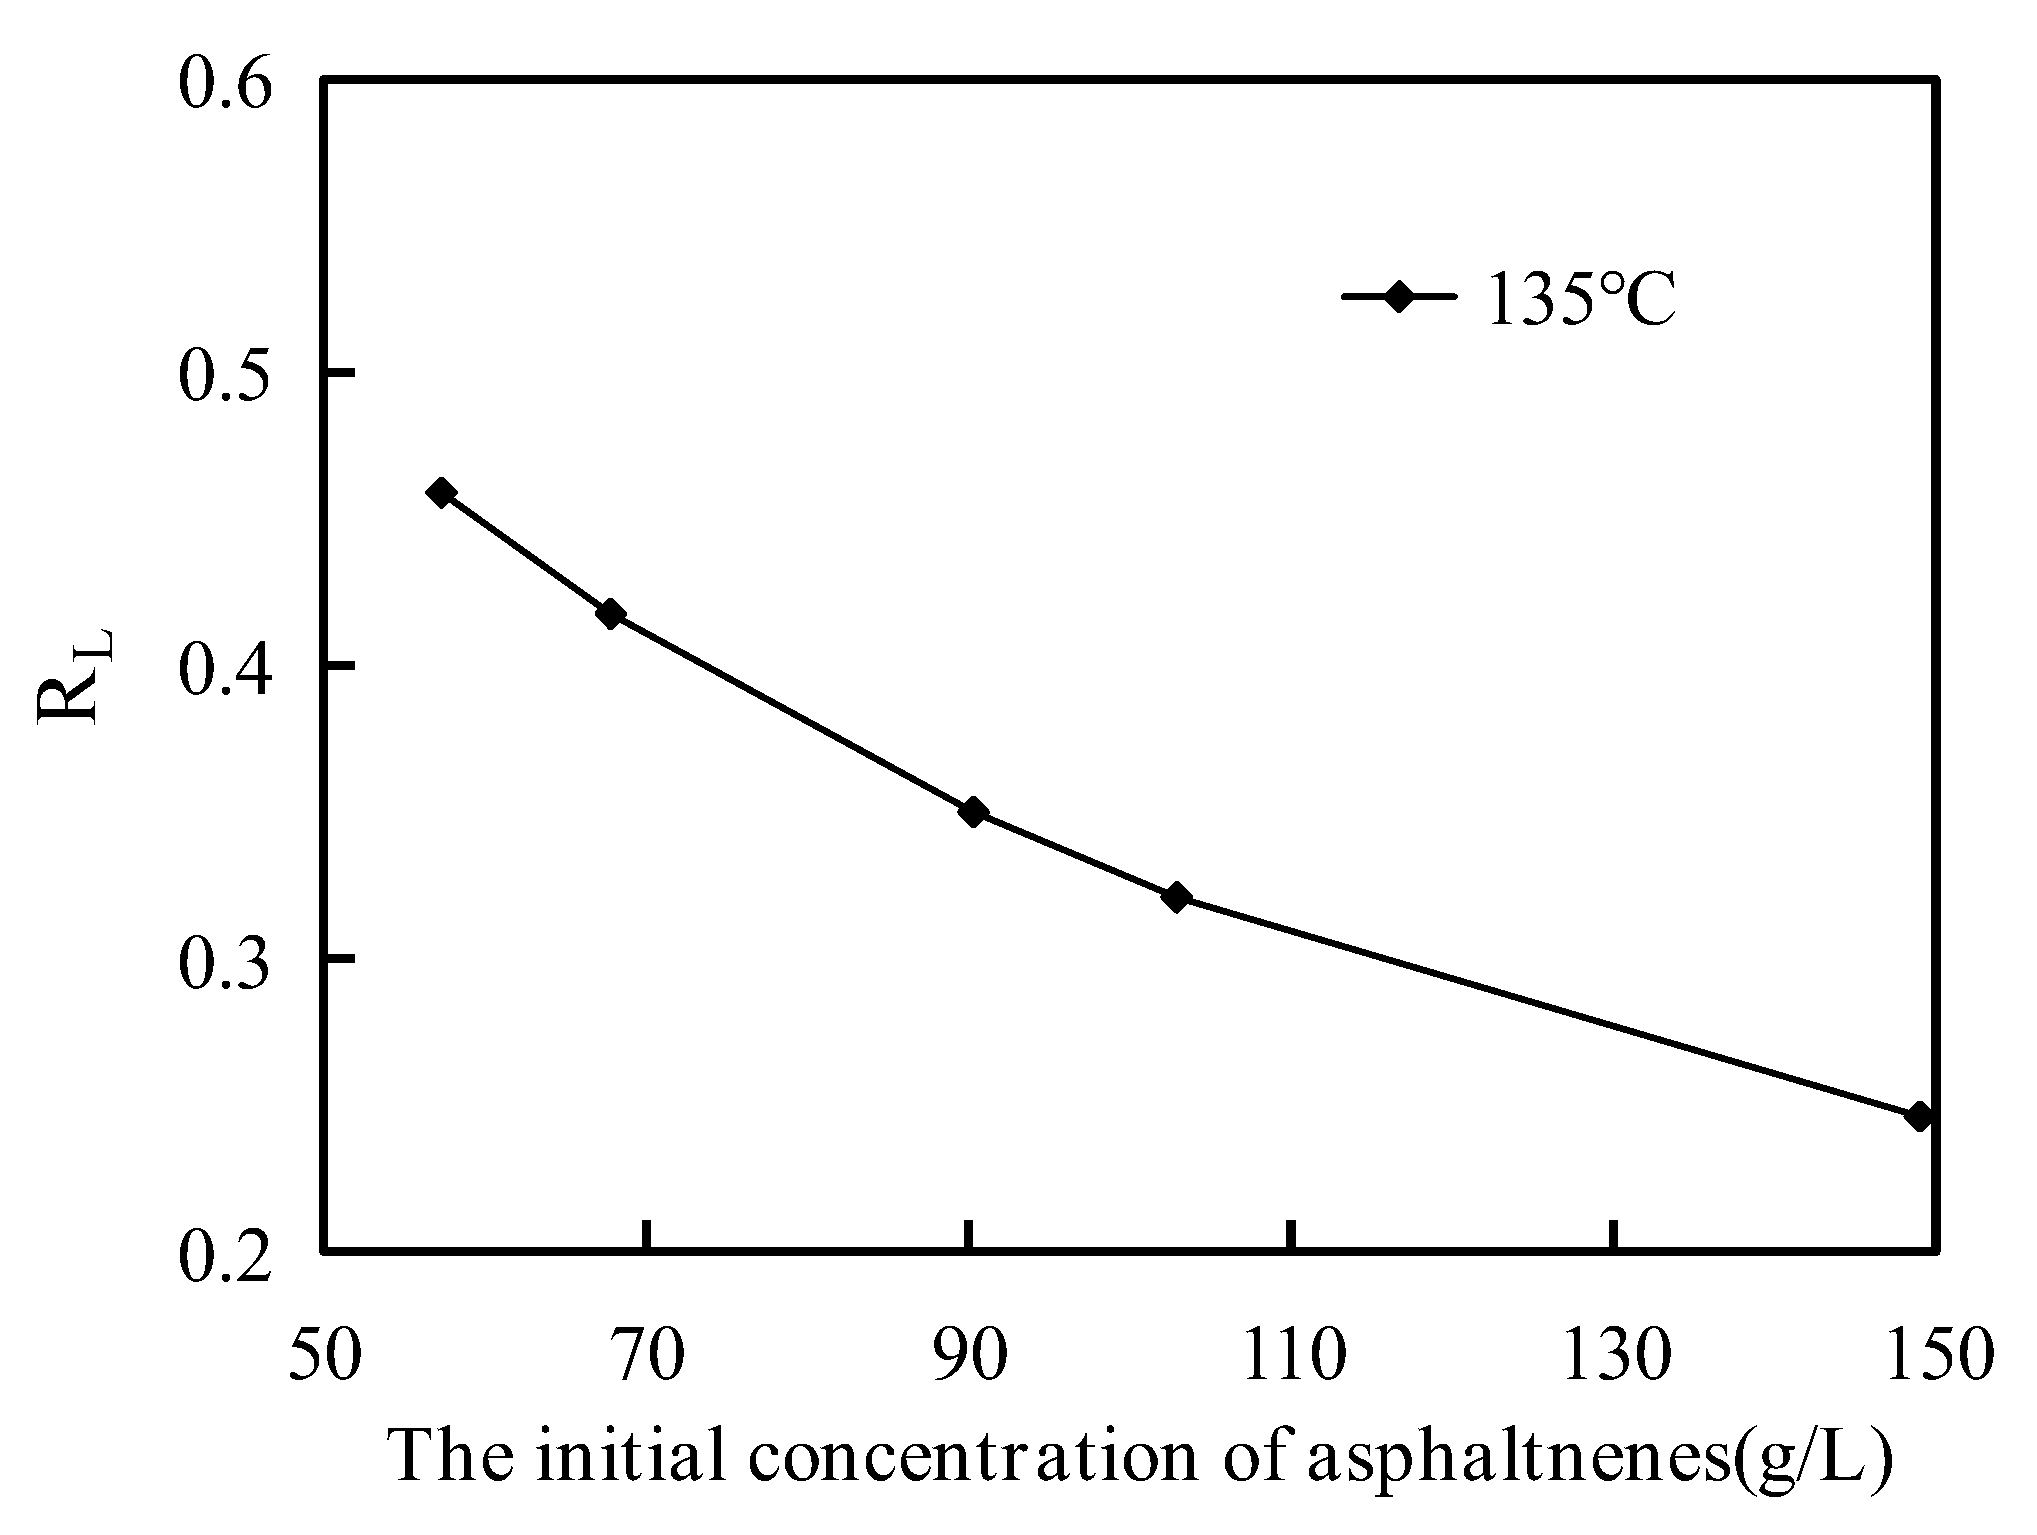
The curve of the separation factor (
RL) from different asphaltene initial concentrations at 135 °C is shown in
Figure 9. The
RL value can be calculated from the Langmuir model parameter and indicates the shape of the adsorption isotherm. The adsorption process was unfavorable when
RL > 1, linear when
RL = 1, and irreversible when
RL = 0, and the adsorption process was favorable when the value of
RL was between 0 and 1 [
41,
42]. From
Figure 9, the values of
RL were all between 0 and 1, illustrating that the adsorption process of asphaltenes on the corn stalk fibers was favorable. The values of
RL decreased with increasing asphaltene initial concentration, demonstrating that the adsorption capacity of corn stalk fibers increased with increasing initial asphaltene concentration because of the driving forces generated by the concentration gradient. The value of 1/
n from the Freundlich model was between 0 and 1 [
32,
42], which also represented the favorable adsorption process of asphaltenes and the heterogeneous surface of corn stalk fibers.
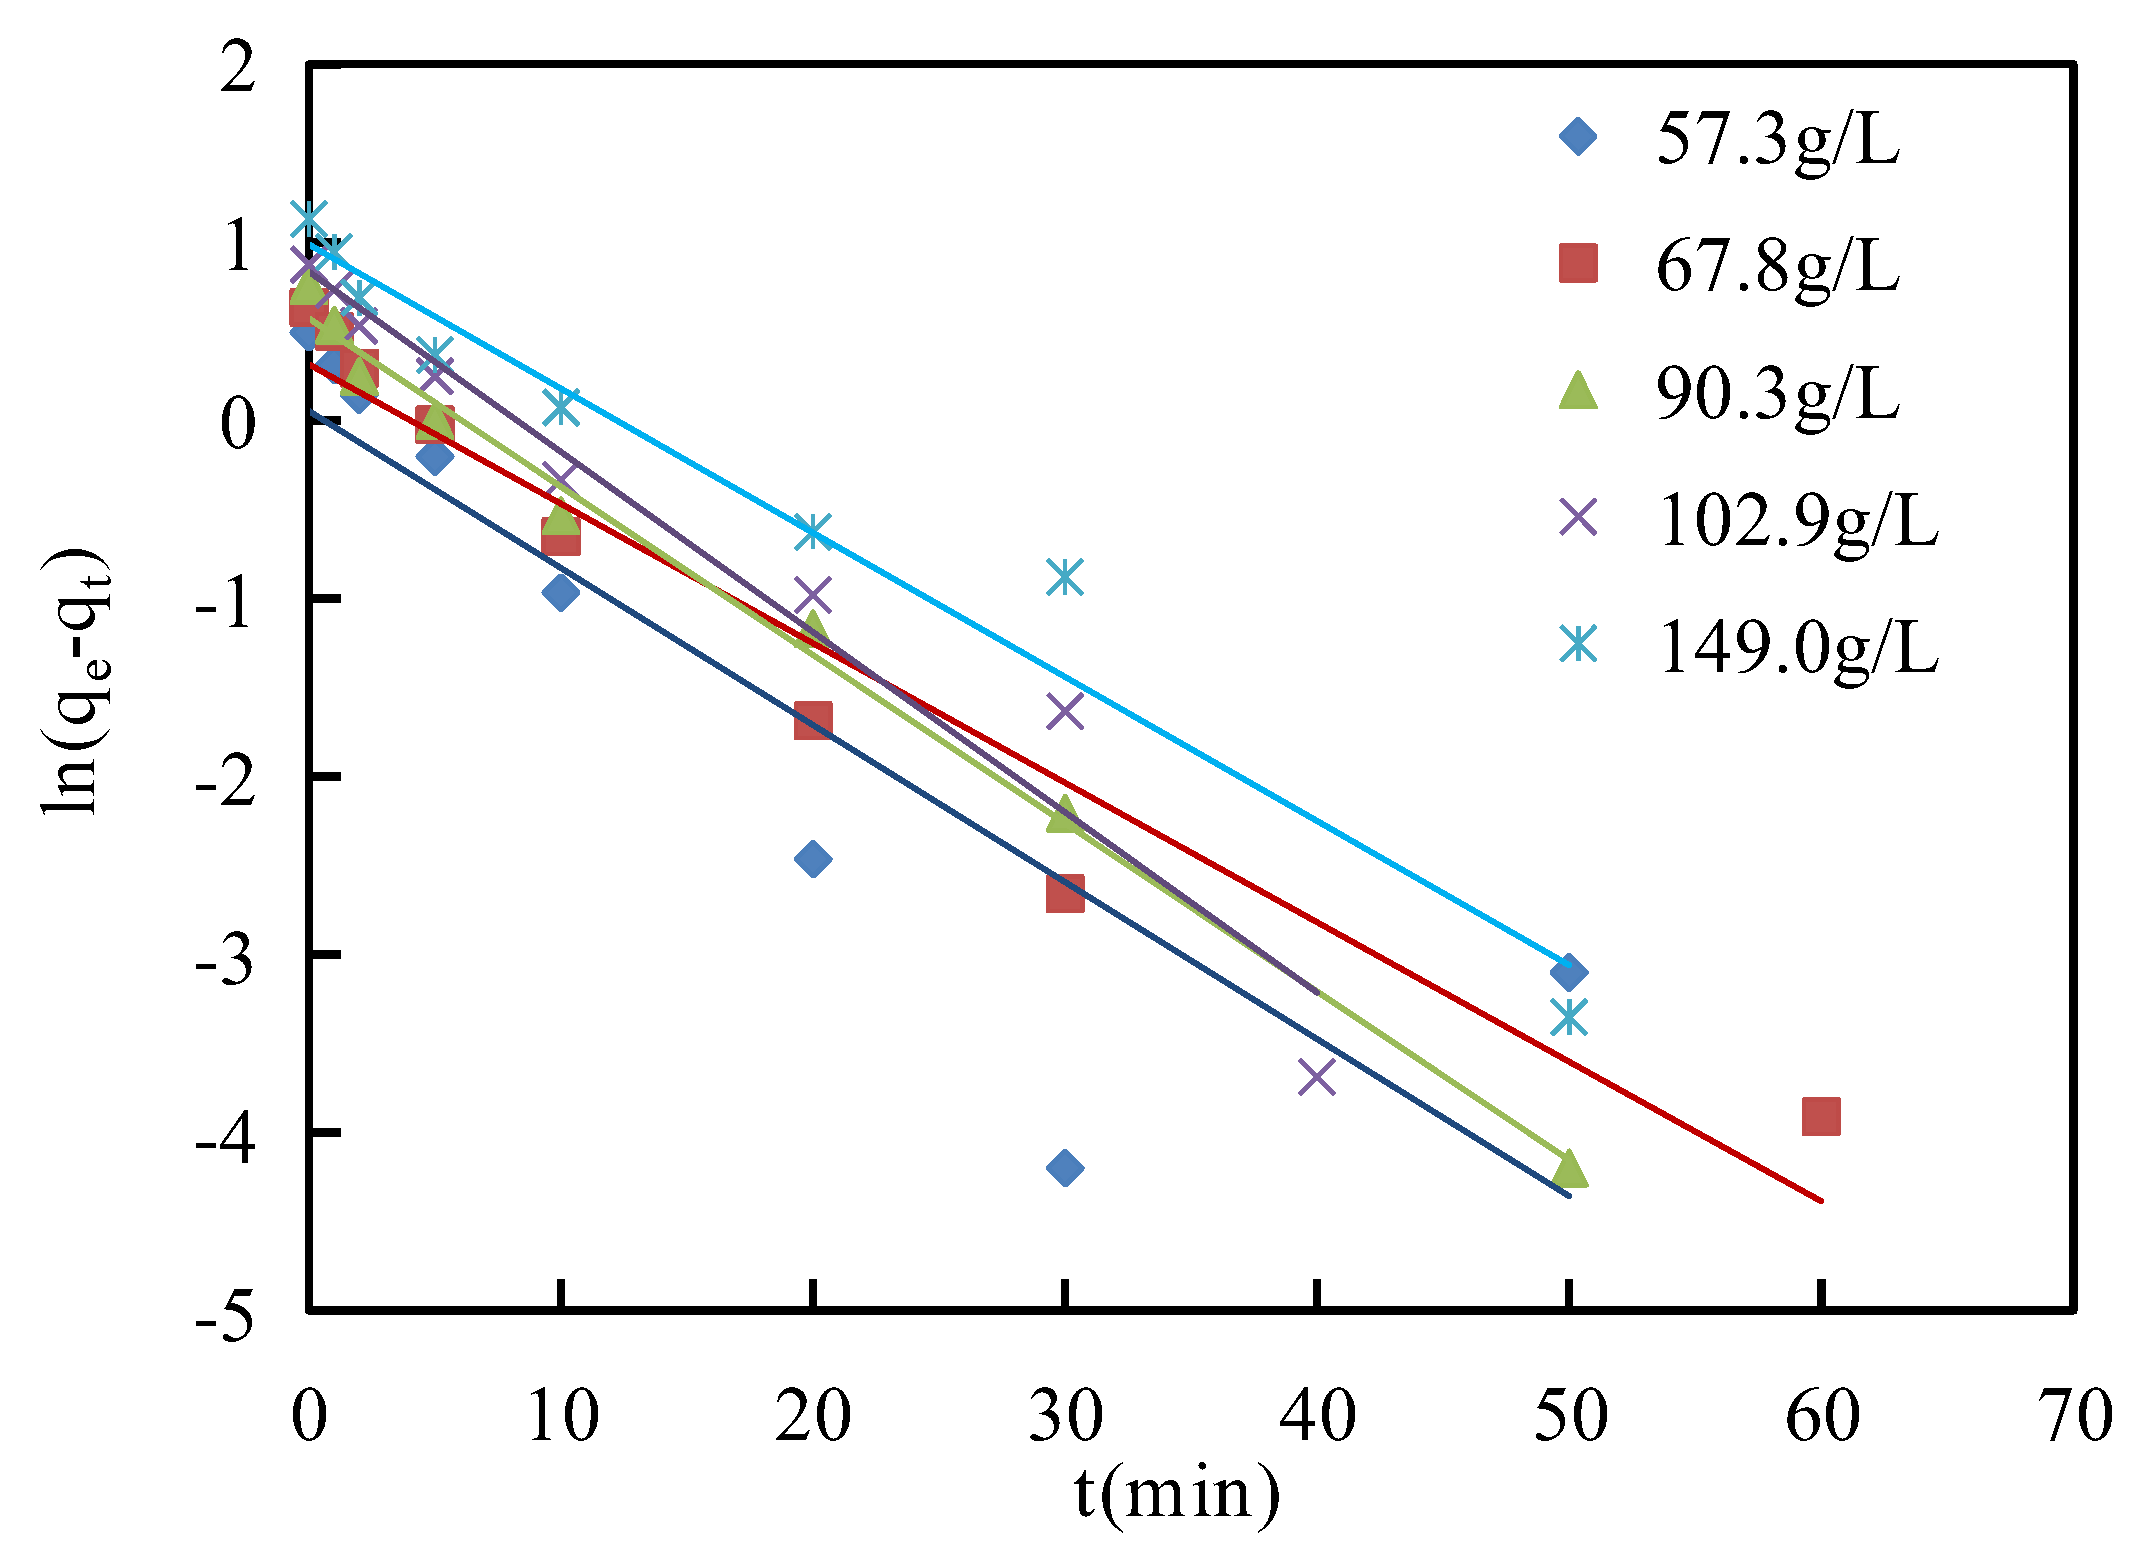
3.5. Adsorption Kinetic Models
The kinetics of adsorption can be used to investigate the interaction between asphaltenes and the surface of corn stalk fibers and characterize the rate of asphaltene adsorption on corn stalk fibers. The pseudo-first-order and pseudo-second-order models were used to describe the behavior of the adsorption process.
The equation of the pseudo-first-order model is written as the Equation (9) [
43].
where
qt (g/g) and
qe (g/g) are the adsorption weights of asphaltenes per gram of corn stalk fibers at any time
t (min) and equilibrium, respectively, and
k1 (1/min) is the adsorption rate parameter of the pseudo-first-order model. The adsorption rate constant can be obtained from the slope of the linear regression analysis between the plots of ln(
qe −
qt) versus
t. The intercept of the linear regression analysis can be the value of ln
qe, and the calculated
qe is the predicted adsorption weight of asphaltenes per gram of corn stalk fiber at equilibrium.
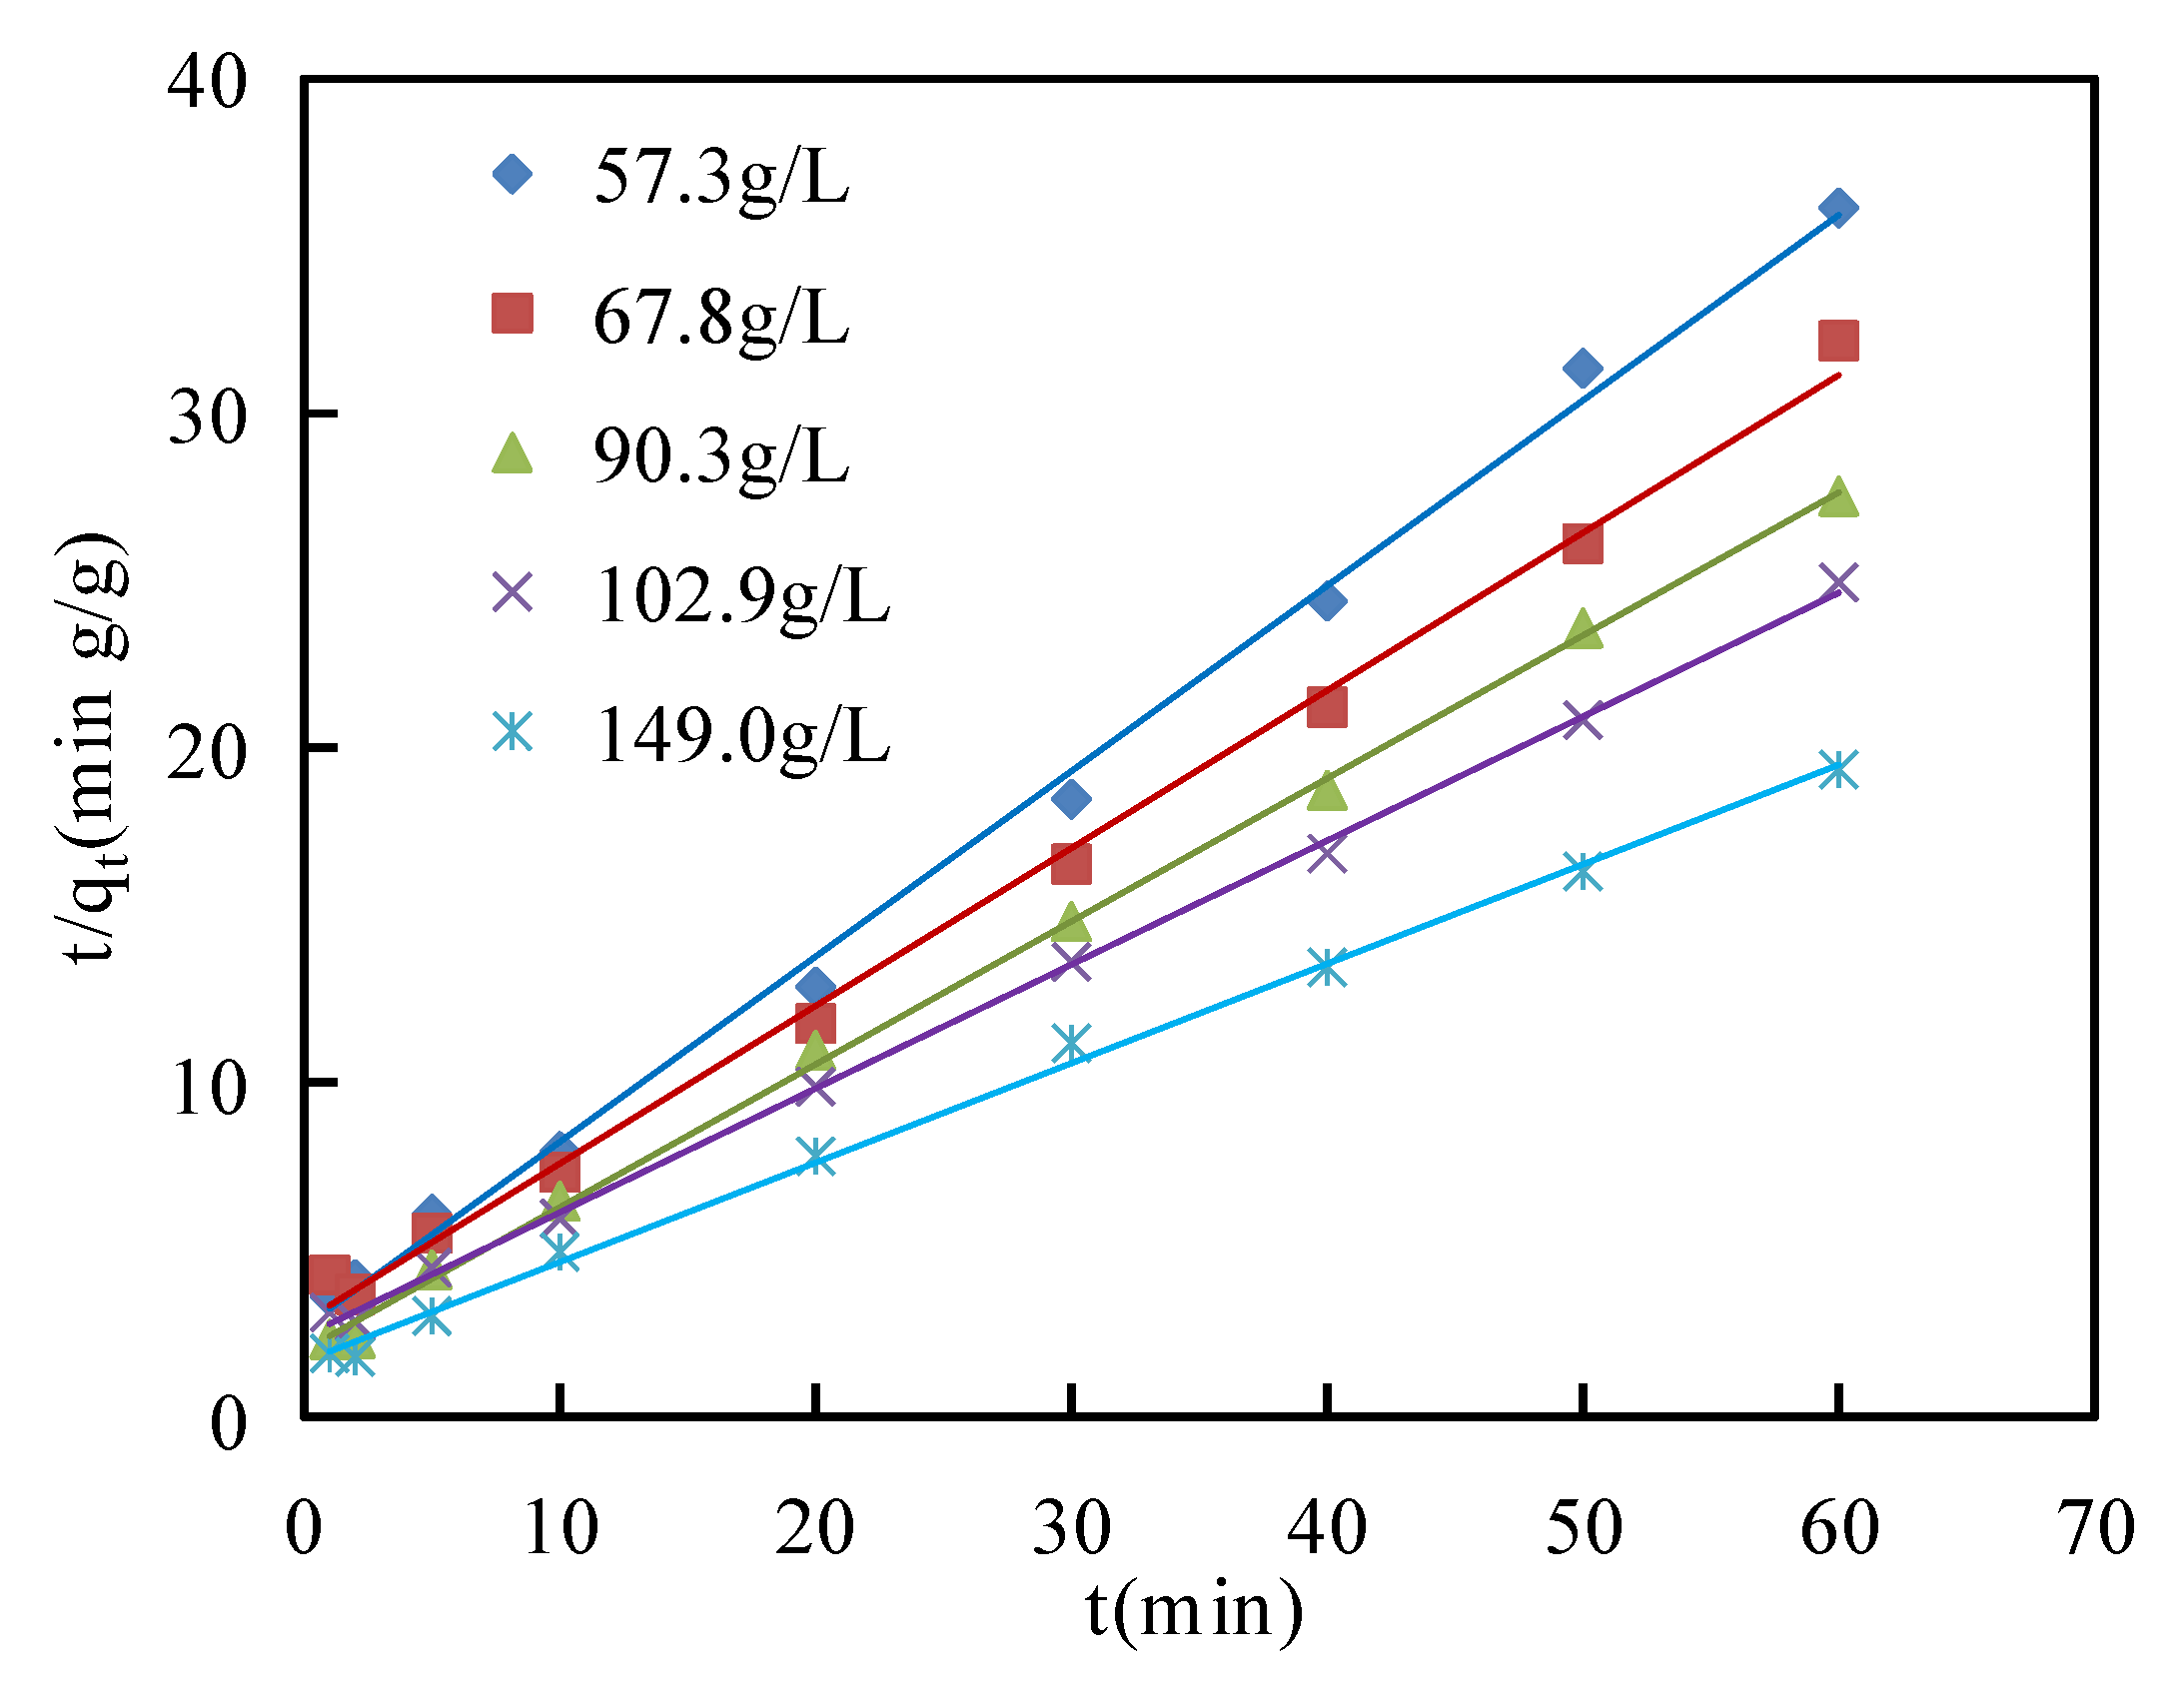
The equation of the pseudo-second-order model is given as the Equation (10) [
44].
where
qt (g/g) and
qe (g/g) are the weights of asphaltenes adsorbed per gram of corn stalk fiber at time
t (min) and at equilibrium and
k2 (g/g min) is the adsorption rate parameter in the pseudo-second-order model. The value of the adsorption rate parameter is generated from the slope of the linear regression analysis using the plots of
t/
qt against
t/
qe. The predicted adsorption weight of asphaltenes at equilibrium can be acquired by calculating the intercept of the linear regression analysis.
The calculated values of
qe,
k1 and correlation coefficient
R2 from pseudo-first-order and pseudo-second-order models are shown in
Table 4. The linear regression analyses of pseudo-first-order and pseudo-second-order models are presented in
Figure 10 and
Figure 11, respectively. The correlation coefficients
R2 of the pseudo-second-order models (0.996~0.998) were higher than those of the pseudo-first-order models (0.767~0.993) at asphaltene concentrations from 57.3 g/L to 149.0 g/L. This indicated that the pseudo-second-order model was a better description of the adsorption process of asphaltenes on corn stalk fibers, and then the values of
qe calculated from the pseudo-second-order model were closer to the experimental values of
qe than those of the pseudo-second-order model. This phenomenon illustrated that the adsorption process of asphaltenes on corn stalk fibers could not only be physical adsorption but also be related to chemical adsorption [
45].
3.6. Adsorption Mechanism
It was necessary to predict the rate-limiting step in the adsorption process, which was controlled by the adsorption mechanism. To analyze the adsorption mechanism and determine the rate-limiting step, the intraparticle diffusion model of Weber and Morris and the film diffusion model of Boyd were used to differentiate between film diffusion and intraparticle diffusion in the adsorption process of asphaltenes on corn stalk fibers.
The equation of the Weber and Morris intraparticle diffusion model is presented as the Equation (11) [
42].
where
qt (g/g) is the weight of asphaltenes adsorbed at any time
t (min).
kpi (g/g min) is the rate constant of intraparticle diffusion.
C is the constant of boundary layer thickness. The value of the rate constant can be obtained from the slope of the linear regression analysis using the plots of
qt against
t0.5, and the intercept is the value of the constant of the boundary layer thickness.
The model of the Boyd film diffusion model is written as the Equations (12) and (13) [
46]:
where
qt (g/g) and
qe (g/g) are the adsorption weights of asphaltenes per gram of corn stalk fiber at any time
t (min) and at equilibrium, respectively. The values of the parameters
B and
C are generated from the slope and intercept of the linear regression analysis by the plots of ln(1 −
qt/
qe) against
t, respectively.
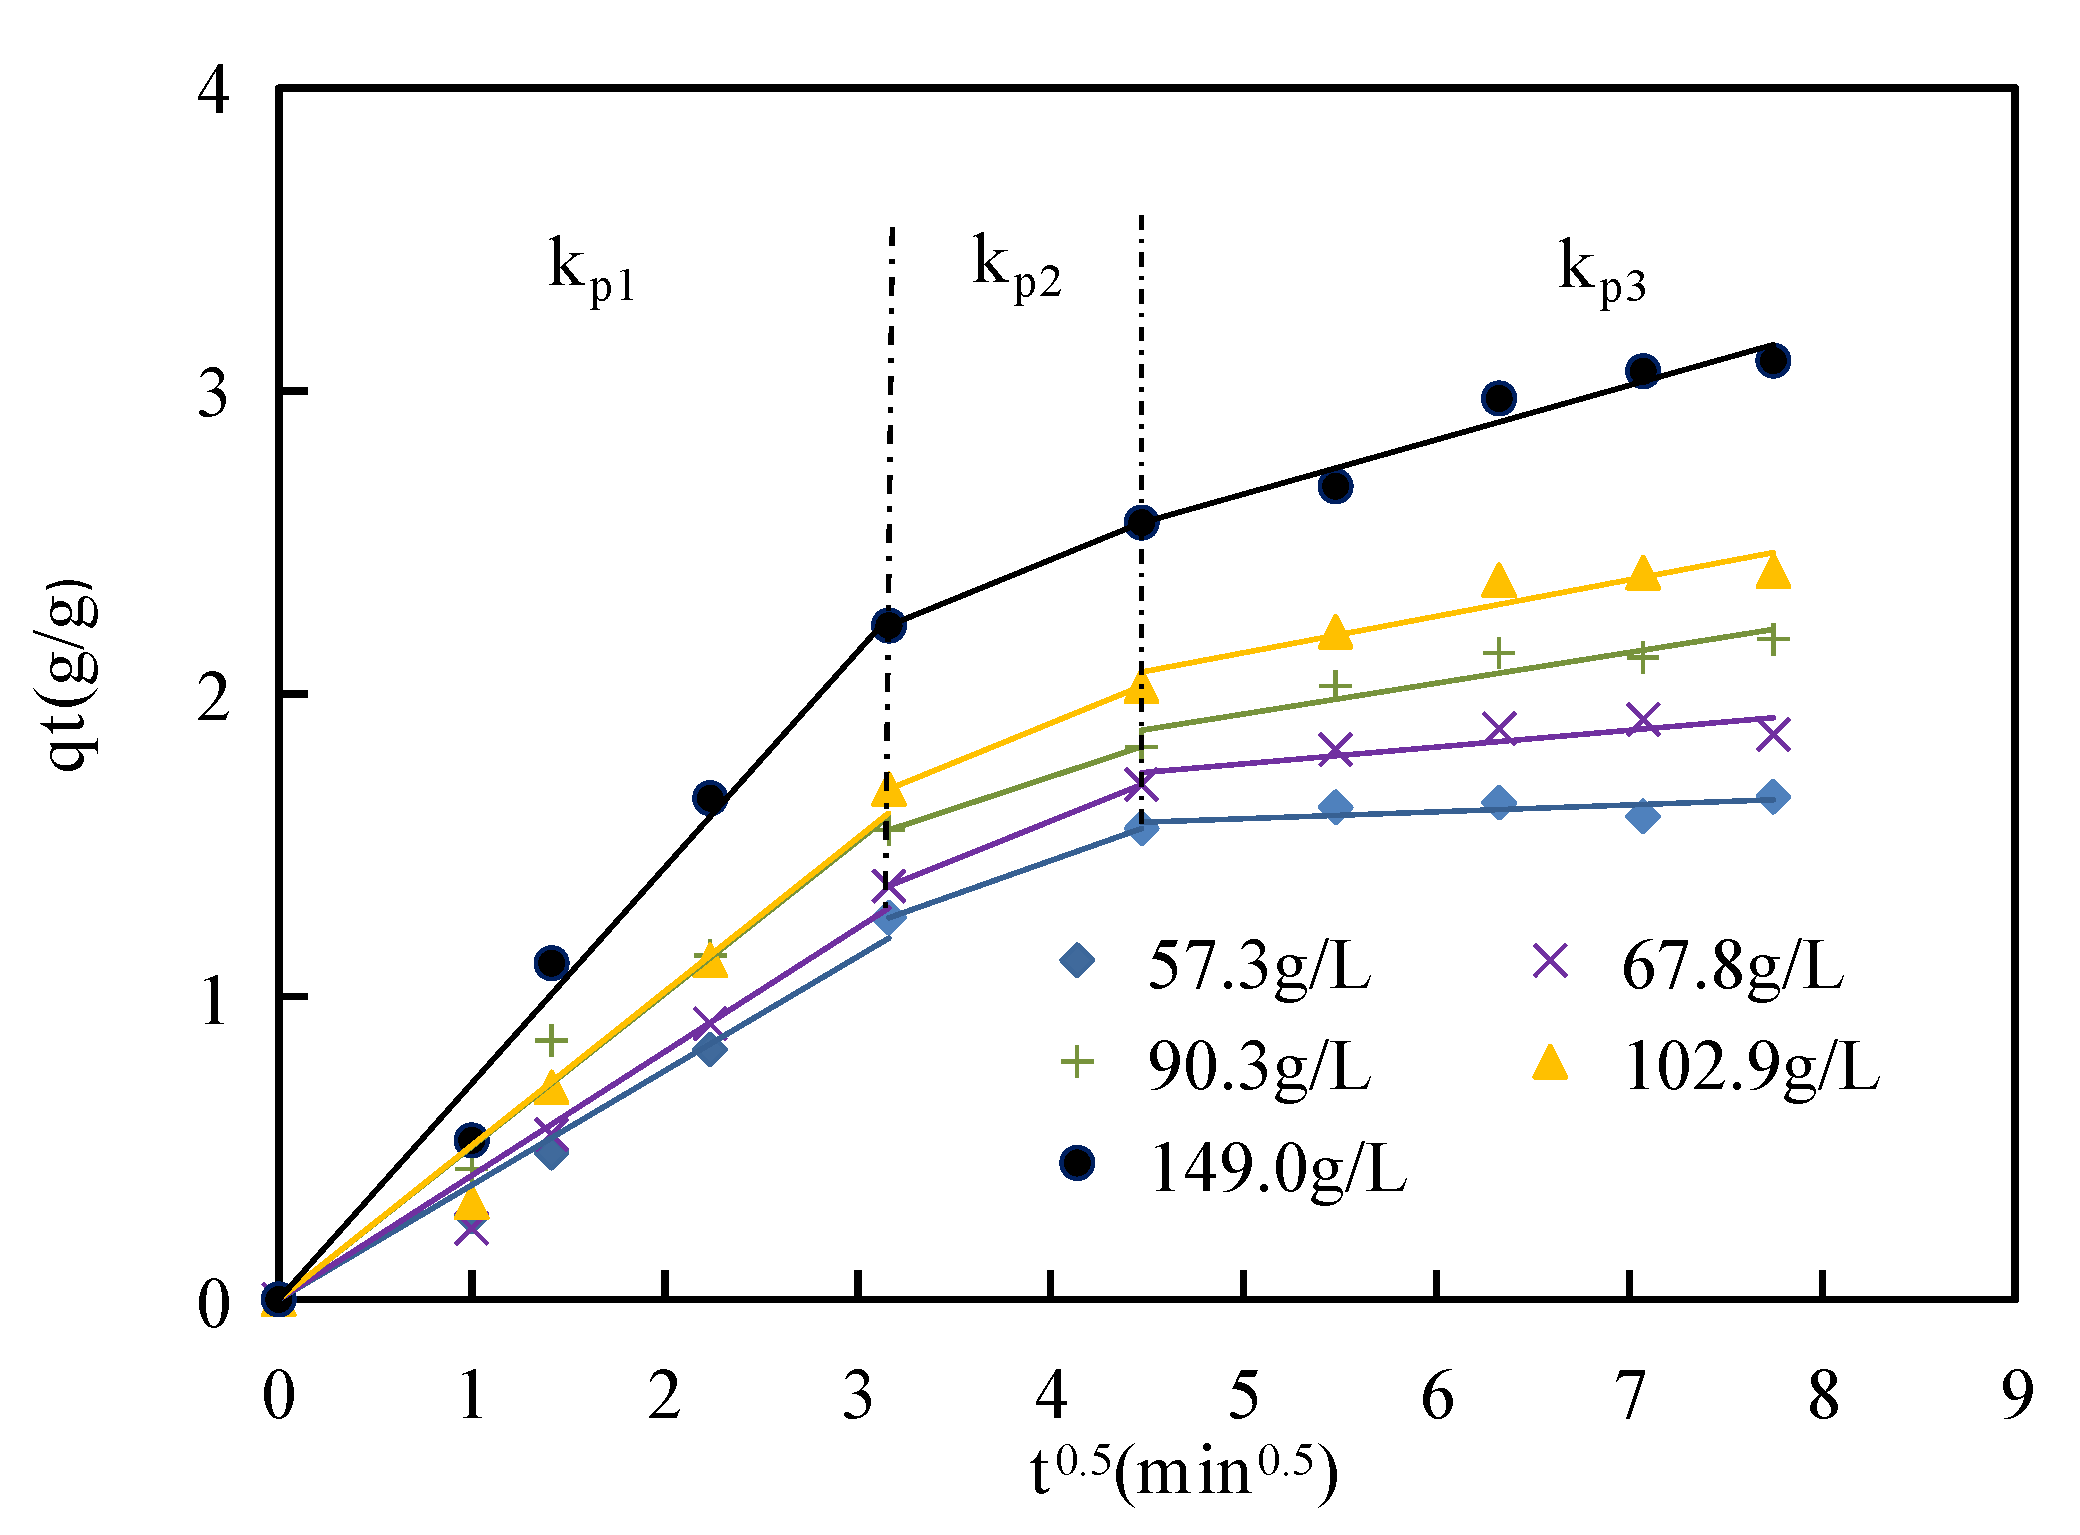
Figure 12 shows the Weber and Morris intraparticle diffusion model of asphaltene adsorption on corn stalk fibers at 135 °C, and
Table 5 presents the values of the parameters of this model. The intraparticle diffusion model was divided into three parts. The slope of the first part (
kp1) was highest, and the highest rate constant indicated rapid asphaltene adsorption on the external surface of corn stalk fibers because there were many adsorption sites and low competition for asphaltene. This phenomenon also indicated that the first part was caused by film diffusion [
47]. The second part was a transitional stage of boundary diffusion and intraparticle diffusion. The third part was mainly controlled by intraparticle diffusion. These stages illustrated that the asphaltenes diffused from the external surface to the internal surface of corn stalk fibers. The adsorption rates of the three parts gradually decreased over time until adsorption equilibrium was reached due to the reduction in concentration driving forces [
48]. The slope of the second part was closer to that of the third part at asphaltene concentrations from 57.3 g/L to 149.0 g/L, which indicated that the time of the transitional stage was shorter as the asphaltene concentration increased. The value of the intercept of the intraparticle model can be used to evaluate the adsorption contribution of the corn stalk fiber surface in the rate-controlling step [
49]. As seen in
Figure 12, the adsorption contribution was best in the first part, followed by the second part and finally the third part.
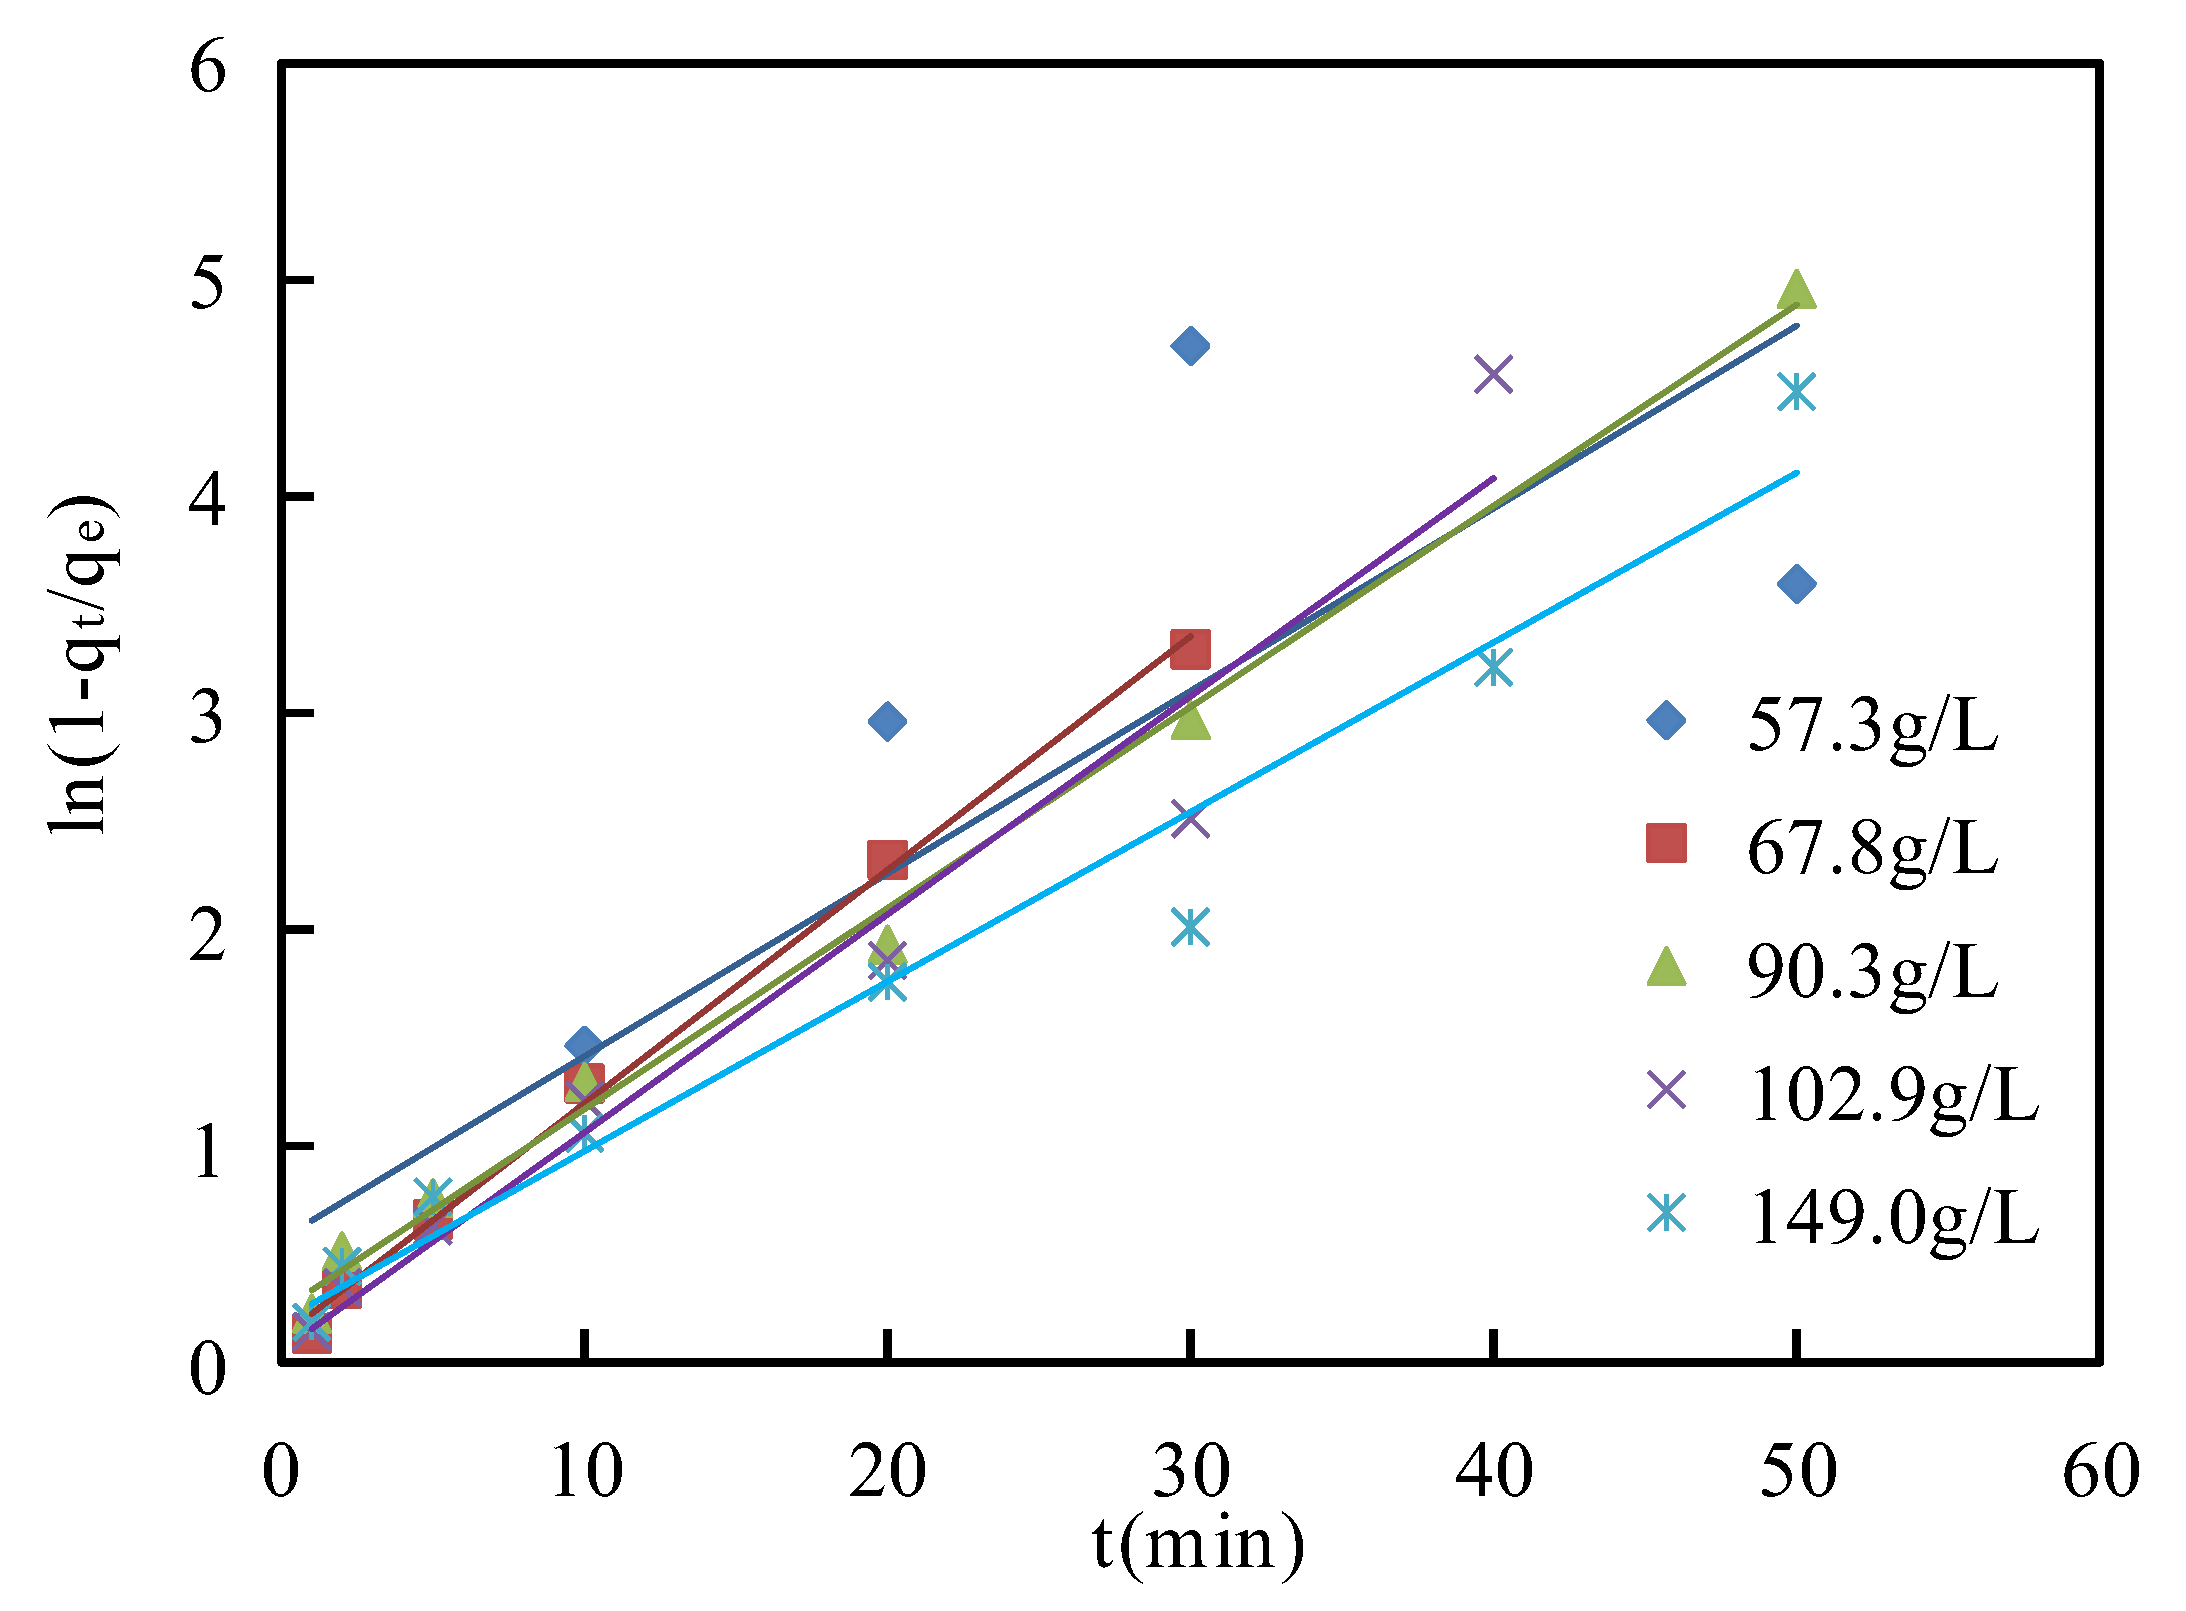
The Boyd film diffusion model for asphaltene adsorption on corn stalk fibers at 135 °C and the values of the parameters for this model are shown in
Figure 13 and
Table 6, respectively. The plots did not pass through the origin for
C values from 57.3 g/L to 149.0 g/L, which illustrated that asphaltene adsorption on the corn stalk fibers corresponded to film diffusion. This diffusion was the rate-liming step [
46]. The adsorption mechanisms of asphaltene on corn stalk fiber are shown in
Figure 14.
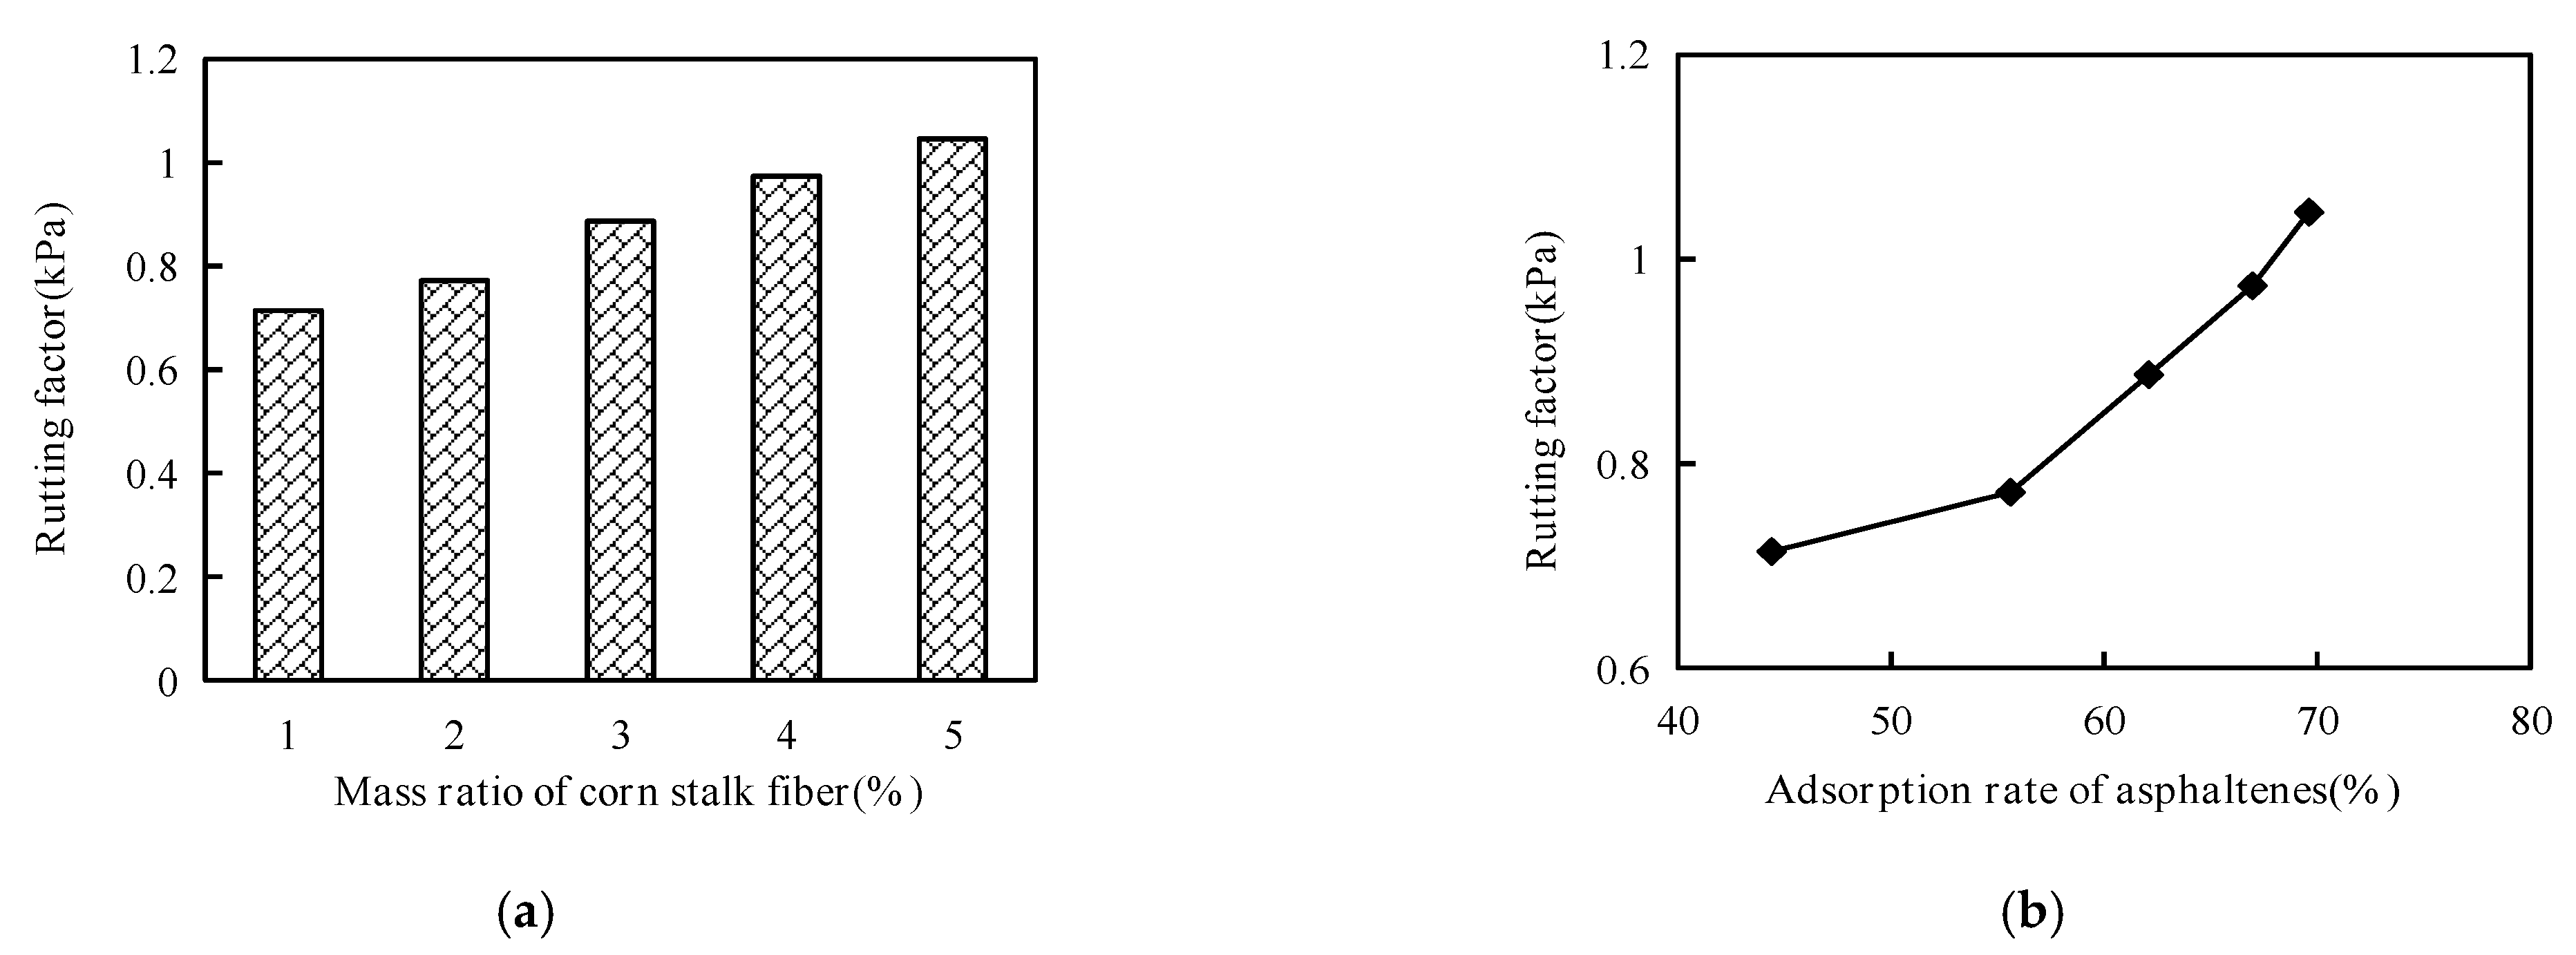
3.7. Effect of Asphaltene Adsorption Rate on Corn Stalk Fiber Asphalt Performance
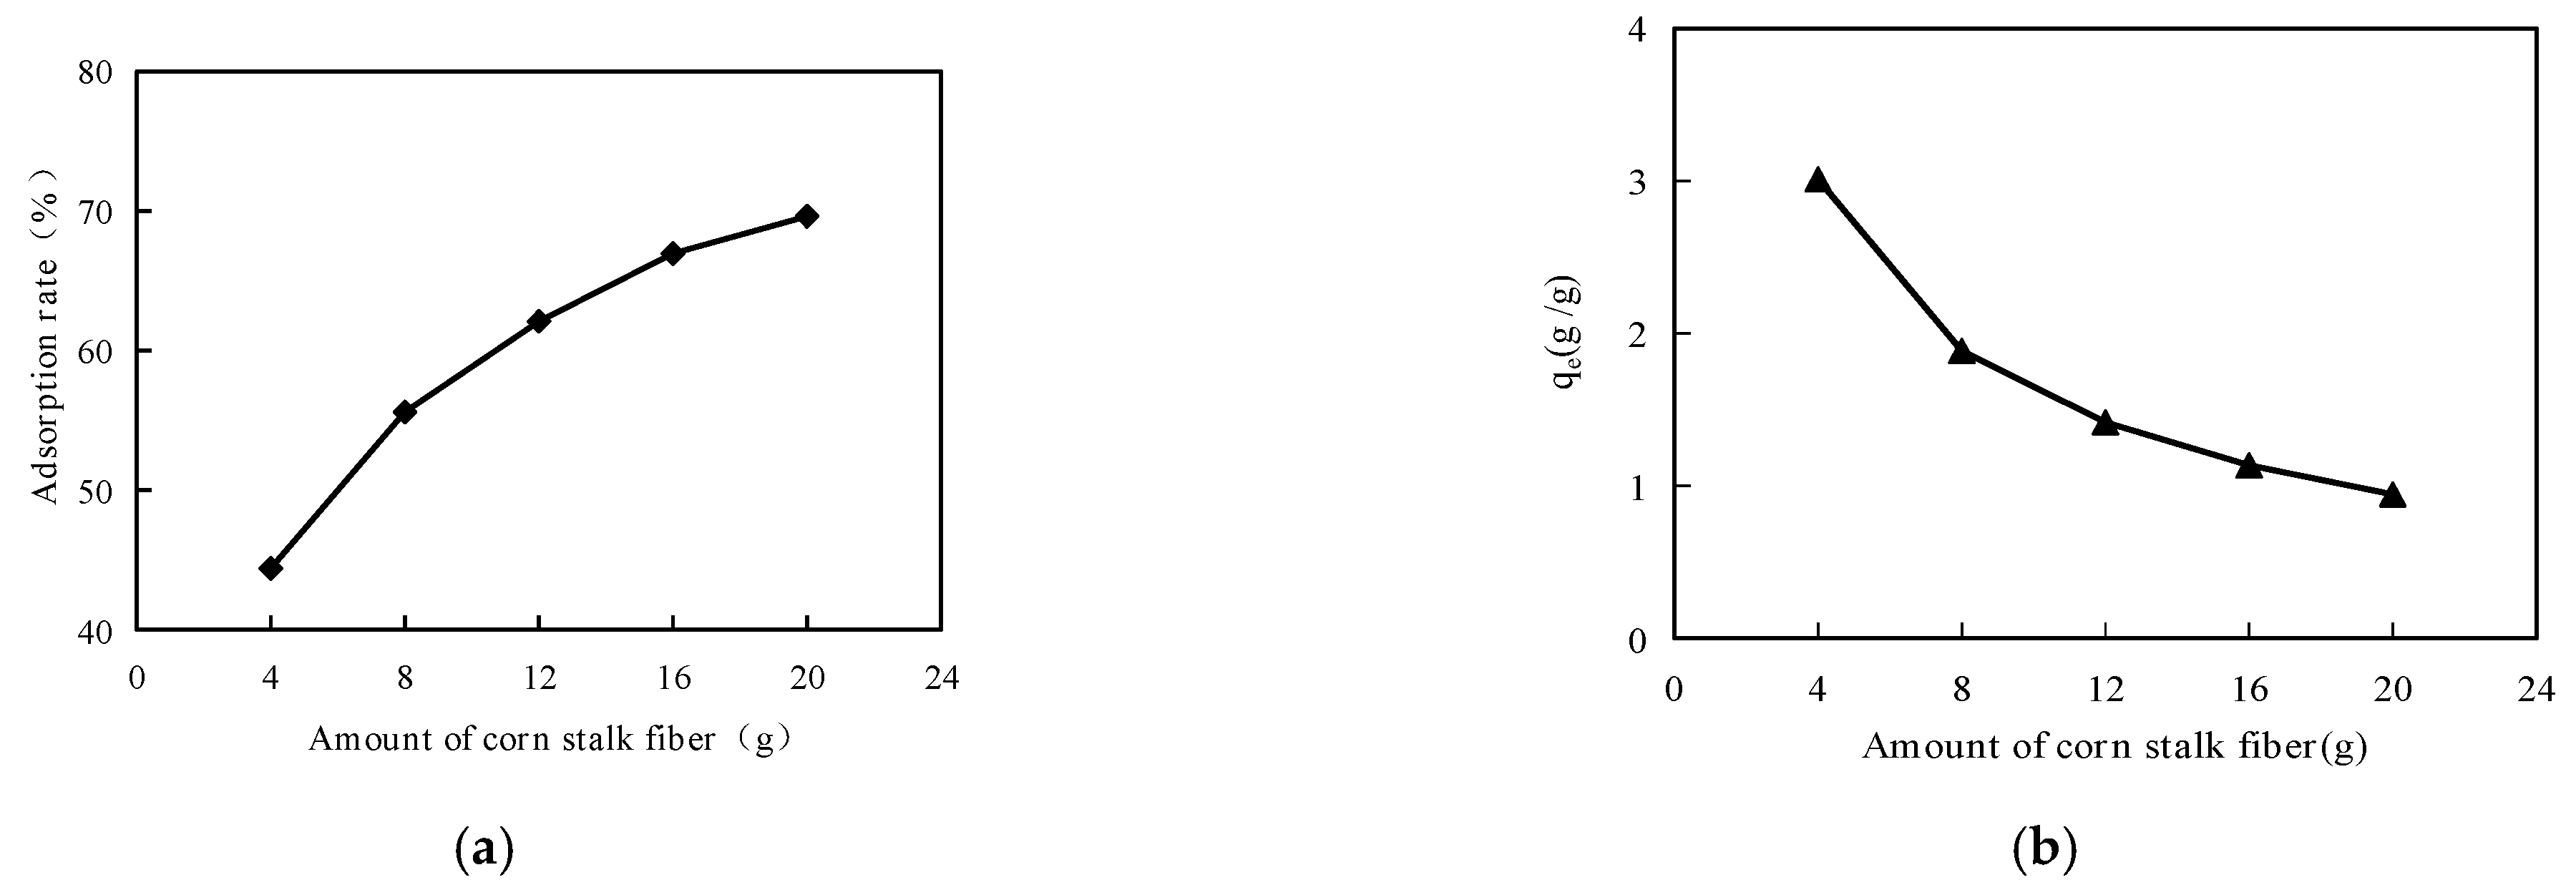
Corn stalk fibers weighing 4 g, 8 g, 12 g, 16 g and 20 g were mixed into Anda-70 asphalt, and then the high-temperature performance was evaluated by dynamic shear rheological (DSR) testing. The test procedure was that corn stalk fiber asphalt was first placed on the test plate. Then, the instrument automatically adjusted the distance between the oscillating plate and the test plate. Finally, the rutting factor parameters were obtained by rotating and shearing the corn stalk fiber asphalts at 70 °C to account for the high temperature performance.
Figure 15a shows that the values of the rutting factors increased as the mass ratio of corn stalk fiber increased, and the mass ratio of corn stalk fibers also affected the adsorption rate of the asphaltenes. From
Figure 15b, it can be seen that the values of the rutting factors also increased as the adsorption rate of asphaltene increased. This explains why corn stalk fibers have a good effect on the high temperature of asphalt, and corn stalk fibers can adsorb asphalt.


