Article

Quality of Forecasts as the Factor Determining the Coordination of Logistics Processes by Logistic Operator

Department of Organizational and Management, Logistics Institute, Silesian University of Technology, 41-800 Zabrze, Poland
*
Authors to whom correspondence should be addressed.
Sustainability 2022, 14(2), 1013; https://doi.org/10.3390/su14021013
Submission received: 30 November 2021 / Revised: 10 January 2022 / Accepted: 13 January 2022 / Published: 17 January 2022

Abstract

:
(1) Background: Currently, logistics operators are struggling with the problem of acquiring new areas to create added value. One of such challenges is acquiring a new function in the form of demand forecasting and coordination skills. The increase in the need to forecast demand is related to the increasing complexity of the distribution network, omnichannel systems and turbulent environment. It is necessary to have a comprehensive approach to the distribution network and to develop competences related to coordination. For the authors, one of the most important coordination factors is the quality of forecasts, especially in relation to modern logistics operators. (2) Methods: In literature studies, the authors combine prognostic abilities with a predisposition to coordinate logistic processes in distribution networks. The aim of the research is to develop a forecasting model that will allow a logistic operator who aspires to coordinate logistics processes to create forecasts in the distribution system. The tool was developed in the R programming language and allows for forecasting based on data from the Warehouse Management System; (3) Results: The quality of forecasts is correlated with the characteristics of the products, the relationship between the manufacturing company and the logistics operator, and the configuration of the distribution network in individual chains. The results of the forecasts were compared with selected features of each of the 5 distribution networks that were tested. In parallel, the attributes of a company capable of forecasting in the distribution network were analyzed. These attributes were also compared to those of the logistics operator. (4) Conclusions: The authors proved that a logistic operator with a set of defined features is capable of generating demand in the entire distribution network.

1. Introduction

Supply networks as a structure of networks of cooperating organizations by way of producing and delivering a product to customer [1] are a system composed of production, trade and service organizations [2], in the conditions of nowadays challenges distribution networks are also one of the main fields of practical and science interest. The supply network deals with the issues of logistics networks, supply networks, production networks and distribution networks. By narrowing the research to the distribution network, authors deliberately limited the scope of the impact of network relations, giving them a beginning in the production of the product (production organizations and those implementing tasks of deferred production) through trade organizations (including various forms of wholesale and retail) and logistics organizations (including various participants of the TSL (transport, forwarding, logistics) market and thus both shippers, carriers, logistics operators, distribution centers and logistics centers), ending with end customers, i.e., consumers or enterprises using a given product in the production process [3].
The literature covers both cooperation between enterprises in distribution channels [4] and horizontally between enterprises at a given distribution level [5]. As is indicated by economic practice the role of individual links changes with the change of the cargo decoupling point of the supply chain. The distribution network is most developed for standard or multi-variant products manufactured to stock. The intensity of the distribution network decreases with the increase in the degree of product differentiation (product personalization). Authors specializing in distribution systems agree that the intensity of distribution depends on the characteristics of the product itself [6] which are also reflected in the location of the cargo decoupling point of the supply chain [7,8,9]. Regardless of the degree of individualization of the product and the degree of distribution intensity, logistic organizations play an important role in ensuring that the product is available in the right place, time, quantity and quality at the right cost [10,11]. However, depending on the degree of product differentiation, the role of logistic organizations in building the level of customer satisfaction differs. Logistics service providers try to propose value-added services, especially those focused-on inventory management. Adopting forecasting tasks to determine inventory levels is one of the challenges facing logistics operators today, which are pretenders for the distribution network coordinator’s role. A logistics operator is a company that creates, manages and controls the supply chains of other companies. A logistics operator depends on a contract between two entities and can perform activities related to the supply, transport or distribution. Coordination of goods streams generally requires the access to the data and skills in data usage for forecasts creation and inventory management. The increase in the complexity of the distribution network, in particular related to the development of omnichannel systems [12] is an additional stimulus for the development of forecasting systems at the level of logistics operators, which take over, in this system, the role of logistics processes coordinators. At this point, there are two key issues that require research. Firstly, it is important to define the characteristics of the logistics operator itself, which will determine the quality of the forecasts it creates. Quality of forecasts decides about efficiency of logistics processes coordination by inventory manipulations. Indicating the attributes of production companies that undertook forecasting for complex systems is undertaken in the literature [13,14,15]. Drawing knowledge from these studies, the authors indicated those attributes that become key for the selection of a logistics operator who is to pretend to the role of coordinator and to create the forecasts for the needs of inventory management. Forecasting in the case of a logistics operator concerns the provision of information on product releases from the warehouse, so it includes flow streams both in traditional distribution channels and in e-commerce. This information is important both for producers and traders in the distribution network. Forecasting capabilities, including the selection of forecasting models adequate to the type of network and product type, is an important competence of logistics operators deciding on inventory management in the entire complex distribution network. As indicated by Iannaccone, Marcucci and Gatta [16], such competences of logistics operators become particularly important in the time of the COVID-19 pandemic. The degree of distribution intensity as an important factor for the forecasts is an element of the distribution network configuration. In accordance with the concept of Corsaro, Ramos, Henneberg, Naude [17], the number of nodes, distribution of nodes and relations between participants were taken into account.
The individual factors influencing the quality of forecasts: the characteristics of the products within the distribution network, the characteristics of the forecasting link and the configuration of the distribution network are discussed in the literature by various authors independently of each other. This article attempts to combine these three determinants and transfer them to an object that has been poorly recognized so far in the context of forecasting, which is a logistics operator. The goal of the research is to develop a forecasting model that allows the logistics operator, which planned to coordinate the logistics processes, to create forecasts in the distribution system. In order to achieve the goal, the authors formulated three research questions:
  • Question 1: What features must a logistic operator have to create forecasts that will be useful for other links in the distribution network?
  • Question 2: How does the characteristics of the products within the distribution network affect the quality of the forecasts made by a logistics operator?
  • Question 3: How do the elements of the distribution network configuration affect the quality of forecasts made by a logistics operator?
At the stage of searching for an answer to question 1, the authors conducted a survey on the basis of which they selected those features of the organization that influence the high quality of forecasts. The research covered production organizations forecasting in the distribution network. Authors gathered 72 answers of 12 questions from enterprises. This stage of the research made it possible to select a logistics operator, potentially predisposed to coordination and create forecasts in the distribution network, based on the indicated characteristics. The international logistics operator declared its participation in the research by sharing data and conducting pilot research. He also confirmed the need to build a forecasting model and its implications in the practice of coordinating material flows in the distribution network. The separated logistics operator served as a case study for the preparation of forecasts for 5 different distribution networks. A logistics operator is an organization through which products with different characteristics flow. In the next stage, the research was narrowed down to select those products for which the forecasts created by the operator are of the highest quality. These were products with a cargo decoupling point of make to stock. For this product group, 5 distribution network configurations were analyzed. Each of these networks had different properties in terms of product characteristics within the network and network configuration. For the characterized networks in the R language (version x64 4.0.4), a prognostic model was created. The paper begins with a review of the literature, which was aimed at indicating a temporary approach to forecasting in distribution networks. On the one hand, the authors focused on the factors influencing the quality of forecasts, and on the other hand, discussed the role of a logistics operator in today’s complex distribution systems. Against this background, they outlined the cognitive gap which is the concept of forecasting in the distribution network from the level of a logistics operator. The research questions posed became the basis for designing individual stages of the research. These aspects are discussed in the methodical part of the work. The results of the research and the discussion of the results presented in the following chapters of the paper not only show the application of the designed tool but also provide tips for further research in the field of new roles of the logistics operator and challenges for high-quality forecasts in complex distribution systems.

2. Theoretical Background

2.1. The Distribution Network as a Particularly Complex System

The distribution network is a metasystem which is characterized by considerable complexity. The complexity of the distribution system is not the same as the intensity of distribution. The intensity of distribution determines the degree of market coverage, the number of distribution channels and their width. Thus, the intensity of distribution may be one of the elements that determine the complexity of the system. When analyzing the distribution network through the prism of its complexity, it is necessary to take into account the elements determining the configuration of the distribution metasystem. The configuration of the distribution system depends on the material point of separation of the supply chain [18]. The main determinants of CDP (Customer Orders Decoupling Point) location are fluctuations in demand, product characteristics and customer requirements. The consequence of the location of CDP is the concept of inventories in the supply chain [19]. The most common configurations resulting from CDP placement are MTS, MTO, ATO, and ETO [8,9,20]. Setting up a supply chain that supports the Make-to-Stock (MTS) model requires distribution companies to allocate finished goods to the marketplace. To this end, such enterprises build network relationships with organizations that enable them to increase the range of market influence. In the Assembly-to-Order (ATO) model, distribution companies can carry out deferred production tasks. Network relationships here are complex and intense. In the Make-to-Order (MTO) model, distribution channels are shortened and the role of distribution is reduced. In the Engineer-to-Order (ETO) model, the configuration of the supply chain is changed, networks are shaped at the supplier level, and direct channels are created in the distribution area [21].
The network approach in logistics, including distribution systems, is currently widely discussed. The complexity of the distribution network increases in line with the increase in product differentiation options adjusted to the expectations of recipients, and also due to the increased uncertainty of customer expectations regarding specific product variants. Customer expectations concern not only the form of the product but also the method of its delivery as well as post-transaction service, including returns and complaints. These factors influence the network’s tendency to increase flexibility through both the inclusion of different links and the diversification of relations between network participants. The complex linkages between manufacturing, trading and logistics companies during the pandemic (Covid 19) play a dominant role in today’s distribution systems. Flexible systems based on the omnichannel strategy cope with the issue. This strategy was known before, but in recent months it has been developing intensively compared to multi-channel systems. The main idea of omnichannels is the free movement of customers between different channels at the time and place convenient for the buyer [22]. Such a solution enables customers to have wider access to products at the same time giving the opportunity to analyze the way of purchasing a product and its change [23].
The freedom to choose a channel also entails building solutions that will ensure the same level of customer satisfaction regardless of the channel they choose. It increases the complexity of tasks connected with coordination of all distribution system such as inventory management, forecasting and transportation processes organization. As the paper focuses on products made to stock and at the same time purchased by consumers in retail outlets, the set of logistics elements that build satisfaction is significantly reduced. In the case of this type of product, the key element of logistic customer service is the availability of products from stock. The availability of products from stock is assessed in the retail node of the network, however, it is the logistics operator that is responsible for supporting trade and production companies in the area of material flows. From this point of view, it is extremely important to manage the inventory of finished products throughout the distribution network. Thus, forecasting skills become an extremely important competence in modern distribution systems. Both manufacturing and trading companies forecast sales using various methods. However, can such a task be performed by logistics companies, especially a logistics operator? The answer to this question requires considering two issues. Firstly, it is necessary to consider the factors determining the quality of forecasts in the distribution network, and secondly, the features of a logistics operator and their similarity to the features of organizations effectively forecasting the sale of finished products.

2.2. Factors Influencing the Quality of Forecasts for Inventory Management in Distribution Networks

The forecast is considered a necessary source of information for the preparation of logistics plans [24], including plans related to distribution and cooperation in distribution networks. The risk factors related to forecasting are imprecision, seasonality, product differentiation, short product life cycle, small customer base and information distortion. Forecasts are always burdened with some error. They never describe a given phenomenon with 100% accuracy [25].
The forecasts in the distribution network determine the quantity of goods to be purchased, produced or delivered. Forecasts create related processes and operations [25]. Demand forecasts should be differentiated from sales forecasts. Demand forecasts relate to forecasts related to real demand, while sales forecasts are modified based on information such as sales plans or planned marketing campaigns [26]. On the other hand, the forecasts of releases from individual links correspond to the values related to the predictions related to the amount of goods issued from individual links.
Overestimating the demand may result, for example, in high costs of maintaining excessive stocks. Underestimating, in turn, may have such effects as, for example, lost sales, loss of reputation and underestimated level of sales tasks [27]. The authors of the paper distinguished three main groups of factors that affect the quality of forecasts made in distribution networks. These factors are configuration of the distribution network, the characteristics of the products flowing through the network, and the characteristics of the central link that is able to forecast demand in the distribution network.
The configuration is related to a specific shape, coordination or structural form [28,29,30]. An important aspect here is the complexity of decision-making problems, which increases with the increase in product differentiation and the breadth of the assortment, as well as with the geographical reach and the number of customer segments. Configuration concerns issues related to management in space, which relate to the construction of coordination systems [31]. An important aspect of the configuration of the distribution network, which affects the quality of forecasts, is the level of relations between the links operating in the network, including the willingness to conduct activities related to joint planning of promotional campaigns, not setting unrealistic sales targets and unexpected price changes [32].
Another element related to the network configuration that affects the quality of forecasts is the method of information exchange, including the degree of information dispersion and the exchange of information related to sales peaks. Lack of complete information about buyers and activities carried out in the network may have a negative impact on the quality of forecasts [33]. In addition, there is a need for a hierarchical approach to forecasts that represent, for example, geographic regions or product families, and a multitude of input data for the analysis, such as holidays, information on seasonal sales [34]. An important configuration element is the frequency of updating orders in the network and sending collective orders, which negatively affect the quality of data supplied to the forecasting systems. The quality of such data is strongly related to the quality of the final forecast [35]. Established safety buffers and minimum order sizes result in stockpiling, which also affects the quality of forecasts [32].
As Kim, Pandit and Wasley [36] note, forecasts also depend on the division of responsibility for forecasts, the ability to create appropriate forecast formats (horizon, division into periods, update frequency, level of detail), measurement methods and ensuring a method of converting the forecast into a sales forecast for the entire network. The quality of the process in which forecasts are created in relation to the distribution network may be influenced by, e.g., the level of relations between individual links and the exchange of information on product changes.
Another important element influencing the quality of forecasts is the characteristics of the products that flow in the network. As some authors note, the characteristics of products within the network, the price of the product, promotional activities and product allocation in the network, as well as: customer preferences and POS (Point of Sales) activities have an impact on the forecasts [37]. In the literature, among the elements influencing the accuracy of the forecast, the fluctuations in demand, which may imply problems with inventory management as well as the characteristics of time series describing the levels of releases and sales in individual network links, such as the coefficient of variation, are particularly emphasized [38]. The quality of forecasts can also be affected by the need to improve forecasts by adding qualitative forecasting elements [39]. This is especially visible in the case of large shares of the AX group assortment (according to ABC/XYZ analysis) in relation to the entire assortment.
Min and Yu [40], on the other hand, indicate that the quality of forecasts is influenced by the degree of centralization of the distribution network, which enables inventory management throughout the network (e.g., Collaborative Planning, Forecasting and Replenishment—CPFR). In the centralization approach, the main enterprise coordinates decisions related to the entire distribution network, and the strategies followed by the main enterprise affect the adaptability of the entire network.
All the above-mentioned features affect the quality of forecasts, which translates further into the quality of inventory management in individual network links.

2.3. Logistics Operator in the Distribution Network

Logistics companies, including logistics operators, shape national and international strategic and operational networks in the form of stable relationships between production, trade and customer companies. The competences of logistics companies are particularly important in integrated, complex distribution networks formed from many different interpenetrating distribution channels. In omnichannels, logistics operators secure uncertain demand by limiting the negative effects of combining various distribution channels. Logistics operators, by issuing from the warehouse, have comprehensive knowledge about the actual flow of products in all types of channels, regardless of whether it concerns classic or e-commerce sales.
Logistics operator is a company that designs, manages and controls the supply chain of another company. Logistics operator is the 3PL (third-party-logistics) organization. There are different definitions for 3PL in the literature. Some broad definition for 3PL are ‘‘the use of external companies to perform logistics functions that have traditionally been performed within an organization’’ [41,42] and ‘‘an external organization that performs all or part of a company’s logistics functions’’ [43]. Bask [44] describes 3PL as ‘‘relationships between interfaces in the supply chains and third-party logistics providers, where logistics services are offered, from basic to customized ones, in a shorter- or long-term relationship, with the aim of effectiveness and efficiency’’. The logistics operator (3PL), depending on the commercial agreement between both companies, can operate during supply, transport, storage and/or distribution.
The main function of a logistics operator is to optimize the processes of product acquisition, storage, transport and distribution in an efficient way for the company for which they work. For this, it is essential that you have the physical and technological infrastructure and information systems necessary for the proper development of your work. However, there are logistics operators that outsource part of these infrastructures without loss in the quality of their services.
A logistics operator is one of the organizations that can assume a central position in the organization of logistics processes in the distribution network. The common feature of the central links is the ability to organize and coordinate the network. Central network links are often referred to as flagship companies [45].
The flagship company is predisposed to [46]: strategic leadership, network coordination, taking care of the implementation of solutions by network actors, offering synergistic benefits, striving for business stabilization and maintaining a long-term vision of the network. It has a greater ability to attract new members to the distribution network than other actors [47] and seeks to cooperate with partners who have the right competences [3]. A logistics operator does not have such competences in the context of the entire distribution network. This entity does not, for example, decide which retail nodes are to ultimately cover the market. The logistics operator, however, builds its own logistics network and creates relationships with other logistics companies in order to increase the complexity of logistics services. The function of such a link in the distribution network can include [48]: identifying key competences, allocating processes to partners, administering, coordinating, ensuring efficient information exchange, maintaining network consistency and monitoring processes. You can also add to the mentioned functions [49]: network initiation, selection of economic partners, responsibility for the efficient delivery of products, creating the organizational culture of the network and establishing new forms of cooperation [23,50]. A logistics company that is able to take over the functions of the central link in the distribution network must have a number of attributes [51]. Among the distinguishing features of flagship companies the following can be distinguished [49]: a significant number of various processes implemented in the added value stream, the ability to cooperate with production companies, significant market share, a significant number of serviced segments on the market, a relatively large geographic scope of the markets served, having access to distribution infrastructure (warehouses, branches), the ability to freely shape and create the network structure, the ability to undertake activities related to network reconfiguration, high relational abilities and a significant level of networking, significant position in the network in terms of conduction and intermediation. Taking into account the indicated characteristics of the flagship company, Table 1 analyses the ability of logistics operators to assume a central position in the network.
The logistics operator, assuming the role of a central logistics node, becomes an important element of the distribution network. The very central position indicated on the basis of the cited attributes does not, however, entitle to conclude that such an entity will have the predisposition to create high-quality forecasts in order to manage inventory in the distribution network.
According to the practice of modern enterprise networks, the strongest link is most often responsible for demand management. As Anderson [53] notes, the unit that organizes activities related to demand management in the network of cooperating enterprises should be located in the central link of the network. Thus, it can be concluded that the centralization of activities plays a significant role in the processes related to demand management [53]. A forecasting company should be characterized by a number of attributes, which include, e.g., [54]: having extensive knowledge of nodes in the distribution network, material and information flows, and [55]: market research, good relations with clients and partners [56], deep knowledge of partners’ processes and understanding of the directions of their development [57]. According to Aertsen et al. [58]; Brito [59] and Qi et al. [60] the ability to integrate other entities, a dominant position in the network, a wide range of activities, exclusion from sales profits and technological resources. Particularly important is the characteristic “exclusion from profits from the sold products”, which directs the search for an objective link in the network, which is not a commercial enterprise.
An additional challenge for the central forecasting link in the distribution network is the coordination of tasks related to demand management [61,62]. Coordination becomes particularly important in conditions of uncertain demand [61,63]. Coordination of activities related to the management of demand for products according to the literature may consist in: combining selected resources of enterprises and specific arrangements regarding the behavior of the communicating parties [64], preventing conflicts in distribution networks [62,65], organizing the activity of two or more groups in such a way that they work together and are aware of the activities of other entities [66], integration and synchronization of activities related to decisions concerning demand forecasts, inventory management and their replenishment [67]. Coordination depends on network configuration [68]. This gives grounds for the claim that the appropriate configuration of the distribution network may significantly affect the level of coordination of activities related to the demand. The combination of multi-entity activities in demand management requires, first of all, two mechanisms based on forecasting and on the exchange of information about demand flowing directly from consumers.
A logistics operator, in order to make forecasts for a producer, should therefore have the attributes of both the flagship company and the centrally forecasting company.

3. Research Methodology

The conducted literature research allowed for the identification of factors influencing the quality of forecasts for inventory management in the distribution network. These factors are:
  • Distribution network configuration
  • Characteristics of products within the network
  • Central link features
The features of the forecasting link in the presented research were compared to the features of the logistic operator. This stage of research made it possible to select a logistics company for the case study. The research was carried out according to the stages indicated in Figure 1.
The research was carried out on the basis of five distribution networks, for which a forecast model was created that allows for automatic forecasting of demand for products using the WMS (Warehouse Management System) of the logistics operator. The proposed forecasting model takes into account the handling of the forecast script in the R programming language by the user, the forecast calculation process and data update taking into account the integration of the tool with the IT system of the logistics operator. The forecasting process course map is presented in Figure 2 using the BPMN 2.0 (Business Process Modelling and Notation 2.0) notation.
The proposed solution (Figure 2) assumes the implementation of a forecasting tool and its integration with the operator’s WMS. The standard settings of the tool assume a daily forecast for individual SKUs (Stock Keeping Units) with a horizon of 42 days, where the length of the test set was 14 days, and the length of the training set was reduced by the length of the test set and was on average 2 years. As a rule, these forecasts are updated once a week. The aforementioned frequency of making forecasts was charted based on managerial opinions. The input data is the data related to the daily stock issue levels. Data was collected on a daily basis, according to the information obtained from the WMS. The data length was set to a maximum of two years, but also took into account new SKUs that appeared in the dataset. Therefore, the length of the time series of individual SKUs was variable, but at the maximum level of two years. The data was also purged of “dead” SKUs (dead SKUs) that have been withdrawn from sale or have reached the end of their life cycle, on an ongoing basis. This approach made it possible to create datasets for automatic demand forecasting. The length of the forecast horizon and the test set has been deter-mined in consultation with experts in the form of senior managers who are involved in warehouse management. Data imported from WMS must be translated into data understandable for the R development environment in which the program was created (ts(data, frequency = n), where n depends on the aggregation degree and data and in case of the data it amounts 365).
In the first stage, the input data is subjected to an analysis related to checking the necessity of their smoothing. The time series of individual SKUs are measured by the coefficient of variation (expressed as the ratio of the standard deviation to the arithmetic mean). When the contractual value of 20% is exceeded by the time series, it is subject to clearing with tsclean(data, replace.missing = TRUE, lambda = “auto”), i.e., by replacing missing data in the series with interpolation and replacing outliers with the automatic Box-Cox transformation. Outliers are observations that meet the following condition, where the numerical values assigned to Q correspond to individual quartiles:
xoutliers don’t belong to the range of [2.5Q1−1.5Q3; 2.5Q3−1.5Q1]
After the analysis of the coefficient of variation (and depending on its value—the application of additional modification of the series to remove outliers) the time series is divided into the learning part and the test part. The training part is used to create a forecasting model fitted to the part of the time series it covers. The teaching part is usually used to check the accuracy of the forecasts.
Key calculations in the algorithm are performed separately for individual SKUs in the loop while until all products have been calculated. Algorithms used in the calculations are based on the suit library(forecast)) and focus on using personalized algorithms ses(), holt(), holtwinters(), ets(), ar(), arima(), auto.arima(), arfima(), tabats(), splinef(), stlf(), meanf(), rwf(), snaive() and nnetar() (Table 2). Therefore, the proposed algorithms are the basis of the described fore-casting model. The use of algorithms adapted to different types of time series makes it possible to build a universal model.
The script fragment, which is looped with other algorithms, and also includes the selection of results with the minimum size of MAPE (mean absolute percentage error) at a later stage (Algorithm 1).
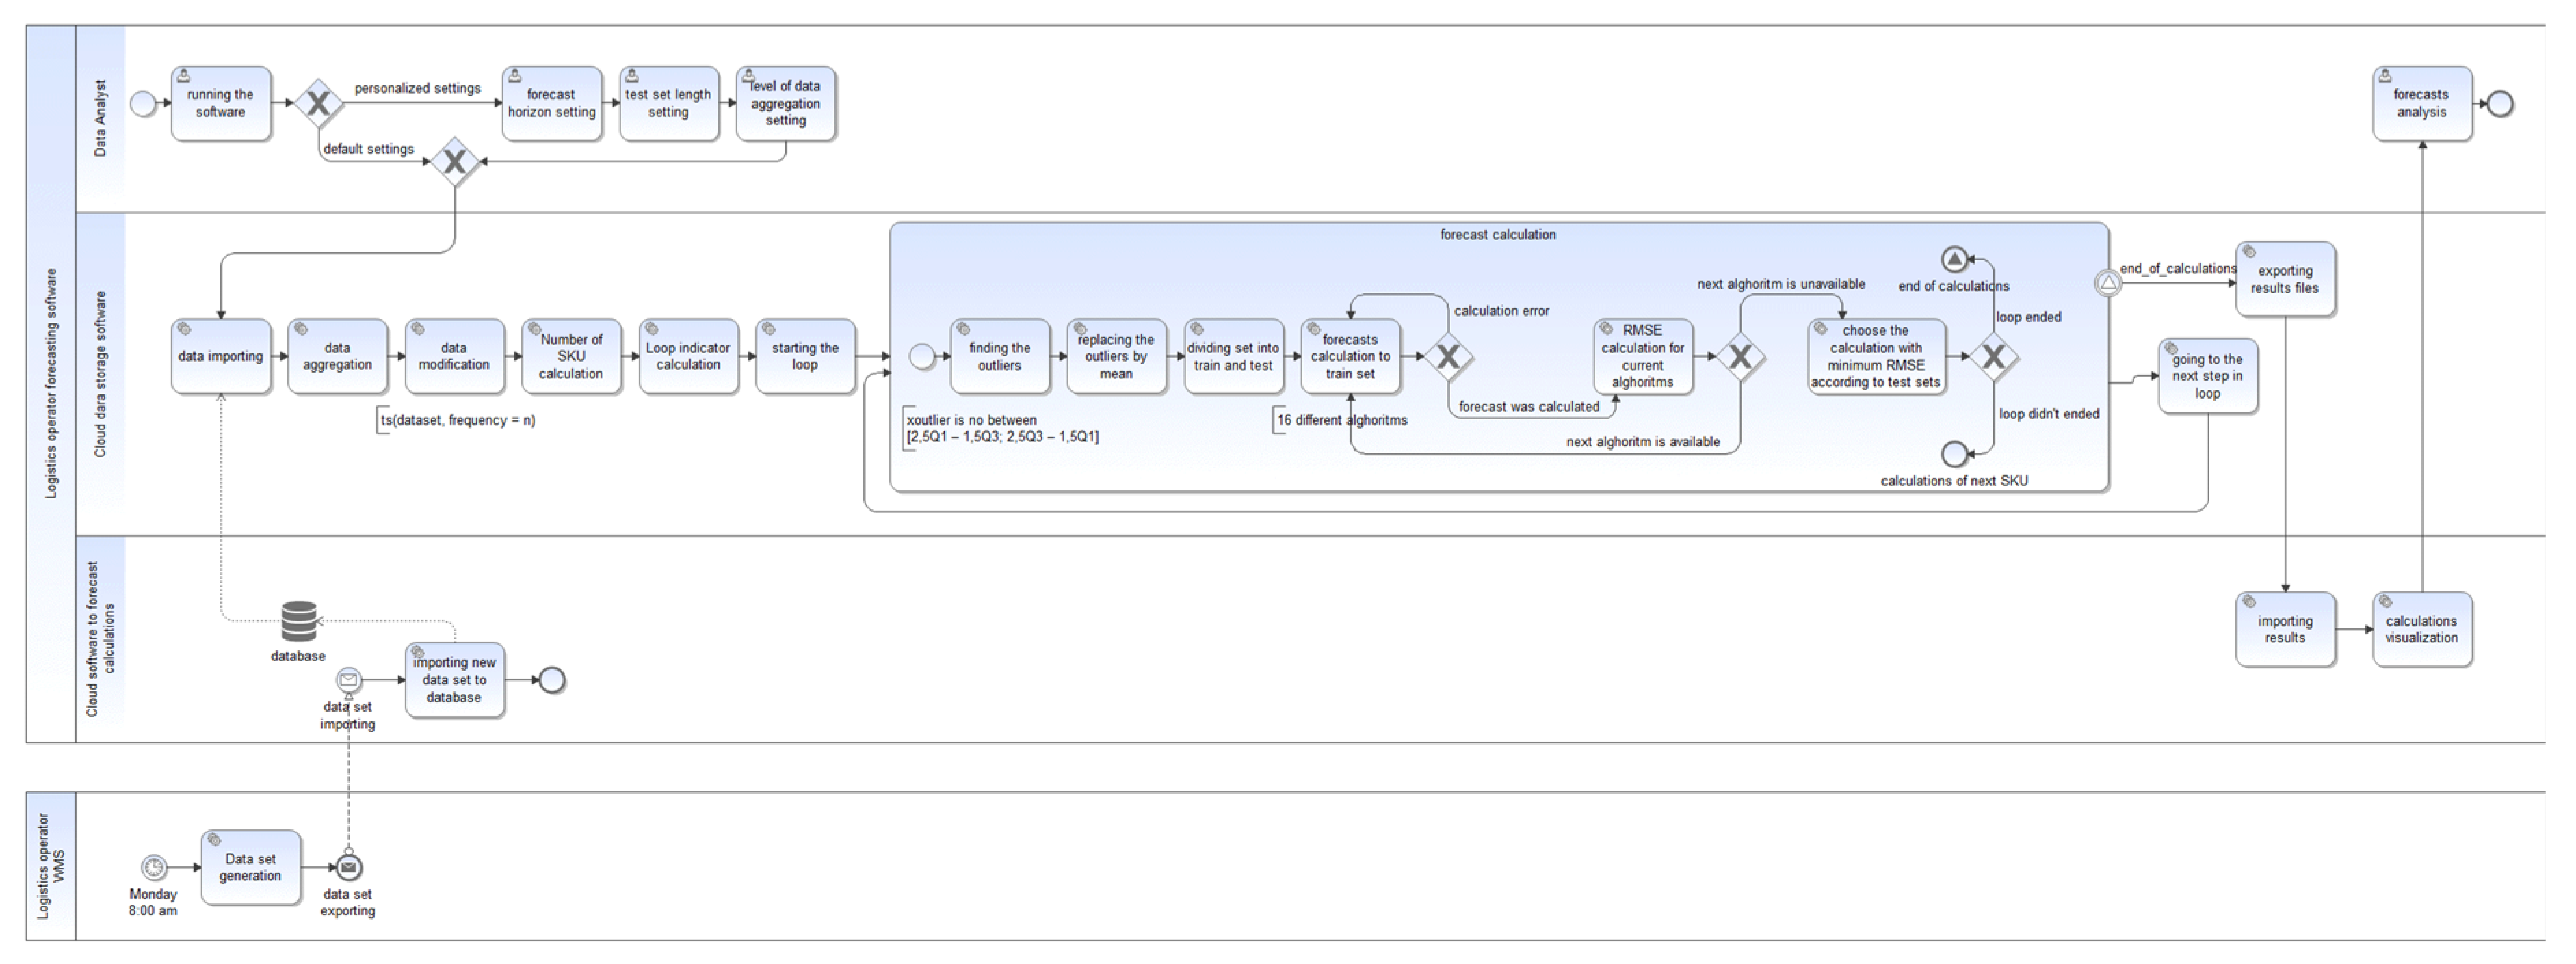
Algorithm 1: Tool script running in the example of part with ETS calculation
1: try({
2: dd.ETS <- ets(learn[,k]) #using ets() to learn set for the chosen SKU
3: dd.ETS.f <- forecast(dd.ETS, h=horizon_length) #forecast calculation based on training set in the chosen horizon
4: acc_ETS <- accuracy(dd.ETS.f[,k]) #accuracy calculation
5: MAPE_train.ETS <- acc_ETS[1,4] #checking the MAPE value for training set
6: MAPE_test.ETS <- acc_ETS[2,4] #checking the MAPE value for test set
7: col.n.ETS <- colnames(learn)[k]
8: model.ETS <- “ETS”
9: cbindETS <- cbind(print(col.n.ETS),print(dd.ETS.f),print(MAPE_train.ETS), print(MAPE_test.ETS), model.ETS)
10: c(“SKU”,“Forecast”,“Lo80”,“Hi80”,“Lo95”,“Hi95”,“MAPE.Train”,“MAPE.Test”,“Model”)
}, silent = T)
The forecasting algorithm, thanks to the use of forecasting methods based on exponential smoothing of time series, autoregressive models and models related to neural networks and other models being modifications of standard forecasting models and models adapted to forecasting the size of time series with specific characteristics such as trend or seasonality, makes it possible to obtain forecasts for different time series without the need for an in-depth analysis of their structure and only on the basis of the structure of selecting appropriate algorithms. Calculations in the algorithm are based on the learning part, and the results and the choice of the correct algorithm depend on the size of the MAPE in the test set Thus, for each SKU, the calculation and the selection of the underlying algorithm for inferring the forecast is personalized. The result sheet with forecasts is created as an MS Excel file, which is treated as the basis for creating forecast visualizations. The choice of such a tool depended on the managerial needs in the case studies under consideration.
The research was carried out on the basis of the analysis of five distribution networks in which a logistics operator operates. The analyzed networks are the distribution networks of household chemicals and cosmetics (DN.1), food products (DN.2), construction-related products (DN.3), sweets (DN.4) and household chemicals (DN.5). Diverse distribution networks made it possible to test forecasts in various environments, as well as to create a universal model. The logistics operator in the distribution networks in question acts as an enterprise providing logistic services to the production enterprise. In the distribution networks in question, producers operate in the MTS system, where the main warehouses are served by the operator. Currently, the operator provides services related to warehouse management and transport operations, including a number of specialist services such as cross-docking, co-packing, co-manufacturing and transport services. The configuration elements of the above-mentioned distribution networks analyzed in the research were the size and breadth of the assortment offered in the network, the shares of intermediaries and endpoints in the direct flow from the operator, the degree of relationship between the operator and the production company assessed as the average of factors such as: exchange of information on sales peaks and changes in the assortment, sending aggregate forecasts and including the operator in information flows. The assessed configuration elements also included elements such as: information dispersion, maintained safety buffers, producer dependence on customers, production capacity of the production company and the frequency of order updates.
The features of SKU available in the operator’s warehouses and being the subject of material flows in distribution networks also played an important role in the research. The examined product features include variability in releases, transport and storage susceptibility, structure according to ABC and XYZ analysis, and correlations between the assortment in the network. All the above-mentioned elements were used to infer the influence of selected factors on the accuracy of the forecasts.
  • The main limitations of the proposed model are:
  • High dependency on input data—which can be solved by implementing the correct information exchange system.
  • Relying only on quantitative data—which can be solved by training 3PL staff in the area of forecasting and using the results of the XYZ analysis to find better forecasting methods for the Z group.
  • A prediction model embedded locally which can cause problems with computing power—this can be solved by moving the computing infrastructure to the cloud.
  • The fact that forecasts are now based on distorted data related to poor perception and description of certain time series—which can be solved by improving cooperation in the distribution network and developing better information exchange systems.

4. Results and Discussion

Before starting the research related to the possibility of implementing and using the proprietary forecasting model, the characteristics of a logistics company were examined in terms of the attributes that a company capable of forecasting should have. For this purpose, 72 small, medium and large manufacturing enterprises, which forecast demand for products in their activities, were examined, and on this basis, a set of features that affect the prognostic ability was selected. These attributes were compared with the characteristics of the logistic operator selected for analysis (Table 3).
As the analysis shows, the logistic operator has all the necessary features that define its ability to make forecasts in the distribution network, it also has some necessary attributes that can further strengthen its ability to make accurate forecasts. These results confirm the latest suggestions of other authors regarding the need to develop forecasting models that can be used by logistics operators [16]. The activity of the selected logistics operator has been considered from the perspective of five distribution networks in which the operator operates (Table 4).
Table 4 includes elements of the distribution network such as: the number of SKUs flowing through them, the number of product groups, the number of products in terms of the ABC classification and the number of intermediaries, wholesalers and POS (Point of Sales) to which the products are delivered directly from the operator (marked as Q in the table) and the percentages of product releases to individual points from the operator’s warehouse (marked as % in the table). Moreover, Table 4 contains the POS number for the whole distribution network. The data collected in the table relates to a 2-year period, where network flows were analyzed individually for each SKU as data collected on a daily basis. The data was selected on the basis of the operator’s WMS records. Additionally, the configurations of individual distribution networks, relations between the producer and the logistics operator and the characteristics of the products within the network were assessed (Table 5). These elements were rated on a scale from 0 to 3, where: 0—requires immediate improvement; 1—needs improvement; 2—medium level and 3—relatively satisfactory level.
The analysis presented in the Table 5 was made on the basis of the analysis of data from the WMS system (variability of releases, AX shares) and on the basis of experts’ opinions. The variability of the releases was calculated using the coefficient of variation for individual SKU time series. AX shares were calculated in relation to the standard ABC/XYZ analysis, which assumes the division of the product range according to quantitative shares in the total number of issues (ABC analysis) and the division of the product range according to the degree of forecast matching (XYZ analysis). The AX group is one of the most advantageous situations in the enterprise, when it is easy to predict the demand for SKU, which accounts for a large share of the total releases.
Overall, DN.5 was assessed the best. This network shows the highest level of centralization of information gathering and, on this basis, planning of the subsequent product flow. From the operator’s warehouse, products are delivered only to intermediaries who then distribute them to their own POSs. The network is geographically concentrated, mainly due to a relatively small number of intermediaries and a low diversity of intermediaries. Agents collect and manage orders from points of sale centrally, and then send a collective requisition to the manufacturer. The producer, through the developed system of cooperation with intermediaries, is able to meet their expectations relatively well. The relations in the network and between the operator and the producer are at a relatively good level (when compared to other networks from the analysis). Products flowing in DN.5 are characterized by long expiry dates, a relatively high level of turnover and high transport and storage susceptibility. The manufacturer rarely introduces new production references, so that the functioning products are known to him and other nodes. This helps to plan the demand by trying to exchange information with intermediaries.
In terms of the assessment under consideration, DN.2 came next. This network is characterized by a large number of endpoints and the fact that most of the products directly from the operator’s warehouse are delivered to the POSs. Such an organization of flows requires the maintenance of large safety buffers due to uncertainty in orders. It is a complex distribution network due to the large number of intermediaries and the large number of points of sale. The manufacturer is not familiar with the ordering systems and the adopted methods of operation of retail stores. Most of the products are delivered directly to the POSs, frequent sales peaks cause numerous disturbances in the demand planning by the producer, the more so as the relations between the operator and the producer are not well developed. Very frequent direct contact between the producer’s representatives and the operator and relatively good relations between the network cells work in favor of the network. The products flowing in this network are products with fast rotation and relatively short expiry dates (compared to the other networks discussed). They are characterized by a relatively high transport and storage susceptibility. These products are ordered frequently, and promotional campaigns are held on short notice.
The DN.4 network showed a result similar to DN.2. This network is dominated by distribution to intermediaries and demand planning in the network is focused on servicing key customers. The network is dominated by the strategy of frequent deliveries of smaller volumes. The network is geographically concentrated. Demand planning must take into account the future movements of intermediaries, which are based on the sales levels of their points of sale. In the case of this network, the operator, at the request of the manufacturer, supports some POSs in delivering products to them. The relations in the network and between the operator and the producer are at a relatively good level (when compared to other analyzed networks. This network is also characterized by a small number of SKUs. The slight diversification of the assortment determines better understanding of the retailers’ sales plans by the manufacturer. One of the basic difficulties in planning the demand by the producer is the fact of production under a foreign brand and the lack of control over the further stages of selling the products, which are promoted directly by the recipients.
A worse result than in the networks discussed above was observed in DN.1. A large number of network endpoints and a large number of intermediaries maintain high levels of safety stock in individual network nodes. The manufacturer sells products to intermediaries who have their own retail outlets. The distribution network, due to the presence of a large number of intermediaries and POSs, is a geographically dispersed network. The flow of information between brokers and their outlets is standardized. The main directions of distribution from the operator’s warehouse are directed to intermediaries who create their safety buffers. In addition to activities related to basic warehouse processes, the operator also provides co-packing and co-manufacturing services. It is related to the special requirements and orders of intermediaries. Planning demand management from the producer’s perspective mainly focuses on meeting the needs of intermediaries. The relationship between the producer and the operator is insufficiently developed in terms of the flow of information on the planned activities. However, this relationship is characterized by relatively frequent contacts between the producer and the operator. The logistics operator in the analyzed network is often omitted in information flows. Products flowing through the network are products with a long shelf life, the group of fixed products offered for sale causes the nodes to focus on creating safety stocks, mainly with intermediaries. A large number of the proposed assortment, in turn, causes problems with planning future production volumes for seasonal, promotional or new products. The large variety of the assortment also negatively affects the operations performed by the manufacturer.
DN.3 showed the worst result in the analysis. This distribution network is focused on shortening the distribution channels, it is caused by the specific characteristics of the flowing products. The distribution network is a geographically dispersed network. Demand management focuses mainly on trying to ensure adequate production capacity to meet the requirements of customers. A small percentage of the distribution from the operator’s warehouse is to wholesalers and intermediaries. The network is geared towards distribution directly to the POSs. However, in contrast with DN.2, the products found in the network show a lower level of turnover. Network flows are less flexible to changes, and logistic processes are relatively difficult to implement. A weakness of this network is a very low level of relations between the producer and operator, as well as a relatively low level of cooperation in the distribution network caused, among others, by specificity of the flowing products. These are products with low transport and storage susceptibility. The only product group that is characterized by a relatively constant level of variability are tiles. Other groups are characterized by high volatility, and thus it is difficult to plan the demand for them.
The conducted analysis allowed for the assessment of individual distribution networks in which an attempt was made to implement the created forecasting model.
The forecast results (Figure 3) were presented as averaged MAPE values for all forecasts of all time series in individual weeks and days of the analysis.
Figure 3 shows the data obtained with the help of daily forecasts using the proposed model for automatic forecasting of the demand for products. Forecasts were made on a daily basis for separate SKUs individually. In order to check their quality, the generated errors were considered globally and averaged for the aggregated number of all SKUs in the distribution network. These errors are presented in two terms: daily and aggregated to weekly. The analysis period was 24 weeks (120 working days), for a pro-comparative purpose, taking into account the fact that flows in not all networks take place 7 days a week and the fact that weekend flows usually differ significantly from standard flows, it was decided to exclude Saturday and Sunday from the analysis. As the analysis shows, the highest accuracy of forecasts was characteristic of DN.5, followed by: DN.2, DN.4, DN.1 and DN.3.
The high accuracy of the forecasts in the D5 network is in line with the results of the earlier stage in which the network performed the best in the comparative assessment. All the features indicated in the first stage, including high centralization of data collection, good relations between network participants, transparent network structure, low diversification of intermediaries, high geographical concentration, with a simultaneous small product differentiation and product features that have a long validity period and are not subject to differentiation in terms of distribution channels, affect the quality of forecasts made by the operator. It can be assumed that the proposed model solution will work best in this type of network and it is in networks with such characteristics that the operator has the chance to create the most accurate forecasts, which in turn translate into the coordination of material flows. Despite its considerable complexity, the DN2 network obtained results with high forecast accuracy. The good relations between the logistics operator and representatives of retail links in the network, mentioned in the previous stage, are of great importance for the quality of forecasts. These conclusions can also be drawn by analyzing the results of subsequent networks. The relationships between the logistic operator and network nodes, regardless of the degree of its complexity, affect the quality of the obtained data and, as a result, the accuracy of forecasts. In particular, this is confirmed by the results obtained for the DN3 network, which is characterized by a large geographical dispersion and weak relations between the logistics operator and the wholesale and retail nodes of the network, and at the same time this network obtained the lowest forecast accuracy. Detailed research on the impact of collaboration on the quality of forecasts was carried out by Jonsson and Gustavsson (2008), analyzing two groups of variables: collaborative relationship (trust, communication, participation), and Automatic data and registration (communication technology, automatic registration). The research was not conducted among logistics operators, but the authors described in detail the strength of the relationship between the participants of the supply chain using the studied variables, pointing to a positive correlation between the strength of the relationship and the quality of forecasts. At the same time, the authors also investigated supply chains in which there is no automatic information exchange. In the assumption of the developed model for the needs of coordination of material flows by the logistic operator, the research is limited to data exchange via WMS, so this level of shaping the relationship was assumed in the re-search assumption as necessary to be met.
The summary of the results of the analysis is presented in Figure 4.
As can be seen from the Figure 4, the quality of forecasts in individual distribution networks is correlated with two assessed factors, i.e., product features and the assessment of the network configuration. The analysis showed that the characteristics of the products and the network configuration had a positive effect on the quality of forecasts. The analysis also showed a slight dependence of the relationship between the logistics operator and the producer and the impact of the assessment of this relationship on the quality of forecasts. The analysis showed that in most cases (in four out of five analyzed networks) this factor also positively influences the quality of the forecast. A logistics operator seeking to coordinate material flows in the distribution network and, for this purpose, forecasting sales, must therefore focus on building strong and long-term ties with wholesale and retail nodes. The quality of the formed relations may reduce the negative impact of other factors influencing the quality of forecasts, including the considerable complexity of the network or geographical dispersion. An example of this is the DN2 network. The obtained research results cannot be transferred to the entire population of logistics operators, which is the basic limitation of the obtained results. The conducted case study allowed at this stage to indicate the relationship between the examined features: the quality of forecasts and the network configuration and product features, however, the obtained results require further studies. Limiting the research to a selected cargo decoupling point—production to ware-house, was necessary to conduct a case study designed in this way. Looking at the broader perspective, it can be noticed that for one distribution network coordinator who creates forecasts for inventory management, different networks can be identified, not only different in terms of the type and number of nodes included, but also organizing flows for products with different characteristics due to their level of differentiation (locations of cargo decoupling point). In this sense, one operator may obtain different quality of forecasts in individual networks due to the variability of the determinants identified in the paper.
This concept is only the beginning of the research on the wider problem of coordinating the flows of finished goods in the distribution network. The extended concept, which is the subject of current research by the authors, is included in the knowledge management system in the distribution network. The logistic operator is the building link for such a knowledge management model, which will enable the collection and processing of information on demand and current inventory levels in various nodes, and the transfer of knowledge facilitating inventory management to other network nodes. The justification for the concept adopted in this way is the fact that the logistic operator does not take ownership of the product, and therefore is not directly burdened with the risk associated with unsuccessful sales. In this sense, it is an objective link that can be described as a network conductor. It has a view of the entire network and does not compete with other links, supporting the entire system by organizing logistic flows

5. Conclusions

In the literature, forecasting and 3PL are usually related to supporting transport [78] or specialization [79]. In the opinion of the authors, there is a reason and a possibility to take a fresh look at this problem and confront it with the concept of a distribution network. Distribution networks seek resiliency solutions by aligning inventory management with the characteristics of the products flowing in the network, fluctuations in demand and networks configuration. This entails the need to improve the quality of forecasts. Logistics companies, including logistics operators, face the opportunity to strengthen their role in the distribution network, but this requires looking for new challenges that increase added value. Taking over the forecasting function for the purpose of inventory management in the distribution network is certainly such a challenge. The article indicates what features a logistics operator must meet in order to create forecasts for the purpose of inventory management in the distribution network. The indicated attributes relate to the central position, which consequently gives an opportunity to manage the demand. The authors considered the concepts of central network links (coordinators) presented in the literature.
The quality of forecasts is correlated with the characteristics of products within individual chains. The analysis showed that the characteristics of the products had a positive effect on the quality of forecasts. The characteristics of products were assessed in terms of the level of variability (where the greater the level of variability, the less adjusted the forecasts were), transport and storage susceptibility (where the lower the susceptibility, the smaller the adjustment of forecasts caused by disruptions in the flows of these products). The size of the AX group in relation to the entire assortment also influences the quality of the forecast. A large amount of the product range from group X requires supporting quantitative forecasts with qualitative forecasts. Distribution networks rated the highest in terms of product characteristics also showed the best results in terms of the accuracy of their forecasts. The networks with the highest accuracy of forecasts created using the developed forecasting tool and the networks with the best rating in terms of product characteristics are DN.5; DN.2; DN.4; DN.1 and DN.3. Papers often take into account only the best-fit forecast according to the analysis of its algorithm fitting only to the learning part [78,80]. In this paper, the authors propose a calculation of forecast verifiability based on real-time data collected from WMS.
Elements of the distribution network configuration, such as information dispersion, the level of security buffers, the level of producer dependence on customers, activities to support the exchange of information on sales peaks across the entire network, satisfactory production capacity and frequency of order updates have a positive effect on the quality of forecasts. Obtaining higher scores in the analysis of selected network configuration elements was correlated with better-quality forecasts. The networks with the best results in terms of configuration assessment and in terms of forecast accuracy are DN.5; DN.2; DN.4; DN.1 and DN.3. Still, which is also often mentioned in the literature [80], one of the most important issues is to provide correct input data. In order to achieve this recommendation, in the opinion of the authors, it will be necessary to build a correct system for data exchange between distribution network nodes and to develop integration. The developed research model will be tested on a wider research sample in the future. At this stage, the observed relationships between product features, network configuration and logistics operator features, and the quality of forecasts were identified. The forecasting model designed in the R tool was implemented at the logistics operator and is verified in the real environment of the analyzed distribution networks. In further research, it is planned to verify the characteristics of the operator as the central link in generating the forecasts by comparing the results of different operators. In the opinion of the authors, future research should also take into account an additional analysis of the fitting of prognostic algorithms by multiple analysis of known and possible to use measures. Although some authors consider only one measure [81,82,83], some of them propose other, more complex procedures for measuring the accuracy of forecasts [84]. There is also an approach to considering several measures. One of the most popular are MAE (Mean Absolute Error), MSE (Mean Square Error), RMSE (Root Mean Square Error) and Negative Magnitude [60,80]. The authors assume that the proposed forecasting model should be extended with an additional verifiability analysis based on the weighted mean (Figure 5). However, the most important indicator should still be MAPE, as it was considered the main indicator in the research undertaken.
In the literature, ARIMA models are usually explored [80,85], even as a basis for more sophisticated models based on neural networks [83]. There is a chance that ARIMA models are in fact the most suited to forecasting demand and sales. The presented paper takes into account such models and others. In line with the literature review, the authors also see the prospect of extending the pool of base models used for calculations with generic programming [80] and additional ANOVA analysis [82], which may have a positive effect on the bullwhip effect.
In addition, subsequent tests should be extended to other cargo decoupling points—assembly to order, make to order and engineering of products to order. As a consequence, the overall concept aims to design a knowledge management system in the distribution network, in which the logistic operator will be the link that collects and processes knowledge and secures its transfer.
The proposed forecasting model is currently in the phase of pilot tests with selected co-operators of an international logistics operator. In order to launch the pilot studies, it was necessary to create a stable environment for collecting data and sharing forecast results. Therefore, cloud-based software is currently used. Currently, the costs associated with proposed solution are the costs associated with the consumption of calculation power. The forecasts currently created are used primarily to support inventory resource planning as the first step in a broader concept. One of the most important issues is the security of the information exchanged. In the opinion of the authors, this is also an interesting area for further research, especially taking into account the possibility of testing mod-ern technologies supporting data exchange, such as blockchain.

Author Contributions

Conceptualization; methodology; software; validation; formal analysis; investigation; resources; data curation; writing—original draft preparation; writing—review and editing; visualization; supervision; project administration; funding acquisition: M.K. (Marzena Kramarz) and M.K. (Mariusz Kmiecik). All authors have read and agreed to the published version of the manuscript.

Funding

This research received no external funding. The APC was funded by BK/050/BK-22/0001 Logistics Institute, Silesian University of Technology, Poland.

Institutional Review Board Statement

Not applicable.

Informed Consent Statement

Not applicable.

Data Availability Statement

Not applicable.

Conflicts of Interest

The authors declare no conflict of interest.

Abbreviations

3PLThird-party logistics
ABC/XYZInventory classification method by ABC/XYZ
ATOAssembly-to-order
BPMN 2.0Business Process Modeling and Notation 2.0
CDPCustomers orders decoupling point
CPFRCollaborative Planning Forecasting and Replenishment
DNDistribution network
ETOEngineering-to-order
IDPInformation decoupling point
ITInformation technology
MAEMean Absolute Error
MAPEMean Absolute Percentage Error
MSEMean Square Error
MTOMake-to-order
MTSMake-to-stock
POSPoint of sales
RR programming language
RMSERoot Mean Square Error
SKUStock keeping unit
TSLTransport-forwarding-logistics
WMSWarehouse management system

References

  1. Kim, Y.; Chen, Y.-S.; Linderman, K. Supply network disruption and resilience: A network structural perspective. J. Oper. Manag. 2014, 33–34, 43–59. [Google Scholar] [CrossRef] [Green Version]
  2. Levalle, R.R.; Nof, S.Y. Resilience by teaming in supply network formation and re-configuration. Int. J. Prod. Econ. 2015, 160, 80–93. [Google Scholar] [CrossRef]
  3. Kawa, A. Konfigurowanie Łańcucha Dostaw. Teoria, Instrumenty i Technologie; Wyższa Szkoła Logistyki: Poznań, Poland, 2011. [Google Scholar]
  4. Vazquez, R.; Iglesias, V.; Álvarez-gonzález, L.I. Distirbution channel relationships: The conditions and strategic outcomes of cooperation between manufaturer and distributor. Int. Rev. Retail. Consum. Res. 2005, 15, 125–150. [Google Scholar]
  5. Kim, S.; Kim, N.; Pae, J.H.; Yip, L. Cooperate and compete: Coopetition strategy in retailer supplier relationships. J. Bus. Ind. Mark. 2013, 28, 263–275. [Google Scholar] [CrossRef]
  6. Chopra, S. Designing the distibution network in supply chain. Logist. Transp. Rev. 2003, 39, 123–140. [Google Scholar] [CrossRef]
  7. Kramarz, W.; Kramarz, M. Zakłócenia w przepływach wyrobów hutniczych w modelu z centrum logistycznym. Zesz. Nauk. Politech. Śląskiej 2018, 121, 221–235. [Google Scholar]
  8. Olgaher, J. The role of decoupling points in value chain management. In Modelling Value; Jodlbauer, H., Olhager, J., Schonberher, R., Eds.; Physica-Verlag: Heidelberg, Germany, 2012; pp. 37–47. [Google Scholar]
  9. Wikner, J.; Johansson, E. Inventory classification based on decoupling points. Prod. Manuf. Res. 2015, 3, 218–235. [Google Scholar] [CrossRef] [Green Version]
  10. Mishra, R.; Singh, R.K.; Koles, B. Consumer decision-making in omnichannel retailing: Literature review and future research agenda. Int. J. Consum. Stud. 2020, 45, 147–174. [Google Scholar] [CrossRef]
  11. Stock, G.N.; Greis, N.P.; Kasarda, J.D. Enterprise logistics and supply chain structure: The role of fit. J. Oper. Manag. 2000, 18, 531–547. [Google Scholar] [CrossRef]
  12. Briel, F. The future of omnichannel retail: A four-stage Delphi study. Technol. Forecast. Soc. Change 2018, 132, 217–229. [Google Scholar] [CrossRef]
  13. Ali, M.M.; Babai, M.Z.; Boylan, J.E.; Syntetos, A. Supply chain forecasting when information is not shared. Eur. J. Oper. Res. 2017, 260, 984–994. [Google Scholar] [CrossRef]
  14. Fildes, R.; Bretschneider, S.; Collopy, F.L. Researching sales forecasting practice. Int. J. Forecast. 2003, 19, 27–42. [Google Scholar] [CrossRef]
  15. van Steenbergen, R.; Mes, M. Forecasting demand profiles of new products. Decis. Support Syst. 2020, 139, 113401. [Google Scholar] [CrossRef]
  16. Iannaccone, G.; Marcucci, E.; Gatta, V. What Young E-Consumers Want? Forecasting Parcel Lockers Choice in Rome. Logistics 2021, 5, 57. [Google Scholar] [CrossRef]
  17. Corsaro, D.; Ramos, C.; Henneberg, S.C.; Naudé, P. The impact of network configurations on value constellations in business markets—The case of an innovation network. Ind. Mark. Manag. 2012, 41, 54–67. [Google Scholar] [CrossRef]
  18. Alinezhad, A.; Kazemi, A.; Khorasani, M. Presenting a model for decoupling points in supply chain networks. Int. J. Logist. Syst. Manag. 2019, 33, 383–403. [Google Scholar] [CrossRef]
  19. Kramarz, W. Modelowanie Przepływów Materiałówych w Sieciowych Łańcuchach Dostaw. Odporność Sieciowego Łańcucha Dostaw Wyrobów Hutniczych; Difin: Warszawa, Poland, 2013. [Google Scholar]
  20. Aktan, H.; Akyuz, G. Positioning the decoupling point along a supply chain: A case study. Int. J. Product. Qual. Manag. 2017, 22, 309–339. [Google Scholar] [CrossRef]
  21. Giesberts, P.M.J.; van der Tang, J. Dynamics of the customer order decoupling point: Impact on information system for production control. Prod. Plan. Control. 1992, 3, 300–313. [Google Scholar] [CrossRef] [Green Version]
  22. Beck, N.; Rygl, D. Categorization of multiple channels retailing in multi-, cross-, and omni-channel retailing for retailers and retailer. J. Retail. Consum. Serv. 2015, 27, 170–178. [Google Scholar] [CrossRef]
  23. Lu, X.; Hu, Z. Research on Russian cross-border e-commerce logistics platform based on block chain technology. In Proceedings of the International Confer-ence on Humanities and Advanced Education Technology, Guangzhou, China, 19–20 August 2018; pp. 435–438. [Google Scholar]
  24. Dalgic, Y.; Lazakis, I.; Dinwoodie, I.; McMillan, D.; Revie, M. Advanced logistics planning for offshore wind farm operation and maintenance activities. Ocean Eng. 2015, 101, 211–226. [Google Scholar] [CrossRef] [Green Version]
  25. Mikesell, J.L. Often Wrong, Never Uncertain: Lessons from 40 Years of State Revenue Forecasting. Public Adm. Rev. 2018, 78, 795–802. [Google Scholar] [CrossRef]
  26. Cadavid, J.P.U.; Lamouri, S.; Grabot, B. Trends in machine learning applied to demand & sales forecasting: A review. In Proceedings of the International Conference on Information Systems, Logistics and Supply Chain, Lyon, France, 8–11 July 2018. [Google Scholar]
  27. Hentschel, B.; Cyplik, P.; Hadaś, Ł.; Domański, R.; Adamczak, M.; Kupczyk, M.; Pruska, Ż. Wieloaspektowe Uwarunkowania Integracji Łańcucha Dostaw Typu Forward i Backward; Wyższa Szkoła Logistyki: Poznań, Poland, 2015. [Google Scholar]
  28. Chandra, C.; Grabis, J. Supply Chain Configuration: Concepts, Solutions, and Applications; Springer: New York, NY, USA, 2007. [Google Scholar]
  29. Truong, T.H.; Azadivar, F. Simulation based optimization for supply chain configuration design. In Proceedings of the 2003 Winter Simulation Conference, New Orleans, LA, USA, 7–10 December 2003. [Google Scholar]
  30. Tsiakis, P.; Papageorgiou, L.G. Optimal production allocation and distribution supply chain networks. Int. J. Prod. Econ. 2008, 111, 468–483. [Google Scholar] [CrossRef]
  31. Yao, X.; Askin, R. Review of supply chain configuration and design decision-making for new product. Int. J. Prod. Res. 2019, 57, 2226–2246. [Google Scholar] [CrossRef]
  32. Croxton, K.L.; Lambert, D.M.; Garcia-Dastugue, J.G. The demand management process. Int. J. Logist. Manag. 2002, 13, 51–66. [Google Scholar] [CrossRef] [Green Version]
  33. Dittmann, P. Metody Prognozowania Sprzedaży w Przedsiębiorstwie; Wydawnictwo Akademii Ekonomicznej: Wroclaw, Poland, 2000. [Google Scholar]
  34. Taghiyeh, S.; Lengacher, D.C.; Handfield, R.B. A Multi-phase approach for product hierarchy forecasting in supply chain management: Application to MonarchFx Inc. arXiv 2020, arXiv:2006.08931. [Google Scholar]
  35. Motwani, J.; Kumar, A.; Youssef, M.A.; Mahmoud, E. Forecasting quality of Indian manufacturing organizations: An exploratory analysis. Total. Qual. Manag. 1997, 8, 361–374. [Google Scholar] [CrossRef]
  36. Kim, K.; Pandit, S.; Wasley, C.E. Macroeconomic Uncertainty and Management Earnings Forecasts. Account. Horiz. 2016, 30, 157–172. [Google Scholar] [CrossRef]
  37. Hofman, E.; Rutschmann, E. Big data analytics and demand forecasting in supply chains: A conceptual analysis. Int. J. Logist. Manag. 2018, 29, 739–766. [Google Scholar] [CrossRef]
  38. Kmiecik, M. Utility of forecasting algorithms in the case of selected distribution networks. Zesz. Nauk. Politech. Częstochowskiej 2020, 38, 60–66. [Google Scholar] [CrossRef]
  39. Wacker, J.G.; Sprague, L.G. Forecasting accuracy: Comparing the relative effectiveness of practices between seven developed countries. J. Oper. Manag. 1998, 16, 271–290. [Google Scholar] [CrossRef]
  40. Min, H.; Yu, W. Collaborative planning, forecasting and replenishemnt: Demand planning in supply chain management. In Proceedings of the Fourth International Conference on Electronic Business, Beijing, China, 5–9 December 2004. [Google Scholar]
  41. Lieb, R.; Kendrick, S. The Use of Third-Party Logistics Services by Large American Manufacturers, the 2002 Survey. Supply Chain Forum Int. J. 2002, 3, 2–10. [Google Scholar] [CrossRef]
  42. Lin, F.R.; Shaw, M.J. Reengineering the order fulfillment process in suppy chain networks. Int. J. Flex. Manuf. Syst. 1998, 10, 197–229. [Google Scholar] [CrossRef]
  43. Coyle, J.J.; Bardi, E.J.; Langley, J.C. The Management of Business Logistics: A Supply Chain Perspective; Thomsom South-Western: Mason, OH, USA, 2003. [Google Scholar]
  44. Bask, A.H. Relationships among TPL providers and members of supply chains—A strategic perspective. J. Bus. Ind. Mark. 2001, 16, 470–486. [Google Scholar] [CrossRef]
  45. Ji, G.; Zhang, T. Supply chain innovation behavior on perspective view of modular organization network. In Proceedings of the 9th International Conference on Service Systems and Service Management (ICSSSM 2012), Shanghai, China, 2–4 July 2012; pp. 804–809. [Google Scholar]
  46. Kramarz, M. Strategie Adaptacyjne Przedsiębiorstw Flagowych Sieci Dystrybucji z Odroczoną Produkcją. Dystrybucja Wyrobów Hutniczych; Wyd. Politechniki Śląskiej: Gliwice, Poland, 2012. [Google Scholar]
  47. Kramarz, M.; Kramarz, W. Struktura sieci dostaw—Sieciowe łańcuchy dostaw wyrobów hutniczych. Nowocz. Przemysłu Usług-Nowe Wyzwania 2012, 1, 300–310. [Google Scholar]
  48. Zhang, J.; Nault, B.R.; Tu, Y. A dynamic pricing strategy for a 3PL provider with heterogeneous customers. Int. J. Prod. Econ. 2015, 169, 31–43. [Google Scholar] [CrossRef]
  49. Czakon, W. Sieci międzyorganizacyjne w naukach o zarządzaniu-w kierunku sieciowych modeli biznesu. Studia Ekon. 2015, 217, 9–18. [Google Scholar]
  50. Jonsson, P.; Gustavsson, M. The impact of supply chain relationships and automatic data communication and registration on forecast information quality. Int. J. Phys. Distrib. Logist. Manag. 2008, 38, 280–295. [Google Scholar] [CrossRef] [Green Version]
  51. Wang, K.; Fu, X. Research on centrality of urban transport network nodes. AIP Conf. Proc. 2017, 1839, 020181. [Google Scholar]
  52. Toldbod, T.; van der Kolk, B. Changing fast and slow: A longitudinal case study on the calibration of management control elments in a global manufacturing company. In Proceedings of the 9th Conference on Performance Measurement and Management Control, Nice, France, 13–15 September 2017. [Google Scholar]
  53. Andersen, L. How Options Analysis Can Enhance Managerial Performance. Eur. Manag. J. 2002, 20, 505–511. [Google Scholar] [CrossRef]
  54. Heikkilä, J. From supply to demand chain management: Efficiency and customer satisfaction. J. Oper. Manag. 2002, 20, 747–767. [Google Scholar] [CrossRef]
  55. Martynenko, D. Demand at the marketing planning of the enterprise. Sci. J. Pol. Univ. 2018, 29, 19–26. [Google Scholar] [CrossRef]
  56. Mark, D.; Rau, D.P. Splitting demand from supply in IT. McKinsey Q. 2018, 30, 1–5. [Google Scholar]
  57. Ahrne, G.; Brunsson, N. Organization outside organizations: The significance of partial organization. Organization 2010, 18, 83–104. [Google Scholar] [CrossRef]
  58. Aertsen, F.; Blanc, I.I.; Rongen, J.; Wouwe, L. Building a competitive demand planning organization. Eyeon White Pap. 2016, 1, 4–15. [Google Scholar]
  59. Brito, B. Centralization of Supply Chain Management Operations: The Case of Unilever Ultralogistik. Master’s Thesis, University of Porto, Porto, Portugal, 2016. [Google Scholar]
  60. Qi, Y.; Tang, M.; Zhang, M. Mass customization in flat organization: The mediating role of supply chain planning and corporation coordination. J. Appl. Res. Technol. 2014, 12, 171–181. [Google Scholar]
  61. Ballou, R.H. The evolution and future of logistics and supply chain management. Produção 2008, 18, 375–388. [Google Scholar]
  62. Loukarakis, E.; Dent, C.; Bialek, J.W. Decentralized Multi-Period Economic Dispatch for Real-Time Flexible Demand Management. IEEE Trans. Power Syst. 2015, 31, 672–684. [Google Scholar] [CrossRef] [Green Version]
  63. Kucharska, W.; Drozd, R. E-logistyka dystrybucji a czynnik ludzki w procesie kształtowania wartości marki—Ujęcie praktyczne. Zesz. Nauk. Uniw. Szczecińskiego 2015, 875, 497–507. [Google Scholar]
  64. Szozda, N.; Świerczek, A. Zarządzanie Popytem na Produkty w Łańcuchu Dostaw; PWE: Warszawa, Poland, 2016. [Google Scholar]
  65. Hüseyin, B.; Selin Soner, K.; Pelin, A.; Betül, Ö.; Gözde, Ç. A distribution network optimization problem for third party logistics service providers. Expert Syst. Appl. 2011, 38, 12730–12738. [Google Scholar]
  66. Singh, R.K. Developing the framework for coordination in supply chain of SMEs. Bus. Process Manag. J. 2011, 17, 619–638. [Google Scholar] [CrossRef]
  67. Tsanos, C.S.; Zografos, K.G.; Harrison, A. Developing a conceptual model for examining the relationship between behavioral antecedents of supply chain collaboration, integration and performance. Int. J. Logist. Manag. 2014, 25, 418–462. [Google Scholar] [CrossRef] [Green Version]
  68. Verdouw, C.; Beulens, A.; Trienekens, J.; Wolfert, J. Process modelling in demand-driven supply chains: A reference model for the fruit industry. Comput. Electron. Agric. 2010, 73, 174–187. [Google Scholar] [CrossRef]
  69. Alnaggar, A.; Gzara, F.; Bookbinder, J.H. Distribution planning with random demand and recourse in a transshipment network. EURO J. Transp. Logist. 2020, 9, 100007. [Google Scholar] [CrossRef]
  70. Burnham, K.P.; Anderson, D.R. Multimodel inference—Understanding AIC and BIC in model selection. Sociol. Methods Res. 2001, 33, 261–304. [Google Scholar] [CrossRef]
  71. Chernoff, H. Estimation of the mode. Ann. Inst. Stat. Math. 1964, 16, 31–41. [Google Scholar] [CrossRef]
  72. Ding, N.; Benoit, C.; Foggia, G.; Besanger, Y.; Wurtz, F. Neural Network-Based Model Design for Short-Term Load Forecast in Distribution Systems. IEEE Trans. Power Syst. 2015, 31, 72–81. [Google Scholar] [CrossRef]
  73. Haslett, J.; Raftery, A.E. Space-time modelling with long-memory dependence: Assessing Ireland’s Wind Power Resource. Appl. Stat. 1989, 38, 1–21. [Google Scholar] [CrossRef]
  74. Hyndman, R.J.; Akram, M.; Archibald, B.C. The admissible parameter space for exponential smoothing models. Ann. Inst. Stat. Math. 2007, 60, 407–426. [Google Scholar] [CrossRef]
  75. Hyndman, R.J.; Khandakar, Y. Automatic Time Series Forecasting: The forecast Package for R. J. Stat. Softw. 2008, 27, 1–22. [Google Scholar] [CrossRef] [Green Version]
  76. Rogalska, M. Wieloczynnikowe Modele w Prognozowaniu Czasu Procesów Budowlanych; Politechnika Lubelska: Lublin, Poland, 2016. [Google Scholar]
  77. Zagdański, A.; Suchwałko, A. Analiza i Prognozowanie Szeregów Czaoswych. Praktyczne Wprowadzenie na Podstawie Środowiska; PWN: Warszawa, Poland, 2016. [Google Scholar]
  78. Grzelak, M.; Borucka, A.; Buczyński, Z. Forecasting the demand for transport services on the example of a selected logistic operator. Arch. Transp. 2019, 52, 81–93. [Google Scholar] [CrossRef]
  79. Ren, S.; Choi, T.-M.; Lee, K.-M.; Lin, L. Intelligent service capacity allocation for cross-border-E-commerce related third-party-forwarding logistics operations: A deep learning approach. Transp. Res. Part E Logist. Transp. Rev. 2020, 134, 101834. [Google Scholar] [CrossRef]
  80. Sohrabpour, V.; Oghazi, P.; Toorajipour, R.; Nazarpour, A. Export sales forecasting using artificial intelligence. Technol. Forecast. Soc. Chang. 2020, 163, 120480. [Google Scholar] [CrossRef]
  81. Barrow, D.K.; Kourentzes, N. Distributions of forecasting errors of forecast combinations: Implications for inventory management. Int. J. Prod. Econ. 2016, 177, 24–33. [Google Scholar] [CrossRef] [Green Version]
  82. Bayraktar, E.; Koh, S.L.; Gunasekaran, A.; Sari, K.; Tatoglu, E. The role of forecasting on bullwhip effect for E-SCM applications. Int. J. Prod. Econ. 2007, 113, 193–204. [Google Scholar] [CrossRef]
  83. Omar, H.; Hoang, V.H.; Liu, D.-R. A hybrid neural network model for sales forecasting based on ARIMA and search popularity of article tiles. Hindawi 2016, 2016, 9656453. [Google Scholar]
  84. Moon, M.A.; Mentzer, J.T.; Smith, C.D. Conducting a sales forecasting audit. Int. J. Forecast. 2003, 19, 5–25. [Google Scholar] [CrossRef]
  85. Chu, C.-W.; Zhang, G.P. A comperative study of linear and nonlinear models for aggregate retail sales forecasting. Int. J. Prod. Econ. 2003, 86, 217–231. [Google Scholar] [CrossRef]
Figure 1. Research stages.
Sustainability 14 01013 g001
Figure 2. Course of the forecast calculation process (map in the full quality: https://tiny.pl/95hgs).
Sustainability 14 01013 g002
Figure 3. Results of forecasts in individual distribution networks on a daily and weekly basis.
Sustainability 14 01013 g003
Figure 4. Analysis results summary.
Sustainability 14 01013 g004
Figure 5. Proposition of accuracy assessment for each SKU forecasts.
Sustainability 14 01013 g005
Table 1. Operator roles in the distribution network.
Basic Roles in the Distribution Network Taking into Account the Degree of Their Implementation
Low DegreeMedium DegreeHigh Degree
Logistic operatorDistribution network integration, Selection of business partners in the distribution network, the ability to direct the activities of other network participantsNetwork monitoring, network creation (the ability to freely shape the network structure), selection of logistic partners, maintaining the consistency of the network structure, network reconfiguration, assigning tasks to network partners according to competences, creating identity and organizational culture, a significant number of processes implemented in the stream of added valueCoordination of logistics processes in the distribution network, a significant position in the network in terms of leadership and intermediation, the ability to cooperate with production companies, a significant share in the logistics services market, a significant number of market segments served, geographic coverage, width of service areas, access to logistics infrastructure
Source: based on [46,49,52].
Table 2. Brief description of chosen forecasting functions.
FunctionBrief Function Description
ses()Forecasting stationary time series connected with simple exponential smoothing methods.
holt()Forecasting time series with trend using Holt Method
holtWinters()Forecasting time series with trend and seasonality using Holt-Winters Method. In default version function HoltWinters() is using two additive seasonality versions. To use multiplicative version of the method it is necessary to modify the function as follows: HoltWinters(x, seasonal = c(“multiplicative”), where x is the time series.
ets()Forecasting based on three dimensions: error (E), trend (T) and seasonality (S). Function gives a chance to determine mentioned parameters. In all cases: N—none, A—additive, M—multiplicative and Z—automatically selected. In default function configuration, all parameters are automatically selected and default function is equivalent to ets(x, model = “ZZZ”), where x is the time series.
ar()Forecasting based on fitting the time series autoregression model to the input data.
arima()Forecasting based on fitting ARIMA(p,q,d) model to time series. Focus on connection between autoregression process (AR(p)) to moving average process (MA(q)).
auto.arima()Forecasting based on ARIMA(p,q,d) model, but additionally taking into account information criteria as AIC (Akaike Information Criterion), AICc(Corrected Akaike Information Criterion) and BIC(Bayesian Information Criterion).
arfima()Forecasting based on autoregressive fractionally integrated moving average model (ARFIMA(p,d,q)) with two-steps procedure where parameters p, d and q are determined separately. Parameters of autoregression (p) and moving average (q) are determined by Hyndman-Khandakara algorithm. Integration level (d) is determined by Haslett and Raftery algorithm.
tbats()Forecasting based on exponential smoothing with Box-Cox transformation (tb), ARMA errors (a) and components of: trend (t) and seasonal (s).
splinef()Forecasting based on cubic smoothing splines equivalent of ARIMA(0,2,2) model but with some parameters restriction.
stlf()Forecasting based on time series decomposition using local regression. Function uses Seasonal Decomposition of Time Series by LOESS (developed by Helsel and Hirsch in 1997).
meanf()Forecasting based on assumption that random component is independent and identically distributed to whole time series.
rwf()Forecasting based on random walk with drift model.
snaive()Forecasting based on the middle of the range which contains most observations. It references to one of the direct modal estimator called Chernoff’s estimator.
nnetar()Forecasting based on neural network (neural network time series forecasting). In default settings function forecasting demand based on simple, feedforwarded neural network with one hidden layer.
Source: ref. [69,70,71,72,73,74,75,76,77].
Table 3. Comparison of the attributes of a selected logistics operator with the attributes of enterprises showing high forecasting ability.
Selected AttributesAttribute Type *Whether the Logistic Operator has an Equal Attribute?
Ability to configure a distribution networkNecessary.yes
Good specificity of relationships with enterprises in the network and experience in developing cooperation.Additional.partially
Good relationships with links in the network. Necessary.yes
Cooperation establishing skills.Additional.yes
The ability to manage the marketing and sales facilities.Additional.no
The ability to select a demand management strategy for a given distribution network.Necessary.yes
Supply chain coordination skills.Additional.no
The ability to improve processes in the distribution network.Additional.yes
Having an IT system to exchange information across the entire network.Additional.no
Ability to make improvements in information flows and to implement EDI.Necessary.yes
Appropriate location in the distribution network. Additional.yes
Significant position in the market compared to other operators.Additional.no
Ability to influence the actions of other nodes.Necessary.yes
A wide spectrum of services offered in various fields. Operational knowledge of all company-specific processes.Additional.no
Comprehensive services (offering additional services related to logistic flows)Necessary.yes
Analytical knowledge and the ability to manage large data sets.Necessary.yes
Having a well-constructed and selected forecasting algorithm.Additional.currently being created
* Necessary—an attribute that a company must have and that predisposes it to expand its business with forecasting the demand for products. Additional—an attribute that can strengthen the company’s ability to make accurate forecasts.
Table 4. Specificity of the distribution networks in question.
Distribution NetworkNumber of SKU *Number of Assortment GroupsNumber of SKU **Direct Distribution from Logistic OperatorPOS Number in Total
IntermediariesPOS ***Wholesalers
ABCQ%Q%Q%
DN.113621928230277832278.3918521.610014,870
DN.211521517121976213225.15115255.782311918,495
DN.34151272952481112.68211097.1880.142660
DN.46051315322598.95151.65003247
DN.52728113023116810000008180
* Number of SKUs (Stock Keeping Units) flowing through the network. ** According to ABC classification (according to share in releases). *** POS (Points of Sales).
Table 5. Analyzed elements in individual distribution networks.
Evaluated ElementWeightDistribution Network
DN.1DN.2DN.3DN.4DN.5
Relationship of manufacturer with logistic operatorInformation exchange on the changes in production and stock references identification0.212122
Information exchange on sales peaks0.211122
Sending cumulative forecasts0.132023
Often direct contact0.123133
Seldom assortment changes0.1511233
Inclusion of the operator into information exchange0.2511023
final result—relationship of operator with manufacturer1.31.50.82.252.6
Results of distribution network configurationInformation distribution0.232123
Low safety buffers0.122222
Low dependence of manufacturer on clients0.1503123
Information exchange on sales peaks within the whole network0.2512013
Satisfactory productiveness0.1532123
Frequency of orders update0.1513132
final result—network configuration1.652.30.851.92.75
Characteristics of products within the networkHigh warehouse susceptibility0.222322
High transport susceptibility0.222033
AX share—result0.302113
Release variability level0.312013
final result—characteristics of products within networks1.320.91.62.8
Total result4.255.82.555.758.15
Publisher’s Note: MDPI stays neutral with regard to jurisdictional claims in published maps and institutional affiliations.

