Article

Spectral and Soil Quality Index for Monitoring Environmental Rehabilitation and Soil Carbon Stock in an Amazonian Sandstone Mine

by
Paula Godinho Ribeiro
1,
Gabriel Caixeta Martins
1,
Markus Gastauer
1,
Ediu Carlos da Silva Junior
1,
Diogo Corrêa Santos
1,
Cecílio Frois Caldeira Júnior
1,
Rosane Barbosa Lopes Cavalcante
1,
Douglas Silva dos Santos
1,
Marco Aurélio Carbone Carneiro
2,
Rafael Borges da Silva Valadares
1,
Wilson da Rocha Nascimento Junior
1,
Guilherme Oliveira
1,
Pedro Walfir Martins e Souza Filho
1 and
Silvio Junio Ramos
1,*
1
Instituto Tecnológico Vale, Rua Boaventura da Silva, 955, Belém 66055-090, PA, Brazil
2
Soil Science Department, Federal University of Lavras, Lavras 37200-900, MG, Brazil
*
Author to whom correspondence should be addressed.
Sustainability 2022, 14(2), 597; https://doi.org/10.3390/su14020597
Submission received: 2 December 2021 / Revised: 29 December 2021 / Accepted: 30 December 2021 / Published: 6 January 2022

Abstract

:
Rehabilitation is the key factor for improving soil quality and soil carbon stock after mining operations. Monitoring is necessary to evaluate the progress of rehabilitation and its success, but the use of repeated field surveys is costly and time-consuming at a large scale. This study aimed to monitor the environmental/soil rehabilitation process of an Amazonian sandstone mine by applying spectral indices for predicting soil organic carbon (SOC) stock and comparing them to soil quality index. The studied area has different chronological rehabilitation stages: initial, intermediate, and advanced with 2, 10, and 12 years of onset rehabilitation activities, respectively. Non-rehabilitated (NR) and two native forest areas (RA) were used as controls. Soil samples were analyzed for physical, chemical, and biological attributes. After determination of Normalized Difference Vegetation Index and Bare Soil Index, simple regression analysis comparing these indices with SOC stock showed a good fit (R2 = 0.82). Rehabilitated areas presented higher soil quality index (~1.50-fold) and SOC stock (~10.6-fold) than NR; however, they did not differ of RA. The use of spectral indices was effective for monitoring the soil quality in this study, with a positive correlation between the predicted SOC stock and the calculated soil quality index.

1. Introduction

The rehabilitation of mining areas in Brazil is regulated by several resolutions and normative instructions [1]. For rehabilitation projects, the mining companies should promote the return of the degraded area to an appropriate biological state. In this sense, revegetation is a technique widely used as it is the key factor for improving sustainability, increasing soil quality, and storing soil organic carbon [2]. This process is favored in Brazil due to the broad native species diversity and favorable climatic conditions for plant growth [3]. Nevertheless, the bare soil, especially after opencast mining, is known as lacking plant nutrients, aggregation, and organic matter, which make the revegetation process difficult [4,5]. Monitoring the areas, especially in a chronosequence study, is therefore necessary to understand whether the adopted rehabilitation practices are contributing to the improvement of soil attributes and the rehabilitation of the disturbed area [6,7].
One promising technique for rehabilitation monitoring is the use of digital image processing of remote sensing data for assessing long- to short-term landscape dynamics. In addition, it can estimate important indicators of soil quality in a cost-effective and rapid manner when compared with repeated field surveys and laboratory measurements in large areas with difficult access [7,8]. One example is the correlation between spectral indices (i.e., normalized difference vegetation index (NDVI) and bare soil index (BSI)) and soil properties such as organic carbon, nutrients, and texture [8,9,10,11].
Another way to evaluate the rehabilitation process and its success is by adopting soil quality indices (SQIs) [12,13]. These indices seek to express through a single number the changes in key soil attributes that are directly and indirectly associated to its ability to function properly. The ideal scenario is to use biological, chemical, and physical indicators that would enclose soil functions such as nutrient cycling, carbon sequestration, and habitat for organisms [14,15].
The soil organic matter (SOM) and soil organic carbon (SOC) content are recognized indicators of soil quality and are present in several derived SQIs [13,16]. In addition, soil is one of the largest carbon reservoirs on the earth, thus there is great interest in aspects involving SOC motivated by its potential effect on climate change mitigation [17]. Finally, the increase of soil organic carbon stock is a goal to achieve for sustainable development [18] and is a compromise assumed by several companies around the globe, including mining.
The objective of this study was to assess the rehabilitation progress in a sandstone mineland of the Carajás Mineral Province (Brazil) using remote sensing tools and a soil quality index. The specific objectives were to: (1) assess the soil organic carbon (SOC) stock in the topsoil (0–20 cm), (2) establish a SQI based on physical, chemical, and biological attributes, (3) study the use of spectral indices (NDVI and BSI) as predictors of the SOC stock and (4) analyze the correlation between soil attributes, spectral and soil quality indices, and SOC stock. We hypothesize that the rehabilitation techniques applied in these areas increase SOC stock and that the use of spectral indices are effective tools for monitoring soil quality and SOC stock, with a positive correlation between the predicted SOC stock and the calculated SQI.

2. Materials and Methods

2.1. Study Site

The study was conducted in a sandstone mine in the Carajás Mineral Province, state of Pará, Brazil (Figure 1). The climate in the region is classified as tropical wet-dry (Aw) according to Köppen classification, with mean annual temperature and precipitation of 25 °C and 1950 mm, respectively [19].
After sand extraction, the total area of sandstone mine was filled with granite mining waste. For rehabilitation, the following techniques were applied: distribution of 30 cm of forest topsoil collected up to 50 cm layer in a nearby native reference area [20]; liming (1.5 Mg per ha of dolomitic lime); planting of native species (about 15 to 20 different species; density of 1700 seedlings ha−1); and applying in each planting pit 300 g ha−1 of NPK fertilizer (4-14-8) enriched with fritted glass material (FTE BR 12) containing S, B, Cu, Mn, and Zn and 1 kg of dried manure [21,22]. The estimated physical and chemical characteristics of the topsoil and the list of all 44 plant species planted or sowed for rehabilitation can be found in Gastauer et al. [21].
All areas had the same rehabilitation protocol but they differ from the onset of rehabilitation activities as follows: initial stage (Ini—2 years of rehabilitation), intermediate stage (Int—10 years of rehabilitation), and advanced stage (Adv—12 years of rehabilitation) (Figure 1). In addition to the chronosequences, two reference sites of undisturbed evergreen dense submontane forest (RefA and RefB), which is the target of the rehabilitation process, and a non-rehabilitated site (NR), with no rehabilitation activities after the granite mine waste application, were assessed.

2.2. Soil Sampling and Analyses

The monitoring of rehabilitated areas and the assessment of soil quality were based on physical, chemical and biological properties as they directly influence soil ecosystem services. For this, soil samples were collected in three plots (10 m × 20 m) installed in representative portions at each rehabilitation stage and reference site (Figure 1, Table S1 of the Supplementary Material). Three composite soil samples within each plot were collected in October 2016 (dry season). The topsoil (0–20 cm), sampled after litter layer removal, was kept in a chamber at 4 °C until analyzed for biological attributes. Another part of the soil was air-dried and sieved (<2 mm) for physical and chemical analyses.

2.2.1. Physical and Chemical Analyses

The following variables were analyzed: soil pH was determined in a 1:2.5 soil-to-water ratio; soil organic matter (SOM) was determined by the potassium dichromate (K2Cr2O7) method; exchangeable Ca, Mg, and Al were extracted with 1 M KCl and determined by inductively coupled plasma-atomic emission spectroscopy (ICP-AES Spectro Genesis, Kleve, Germany); extractable P, K, B, Zn, Fe, Mn, and Cu were extracted by Mehlich-1 solution (0.05 mol L−1 HCl, 0.0125 mol L−1 H2SO4) and quantified using ICP-AES [23]. The soil organic carbon (SOC) was estimated by dividing SOM by a factor of 1.724 (“Van Bemmelen factor”), based on the assumption that soil organic matter contains 58% carbon. The soil texture was determined using the pipette method [24] and the soil bulk density (Ds) was estimated using a pedo-transfer function Equation (1) [25].
Dsest = 1.56 − 0.0005 (clay) − 0.010 (OC) + 0.0075 (SB); (R2 = 0.66)
where Dsest = estimated soil bulk density (g cm−3); clay = clay content (g kg−1); OC = soil organic carbon content (g kg−1) and SB = sum of bases (cmolc kg−1).
The soil organic carbon (SOC) stock was calculated using Equation (2) [26].
SOC stock = (C × DS × p)/10
where SOC stock = soil organic carbon stock (Mg ha−1); C = soil carbon content (g kg−1); DS = soil density (g cm−3); and p = depth of the soil layer (cm).

2.2.2. Biological and Biochemical Analyses

The microbial biomass carbon (MBC) was determined by the fumigation-extraction method [27] and the soil microbial basal respiration (MBR) was estimated by the release of CO2 by soil after incubation with NaOH (0.05 mol L−1) [28]. The microbial metabolic quotient (qCO2) was derived from the MBR to MBC ratio [29] and the microbial quotient (qMic) by the MBC to SOC ratio [30].
The activity of the enzyme urease was estimated via incubation of the substrate (urea) for two hours at 37 °C [31]. The enzyme acid phosphatase (ACP) was determined in a spectrophotometer at 410 nm, using a ρ-nitro-phenyl-phosphate substrate, incubated for one hour at 37 °C [32]. The fluorescein diacetate hydrolysis (FDA) was determined by the release of fluorescein [32] using a spectrophotometer at 490 nm.
The methodology for the determination of the following attributes: content of easily extractable glomalin (EEG), total glomalin (TG), mycorrhizal colonization (MC) and arbuscular mycorrhizal fungal spores’ density is described in Rodríguez-Rodríguez et al. [33].

2.3. Remote Sensing Tools

The Normalized Difference Vegetation Index (NDVI) and Bare Soil Index (BSI) were used in this study to predict SOC stock. The NDVI and BSI are potential tools for the prediction of SOC stock as NDVI is associated with vegetation greenness and BSI with more open and bare soil (expected in non-rehabilitated area). For determination of these indices, high-resolution images of WorldView2 satellite (July 2016) were acquired and used in this research, with 2 m of spatial resolution (pixel size) and 4 spectral bands (blue, green, red and near-infrared) being analyzed. The NDVI and BSI values were obtained following the equations used by Rouse et al. [34] and Jamalabad and Abkar [35], respectively, using the raster calculator of the QGis 3.10 software [36].
NDVI =   ρ NIR   ρ red   ρ NIR +   ρ red  
BSI = [ ( λ R + λ G ) ( λ R + λ B ) ( λ NIR +   λ G ) + ( λ R + λ B )   ×   100 ] + 100
where ρNIR and λNIR = reflection in Near-Infrared Band; ρred and λR = reflectance in Red Band; λG = reflectance in Green Band; λB = reflectance in Blue Band.
A linear regression was performed between NDVI and BSI indices and SOC stock. The equation obtained was used to produce a predicted SOC stock digital map using the raster calculator of the QGis 3.10 software [36]. The Land Cover and Land Use (LCLU) was classified using the software eCogniton 9.0 (eCognition|Trimble Geospatial) for study area description.

2.4. Soil Quality Index

A soil quality index was proposed to monitor the progress of the revegetation in improving soil attributes and to compare with BSI and NDVI. In order to lead the mined areas closer to ecological references (i.e., species composition, ecosystem functions), it is necessary to restore the edaphic properties of the mineland soils considering the surrounding forests. Therefore, these forest soils were considered as reference in this study.
A principal component analysis with all physical, chemical, and biological attributes was performed using the ‘vegan’ package in the R Environment [37] to select the properties included in the index and the weighing factors. Principal components (PCs) with Eigenvalue ≥1 and that explained at least 5% of the variation of the data were selected. The percentage explained by each PC was divided by the total percentage of variation explained by all the PCs providing the weighting factor (WF). Under a particular PC, the variables with high factor loadings (absolute values within 10% of the highest factor loading) were indexed [13].
Soil parameters were converted into scores (S) using the “mid-point optimum” curve, jointly “more is better” and “less is better” curves as described in Freitas et al. [38]. We considered the mean values found in the reference forest areas as the mid-point optimum for each soil attribute. The upper and lower critical levels for determination (B) were considered 50% more or 50% less than the mid-point optimum, respectively. The initial or lower value that a soil property may present (L) was zero for all soil attributes. The slope of the tangent to the curve at the point corresponding to the critical value of the indicator (Sl) was specific for each curve and can be found in Supplementary Material Table S2. The X is the value of the property or indicator measured in the field.
S = ( 1 1 + ( ( B L ) ÷ ( X L ) ) 2 Sl ( B + X 2 L ) )
S is the standardized score, B is the critical value or base limit of the indicator and which establishes the limit between bad and good soil quality, L is the initial or lower value that a soil property may present, might be 0, Sl is the slope of the tangent to the curve at the point corresponding to the critical value of the indicator, and X is the value of the property or indicator measured in the field.
The SQI of each site was calculated using Equation (6).
SQI =   i = 1   n W i S i
where W is the PC weighting factor and S is the indicator score for each variable.

2.5. Statistical Analyses

After data were checked for normality and homogeneity of variances [39], ANOVA was performed followed by the post hoc Tukey HSD test (p < 0.05) to compare the physical, chemical, biological variables and SQI between areas. For this, the package ExpDes [40] was used and the graphics were prepared with the “ggplot2” package [41]. To estimate the SOC stock, linear regression analyses were performed between calculated SOC stock and the NDVI and BSI indices.
The relationships between soil attributes, SOC stock, BSI, NDVI, and SQI were assessed through Pearson’s correlation analysis using the package ‘Hmisc’ version 4.5 [42]. The correlation plot was performed using the R package ‘corrplot’ [43].

3. Results

3.1. Calculated and Predicted SOC Stock

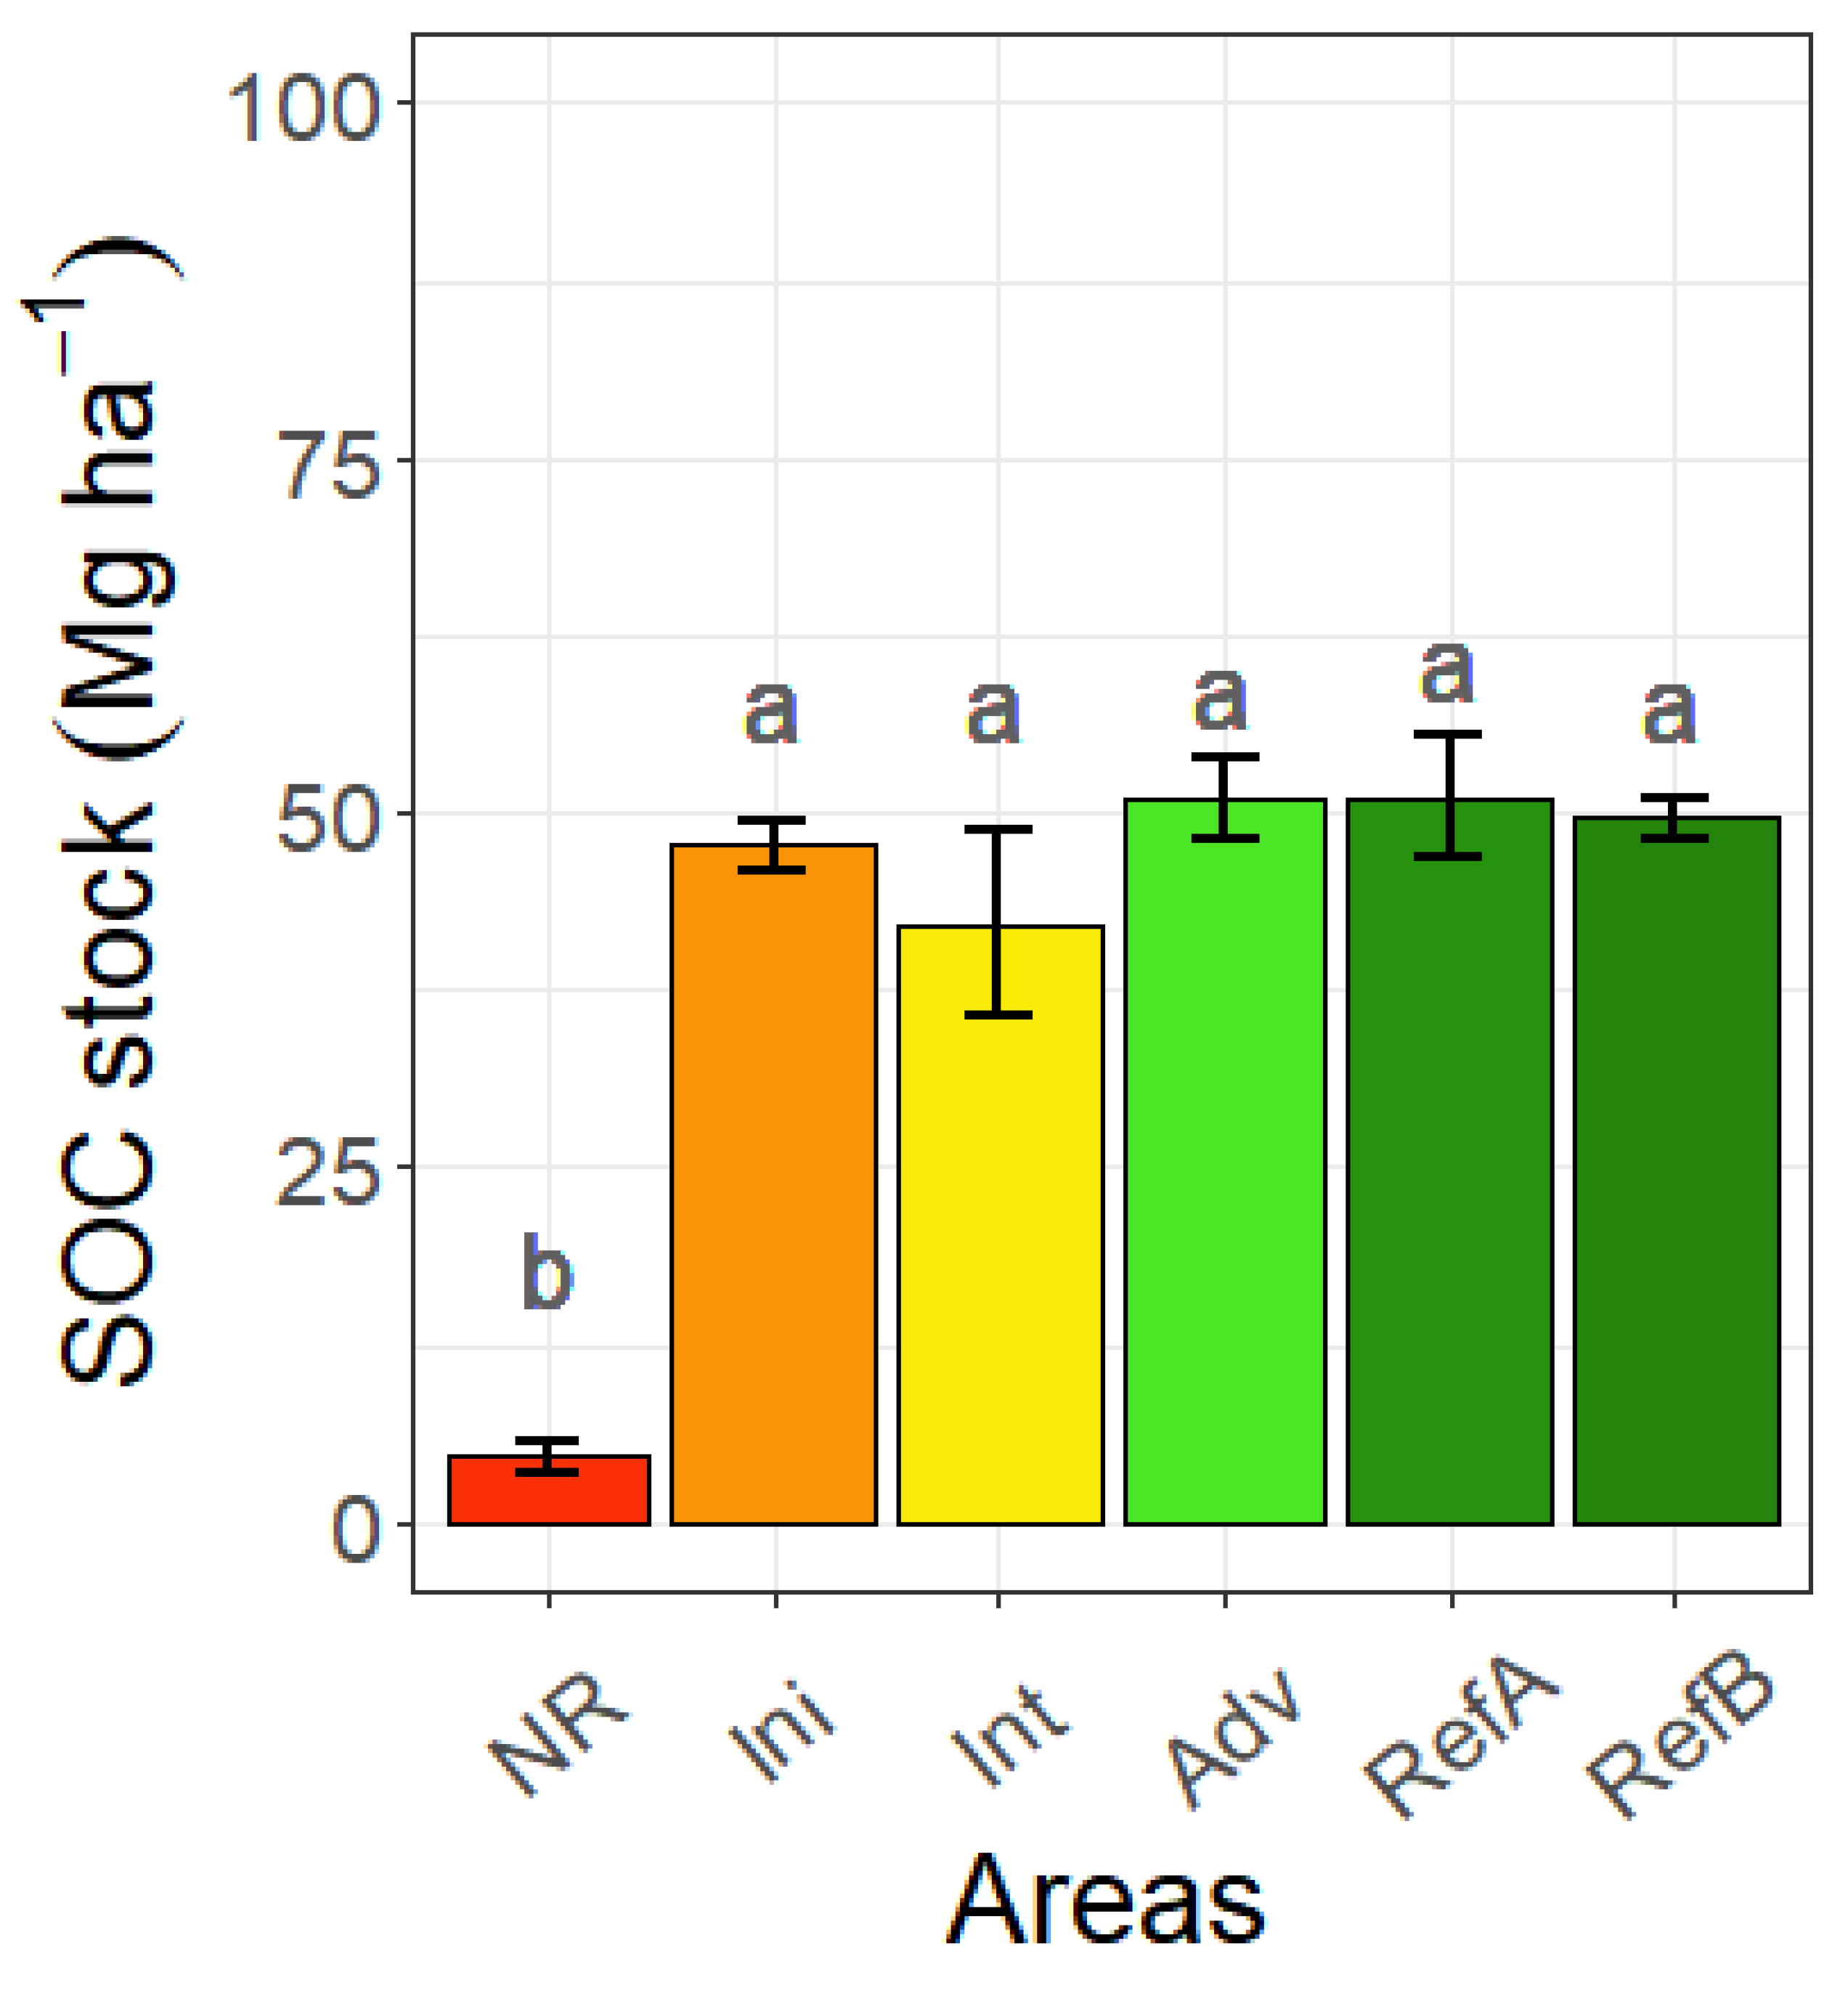
The calculated SOC stock values were similar in the initial, intermediate and advanced stages of rehabilitation and the forest references areas (42.18–51.10 Mg ha−1) (Figure 2). On the other hand, SOC stock in the non-rehabilitated area (4.57 Mg ha−1) was 10.6-fold lower than the mean value of these areas.
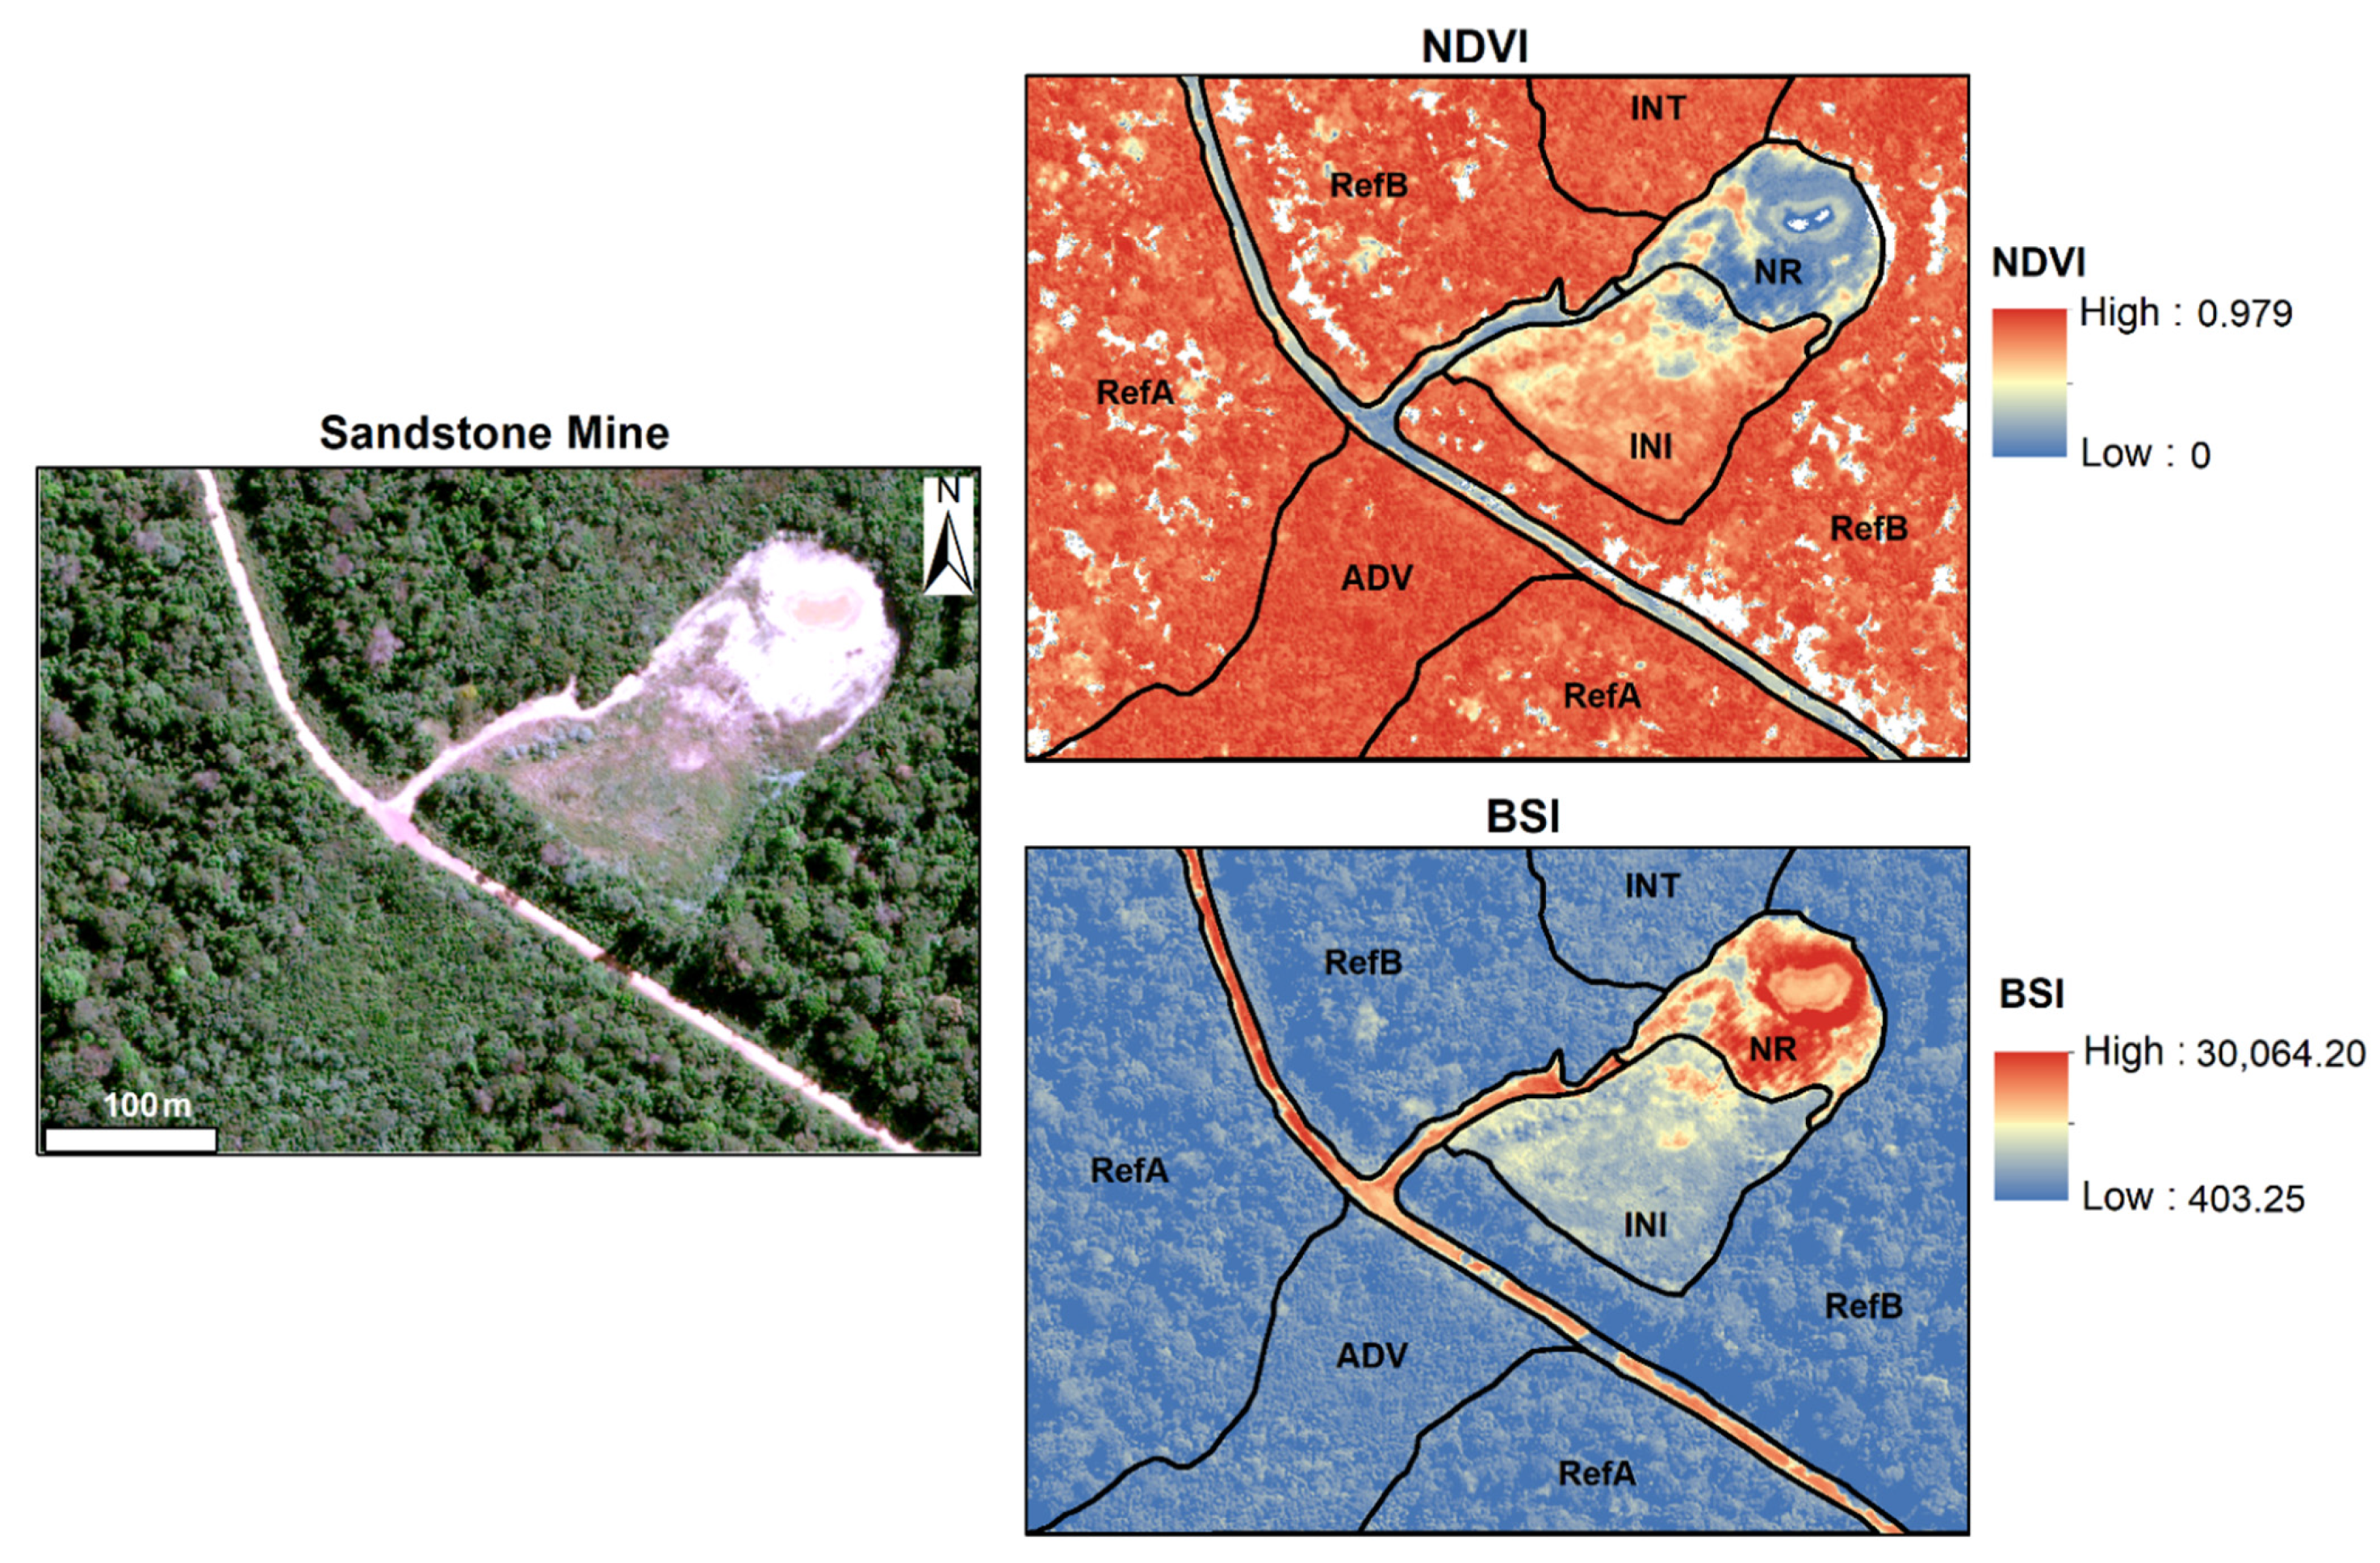
In the exposed soil (non-rehabilitated areas) are found the lowest NDVI and highest BSI values (Figure 3). The exposed soil is mainly observed on roads and non-rehabilitated areas. An herbaceous/grass vegetation is observed in areas under the initial stage of chronosequences and the shrubs/arboreal in the intermediate, advanced and forest reference areas (Figure S1). An increase of NDVI values and a decrease of BSI values were observed following the chronosequences of environmental recovery (Figure 3). For NDVI, tree shadows interference was observed, differently for BSI, in which such interference was not identified. The tree shadows interference was corrected and is showed in white color in Figure 3.
The NDVI and BSI were able to predict the distribution of SOC stocks in the different revegetation stages (Figure 4). The regression analysis between NDVI and BSI with SOC stock resulted in a model with the determination coefficients (R2) equal to 0.81 (Figure 4a) and = 0.82 (Figure 4b). The SOC stock was positively and negatively correlated with NDVI and BSI, respectively. Both models showed similar prediction capacity for SOC stock. The relationship between the measured SOC stock with predicted SOC stock by the two models provided an R2 = 0.81 and 0.82 (Figure 4c,d).
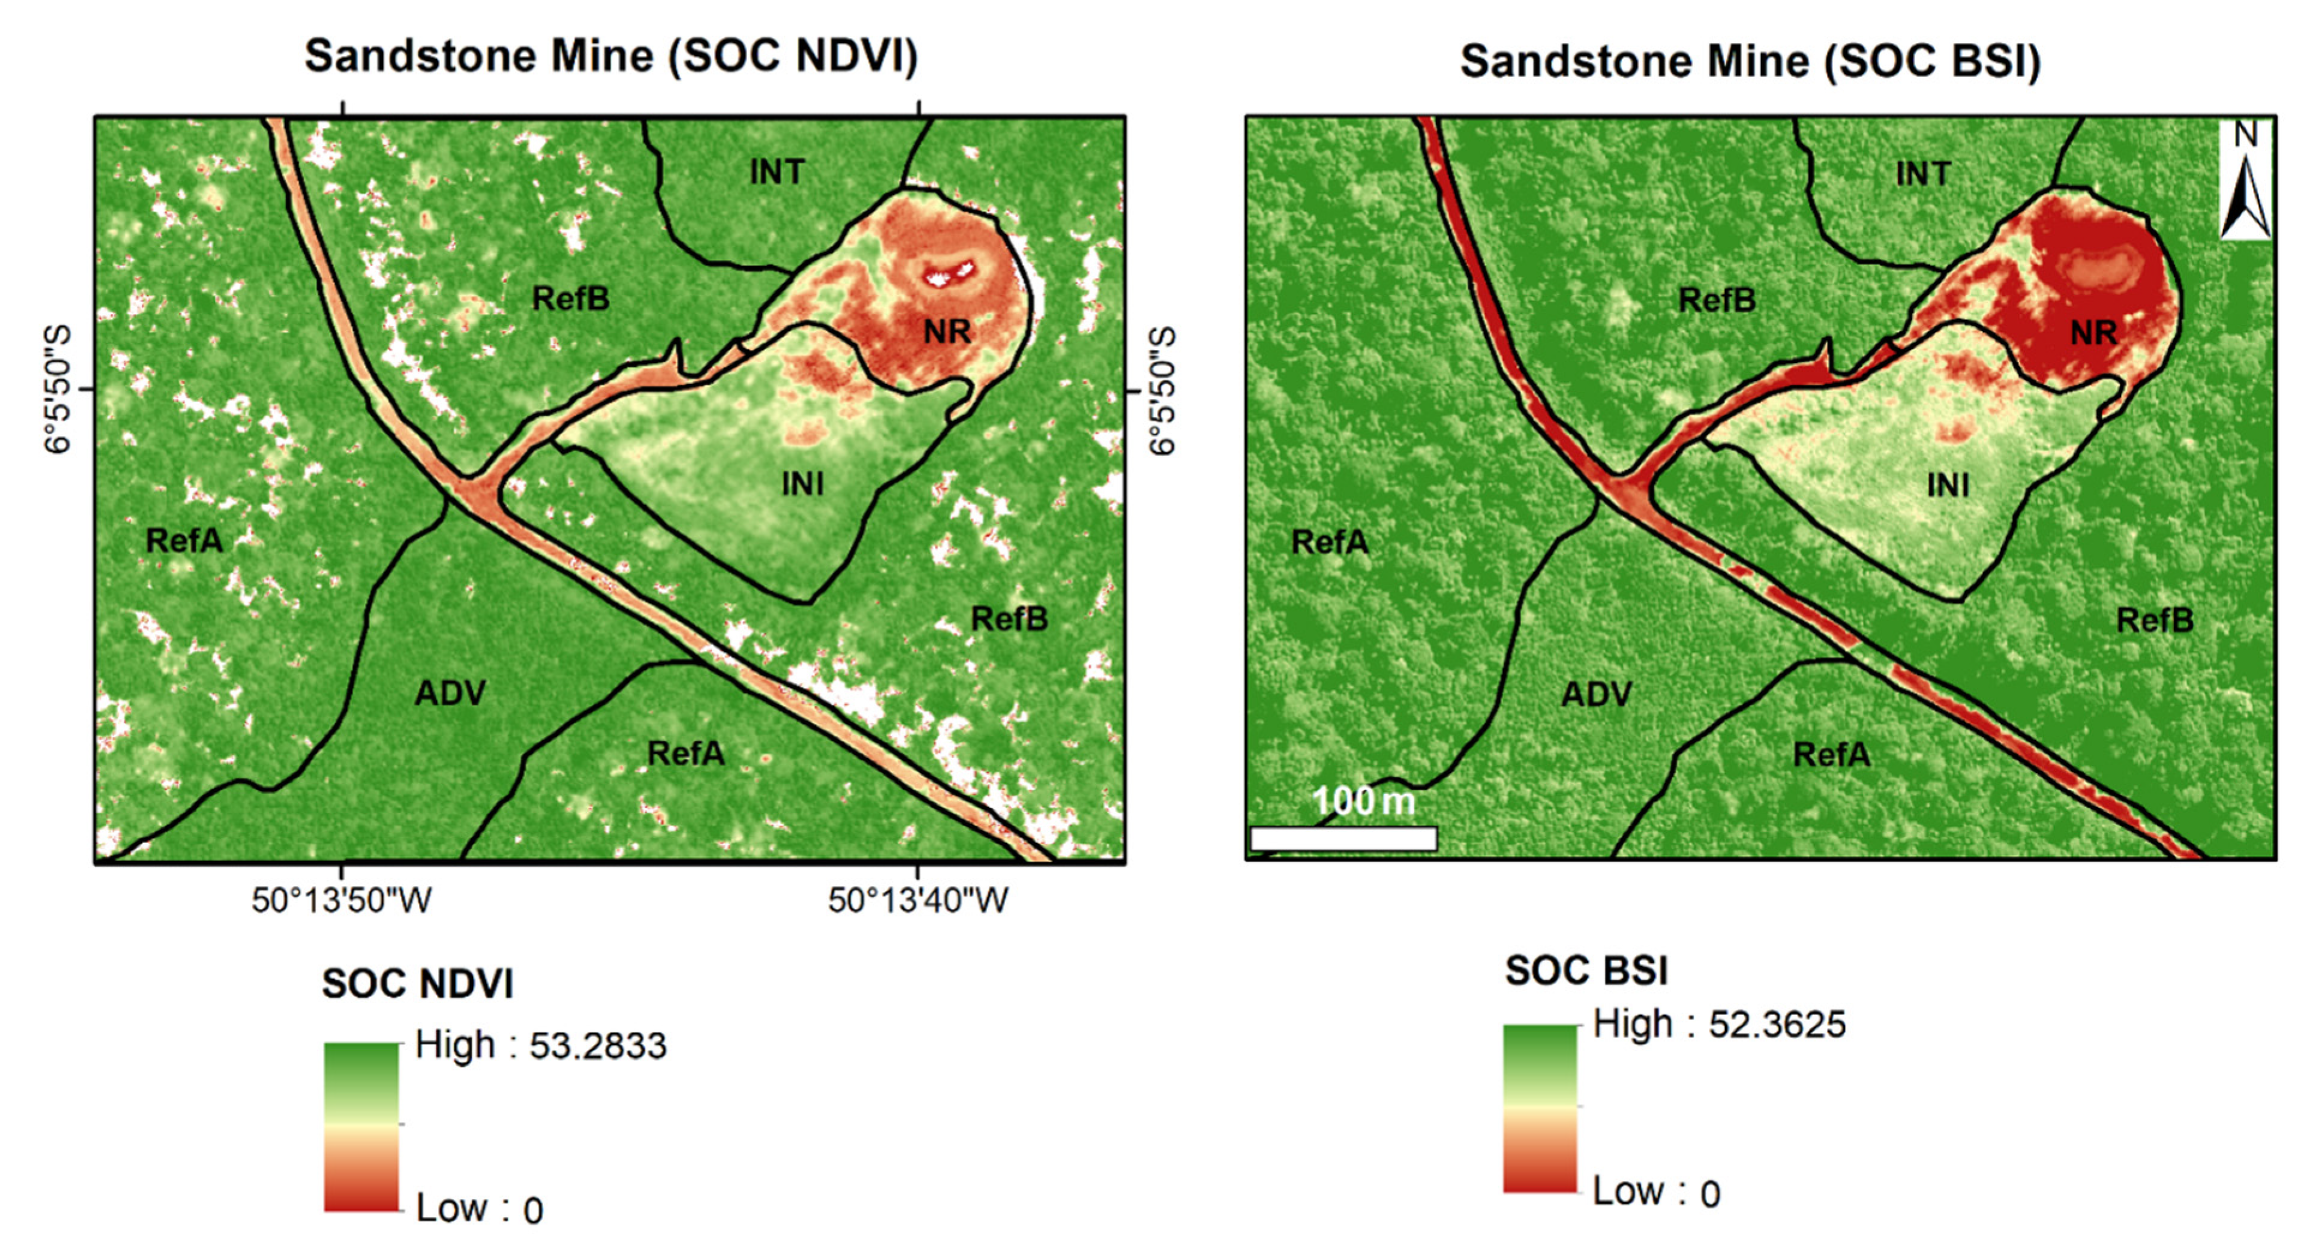
The digital SOC maps based on NDVI and BSI were similar and showed a spatial variation of SOC between non-rehabilitated and rehabilitated areas (Figure 5). The NDVI map has some shades of white in the middle of the forest that are related to tree shadows; on the other hand, in the digital SOC map based on BSI, this was not observed (Figure 5). The higher predicted SOC mean values for both models occurred in areas with dense arboreal vegetation (Figure S1) as follows—intermediate (47.86 Mg ha−1), advanced (48.67 Mg ha−1), and reference forest areas (RefA-55.88 and RefC-54.07 Mg ha−1). As expected, the lower predicted SOC stock values were found in the non-rehabilitated areas (NDVI-7.56 and BSI-8.16 Mg ha−1).

3.2. Soil Quality Index

The physical, chemical and biological variables analyzed for SQI production are showed in Figures S1 and S2 of the Supplementary Material. Some of these variables are already discussed in Rodríguez-Rodríguez et al. [33]. In sum, soils from non-rehabilitated areas presented slightly higher soil pH compared to native reference forests (RefC) (Figure S1). The SOM was higher in the forest and all chronosequences stages compared to the non-rehabilitated area. Soil CEC, Fe and B were superior in both native reference forests compared to the non-rehabilitated and no differences were found between the assessed areas for the sum of bases (SB), Ca, Mg, S, and silt content in soil (Figure S1). The exposed soil area presented lower EEG, spore density, MC and ACP and the highest value of metabolic coefficient (qCO2) among all areas (Figure S2). Regardless of the soil cover condition, the occurrence of arbuscular mycorrhizal fungi was observed, but the advanced stage of recovery presented a spore density 13.8-fold greater than that of the non-rehabilitated area (Figure S2).
The five first PCs had eigenvalues >1.0 and explained 83.25% of the variability (Table 1). The PC1 had high loadings for SOC, CEC, ACP, SOM, EEG, and SOC stock. Except for CEC and ACP, these indicators are correlated and among them, SOC was selected because it presented the highest value. The other highest loading variables—SB, P, Zn, Mn, and S—were included from PC2, PC3, PC4, and PC5 for SQI estimation. The weight values were standardized and the final equation for the SQI determination is the following SQI = 0.24 S(SOC) + 0.24 S(ACP) + 0.222 S(SB) + 0.071 S(Zn) + 0.071 (P) + 0.081 S(Mn) + 0.075 S(S).
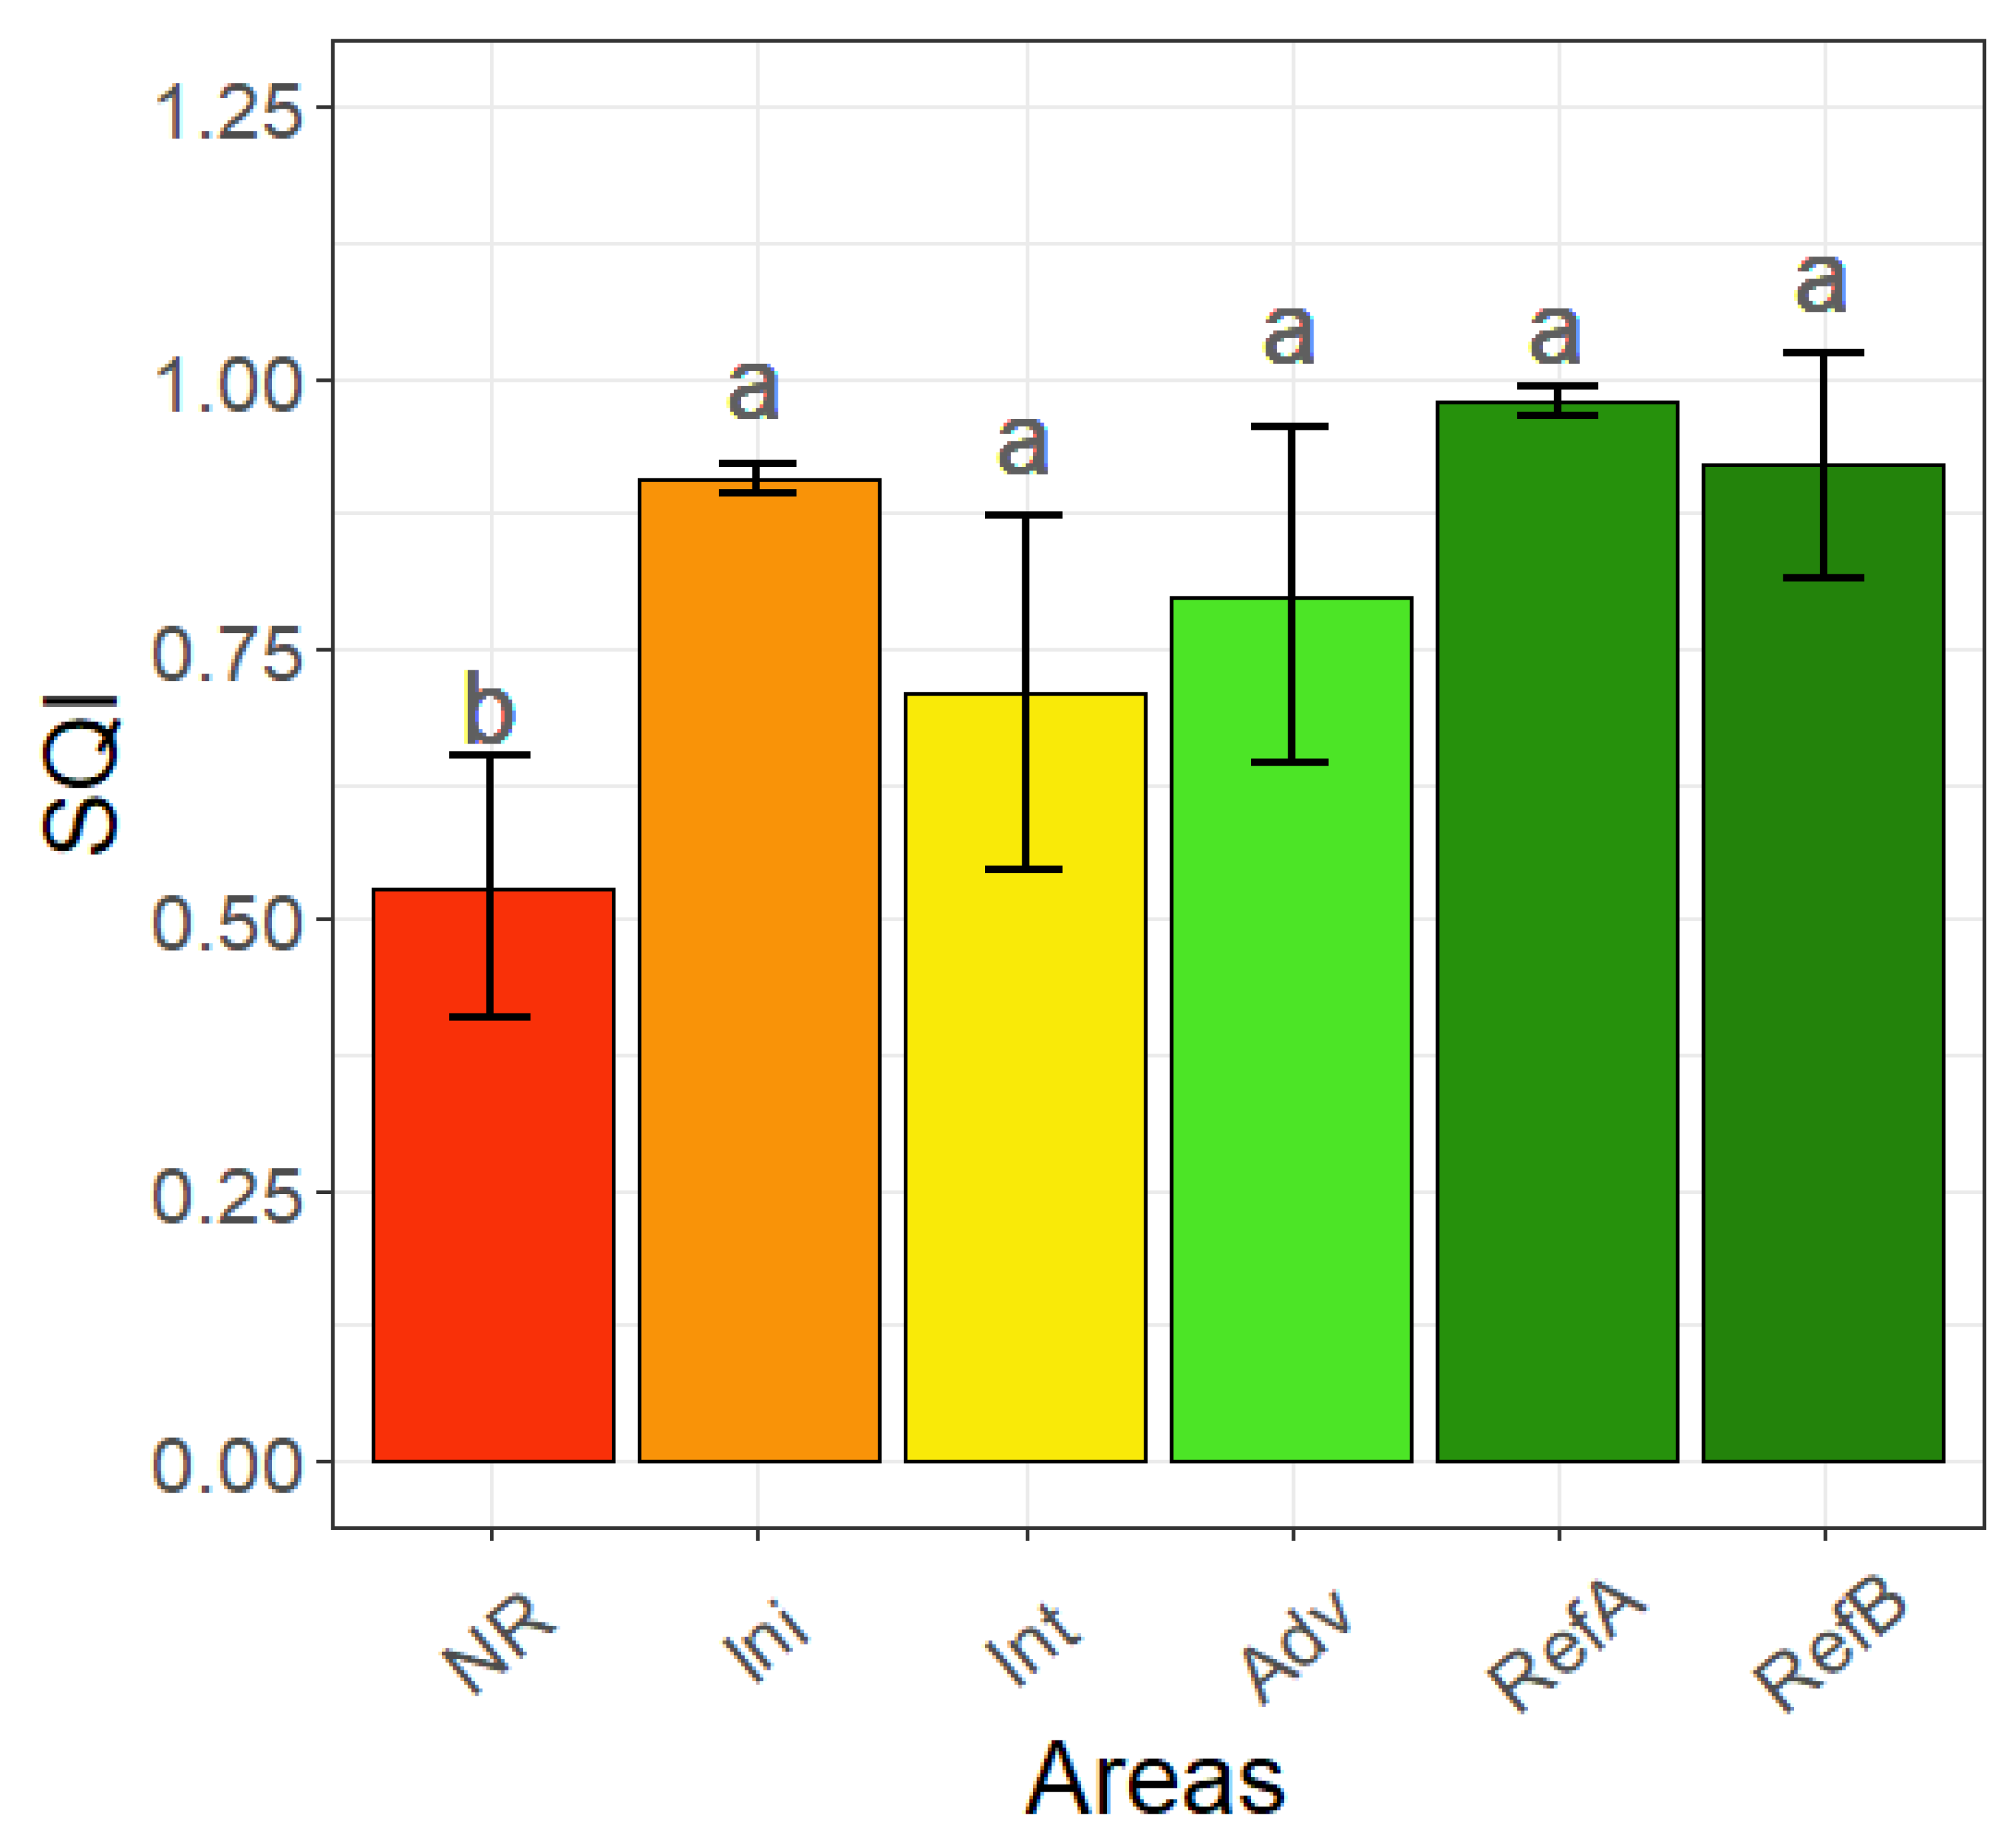
The SQI was effective in discriminating rehabilitated and non-rehabilitated areas (Figure 6). The SQI values ranged from 0.5 to 0.98, with the non-rehabilitated area presenting the lowest value. In accordance with the results of organic carbon stock, the chronosequences of environmental rehabilitation had SQIs values similar to the forest references.

3.3. Relationship between Indices and Soil Attributes

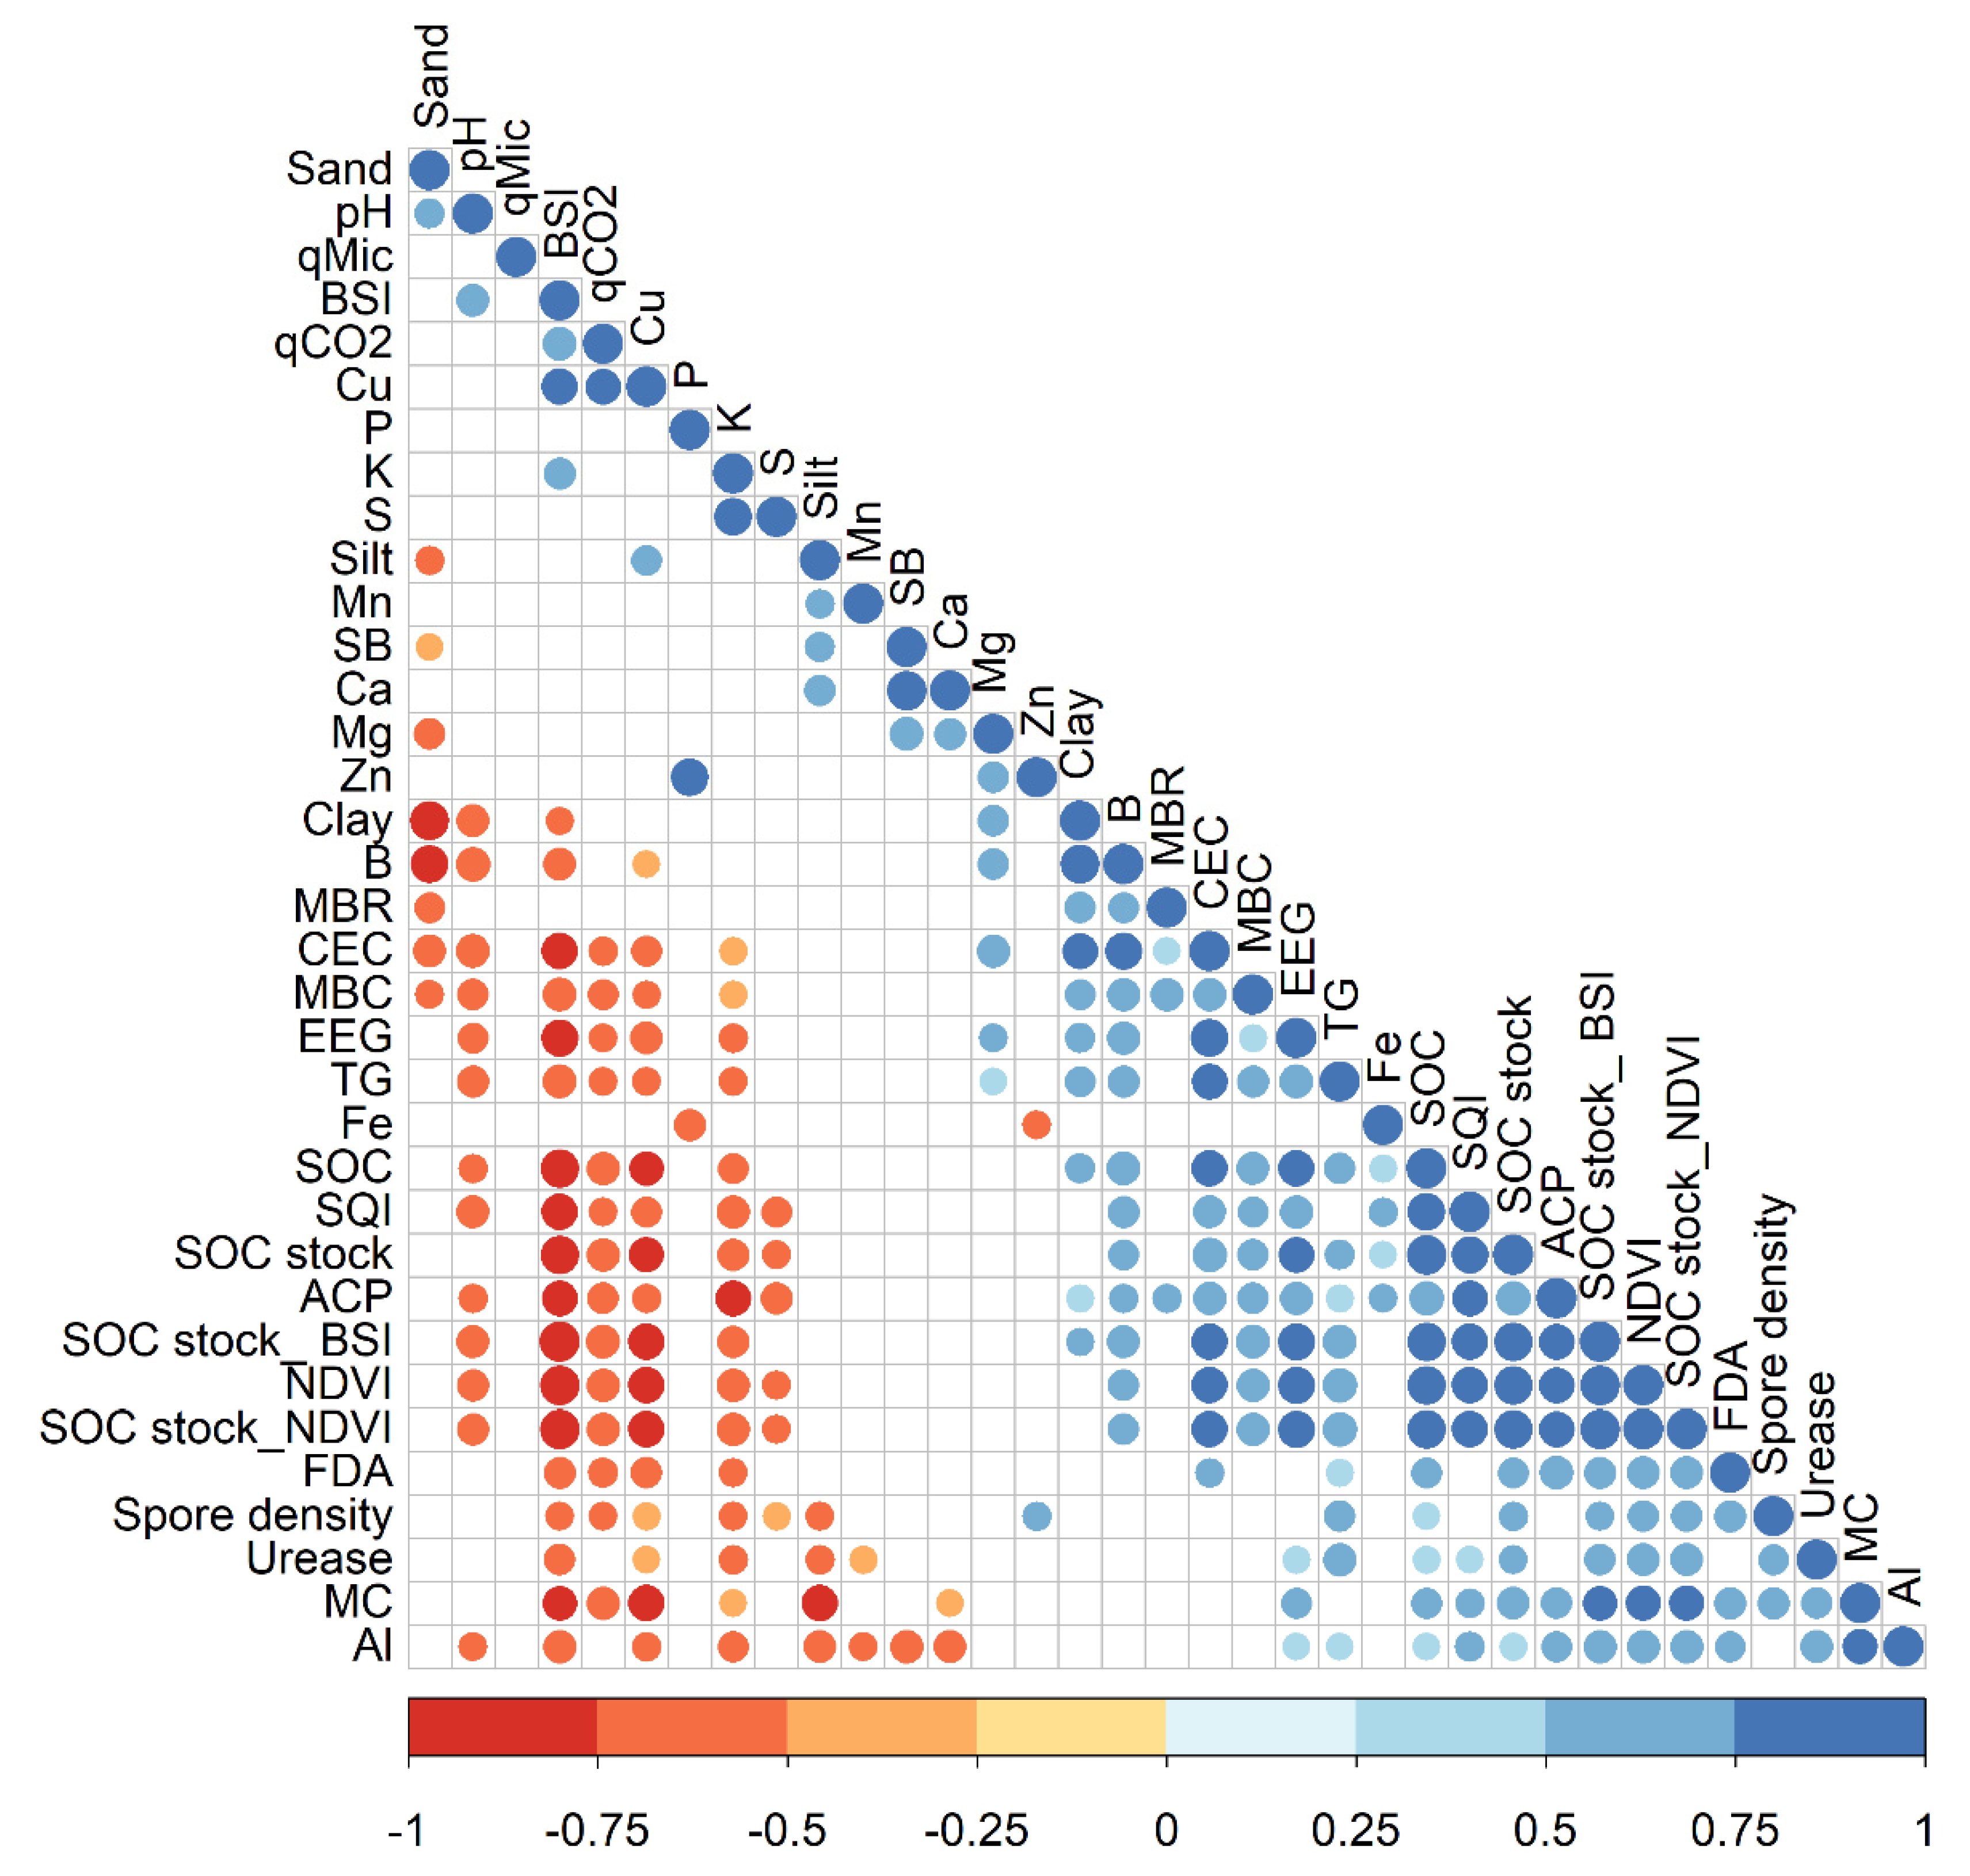
A complete correlation of the calculated SOC stock, NDVI, BSI, predicted SOC stock based on NDVI and BSI models, soil quality index and soil attributes is shown in Figure 7. The BSI was negatively correlated with all measured variables except for qCO2, Cu, and K and an opposite behavior was observed for SOC stock. Soil quality index was better correlated with SOC stock, NDVI, and predicted SOC stock from this spectral index.

4. Discussion

4.1. SOC Stock and Rehabilitation

The higher SOC stock observed in rehabilitated compared to non-rehabilitated areas, even with up to 2 years, is probably due to the application of forest topsoil and the input of organic matter. Glomalin is a soil glycoprotein considered as an important carbon stock in soil [44,45]. In this study, the EEG did not vary with chronosequences and reference areas, only with non-rehabilitated. Accordingly, the levels of SOC stock did not differ between areas under 2, 10, and 12 years of rehabilitation (initial, intermediate and advanced stages) and were equal to the reference forest indicating the maintenance of original topsoil carbon stocks’ added even after a long period.
For the operation of mining activities (beginning or expansion), it is necessary to suppress the native vegetation, removing the topsoil, which is usually stored in order to return it to the original mining pit or a nearby one. Together with topsoil application in rehabilitating areas, carbon stocks were transferred from forest area to the study site. The result shows that SOC stocks in transferred topsoil were maintained, indicating that top-soils did not suffer degradation prior to application on the study site. Besides the granite residues possibly making nutrients available to the plants over time, the fertilizers applied may have also contributed to plants’ rapid ground cover, initiating cycling and avoiding large carbon losses.
In mining sites, it is suggested that SOM recovery may take decades to reach natural soils, or even not show complete recovery [46,47]. However, as observed in this study, Trindade et al. [22] also found the maintenance of carbon cycling during the early stages in the progress of environmental rehabilitation by analyzing enzymes such as cellulase and beta-amylase. Based on the soil metaproteomic analysis, these authors found that, with rehabilitation, the reestablishment of important ecosystem processes can occur in short periods when topsoil is applied at the beginning of the process [22].
In another study, Gastauer et al. [21] evaluated the environmental rehabilitation status based on the ecological processes and vegetation structure and diversity in the same chronosequences of the present study. Although these authors did not find the achievement of pre-disturbance levels, the advanced areas (10–12 years) were able to reach values close to the reference ecosystem with the recovery of vegetation (67%) [21]. This recovery and, consequently, a higher proportion of land cover, protects organic matter by decreasing the SOC loss through erosion and favoring carbon cycling, contributing to the maintenance of SOC stocks. This is evidenced by the correlation between the spectral indices (NDVI and BSI) and SOC stock.

4.2. Prediction of SOC Stock by Spectral Indices

Spectral indices have been used for monitoring environmental rehabilitation of mining sites [48] and SOC stock with different accuracies [10,11]. In this study, NDVI and BSI showed similar prediction capacities of SOC stock and produced similar digital map pattern. Although no big dataset was evaluated, both indices were helpful to track SOC stock distribution with high accuracy (R2 = 0.82). Previous studies also used NDVI and BSI to predict SOC concentrations and showed good performance [10,11,49].
It should be noted that the NDVI map has some shades of blue in the middle of the forest, which are related to tree shadows. NDVI better identifies photosynthetically active vegetation, that is, if there is a dark pixel (in case of shadow) in the image, it will decrease the values and consequently underestimate SOC stock. The interference is more evident in reference areas, where emergent tree layers are more frequently found (higher heterogeneity) compared to those in intermediate and advanced stages of recovery, with small trees and higher homogeneity [21]. On the other hand, in the digital SOC stock map based on BSI, which refers to the soil uncovered, this interference was not observed. The sensibility of NDVI to the effects of soil brightness and color and cloud and leaf canopy shadow has already been described [50,51].
It is noteworthy that in addition to the SOC stock being estimated by the indices, as there is no soil density data, this was also estimated. Thus, the estimated SOC already comes with this associated error, which should be corrected in future studies. Nevertheless, the results of this study highlight the potential use of NDVI and BSI for monitoring comprehensive mineland rehabilitation activities, which is especially relevant for extensive and difficult-to-access areas, such as in several places in the Amazon region and because field surveys can be costly and time-consuming in large-scale.

4.3. Correlation of Indices and Soil Attributes

Some studies have compared spectral indices with SQIs [12,52]. In the present study, calculated and predicted SOC stock was positively correlated with SQI, which was expected because the SOC is one of the major governing factors of soil quality, influencing multiple soil and ecosystem functions [13,53]. For example, SOC has a direct relationship with nutrient availability, water retention capacity, soil structure and erosion resistance [54].
In addition to SOC, the following variables were selected to determine SQI: ACP, SB, Zn, P, Mn, and S. Some of these variables have been included in SQI determination in previous studies [13,16]; on the other hand, some variables normally included, such as pH and MBC [16,55,56], were not selected in the present study. Cation exchange capacity was one of the variables with the highest factor loadings in PC1, but it was not included in the SQI due to its high correlation with SOC. In this sense, CEC was positively correlated with SOC and IQS, which highlights the importance of organic material in soil CEC.
Several studies have reported improvements in soil physical and chemical properties along with chronosequences, particularly in SOC [13,55,57]. Yet, in the present study, these changes were not observed for some analyzed variables. Likewise, an increase of SQI along with chronosequences was expected [13,55], but no differences were found. This might have occurred due to the organic matter present in applied topsoil bringing the values of some soil properties such as EEG, MC, acid phosphatase, and qCO2 to similar levels. In addition, it is worth mentioning that the decrease of SQI improvement rates in later years of recovery has been reported [55]. Guo et al. [55] suggest that vegetation restoration significantly improves soil quality, but this improvement may decrease in the later restoration age.
Differences in rehabilitated and forest reference areas were not evidenced. The enzymatic activity and microbial biomass in the areas undergoing rehabilitation presented values similar to those observed for the reference areas. In another study, Trindade et al. [22] found in the same analyzed sites a recovery of the soil bacteria and other soil enzymes and these were attributed to the increase of soil organic matter and the stabilization of soil physical and chemical conditions.
The SQI indicated differences between non-rehabilitated and rehabilitated areas, in agreement with previous studies [21,22]. Nevertheless, by only analyzing chemical attributes, the soil quality could be better or similar in the non-rehabilitated compared to the rehabilitated areas as it presents higher contents of the nutrients S, B, and Cu, for example. However, SOM content is higher in rehabilitated and forest areas and this consequently influenced the biological activity, SOC stock and soil quality.
In this sense, the SOM is a substrate and the energy source for soil biota. Through the action of microorganisms, the SOM is decomposed allowing the mineralization and release of nutrients for plants. Biological indicators are more sensitive to environmental/soil changes compared to chemical and physical ones [14]. For example, soil quality indices were positively correlated with biological indicators such as EEG, TG, ACP, FDA, and MBC. On the other hand, they were negatively correlated with qCO2 (MBR:MBC ratio), which is a measure of stress condition [58]. The lack of vegetation coverage and soil limiting factors to the soil microbial activity probably promoted a higher stress condition in the non-rehabilitated areas reflecting a high qCO2.

4.4. Importance of SOC Stock

Reclaimed mine-soils could act as C sinks and offset the CO2, released by ore extraction, helping C sequestration [59]. Jacinthe and Lal [59] found that stock of organic C in areas receiving topsoil was twice as much as in plots without topsoil application. We observed that if topsoil application in the rehabilitating areas is well done, and topsoil degradation is avoided, it is expected that original SOC stocks and SQI would be maintained after the soil transfer, so that even early rehabilitation stages would present high SOC stocks and SQIs. However, the resilience of topsoil and the impact of the new forest in SOC stock should be addressed in further studies as the impact of topsoil application can be largely determined by tree growth and productivity [59].
This study shows the maintaining of ~45 Mg ha−1 of SOC stock considering the difference between the average values in rehabilitated and non-rehabilitated areas. Such results were possible because of the efficient use of the topsoil and demonstrate the potential contribution of nature-based solutions to a ‘net-zero’ climate target in minelands of tropical regions. In terms of tropical environment capacity to store SOC in the topsoil (0–20 cm) the value of 45 Mg ha−1 can be considered optimum if we compare with other soil management practices having the capacity to store similar amount in reforestation of agricultural land (44.9 Mg ha−1) [60] and in a citrus orchard that increased from 22.1 to 41.7 Mg ha−1 as a result of combined application of crop residue along with organic manure in a long-term study (from 1982 to 2010) [61].

5. Conclusions

Differences in non-rehabilitated and rehabilitated areas can be evidenced by the soil cover (spectral indices) and soil attributes such as CEC, SOM, and the SOC stock. This study shows that the spectral indices NDVI and BSI can be considered to predict and monitor the SOC stock in minelands. The positive correlation between the SQI and SOC stock predicted by spectral indices reinforces current efforts for remote sensing of soil quality in areas of difficult access.
Data indicates that the topsoil transfer and subsequent revegetation maintains carbon stocks and this may reduce carbon emissions associated to vegetation suppression when topsoil is used for revegetation and rehabilitation purposes. Approximately 45 Mg ha−1 of SOC stock can be preserved with topsoil translocation, which is a very significant amount in the context of the efforts to become mining net-zero carbon emissions.

Supplementary Materials

The following supporting information can be downloaded at: https://www.mdpi.com/article/10.3390/su14020597/s1, Table S1: Geographic location of the studied areas; Table S2: Slope of the tangent to the curve at the point corresponding to the critical value of the indicator (Sl) was specific for each curve; Figure S1: Digital maps of Land Cover and Land Use (LCLU); Figure S2: Chemical and physical soil attributes of chronosequences and reference forests; Figure S3: Biological and biochemical attributes of chronosequences and reference forests.

Author Contributions

Conceptualization, P.G.R. and S.J.R.; methodology, P.G.R., G.C.M., E.C.d.S.J. and D.C.S.; formal analysis, P.G.R., M.A.C.C. and D.C.S.; investigation, P.G.R., G.C.M., M.G., E.C.d.S.J., C.F.C.J., R.B.L.C. and D.C.S.; resources, S.J.R.; data curation, P.G.R., G.C.M. and D.C.S.; writing—original draft preparation, P.G.R.; writing—review and editing, P.G.R., G.C.M., M.G., E.C.d.S.J., C.F.C.J., R.B.L.C., D.C.S., D.S.d.S., M.A.C.C., R.B.d.S.V., W.d.R.N.J., G.O., P.W.M.e.S.F. and S.J.R.; visualization, P.G.R., G.C.M., M.G., E.C.d.S.J., C.F.C.J., R.B.L.C., D.C.S., D.S.d.S., M.A.C.C., R.B.d.S.V., W.d.R.N.J., G.O., P.W.M.e.S.F. and S.J.R.; supervision, S.J.R.; project administration, S.J.R.; funding acquisition, S.J.R. All authors have read and agreed to the published version of the manuscript.

Funding

This work was funded by the Conselho Nacional de Desenvolvimento Científico e Tecnológico (CNPq), Instituto Tecnológico Vale (ITV), Fundação de Desenvolvimento da Pesquisa (FUNDEP), and Fundação de Amparo e Desenvolvimento da Pesquisa (FADESP).

Data Availability Statement

The data used to support the findings of this study are available from the corresponding author upon request.

Acknowledgments

The authors would like to thank the Conselho Nacional de Desenvolvimento Científico e Tecnológico (CNPq), the Instituto Tecnológico Vale (ITV), Fundação de Desenvolvimento da Pesquisa (FUNDEP), and Fundação de Amparo e Desenvolvimento da Pesquisa (FADESP) for financial support in the development of this work and for the scholarships provided.

Conflicts of Interest

The authors declare that they have no significant competing financial interests or personal relationships that could have appeared to influence the work described in this manuscript.

References

  1. Gastauer, M.; Souza Filho, P.W.M.; Ramos, S.J.; Caldeira, C.F.; Silva, J.R.; Siqueira, J.O.; Furtini Neto, A.E. Mine land rehabilitation in Brazil: Goals and techniques in the context of legal requirements. Ambio 2019, 48, 74–88. [Google Scholar] [CrossRef]
  2. Buta, M.; Blaga, G.; Paulette, L.; Păcurar, I.; Roşca, S.; Borsai, O.; Grecu, F.; Sînziana, P.E.; Negruşier, C. Soil reclamation of abandoned mine lands by revegetation in Northwestern part of Transylvania: A 40-Year retrospective study. Sustainability 2019, 11, 3393. [Google Scholar] [CrossRef] [Green Version]
  3. Marques, M.; Aguiar, C.R.C.; Soares da Silva, J.J.L. Desafios técnicos e barreiras sociais, econômicas e regulatórias na fitorremediação de solos contaminados. Rev. Bras. Cienc. Solo 2011, 35, 1. [Google Scholar] [CrossRef] [Green Version]
  4. Ranjan, V.; Sen, P.; Kumar, D.; Sarsawat, A. A review on dump slope stabilization by revegetation with reference to indigenous plant. Ecol. Processes 2015, 4, 14. [Google Scholar] [CrossRef] [Green Version]
  5. Silva, J.R.; Gastauer, M.; Ramos, S.J.; Mitre, S.K.; Furtini Neto, A.E.; Siqueira, J.O.; Caldeira, C.F. Initial growth of Fabaceae species: Combined effects of topsoil and fertilizer application for mineland revegetation. Flora 2018, 246–247, 109–117. [Google Scholar] [CrossRef]
  6. Feng, Y.; Wang, J.; Bai, Z.; Reading, L. Effects of surface coal mining and land reclamation on soil properties: A review. Earth-Sci. Rev. 2019, 191, 12–25. [Google Scholar] [CrossRef]
  7. Suleymanov, A.; Abakumov, E.; Suleymanov, R.; Gabbasova, I.; Komissarov, M. The soil nutrient digital mapping for precision agriculture cases in the trans-ural steppe zone of Russia using topographic attributes. ISPRS 2021, 10, 243. [Google Scholar] [CrossRef]
  8. Angelopoulou, T.; Tziolas, N.; Balafoutis, A.; Zalidis, G.; Bochtis, D. Remote sensing techniques for soil organic carbon estimation: A review. Remote Sens. 2019, 11, 676. [Google Scholar] [CrossRef] [Green Version]
  9. Alves, R.P.; Couto Junior, A.F.; Martins, E.d.S.; Nardoto, G.B. Role of soil carbon in the landscape functioning of the Alto São Bartolomeu watershed in the Cerrado region, Brazil. Pesqui. Agropecu. Bras. 2016, 51, 1241–1251. [Google Scholar] [CrossRef] [Green Version]
  10. Kumar, P.; Pandey, P.C.; Singh, B.K.; Katiyar, S.; Mandal, V.; Rani, M.; Tomar, V.; Patairiya, S. Estimation of accumulated soil organic carbon stock in tropical forest using geospatial strategy. Egypt. J. Remote Sens. Space Sci. 2016, 19, 109–123. [Google Scholar] [CrossRef] [Green Version]
  11. Zhang, Y.; Guo, L.; Chen, Y.; Shi, T.; Luo, M.; Ju, Q.; Zhang, H.; Wang, S. Prediction of soil organic carbon based on landsat 8 monthly ndvi data for the jianghan plain in Hubei Province, China. Remote Sens. 2019, 11, 1683. [Google Scholar] [CrossRef] [Green Version]
  12. Abdel Rahman, M.A.E.; Shalaby, A.; Mohamed, E.S. Comparison of two soil quality indices using two methods based on geographic information system. Egypt. J. Remote Sens. Space Sci. 2019, 22, 127–136. [Google Scholar] [CrossRef]
  13. Mukhopadhyay, S.; Maiti, S.K.; Masto, R.E. Development of mine soil quality index (MSQI) for evaluation of reclamation success: A chronosequence study. Ecol. Eng. 2014, 71, 10–20. [Google Scholar] [CrossRef]
  14. Bastida, F.; Zsolnay, A.; Hernández, T.; García, C. Past, present and future of soil quality indices: A biological perspective. Geoderma 2008, 147, 159–171. [Google Scholar] [CrossRef]
  15. Doran, J.W.; Parkin, T.B. Defining and Assessing Soil Quality. Chapters 1–8, pp. 1–21. In Defining Soil Quality for a Sustainable Environment; Doran, J.W., Coleman, D.C., Bezdicek, D.F., Stewart, B.A., Eds.; SSSA Special Publication, Inc.: Madison, WI, USA, 1994; Volume 35, p. 244. [Google Scholar]
  16. Cherubin, M.R.; Karlen, D.L.; Cerri, C.E.P.; Franco, A.L.C.; Tormena, C.A.; Davies, C.A.; Cerri, C.C. Soil quality indexing strategies for evaluating sugarcane expansion in Brazil. PLoS ONE 2016, 11, 0150860. [Google Scholar] [CrossRef] [PubMed]
  17. McBratney, A.B.; Stockmann, U.; Angers, D.A.; Minasny, B.; Field, D.J. Challenges for Soil Organic Carbon Research. In Soil Carbon. Progress in Soil Science; Hartemink, A., McSweeney, K., Eds.; Springer: Cham, Switzerland, 2014. [Google Scholar]
  18. Lorenz, K.; Lal, R.; Ehlers, K. Soil organic carbon stock as an indicator for monitoring land and soil degradation in relation to United Nations’ Sustainable Development Goals. Land Degrad. Dev. 2019, 30, 824–838. [Google Scholar] [CrossRef]
  19. Alvares, C.A.; Stape, J.L.; Sentelhas, P.C.; De Moraes Gonçalves, J.L.; Sparovek, G. Köppen’s climate classification map for Brazil. Meteorol. Zeitschrift. 2013, 22, 711–728. [Google Scholar] [CrossRef]
  20. Ribeiro, R.A.; Giannini, T.C.; Gastauer, M.; Awade, M.; Siqueira, J.O. Topsoil application during the rehabilitation of a manganese tailing dam increases plant taxonomic, phylogenetic and functional diversity. J. Environ. Manag. 2018, 227, 386–394. [Google Scholar] [CrossRef]
  21. Gastauer, M.; Caldeira, C.F.; Ramos, S.J.; Silva, D.F.; Siqueira, J.O. Active rehabilitation of Amazonian sand mines converges soils, plant communities and environmental status to their predisturbance levels. Land Degrad. Dev. 2019, 31, 607–618. [Google Scholar] [CrossRef]
  22. Trindade, F.C.; Gastauer, M.; Ramos, S.J.; Caldeira, C.F.; Araújo, J.F.d.; Oliveira, G.; Valadares, R.B.d.S. Soil Metaproteomics as a Tool for Environmental Monitoring of Minelands. Forests 2021, 12, 1158. [Google Scholar] [CrossRef]
  23. Teixeira, P.C.; Donagemma, G.K.; Fontana, A.; Teixeira, W.G. Manual de Métodos de Análise de Solo, 3rd ed.; Revista e Ampliada Publisher: Embrapa Brasília, Brazil, 2017. [Google Scholar]
  24. Bouyoucos, G.J. The hydrometer as a new method for the mechanical analysis of soils. Soil Sci. 1927, 23, 343–354. [Google Scholar] [CrossRef]
  25. Benites, V.M.; Machado, P.L.O.A.; Fidalgo, E.C.C.; Coelho, M.R.; Madari, B.E. Pedotransfer functions for estimating soil bulk density from existing soil survey reports in Brazil. Geoderma 2007, 139, 90–97. [Google Scholar] [CrossRef]
  26. Briedis, C.; Sá, J.C.d.M.; De-Carli, R.S.; Antunes, E.A.P.; Simon, L.; Romko, M.L.; Elias, L.S.; Ferreira, A.d.O. Particulate soil organic carbon and stratification ratio increases in response to crop residue decomposition under no-till. Rev. Bras. Cienc. Solo 2012, 36, 1483–1490. [Google Scholar] [CrossRef] [Green Version]
  27. Vance, E.D.; Brookes, P.C.; Jenkinson, D.S. An extraction method for measuring soil microbial biomass C. Soil Biol. Biochem. 1987, 19, 703–707. [Google Scholar] [CrossRef]
  28. Jenkinson, D.S.; Powlson, D.S. The effects of biocidal treatments on metabolism in soil—V. Soil Biol. Biochem. 1976, 8, 209–213. [Google Scholar] [CrossRef]
  29. Anderson, T.H.; Domsch, K.H. The metabolic quotient for CO2 (qCO2) as a specific parameter to assess the effects of environmental conditions, such as pH, on the microbial biomass of forest soils. Soil Biol. Biochem. 1993, 25, 393–395. [Google Scholar] [CrossRef]
  30. Sparling, G.P. Ratio of microbial biomass carbon to soil organic carbon as a sensitive indicator of changes in soil organic matter. Aust. J. Soil Res. 1992, 30, 195–207. [Google Scholar] [CrossRef]
  31. Tabatabai, M.A.; Bremner, J.M. Assay of urease activity in soil. Soil Biol. Biochem. 1971, 4, 479–487. [Google Scholar] [CrossRef]
  32. Dick, R.P.; Breakwell, D.P.; Turco, R.F. Soil Enzyme Activities and Biodiversity Measurements as Integrative Microbiological Indicators. In Methods for Assessing Soil Quality, 1st ed.; Doran, J.W., Jones, A.J., Eds.; Soil Science Society of America: Madison, WI, USA, 1997; Volume 49, pp. 247–271. [Google Scholar]
  33. Rodríguez-Rodríguez, R.M.; Kemmelmeier, K.; Pedroso, D.d.F.; Pinto, F.A.; dos Santos, J.V.; Gastauer, M.; Caldeira, C.F.; Ramos, S.J.; Siqueira, J.O.; Carneiro, M.A.C. Native arbuscular mycorrhizal fungi respond to rehabilitation in iron ore mining areas from the Eastern Brazilian Amazon. Pedobiologia 2021, 89, 150768. [Google Scholar] [CrossRef]
  34. Rouse, J.W.; Haas, R.H.; Schell, J.A.; Deering, D.W. Monitoring Vegetation Systems in the Great Plains with ERTS. In Proceedings of the Third ERTS Symposium, Washington, DC, USA, 10–14 December 1973; Freden, S.C., Mercanti, E.P., Becker, M.A., Eds.; NASA: Washington, DC, USA, 1974. [Google Scholar]
  35. Jamalabad, M.S.; Abkar, A.A. Forest Canopy Density Monitoring, Using Satellite Images. In Proceedings of the 20th ISPRS Congress. International Society for Photogrammetry and Remote Sensing, Istanbul, Turkey, 12–23 July 2004; pp. 12–23. [Google Scholar]
  36. QGIS Development Team. QGIS Geographic Information System (Version 3.10). Open Source Geospatial Foundation Project. 2021. Available online: http://qgis.osgeo.org (accessed on 28 November 2020).
  37. R Development Core Team. R: A Language and Environment for Statistical Computing; (Version 3.6.2); R Foundation for Statistical Computing: Vienna, Austria, 2021; Available online: https://www.r-project.org/ (accessed on 28 November 2020).
  38. Freitas, D.A.F.; Silva, M.L.N.; Cardoso, E.L.; Curi, N. Índices de qualidade do solo sob diferentes sistemas de uso e manejo florestal e cerrado nativo adjacente. Rev. Ciênc. Agron. 2012, 43, 417–428. [Google Scholar] [CrossRef] [Green Version]
  39. Zuur, A.F.; Ieno, E.N.; Elphick, C.S. A protocol for data exploration to avoid common statistical problems. Methods Ecol. Evol. 2010, 1, 3–14. [Google Scholar] [CrossRef]
  40. Ferreira, E.B.; Cavalcanti, P.P.; Nogueira, D.A. ExpDes.pt: Pacote Experimental Designs (Portugues) 2021. R Package Version 1.2.1. Available online: https://CRAN.R-project.org/package=ExpDes.pt (accessed on 28 November 2020).
  41. Wickham, H. ggplot2—Elegant Graphics for Data Analysis, 2nd ed.; Springer International Publishing: Cham, Switzerland, 2016; p. 260. Available online: https://ggplot2.tidyverse.org (accessed on 28 November 2020).
  42. Harrell, F.E., Jr. With Contributions from Charles Dupont. Hmisc: Harrell Miscellaneous. 2021. R Package Version 4.5-0. Available online: https://CRAN.R-project.org/package=Hmisc (accessed on 28 November 2020).
  43. Wei, T.; Simko, V. R Package ‘Corrplot’: Visualization of a Correlation Matrix (Version 0.90). 2021. Available online: https://github.com/taiyun/corrplot (accessed on 28 November 2020).
  44. Wang, W.; Zhong, Z.; Wang, Q.; Wang, H.; Fu, Y.; He, X. Glomalin contributed more to carbon, nutrients in deeper soils, and differently associated with climates and soil properties in vertical profiles. Sci. Rep. 2017, 7, 13003. [Google Scholar] [CrossRef] [PubMed] [Green Version]
  45. Wright, S.F.; Upadhyaya, A.A. Survey of soils for aggregate stability and glomalin, a glycoprotein produced by hyphae of arbuscular mycorrhizal fungi. Plant Soil 1998, 198, 97–107. [Google Scholar] [CrossRef]
  46. Zipper, C.; Burger, J.; Barton, C.; Skousen, J. Rebuilding soils for forest restoration on Appalachian mined lands. Soil Sci. Soc. Am. J. 2013, 77, 337–349. [Google Scholar] [CrossRef] [Green Version]
  47. Wang, Z.; Wang, G.; Ren, T.; Wang, H.; Xu, Q.; Zhang, G. Assessment of soil fertility degradation affected by mining disturbance and land use in a coalfield via machine learning. Ecol. Indic. 2021, 125, 107608. [Google Scholar] [CrossRef]
  48. Madasa, A.; Orimoloye, I.R.; Ololade, O.O. Application of Geospatial Indices for Mapping Land Cover/Use Change Detection in a Mining Area. J. Afr. Earth Sci. 2021, 175, 104108. [Google Scholar] [CrossRef]
  49. Padilha, M.C.D.C.; Vicente, L.E.; Demattê, J.A.; Loebmann, D.G.D.S.W.; Vicente, A.K.; Salazar, D.F.; Guimarães, C.C.B. Using Landsat and soil clay content to map soil organic carbon of oxisols and Ultisols near São Paulo, Brazil. Geoderma Reg. 2020, 21, e00253. [Google Scholar] [CrossRef]
  50. Xue, J.R.; Su, B.F. Significant remote sensing vegetation indices: A review of developments and applications. J. Sens. 2017, 2017, 2101353691. [Google Scholar] [CrossRef] [Green Version]
  51. Diek, S.; Fornallaz, F.; Schaepman, M.E.; De Jong, R. Barest pixel composite for agricultural areas using landsat time series. Remote Sens. 2017, 9, 1245. [Google Scholar] [CrossRef] [Green Version]
  52. Paz-Kagan, T.; Shacha, M.; Zaady, E.; Karnieli, A. A spectral soil quality index (SSQI) for characterizing soil function in areas of changed land use. Geoderma 2014, 230, 171–184. [Google Scholar] [CrossRef]
  53. Franzluebbers, A.J. Soil organic matter stratification ratio as an indicator of soil quality. Soil Tillage Res. 2002, 66, 95–106. [Google Scholar] [CrossRef]
  54. Zuber, S.M.; Behnke, G.D.; Nafziger, E.D.; Villamil, M.B. Multivariate assessment of soil quality indicators for crop rotation and tillage in Illinois. Soil Tillage Res. 2016, 174, 147–155. [Google Scholar] [CrossRef]
  55. Guo, S.; Han, X.; Li, H.; Wang, T.; Tong, X.; Ren, G.; Feng, Y.; Yang, G. Evaluation of soil quality along two revegetation chronosequences on the Loess Hilly Region of China. Sci. Total. Environ. 2018, 633, 808–815. [Google Scholar] [CrossRef]
  56. Paul, G.C.; Saha, S.; Ghosh, K.G. Assessing the soil quality of Bansloi river basin, eastern India using soil-quality indices (SQIs) and random forest machine learning technique. Ecol. Indic. 2020, 118, 106804. [Google Scholar] [CrossRef]
  57. Srivastava, P.; Singh, R.; Bhadouria, R.; Tripathi, S.; Raghubanshi, A.S. Temporal change in soil physicochemical, microbial, aggregate and available C characteristic in dry tropical ecosystem. Catena 2020, 190, 104553. [Google Scholar] [CrossRef]
  58. Anderson, T.H. Physiological Analysis of Microbial Communities in Soil: Applications and limitations. In Beyond the Biomass—Compositional and Functional Analysis of Soil Microbial Communities; Rittz, K., Dighton, J., Giller, K.E., Eds.; John Wiley & Sons: Chichester, UK, 1994; pp. 67–76. [Google Scholar]
  59. Jacinthe, P.A.; Lal, R. Carbon storage and minesoil properties in relation to topsoil application techniques. Soil Sci. Soc. Am. J. 2007, 71, 1788–1795. [Google Scholar] [CrossRef]
  60. Lewis, T.; Verstraten, L.; Hogg, B.; Wehr, B.J.; Swift, S.; Tindale, N.; Menzies, N.W.; Dalal, R.C.; Bryant, P.; Francis, B.; et al. Reforestation of agricultural land in the tropics: The relative contribution of soil, living biomass and debris pools to carbon sequestration. Sci. Total Environ. 2019, 649, 1502–1513. [Google Scholar] [CrossRef] [PubMed] [Green Version]
  61. Wang, Y.; Weng, B.; Tian, N.; Zhong, Z.; Wang, M. Soil organic carbon stocks of citrus orchards in Yongchun county, Fujian province, China. Pedosphere 2017, 27, 985–990. [Google Scholar] [CrossRef]
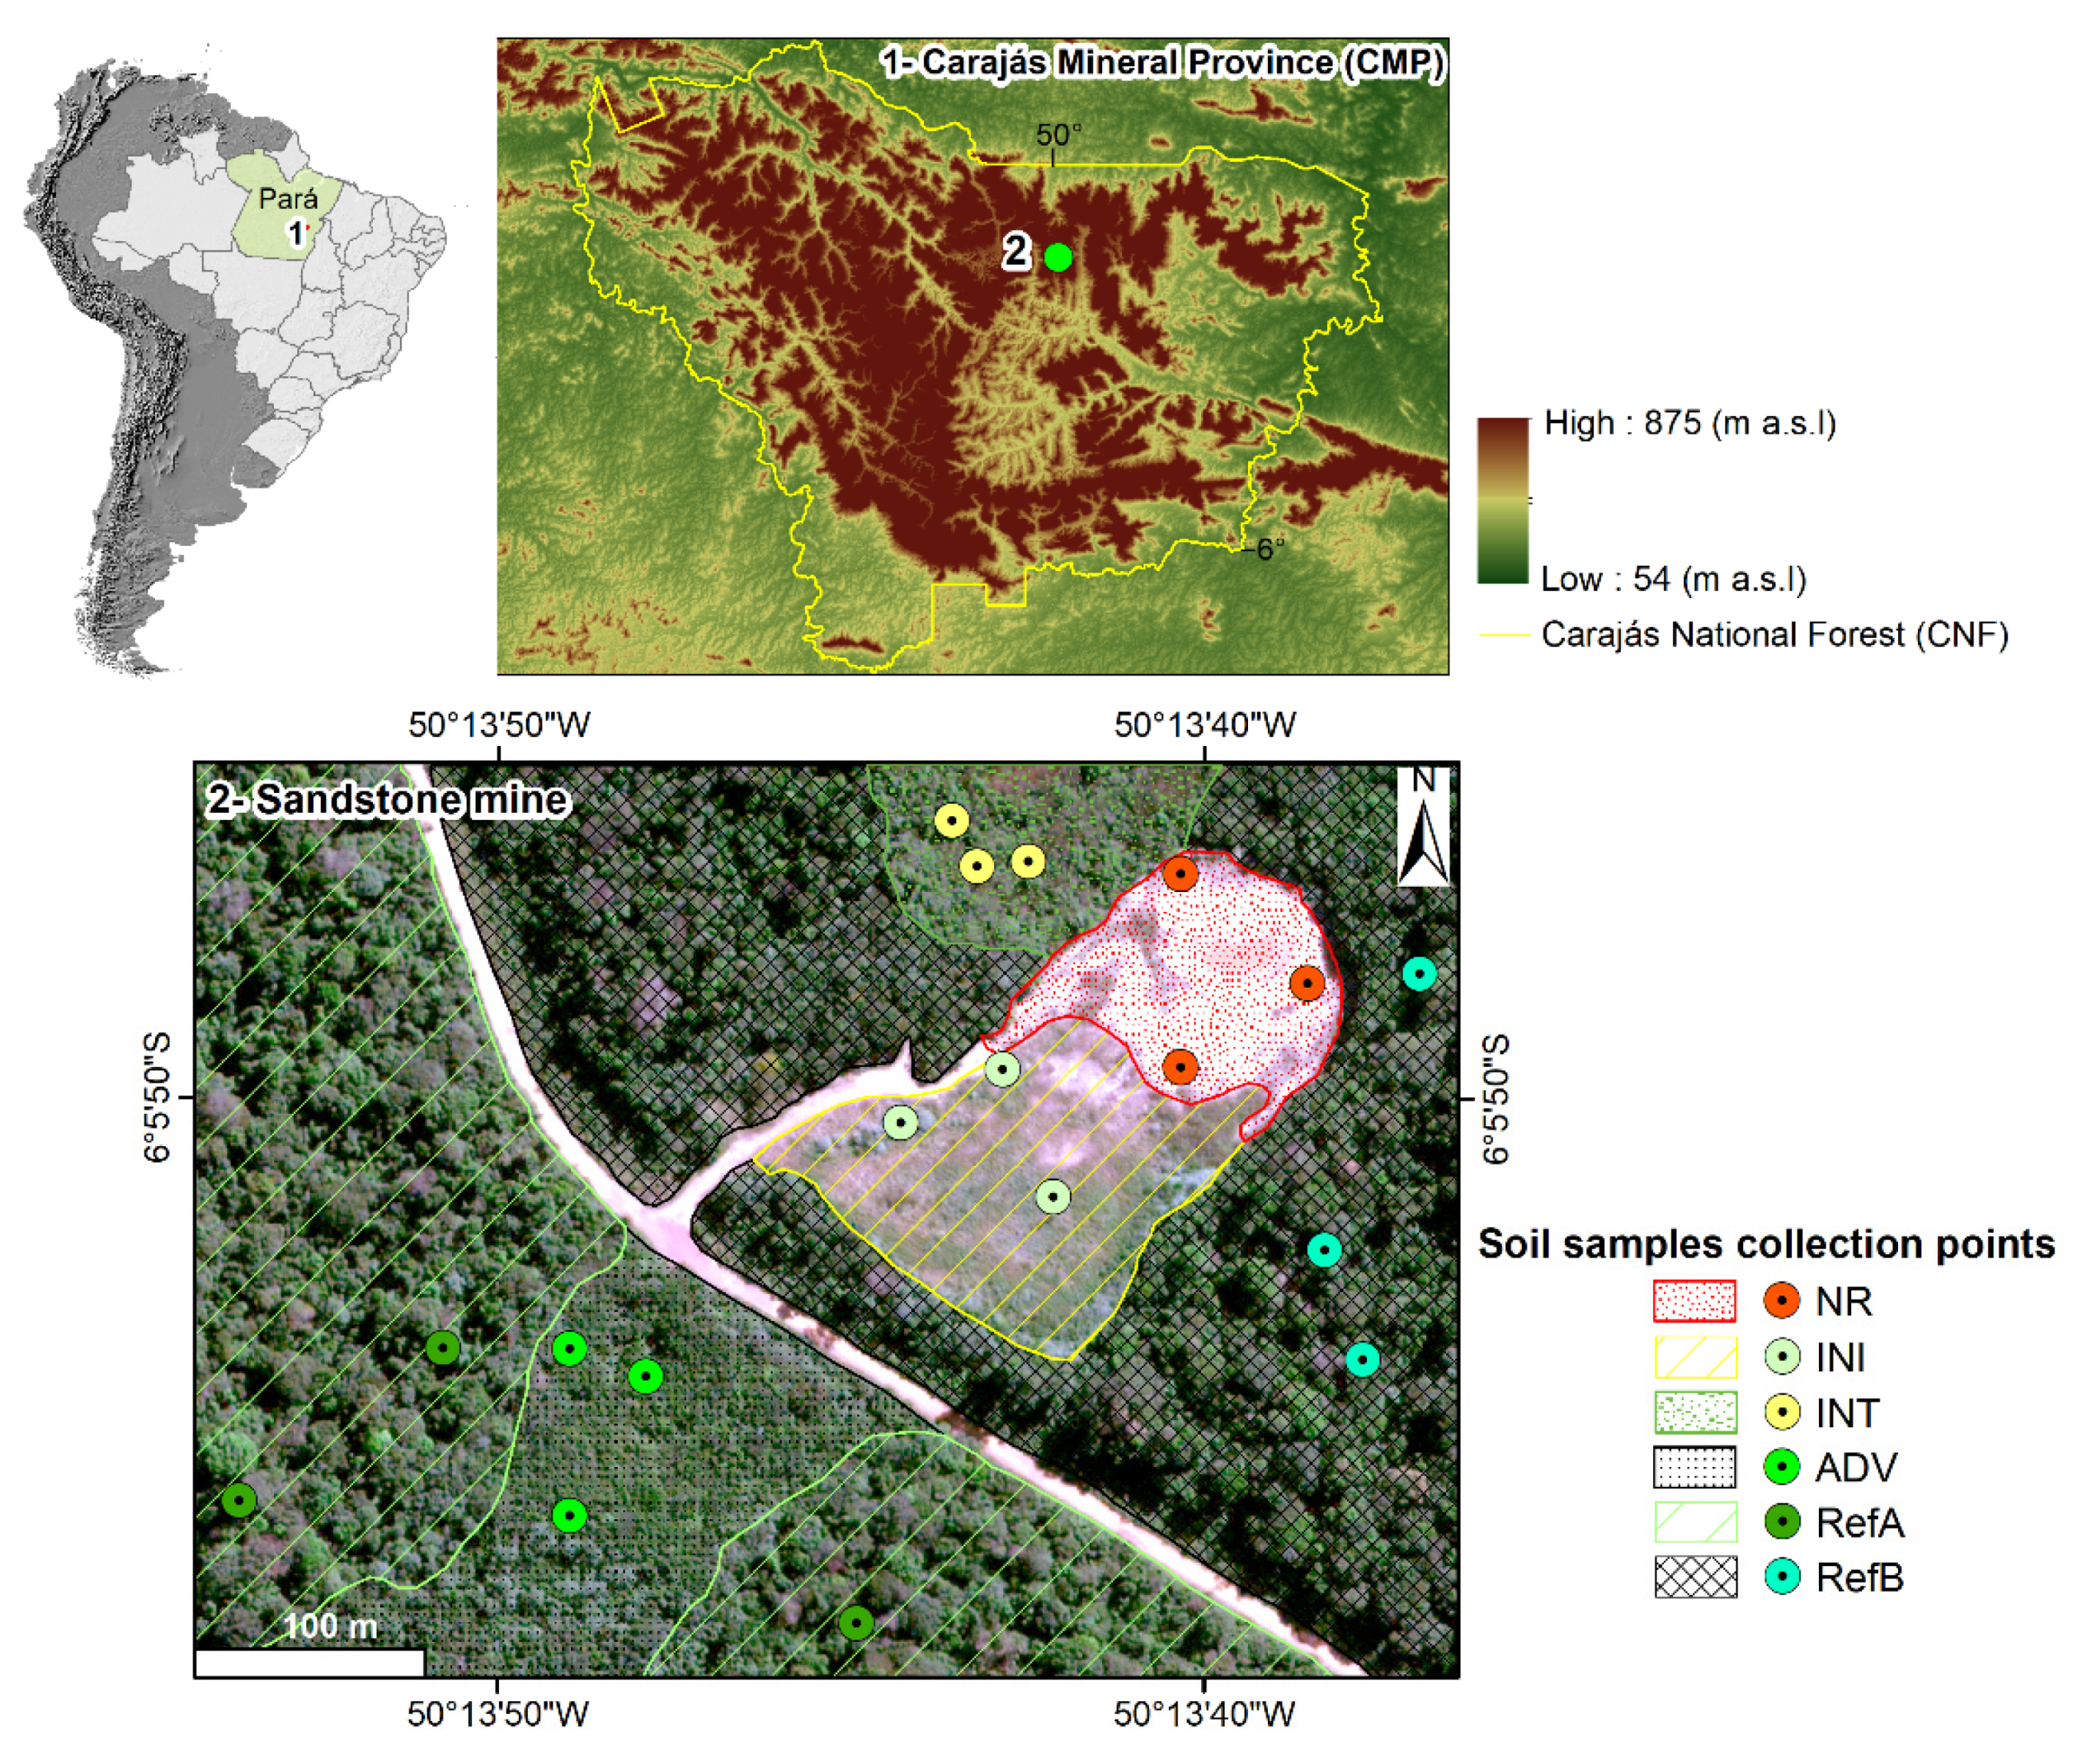
Figure 1. Different chronosequences of environmental rehabilitation in an Amazonian sandstone mine in Carajás Mineral Province (CMP), state of Pará, Brazil. NR = non-rehabilitated; INI = initial; INT = intermediate; ADV = advanced; RefA and RefB = reference forest. Source: Google Earth images.
Sustainability 14 00597 g001
Figure 2. Soil organic carbon stock in chronosequences and reference forests. Different letters for each soil attribute indicate significant differences between means according to post hoc Tukey´ HSD test (p ≤ 0.05). NR = non-rehabilitated; Ini = initial; Int = intermediate; Adv = advanced; RefA and RefB = reference forest.
Sustainability 14 00597 g002
Figure 3. True-color composite (RGB = 5, 3, and 2 bands) imagery of WorldView-2, Normalized Difference Vegetation Index (NDVI), and Bare Soil Index (BSI) for the sandstone mine in the Carajás Mineral Province. Low and high values of NDVI indicate exposed soil and vegetation, respectively. The opposite is observed for BSI. Tree shadows interference is showed in white color.
Sustainability 14 00597 g003
Figure 4. Relationship between SOC stock and NDVI (a) and BSI (b) and between the estimated SOC stock by NDVI (c) and BSI (d) and measured SOC stock. All p-levels for the linear relationships were <0.001.
Sustainability 14 00597 g004
Figure 5. Digital soil organic carbon stock map of the study area based on NDVI (left map) and BSI (right map). Tree shadows interference is showed in white color.
Sustainability 14 00597 g005
Figure 6. Soil quality index (SQI) for different chronosequences. Different letters indicate significant differences between means according to post hoc Tukey´ HSD test (p ≤ 0.05). NR = non-rehabilitated; Ini = initial; Int = intermediate; Adv = advanced; RefA and Ref B = reference forest.
Sustainability 14 00597 g006
Figure 7. Pearson correlation between indices and soil attributes from sandstone mine in Carajás Province. Only the significant correlations are shown (p < 0.05). MBC = microbial biomass carbon; MBR = microbial basal respiration, qCO2= metabolic coefficient, qMic = microbial coefficient, EEG = extractable glomaline, TG = total glomaline, MC = mycorrhizal colonization, FDA = fluorescein diacetate analysis; ACP = acid phosphatase, SOC = soil organic carbon, CEC = cation exchange capacity, SB = sum of bases, NDVI = Normalized Difference Vegetation Index, BSI = Bare Soil Index.
Sustainability 14 00597 g007
Table 1. Indicator weights in the principal components of the soil attributes.
VariablesPC1PC2PC3PC4PC5
Eigenvalue12.38745.71973.66942.08941.94200
Proportion Explained0.39960.18450.11840.06740.06265
Cumulative Proportion0.39960.58410.70250.76990.83251
MBC−0.65313−0.16213−0.1570170.22987−0.111846
MBR−0.43884−0.19344−0.4279530.29269−0.091320
qCO20.62793−0.12045−0.0787340.160650.036212
FDA−0.605590.176460.088920−0.14935−0.106586
ACP−0.720540.06431−0.131962−0.02218−0.304460
Urease−0.514210.401840.1151490.276740.113851
SOC−0.79587−0.06548−0.005126−0.22220−0.024674
qMic0.20860−0.01069−0.2012640.41911−0.285524
EEG0.73553−0.106460.143522−0.026040.143804
TG−0.67227−0.086700.2560330.348120.087060
MC−0.609020.479160.111600−0.100430.179749
Spore density−0.482880.341690.456930−0.02978−0.124345
pH0.588550.177410.112644−0.30481−0.210531
SOM0.79587−0.06548−0.005126−0.22220−0.024674
P0.16489−0.064530.7597650.11801−0.186024
K0.58224−0.23642−0.031998−0.196490.484994
S0.41775−0.23191−0.111371−0.067350.631474
Ca0.049830.739910.2818270.01261−0.006268
Mg−0.36948−0.580080.411408−0.038530.087366
Al−0.570510.50968−0.1926420.165580.118559
CEC0.75745−0.334790.0994780.059250.068868
B−0.64641−0.48318−0.2083230.069790.115216
Zn−0.12725−0.122260.7798260.03169−0.110145
Fe−0.36949−0.03414−0.567148−0.36857−0.168348
Mn0.11565−0.39534−0.033075−0.60873−0.290828
Cu0.66819−0.16544−0.0563410.28560−0.308134
Clay−0.55831−0.51766−0.2164290.096870.145571
Silt0.27642−0.67899−0.1917940.06242−0.366750
Sand0.398440.667420.249704−0.10430−0.009997
SB0.06702−0.758700.303340−0.026230.084294
SOC stock0.771390.048270.047942−0.27408−0.067842
Boldface values are highly weighted in the same PC; Boldface-underlined factors are included in the index. PC = Principal Component, MBC = microbial biomass carbon, SOC = soil organic carbon, CEC = cation exchange capacity, MBR = microbial basal respiration, qCO2 = metabolic coefficient, qMic = microbial coefficient, EEG = extractable glomaline, TG = total glomaline, MC = mycorrhizal colonization, SOM = soil organic matter, FDA = fluorescein diacetate analysis, ACP = acid phosphatase, SB = sum of bases.
Publisher’s Note: MDPI stays neutral with regard to jurisdictional claims in published maps and institutional affiliations.