Article

Sustainability at Auburn University: Assessing Rooftop Solar Energy Potential for Electricity Generation with Remote Sensing and GIS in a Southern US Campus

School of Forestry and Wildlife Sciences, Auburn University, Auburn, AL 36849, USA
*
Author to whom correspondence should be addressed.
Sustainability 2022, 14(2), 626; https://doi.org/10.3390/su14020626
Submission received: 3 December 2021 / Revised: 1 January 2022 / Accepted: 4 January 2022 / Published: 6 January 2022

Abstract

:
Achieving sustainability through solar energy has become an increasingly accessible option in the United States (US). Nationwide, universities are at the forefront of energy efficiency and renewable generation goals. The aim of this study was to determine the suitability for the installation of photovoltaic (PV) systems based on their solar potential and corresponding electricity generation potential on a southern US university campus. Using Auburn University located in the southern US as a case study, freely available geospatial data were utilized, and geographic information system (GIS) approaches were applied to characterize solar potential across the 1875-acre campus. Airborne light detection and ranging (lidar) point clouds were processed to extract a digital surface model (DSM), from which slope and aspect were derived. The area and total solar radiation of campus buildings were calculated, and suitable buildings were then determined based on slope, aspect, and total solar radiation. Results highlighted that of 443 buildings, 323 were fit for solar arrays, and these selected rooftops can produce 27,068,555 kWh annually. This study demonstrated that Auburn University could benefit from rooftop solar arrays, and the proposed arrays would account for approximately 21.07% of annual electricity requirement by buildings, equivalent to 14.43% of total campus electricity for all operations. Given increasing open and free access to high-resolution lidar data across the US, methods from this study are adaptable to institutions nationwide, for the development of a comprehensive assessment of solar potential, toward meeting campus energy goals.

1. Introduction

Following the United States (US) rejoining of the Paris Climate Agreement on 19 February 2021, sustainability is at the forefront of consideration in decision making [1]. Renewable energy has become an increasingly accessible option for developers throughout the United States. The cost of solar energy has decreased 43% in the past 5 years, with the prices of installation and array production projected to continue to decrease in the following years [2]. In the first fiscal quarter of 2021, solar comprised 58% of all new generating capacity with 102.8 gigawatts of solar currently installed in the US [3]. Higher education institutions across the US alone represent about 5 billion square feet in terms of floor space and incur over USD 6 billion on energy costs [4]. These institutions are considered leaders in setting energy goals [5] and strategies to improve energy efficiency, translate to both cost savings and reduction in emissions. The number of university campuses committing to such goals has increased in recent years, with practices such as zero-energy buildings that are designed to optimize the installation of rooftop solar photovoltaic (PV) systems to maximize solar potential [4]. Photovoltaic (PV) systems on rooftops are a sustainable option to passively produce energy in spaces that are otherwise unoccupied. Rooftops are the most suitable part of urban buildings for converting solar energy to renewable energy used for heating or electricity [6]. Such PV systems have the potential to reduce energy losses from transmission and distribution [7].
The state of Alabama (AL), located in the southern US, receives an estimated 2641 total hours of average annual sunshine [8]. In a 2004 NOAA ranking of 174 cities based on percent annual possible sunshine, a city 111 miles north of the campus study site—Birmingham, AL—ranked 97th [9]. Despite being in a conducive climate for solar energy generation, the state of Alabama ranks 35th in solar nationally and falls behind the national average, with only 0.27% of the state’s electricity generated from solar energy [2]. This can be attributed to the fact that Alabama is the second-largest producer of hydroelectric power, compared with other states, and the 12th largest producer of coal [2]. One alternative to hydroelectric and coal power that could be examined is solar power. In the southern US, among higher education institutions committed to sustainability through ways that include climate action plans is Auburn University [10]. Auburn University joined the American College and University Presidents’ Climate Commitment (ACUPCC) in 2008 and has established near-term emission targets, along with a 2050 carbon neutrality goal in place [10]. Building-related energy accounts for a majority of the university’s carbon footprint, and among the strategies that serve to meet a near-term target of a 10% reduction from a 2008 baseline is the development of renewable energy. Auburn University has two arrays currently installed on campus, producing approximately 9000 kWh per year, according to the institution’s Department of Energy Management. In an estimation from the Auburn University Office of Sustainability, the total campus currently consumes about 190,000,000 kWh annually. In comparison, the installed campus solar arrays account for only 0.0047% of this power. The main energy provider for Auburn University is Alabama Power, which relies predominantly on fossil fuels for electricity generation. Auburn University has grown substantially since 2017, with increasing enrollment, total buildings on campus, and electricity use [11].
As part of the effort to incentivize the growth of renewable energy toward sustainability goals, studies that continue to expand the accessibility of solar energy are beneficial. At the same time, to estimate the potential of this renewable energy source and better understand its contributions in meeting campus energy goals, a quantitative assessment and modeling of electricity production are needed. In this study, a campus-wide assessment of the potential of rooftop-installed PV systems was estimated. This work integrates rooftop suitability analyses, electricity generation potential, and financial assessment, representing the first of its kind for the campus. Additionally, this study serves to highlight the application of methods that can readily be adapted for other US campuses, toward attaining sustainable energy goals. Here, a geographic information system (GIS)-based method and 3D modeling from light detection and ranging (lidar) data were used to calculate rooftop suitability and subsequently determine PV electricity generation.
Observations from airborne lidar sensors provide detailed three-dimensional representations of features, a requirement for solar models [12]. To exemplify, lidar-derived raster surfaces such as digital surface models (DSMs) are used for the extraction of rooftops and for determining solar PV potential at multiple spatial scales [13]. Moreover, the estimation of rooftop solar PV by combining GIS-based methods with lidar is regarded as a feasible approach to obtaining accurate assessments of solar potential [13]. With the capability to facilitate solar energy assessments, improve the accuracy of estimates, and increasingly free access to airborne lidar data, this data source is expected to continue to be leveraged for rooftop solar PV assessments [13,14].
GIS-based methods have been widely employed for assessing rooftop PV suitability in urban [13] or residential areas, and although fewer studies focus on US university campuses, the feasibility of this technique over broad spatial scales is well demonstrated. For instance, a recent study in Slovakia focused on predicting solar potential with lidar, using 3D modeling methods over a sample of 194 buildings to provide estimates of family houses in residential areas [15]. Of the 35 family houses in the area, it was estimated that 94% met their criteria for rooftop PV installation [15]. In a study in Lethbridge, Canada, a similar lidar resolution and processing approach was used to study the solar potential of an urban area but determined suitable and non-suitable segments of building roofs, as opposed to considering the whole roof suitable [16]. Researchers found that rooftop solar panels could account for almost 38% of Lethbridge’s electricity demands [16]. In another recent study, a feasibility analysis of solar PV and wind systems for a campus located in the same town, the University of Lethbridge, was explored [17]. Authors used lidar and aerial imagery for solar PV assessments and highlighted over 1 million square meters of suitable area for installing PV systems, to produce nearly three times the institution’s electricity usage. Researchers in this study highlighted the potential of installing renewable systems in meeting sustainable energy goals [17].
Noteworthy is that, in contrast to residential studies, a campus-wide assessment is applied to an area managed by one entity. Thus, a proposed installation, in this case, would be easy to implement in a uniform manner across the study area without variability of efficiency or installation methods across different homeowners. At the same time, given their sheer physical size as indicated earlier, population, operations, and infrastructure, university campuses may be equivalent to small-to-medium towns [18]. Given these factors, as well as critical roles in education and research, universities are key players toward sustainable development [19]. Not only do the installation of renewable systems such as solar PV contribute to universities’ energy goals, but energy-related actions provide learning opportunities in the classroom, may promote research that contributes to sustainable development goals, and can create pathways to careers for sustainability [19,20].
In the US, increasing volumes of free and open access to airborne lidar data and high-resolution aerial imagery (1 m) present exceptional opportunities to assess the ability of solar PV in meeting electricity demands. The integration of these data with GIS-based methods represents a robust approach for large-scale analyses, including campus-wide assessments [21]. As more higher education institutions transition to renewable energy, such assessments are necessary for providing information to support decision-making efforts for achieving sustainability goals. The primary goal of this study was to determine the suitability for the installation of rooftop PV systems and corresponding electricity generation potential on a U.S. university campus, choosing a campus in southern Alabama as a case study. As campuses such as this one continue to grow, their carbon footprint and energy demand will also continue to increase. Thus, this study provides a beneficial analysis for the university both concerning finances and sustainability. The major contributions of this study are (1) identification of suitable rooftops for installing rooftop PV systems across campus using GIS-based methods with freely available remote sensing data, (2) determination of electricity generation potential and comparison with university energy consumption using actual data, and (3) financial assessment of proposed PV system installation. Given the climate action plans developed by many US universities, assessments of potential renewable energy sources, particularly cost-effective solutions such as rooftop solar PV systems, are relevant. By using similar data, this study can be replicated in any area with high-resolution lidar data. Furthermore, given near-future nationwide coverage of lidar data and high-resolution (1 m) aerial imagery, methods used in this study could be adapted across other campuses toward the development of a comprehensive estimate on solar energy potential from rooftop solar PV systems.

2. Materials and Methods

2.1. Study Area

The study area, Auburn University in Auburn, AL, is a land-grant institution in the southern US, with a total student enrollment of 31,526 in 2021 [11]. It is located at the fault line of two distinct ecological regions: the Southeastern Plains and the Piedmont [22]. The northern portion of the city of Auburn is best classified as part of the Southern Outer Piedmont, a subset of the Piedmont ecological region [22]. The Southern Outer Piedmont region has lower elevation and lower levels of annual precipitation [22]. The southern boundary of Auburn occurs at the fall line, where coastal plain sediments, remnants of the ancient coastline, are deposited over the Piedmont [22]. The Fall Line Hills, the subset of the Southeastern Plains that describes the city of Auburn’s southern boundary, is a forested terrain with more relief and ground sloping [22].
Although the gently sloping hills of the region are described as mainly forested throughout history, the study area is currently a predominantly urban area. Auburn University’s campus is well established, with many large buildings, athletic complexes, roads, and other impervious surfaces. The 1875-acre campus includes 443 building footprints that were assessed for rooftop solar production suitability (Figure 1).
The land-grant university is a prime combination of climatic solar inclination and advantageous urban surfaces. Shown here with supervised maximum likelihood classification completed for visual interpretation, the study area is predominately urban, while the surrounding areas are vegetated (Figure 1).
The numerous large, flat buildings with little shade by high vegetation or other surrounding buildings combined with ample sunshine hours optimizes the solar potential of area rooftops. While NOAA has not published data for Auburn, AL, a nearby city, Montgomery, AL, receives only 107 annual precipitation days [9]. Several factors such as few precipitation days, the latitude of Auburn, and its campus design make it a beneficial study area to consider for rooftop solar development.

2.2. Data

This study employed a combination of spatial analysis utilizing lidar data and imagery from the US Department of Agriculture (USDA) Farm Service Agency’s National Agricultural Imagery Program (NAIP), with an adaptable framework implemented in ArcGIS Pro by Esri. The NAIP digital orthophoto used was acquired in October 2017 with a Leica ADS-100 digital sensor [23]. The ADS 100 collected multispectral 4-band data at 1 m spatial resolution in the following wavelength ranges: red (619–651 nm), green (525–585 nm), blue (435–495 nm), and near-infrared (808–882 nm) [23]. The radiometric resolution of the image is 8 bits, with values ranging from 0 to 255 [23]. It was published by the USDA Aerial Photography Field Office in October 2018 [23].
The lidar data, provided by the City of Auburn, Alabama, were extracted from a county-level dataset for Lee County, AL. The data were acquired in 2017 with a Leica ALS80 airborne lidar system [24]. The dataset provided an average of 2.5 points per m2 and an average distance between points of 0.60 m [24]. This point cloud is consistent with US Geological Survey’s 3D Elevation Program (3DEP) quality level 2 (QL2), which requires an aggregate nominal pulse spacing of less than or equal to 0.71 m and an aggregate nominal pulse density less than or equal to 2.0 pulses per square meter [25]. The dataset was provided as a classified point cloud in LAS version 1.4 format, with State Plane Coordinate System (SPCS) Alabama east zone projection with North American Datum of 1983 (NAD83(2011)) horizontal datum and North American Vertical Datum of 1988 (NAVD88(GEOID12A)) in survey units of US feet [24].
The methodology implemented in the study used a classified lidar point cloud to create a DSM and DTM. Then, after extracting a hillshade raster, various ArcGIS Pro tools were utilized to create a solar radiation raster, a slope raster, and an aspect raster. Once verified with NAIP imagery, the raster data were clipped within the building footprints and analyzed for suitability of roofs for PV system installation (Figure 2). Maps were generated using ArcGIS software by Esri.

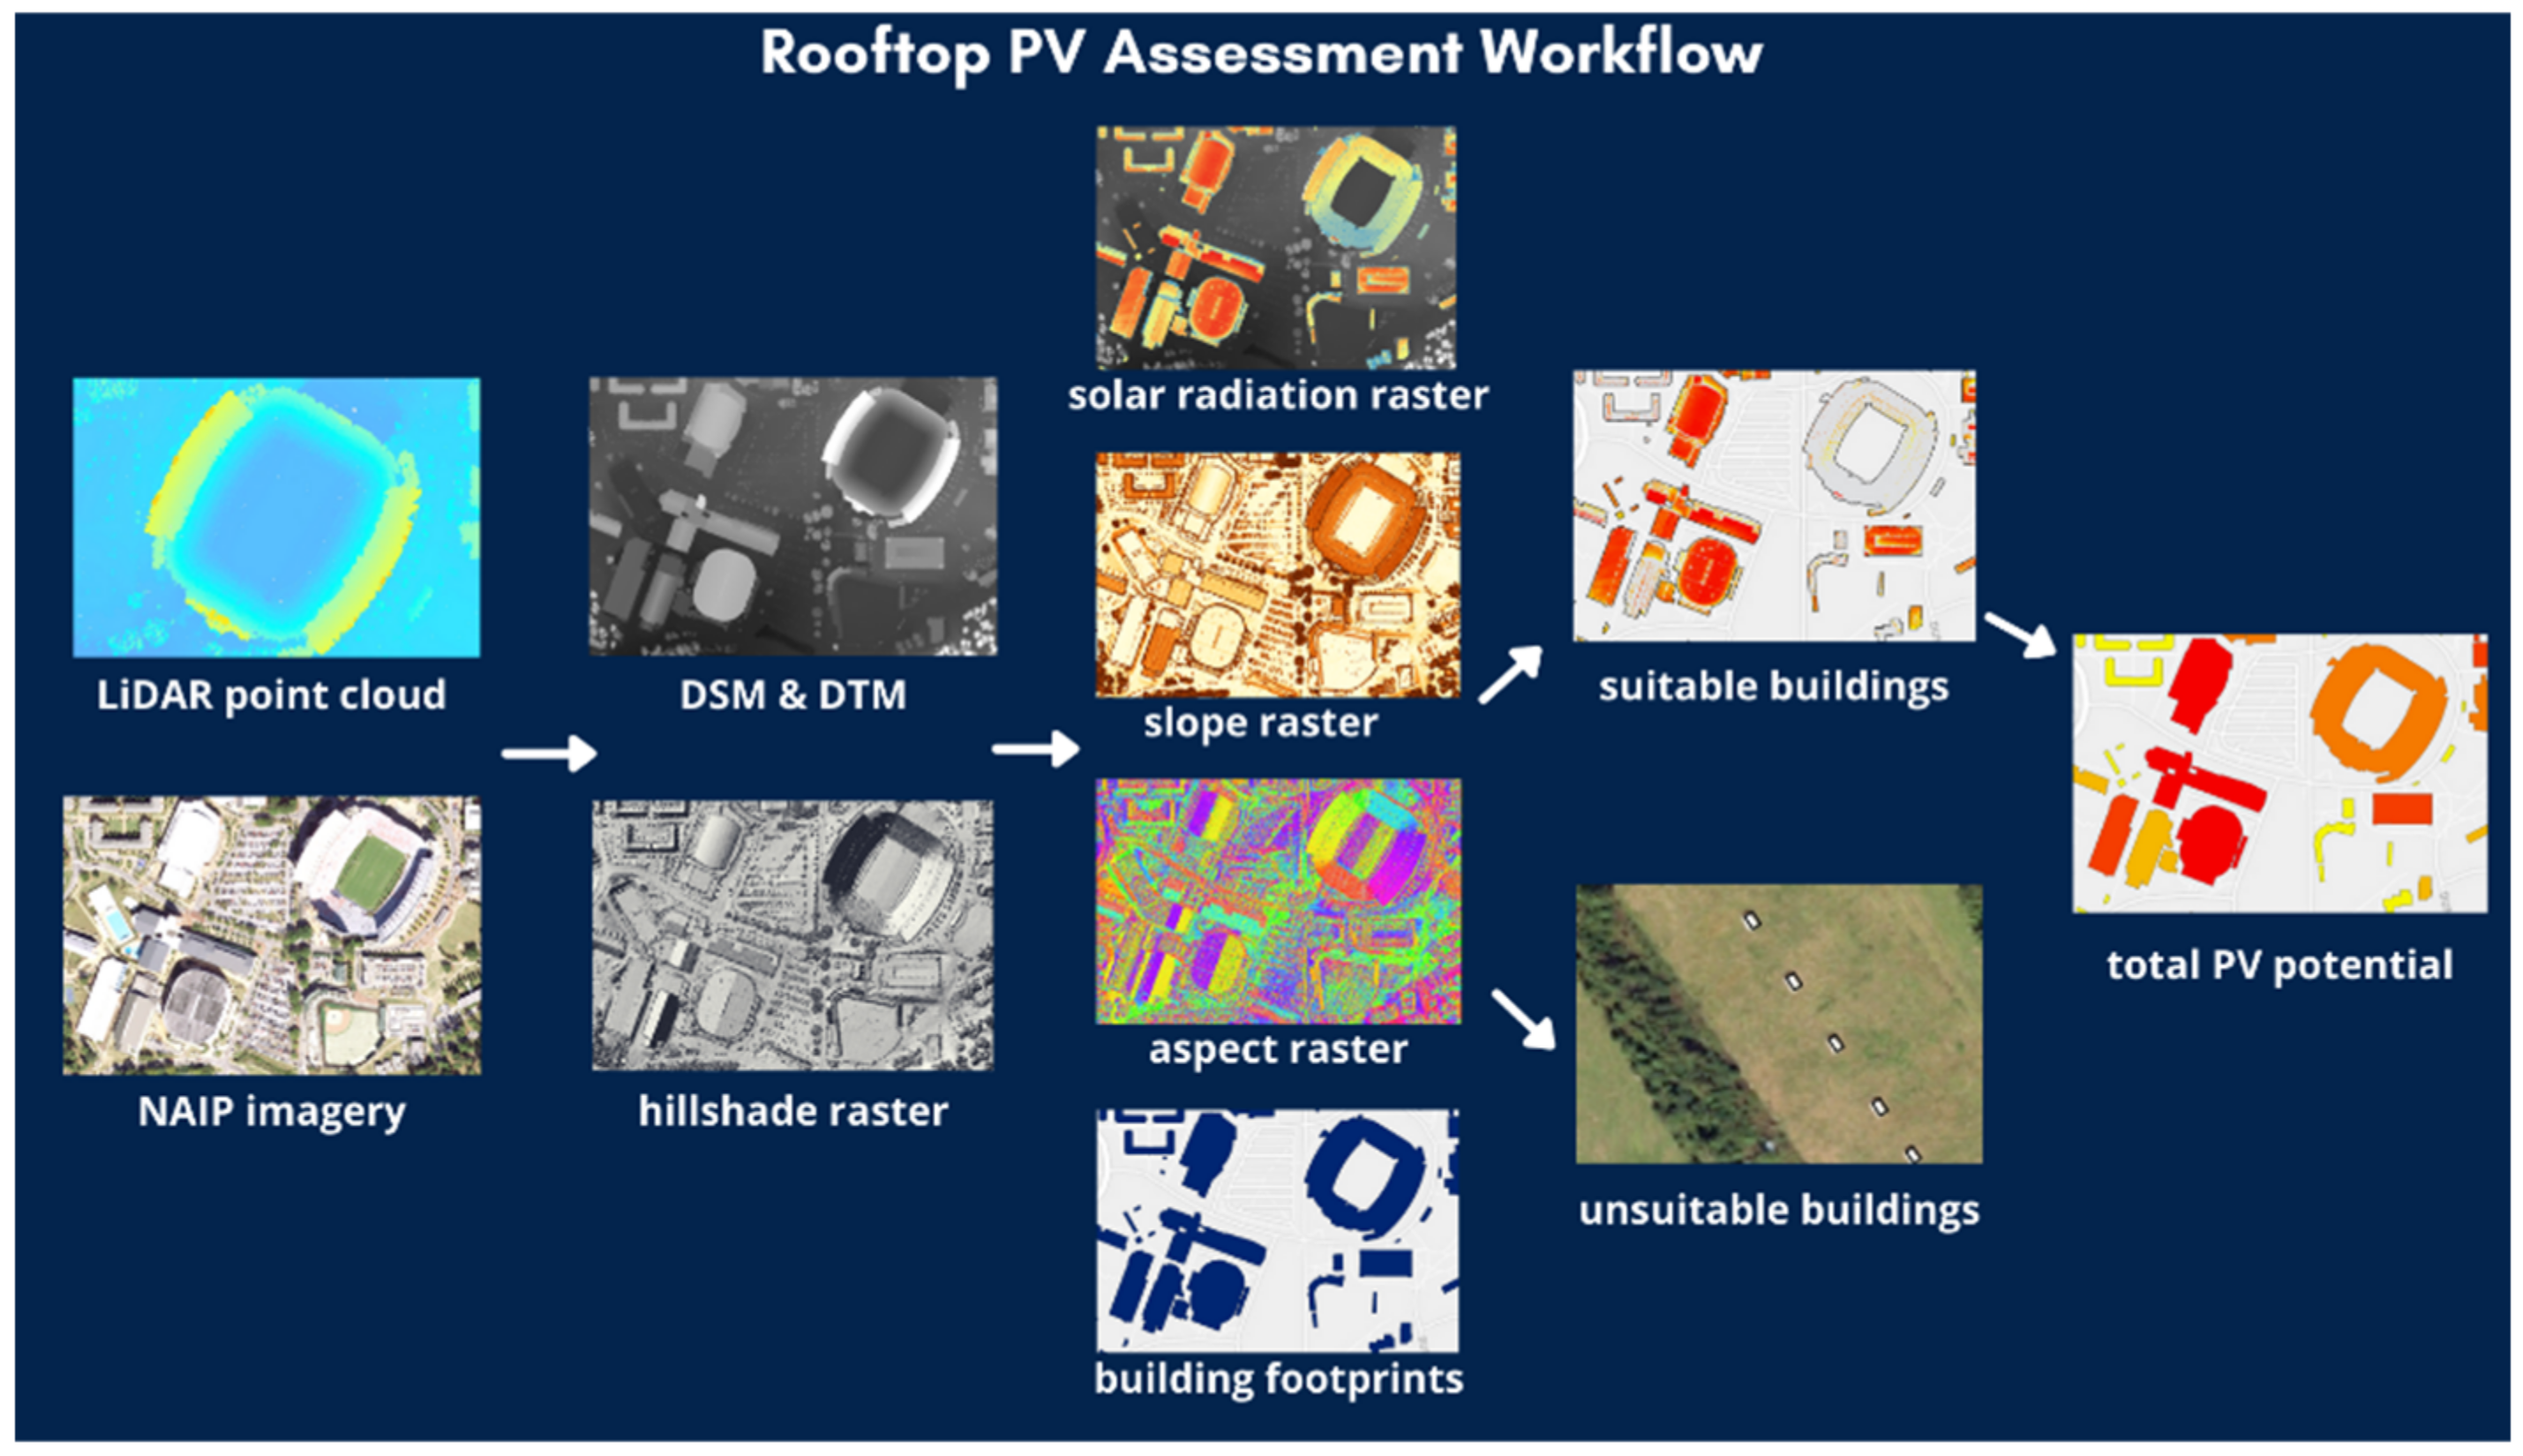
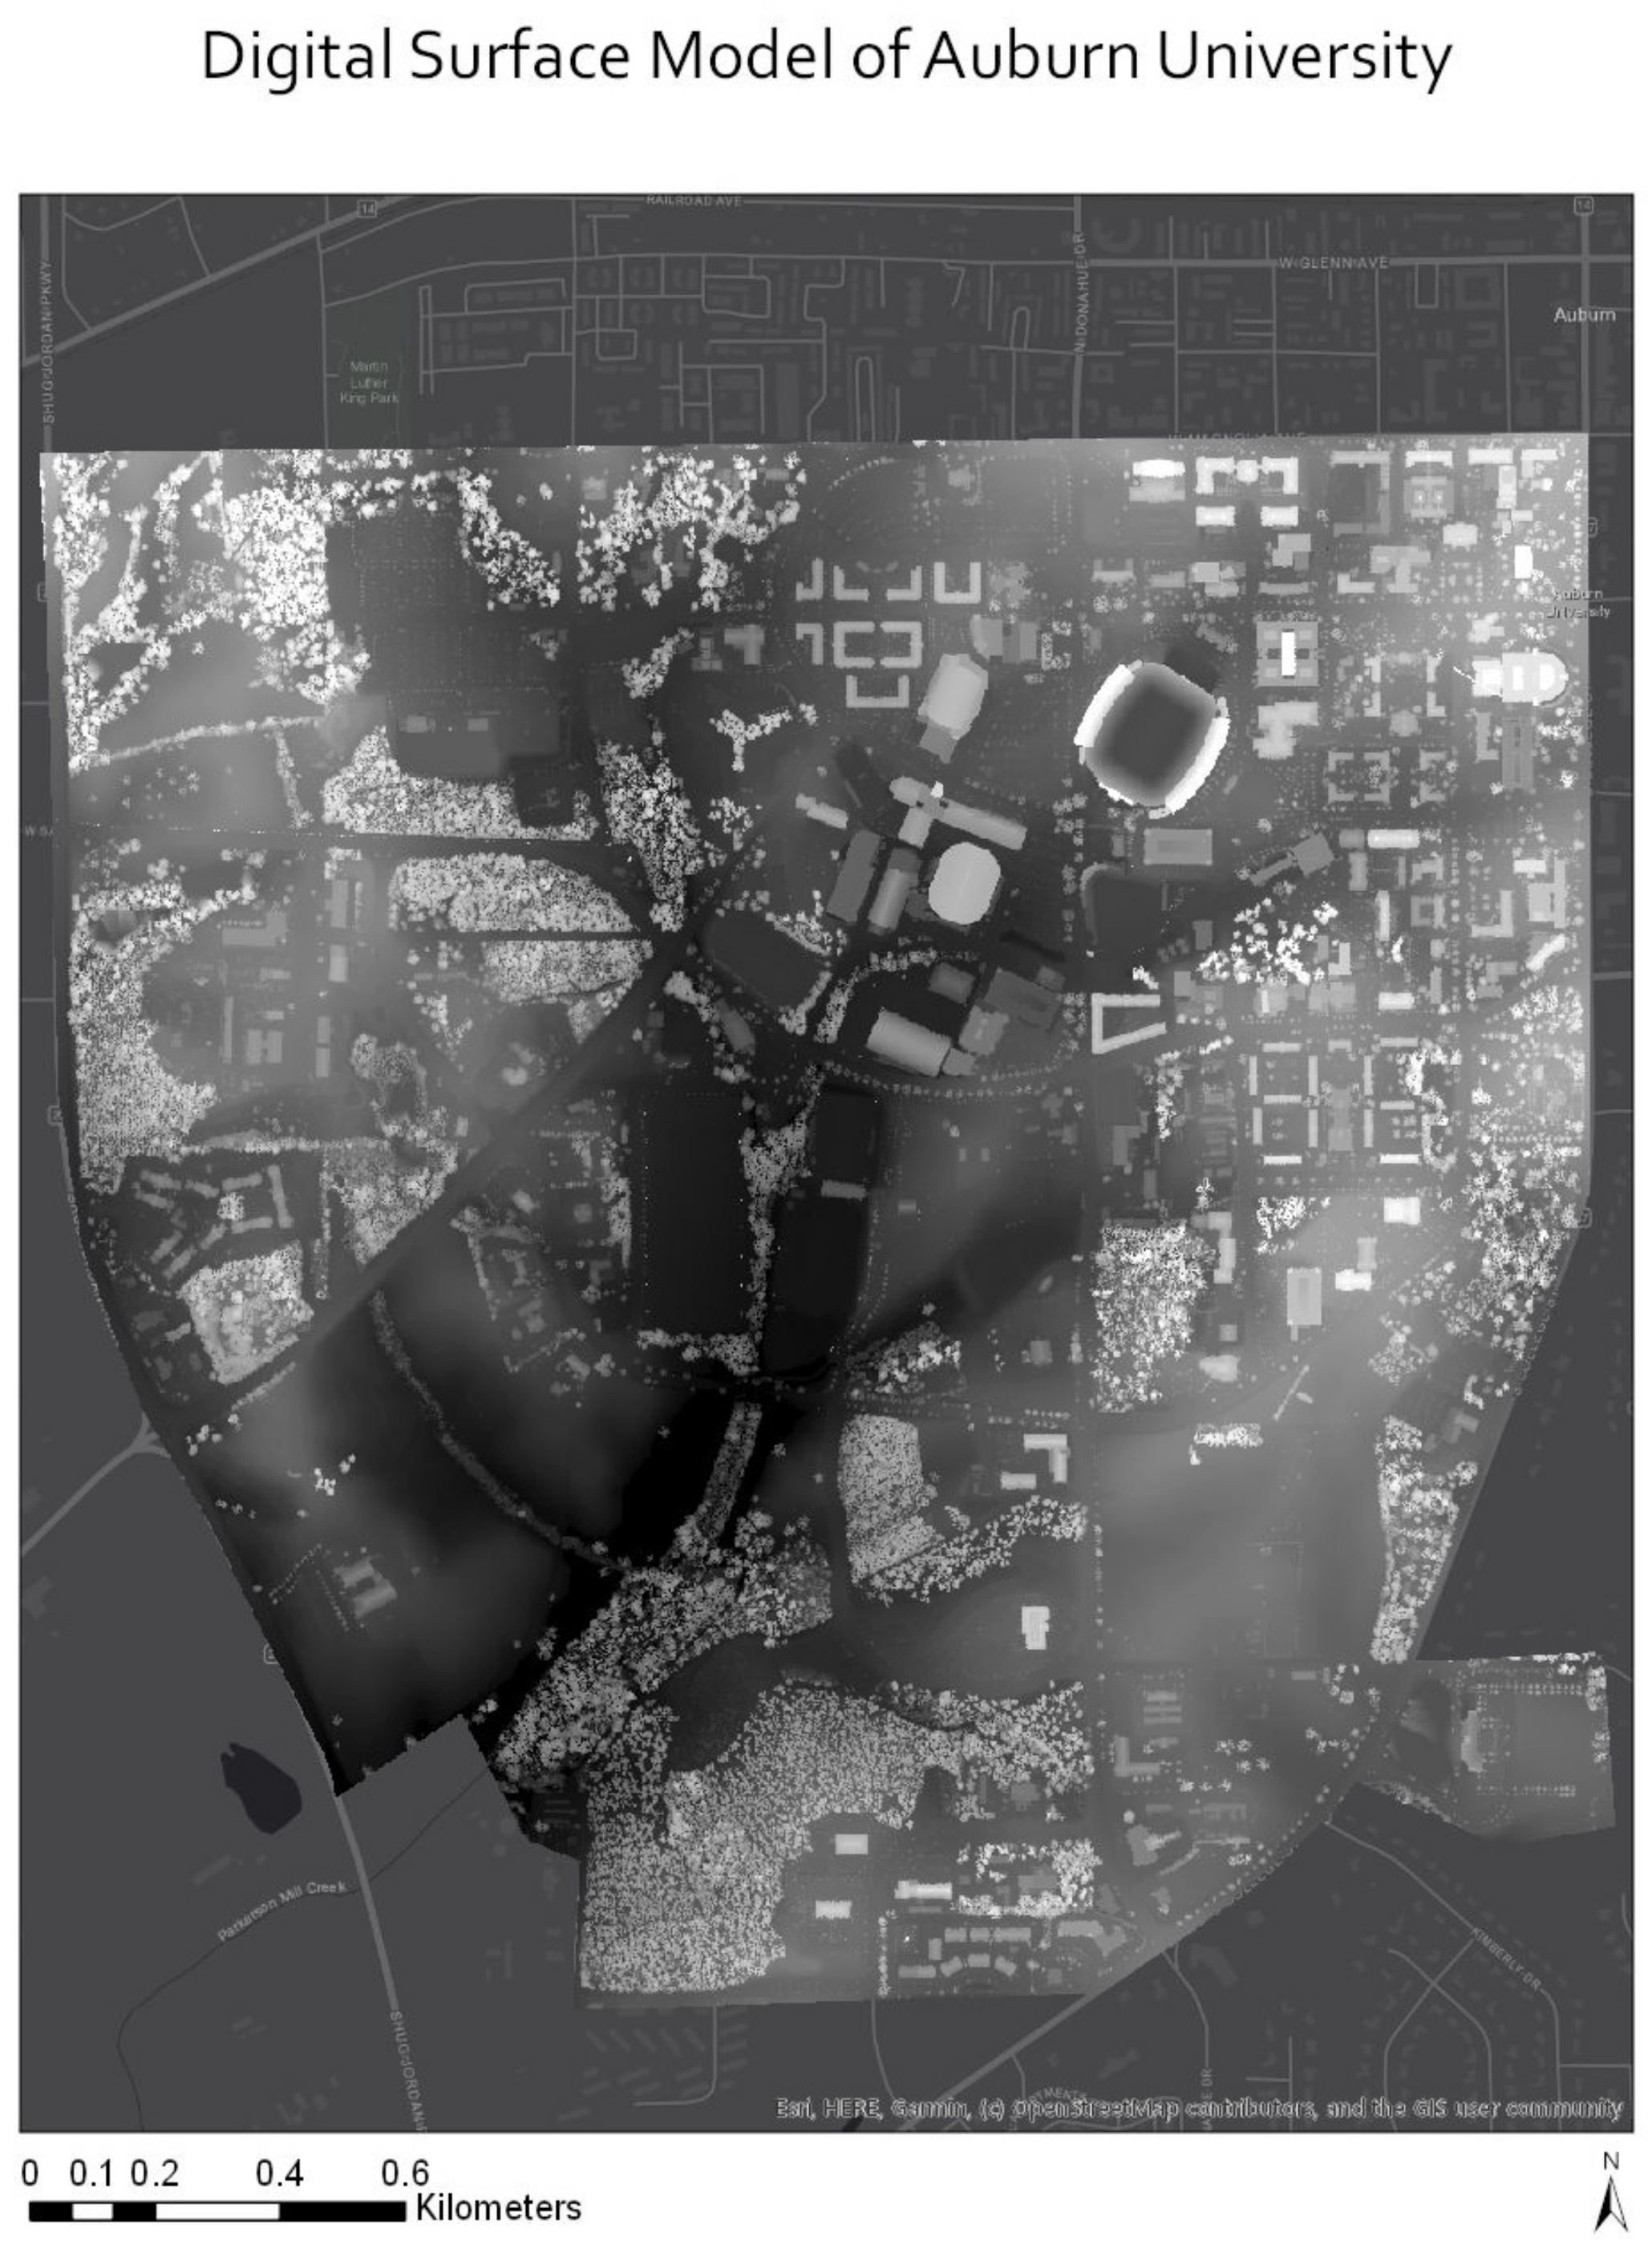
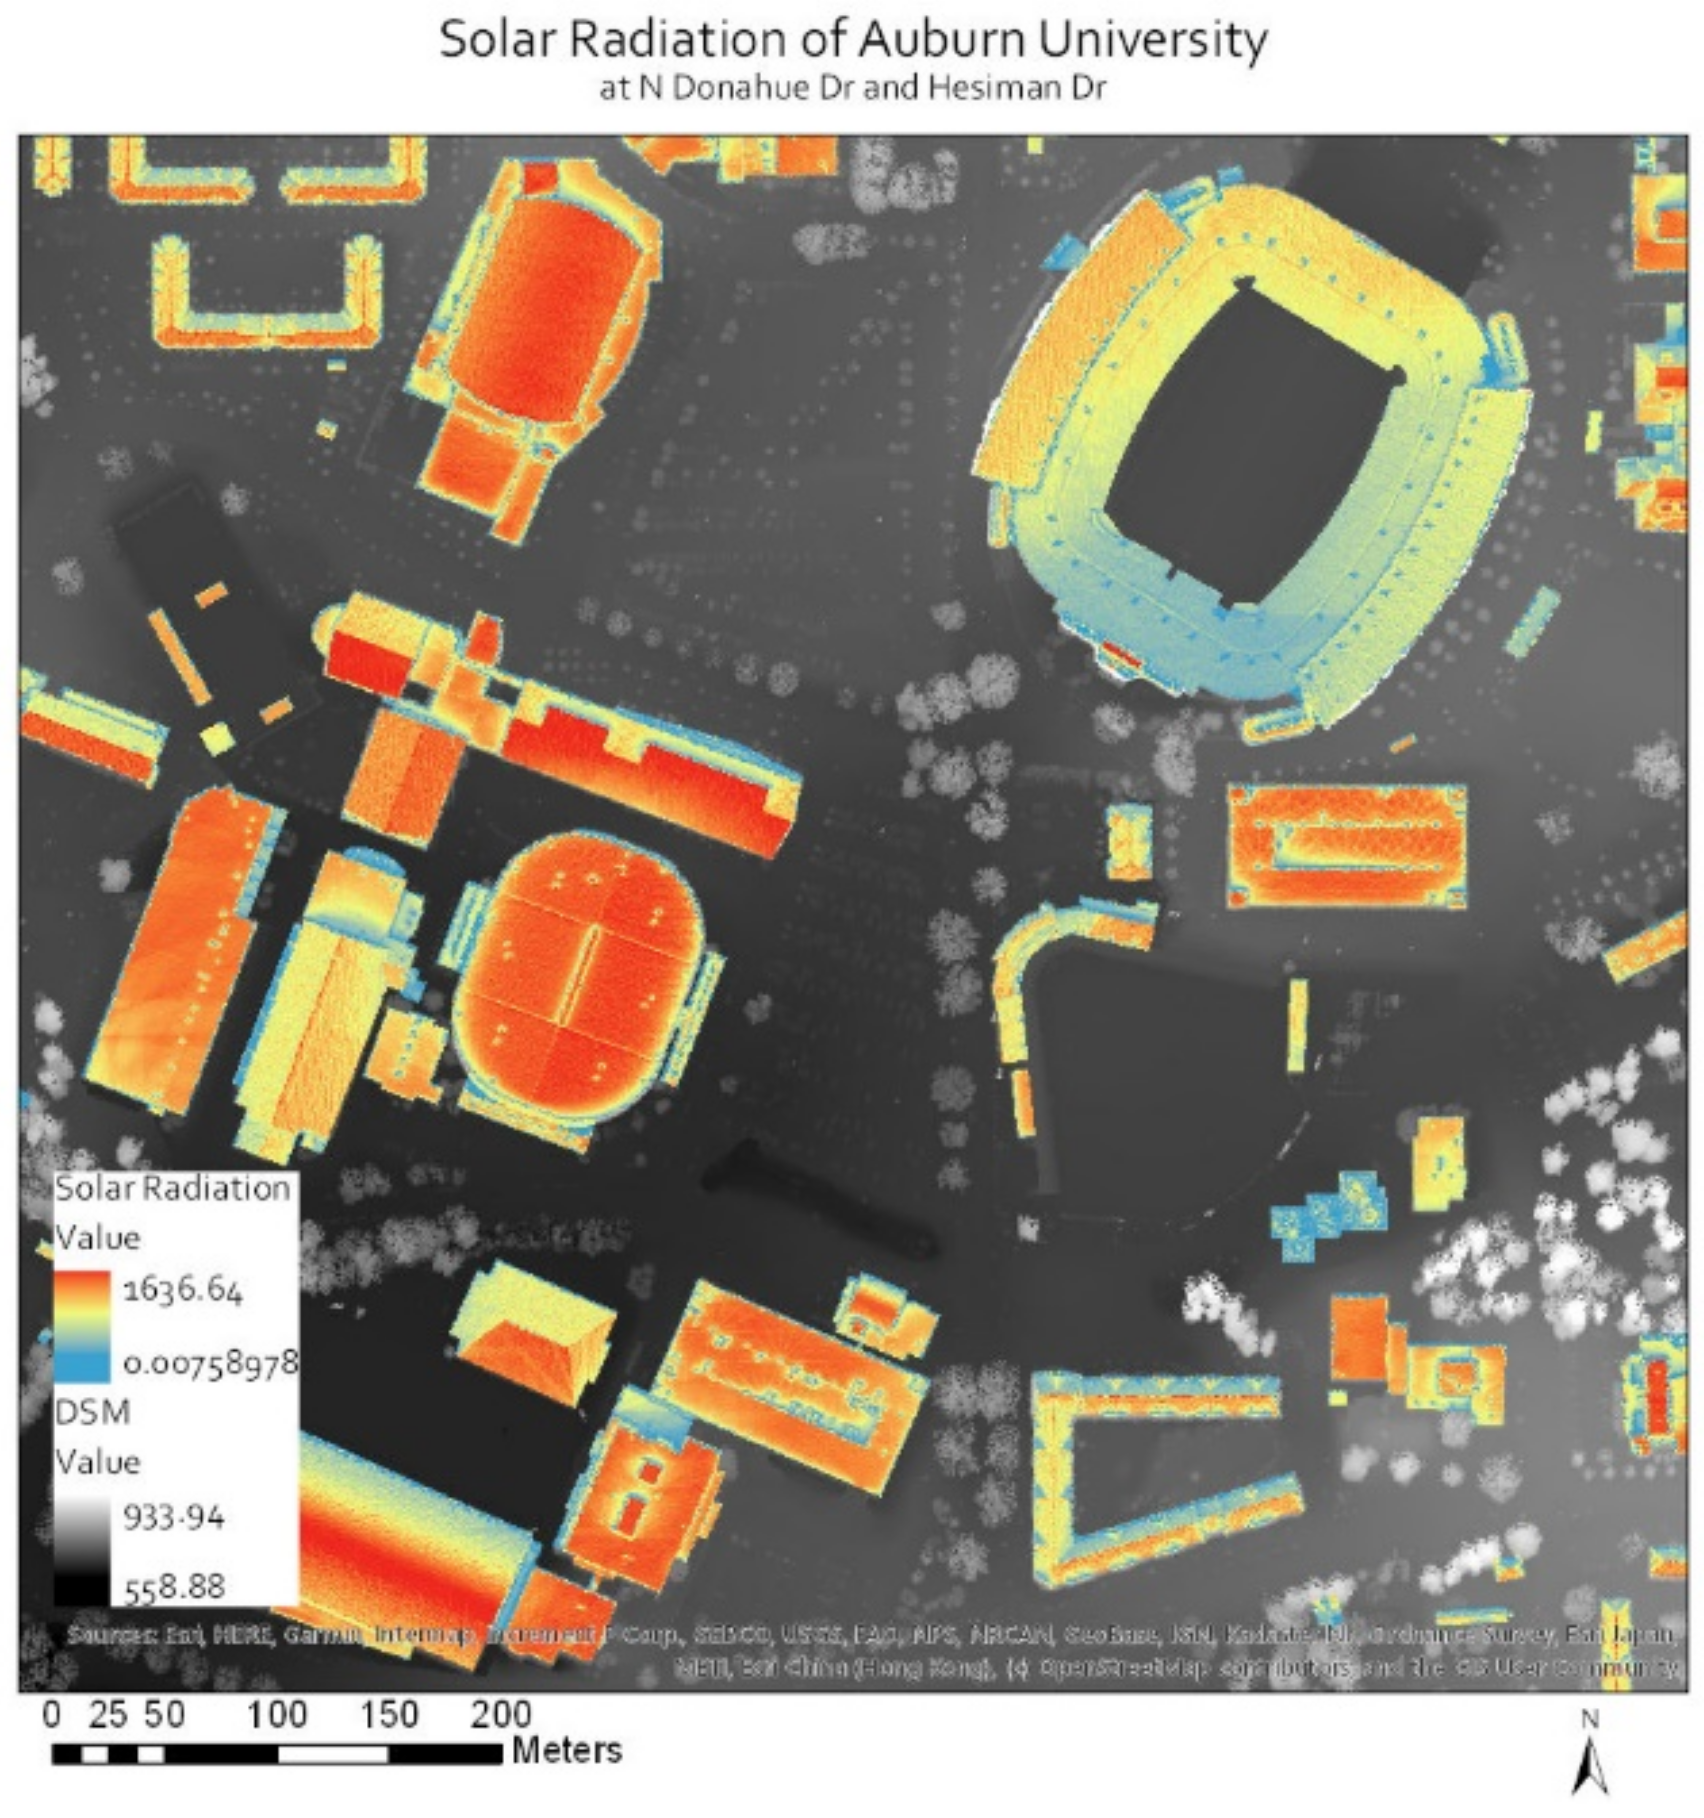
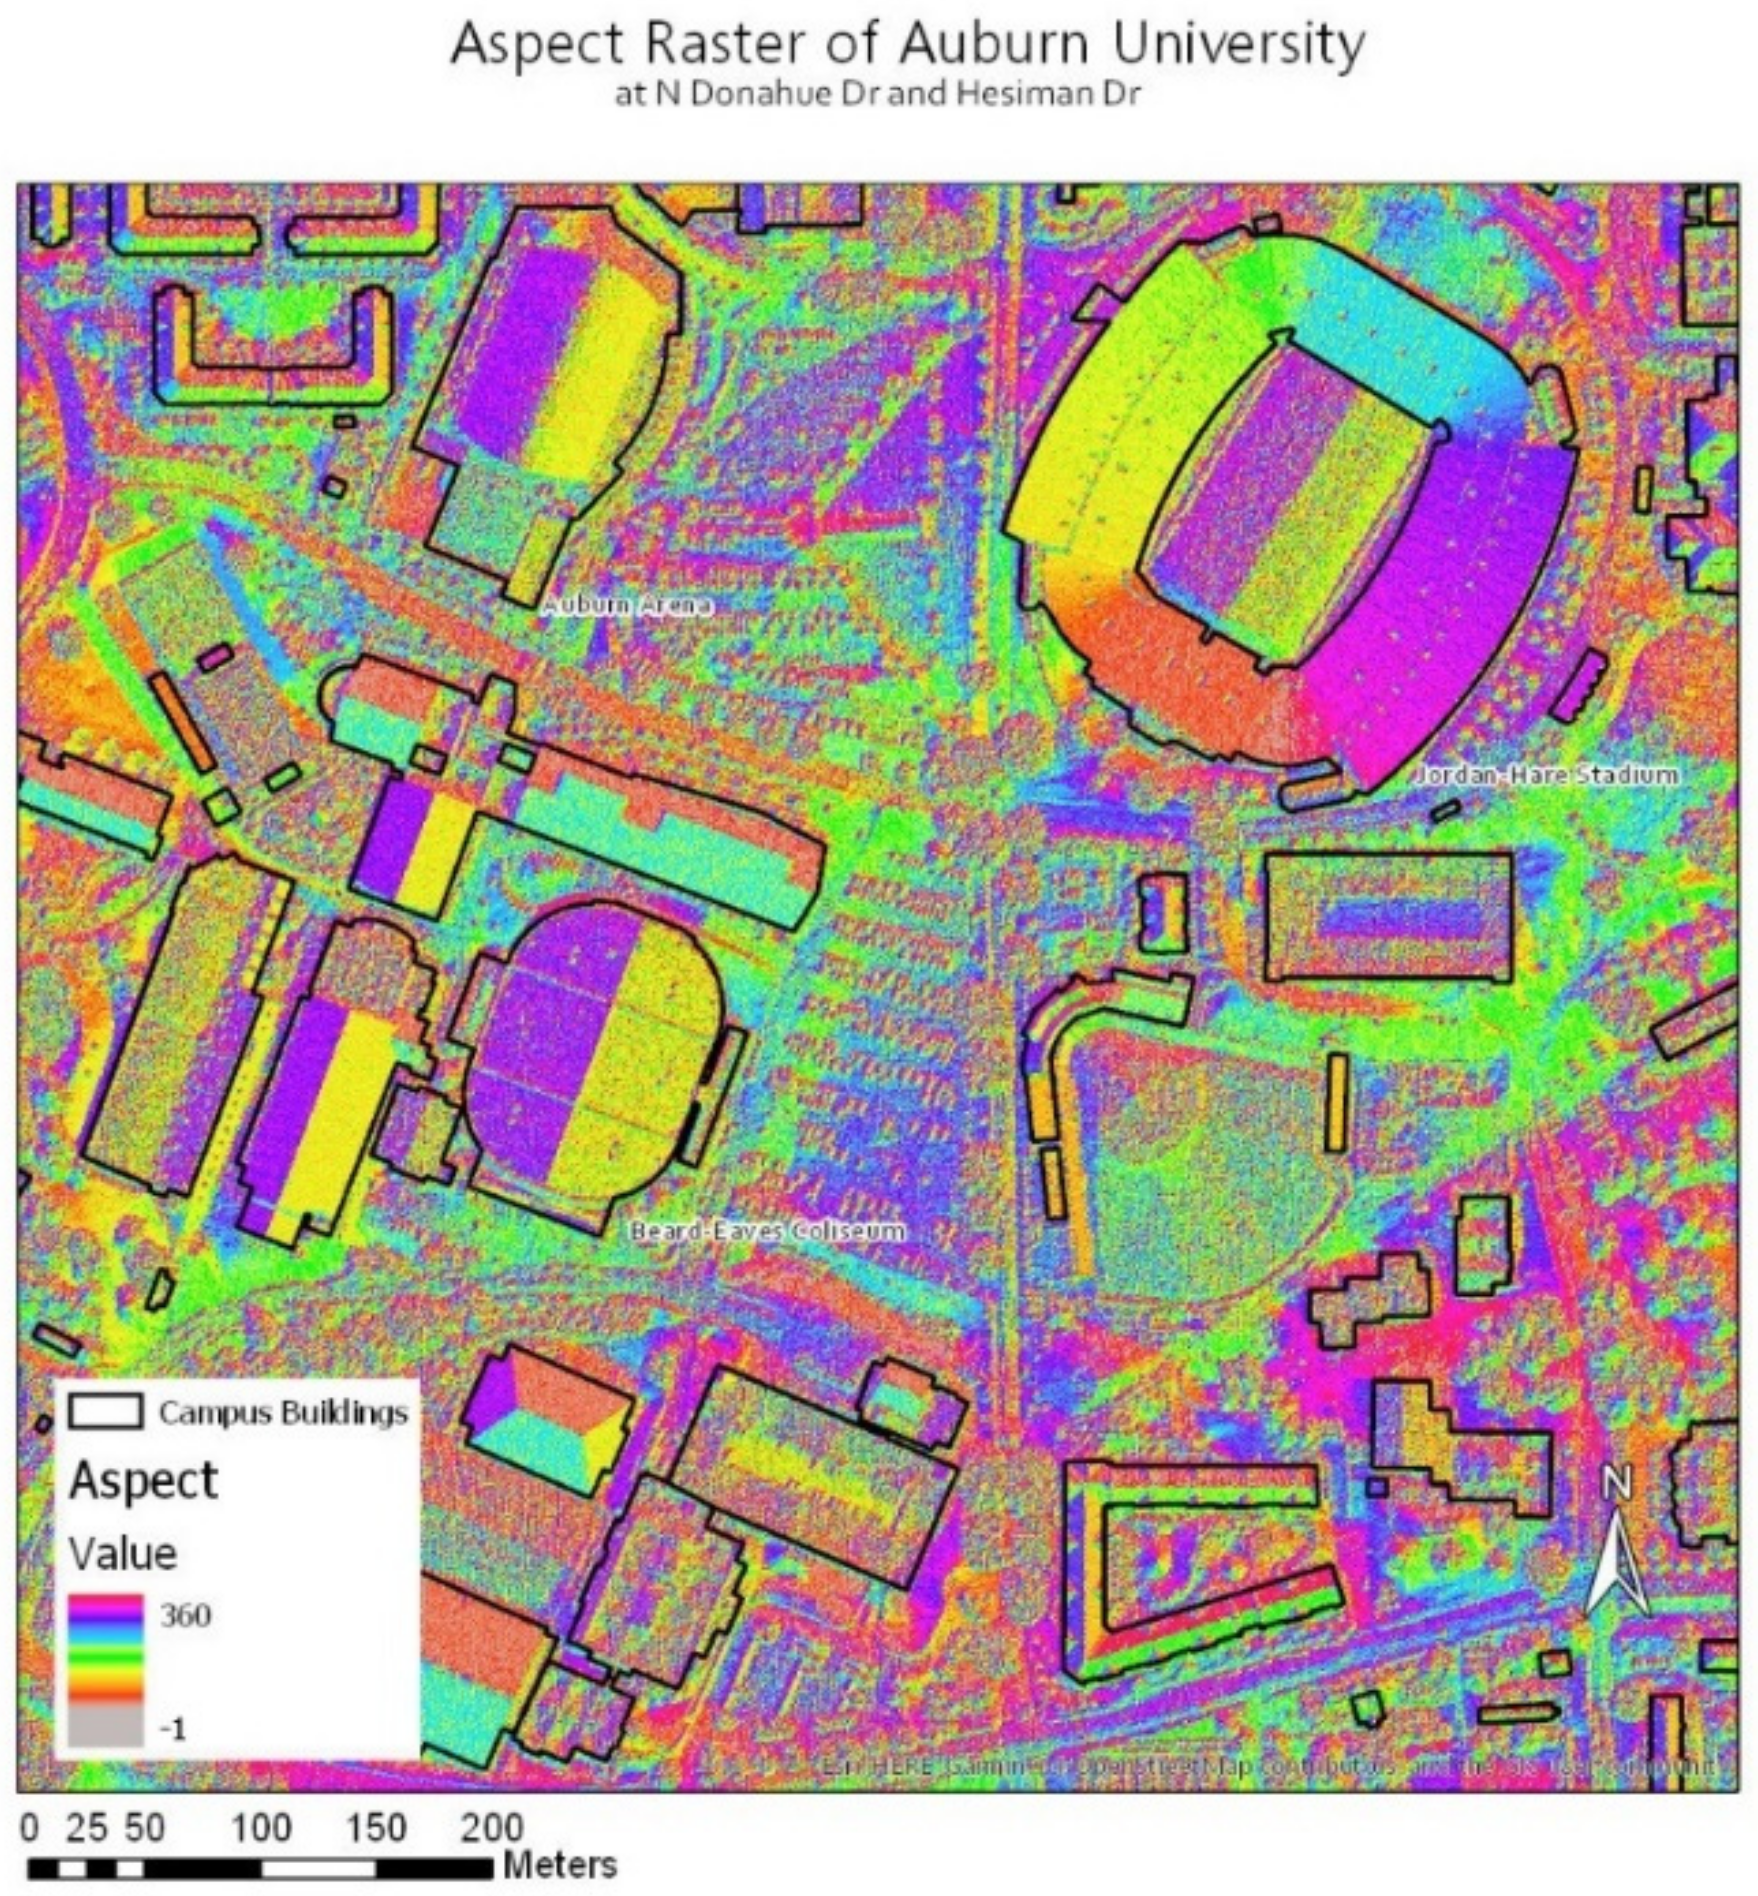
2.2.1. Lidar Point Clouds to Raster Products

A digital terrain model (DTM) was created by using the LAS Dataset to Raster tool. This tool was used to convert elevation values to a raster model. After applying filters to the files to display only points classified as ground points and model key/reserved points and then selecting only the last returns, the tool completed interpolation. The interpolation method chosen was binning, which determines the pixel value to be assigned by evaluating points within the set pixel boundary to decide the final pixel value [26]. The resulting DTM represented the digital elevation of bare Earth [27].
A digital surface model (DSM) was created in ArcGIS Pro by selecting only the first returns from all classes in the LAS dataset, and using the LAS Dataset to Raster tool to export elevation values while using the binning method for interpolation, the maximum value for cell assignment, and a linear void fill method. Maximum value, a type of cell assignment, uses the largest z-value when there is more than one point to account for when generating the raster [26]. The linear void fill method, used to estimate values at unsampled points based on surrounding points, uses values from a plane containing the location of a query point [26]. The resulting 1 m DSM represented the elevation of Earth surfaces including vegetation and structures [27]. Once processed, the raster tiles were mosaicked, projected to meters, and clipped into the boundary of Auburn University’s campus (Figure 3).

2.2.2. Building Footprints

Polygons for each individual building on campus were obtained from the City of Auburn’s GIS department [28]. While some portions of the campus have changed and construction of at least 8 large new buildings has been completed as of 2021, the lidar data, aerial imagery, and building footprint data are consistent with the campus as it was in 2017. Once clipped within the boundary of the university, a raster layer representing solar energy on Earth’s surface was created with the Area Solar Radiation tool. This tool calculates radiation based on a model that considers the position of the sun throughout the selected study year, 2017, at different times of day, while producing an output raster that estimates units of watt-hours per square meter (WH/m2) [29]. Calculations also account for solar declination and solar position through site area latitude, the slope and orientation of the surface from the DTM, and potential obstacles that may block sunlight [29]. A mask was applied so that solar radiation would only be calculated for rooftop surfaces identified as building footprints, as only areas for rooftop PV systems were assessed. The outputs, consisting of energy measurements in a raster layer, were converted to kilowatt-hours per square meter (kWh/m2). When symbolized, the map shows a raster layer indicating a range of solar radiation on campus rooftops, with blue tones representing lower radiation surfaces and orange tones representing high solar radiation (Figure 4).

2.2.3. Rooftop Suitability

Rooftop suitability is determined by three criteria: slope, rooftop orientation, and total annual solar radiation received, as impacted by shade and other factors [7]. Rooftops with an ideal slope were identified by generating a slope raster layer from the created DSM and removing buildings with a roof slope steeper than 47 degrees. The National Renewable Energy Laboratory (NREL) recommends that solar panels tilt within 15 degrees of the latitude of their installation site [30]. Rooftops that are non-north facing are considered the most advantageous for solar arrays [30]. After creating an aspect raster to visually identify the orientation of different roof surfaces, ideally oriented rooftops were isolated (Figure 5).
Each cell in the raster aspect layer contains a value expressing orientation in degrees, with 0 representing absolute north and 180 representing absolute south [31]. The layer’s legend lists the specific degree ranges for each direction [31]. By applying the Con tool for conditional statements, the map showed only roofs with a slope less than or equal to 47 degrees and roofs that were non-north facing. The final condition of rooftop fitness is that the area should receive at least 609 kWh/m2 of solar radiation to sustain a solar array [30]. Areas that did not meet this final condition were removed from the solar radiation raster. The cells by building were aggregated using zonal statistics, and the mean solar radiation for each building in kWh/m2 was calculated. While there is no exact minimum size of solar array mentioned in much of the reviewed literature, the NREL recommends that buildings smaller than 10 m2 be removed from consideration [30]. The 323 buildings that remained were considered suitable for rooftop solar array installation, all having a roof slope of less than or equal to 47 degrees, receiving at least 609 kWh/m2 of annual solar radiation, and being larger than 10 m2.

2.2.4. Energy and Electricity Assessment

The first step in assessing the potential energy production of rooftop arrays was to calculate the total amount of solar radiation received per year by each building’s usable area. This was calculated by multiplying building area by average solar radiation and then converting it to megawatt-hours per square meter. The final step of analysis for the potential solar array was to convert solar radiation to annual electric power production. While total annual solar radiation received in an area determines much of the production potential of a rooftop, the efficiency of the solar installation can also affect the amount of usable energy produced. The United States Environmental Protection Agency (EPA) provides a conservative best estimate of 15 percent efficiency and 86 percent performance ratio [32]. These values mean that the “solar panels are capable of converting 15 percent of incoming solar energy into electricity, and 86 percent of that electricity is maintained throughout the installation” [33]. Electricity production was calculated for each building by multiplying usable solar radiation in megawatt-hours per square meter by 0.15 and then 0.86. The total energy potential for the study area was calculated by aggregating the potential annual electricity production for all buildings deemed suitable for solar development.
To better understand the energy needs of the study area, the Auburn University Energy Management Department provided metered electricity usage data in kWh for all campus buildings on the master energy meters. The metered electricity total for 2017 was 128,445,581 kWh, and the total electricity usage for the whole campus in 2017 was 187,676,766 kWh. Consumption data from campus energy plants and street lighting were not included in the metered electricity estimate. This resulted in data that were about 60,000,000 kWh less than the 2021 estimated campus electricity usage from the Office of Sustainability. As the veterinary building is east of the main campus, it was removed from the study area for consideration of buildings for PV system installation. It should be noted that it was still counted in summary data of metered electricity estimates. As previously mentioned, the study period was limited to the period from 2016 to 2018, and the campus has expanded, with increased building count, since then. The best year of data to consider for this study was 2017 because it aligned with the lidar data and all the buildings on campus. Other years were reported for context and predictive purposes. It was advised to not use data from the year 2020 because of altered campus operations due to the COVID-19 pandemic.

3. Results

3.1. Rooftop Suitability

Of 443 total building structures within the study area, 323 were suitable for rooftop solar developments (Figure 6).
The top-producing potential rooftop solar arrays on campus are Beard–Eaves Memorial Coliseum, Auburn Arena, the Recreation and Wellness Center, and the Draughon Library. The highest solar-energy-producing buildings in the study area were large structures with predominately flat roof surfaces (Table 1).
The largest structure on campus, Jordan–Hare Stadium, was estimated to produce only 222,585 kWh/m2 of usable electricity. While it was considered suitable by processing methods, it is an open-air stadium and does not have a traditional roof surface. One method to still benefit from the solar potential of Jordan–Hare Stadium would be rooftops of press boxes, media rooms, locker rooms, and surfaces that exclude stadium seating.

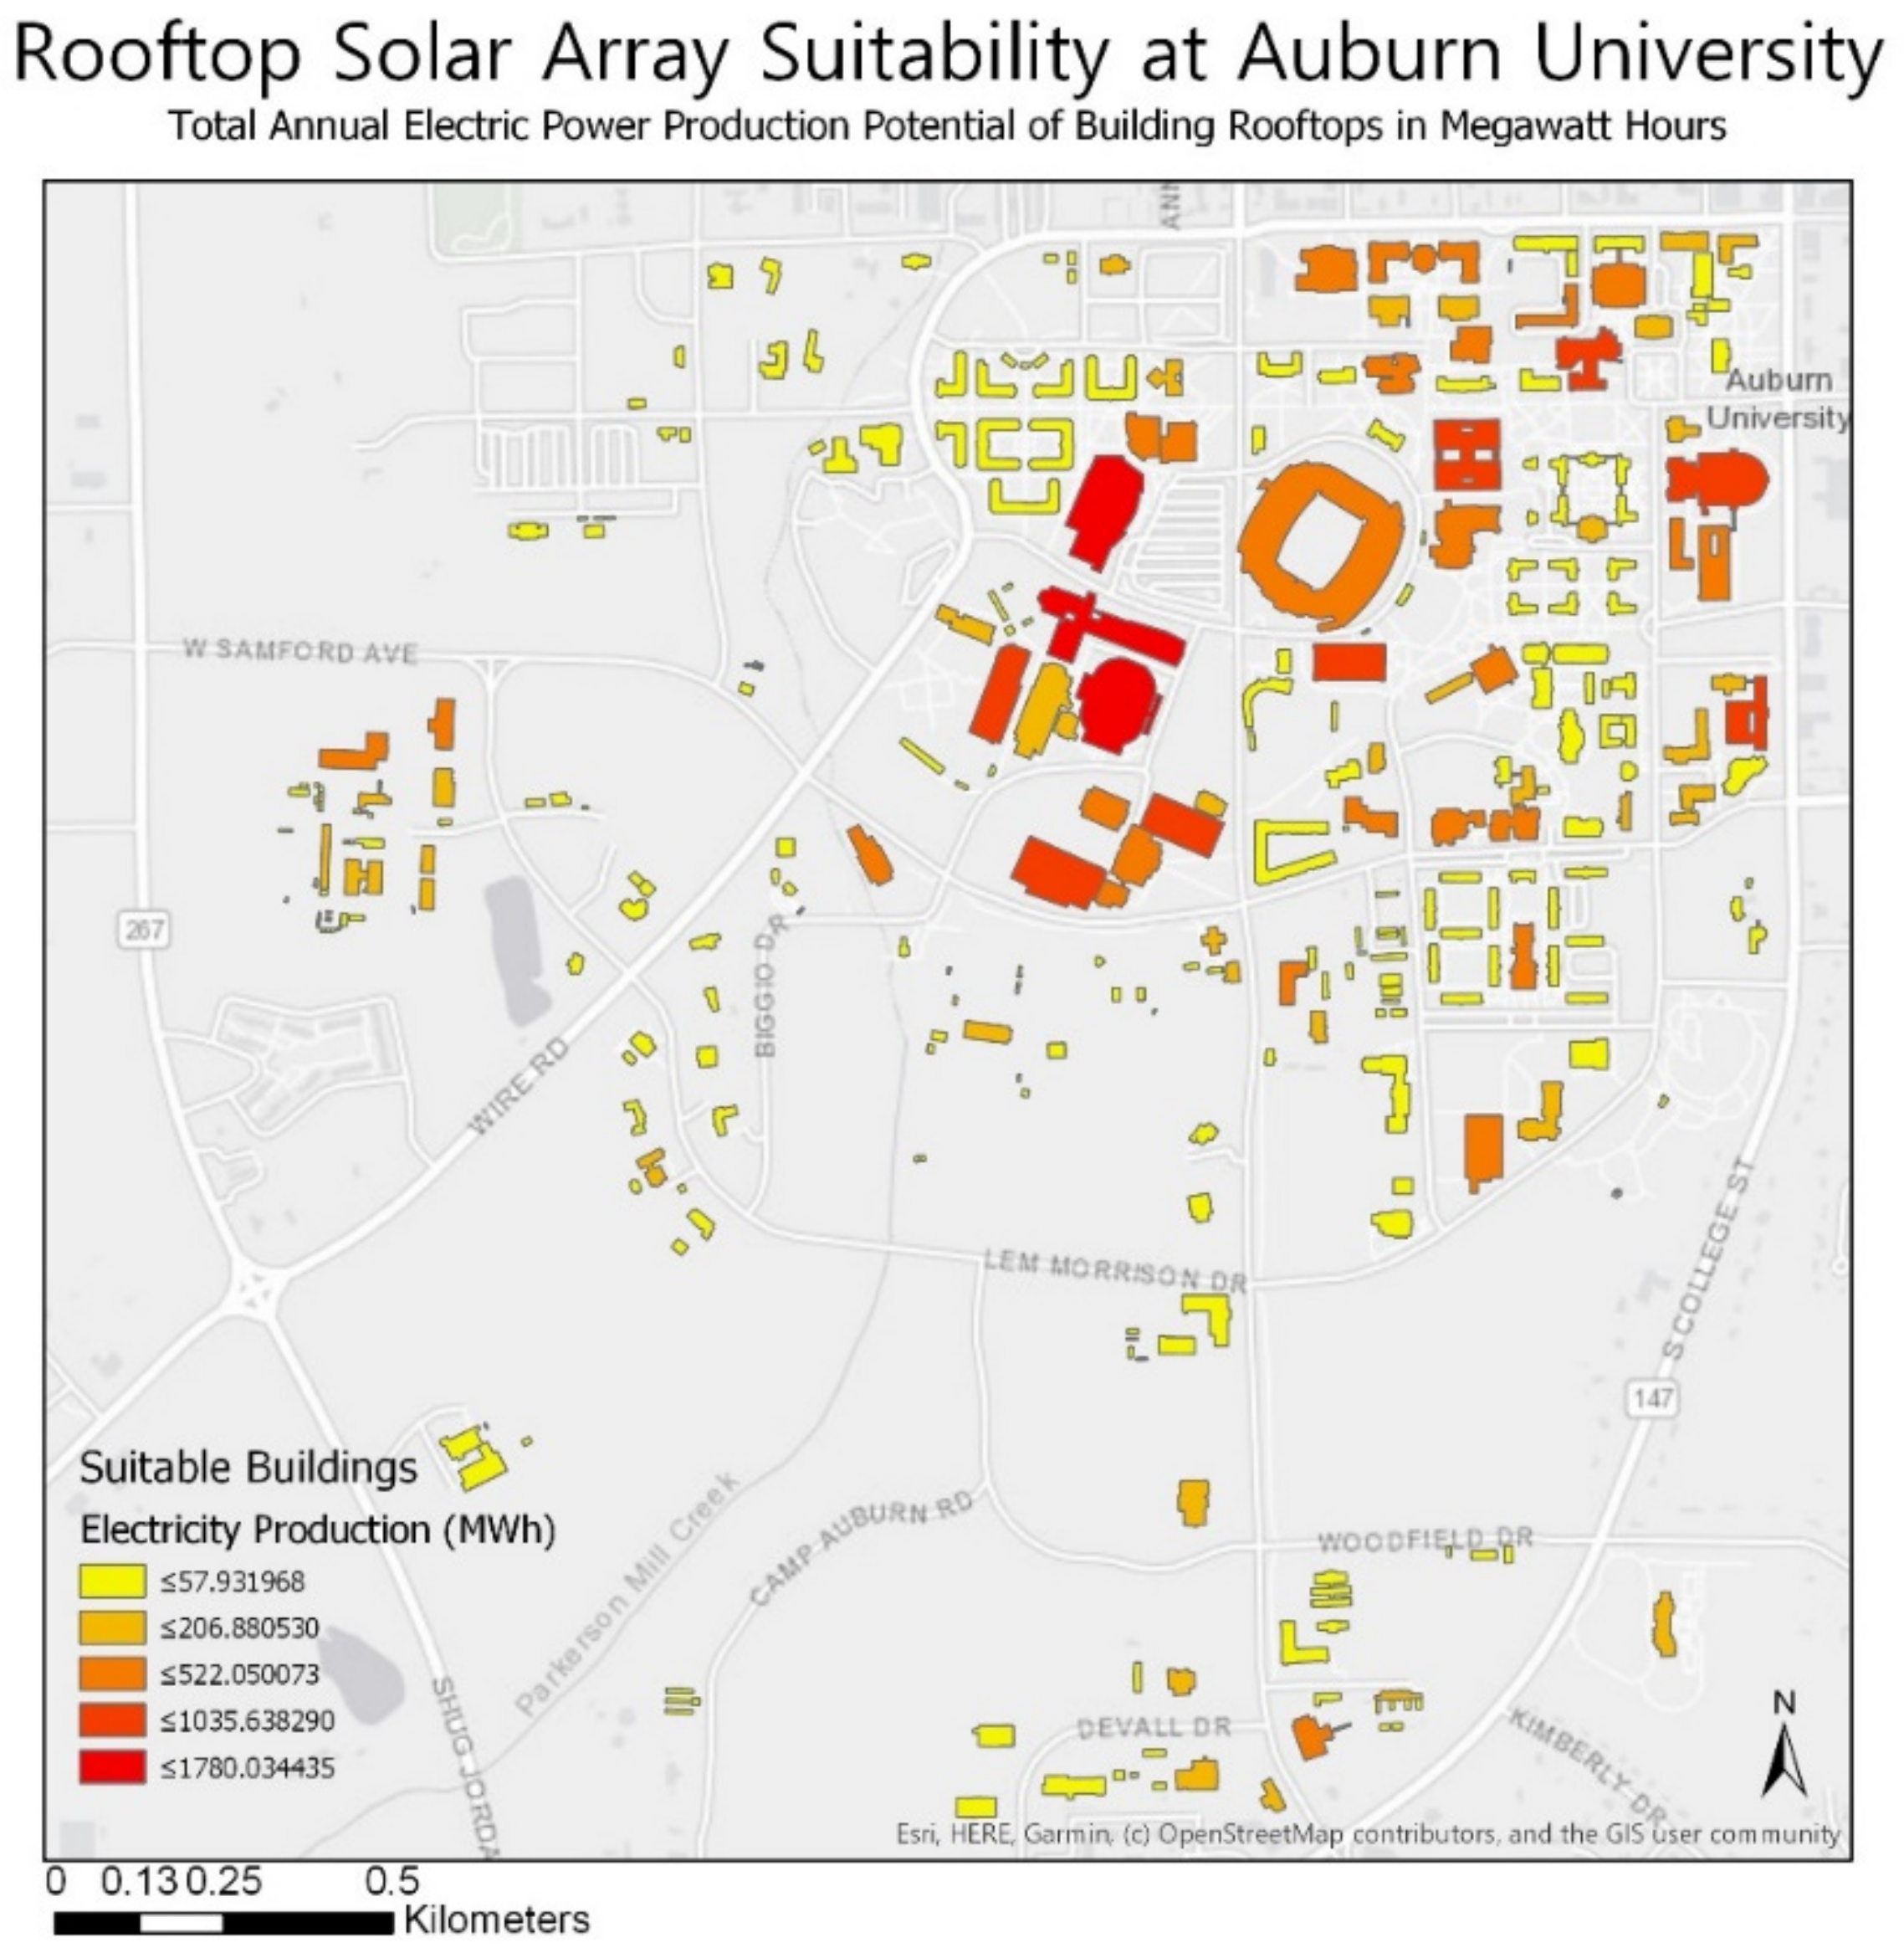
3.2. Electricity Summary

The analysis of suitable buildings concluded that the solar arrays installed on the selected structures could produce 27,068,555.13 kWh. Comparatively, in metrics provided by the analyst of Auburn University’s energy management department, Auburn’s metered buildings used an estimated 128,445,581.4 kWh of energy in 2017 and 131,114,628.3 kWh of energy in 2018. From these data, it is estimated that proposed arrays on suitable buildings would account for up to 21.07% of the electricity needs for the university in 2017, the year the county lidar data were collected. The total campus, including power plants and street lighting, used 187,676,766 kWh of energy in 2017, and the proposed solar panel installations could account for 14.42% of the campus energy demands.
It can be assumed that as the Auburn University campus develops, it will require more electricity, but it is difficult to predict by how much it will increase annually. Energy metrics from 2020 could not be considered since most buildings on campus were dormant from March 2020 through July 2020 due to the COVID pandemic, and most of the campus did not return to full normal operations until after the spring 2021 semester. While data were recorded, the decreased use of buildings and unexpected inoccupancy of residence halls would have lowered the power usage significantly.
From the data provided, there is a notable increase in the number of buildings recording electricity usage each year. The count of buildings registered with electric meters was 205 in 2016 and increased to 216 by 2021, with at least two new campus buildings planned to open in the upcoming academic year. Even though the building count is increasing, it cannot be assumed that the electricity usage will increase as it has in previous years. As an institution, Auburn is constructing the newest structures with Leadership in Energy and Environmental Design (LEED) certifications [34]. Some features that ensure sustainable practices in LEED-certified buildings are reduced energy usage fixtures, higher-efficiency heating and cooling systems, and reinforcement of the use of low carbon emission transportation to and from the building [34]. This is accomplished by providing access to public transportation, providing racks for bicycles, or priority parking for fuel-efficient vehicles [34]. These buildings do not require as much energy as other, older buildings on campus.

3.3. Financial Assessment

If purchased through Auburn University’s current electricity provider, Alabama Power, the initial investment for a solar electric system would be significant. Alabama Power approximates that a 1 kW solar unit in the state of Alabama produces about 100 kWh per month [35]. To produce the estimated 27,068,555 kWh of solar potential, the rooftop systems installed should be a combined total of at least 22,557 kW. At a residential rate, an installation by Alabama Power costs between USD 2500 to USD 3000 per kW [36]. At this rate, the initial equipment investment would range from USD 56,392,822 to USD 67,671,387 with no batteries, though it can be assumed that Auburn University would receive an installation rate lower than what is charged to single-family residences. With an electricity cost of 0.00666/kWh, the average annual electric utility cost would be USD 1,802,765.76 for an annual energy total of 27,068,555 kWh [35].

4. Discussion

Auburn University, an institution committed to advances in sustainability, is an advantageous area for investment in rooftop solar arrays. It has large, widely spaced buildings, mild southeastern Alabama winters that do not require excessive heating demands, and diminished residential capacity in the summer months when energy consumption is usually higher for air conditioning. A college campus such as Auburn would be an ideal place to install rooftop photovoltaic systems to improve sustainability efforts. Auburn’s own sustainability policy states that it “is committed to integrating sustainability into all aspects of the University including: operations, instruction, research, and outreach activities” [36]. To achieve this policy, one of Auburn’s published sustainability goals is to carry out “campus operations so that we use resources conservatively, efficiently, and sustainably” [36]. Committing to installing rooftop solar arrays would benefit the university by helping to reduce its carbon footprint, and it would also serve as an investment in the local economy. A community solar project could be established so that other individuals and businesses in proximity to the university could lease a portion of the panels to generate an electric bill credit for their own benefit [37]. Leasing out a portion of the purchased arrays could also provide a reduction in the cost of the investment for the university.
While installing the proposed solar arrays in their entirety would be difficult financially considering the cost, PV systems are modular and scalable, meaning they can be installed in small groups over time to help Auburn University offset emissions in small milestones over time. The 10 highest producing buildings on campus, ranked in Table 1, would be the most ideal rooftops to begin the installation, considering their assessed suitability based on solar potential. Two of the buildings ranked among the top producers on campus are parking decks. The processing methods assessed these structures as if they were flat roofed instead of open-air parking structures. Although this could be considered a limitation of the processing methodology, both structures can be developed to utilize their solar potential. It is common practice to install solar arrays as shade for cars in parking lots, mitigating the effects of urban heat islands by lowering surface temperatures [38]. This popular and well-proven urban design practice provides economic efficiency and can be used to store electricity for campus buildings or local charging stations at the deck [39].
One potential limitation of the research is the age of the airborne lidar data. As previously mentioned, Auburn University has changed since 2017, when the data were acquired. In an environment that is changing consistently, it is not always feasible to collect new airborne lidar annually. However, in the absence of airborne lidar, other geospatial technologies, such as 3D modeling from terrestrial units, UAV, and photogrammetry could be explored for modeling solar radiation [12,40].
Moving forward with information from the study, Auburn University can explore options for PV installation. With approximations of solar-generated electricity for suitable rooftops, the university can work with their current provider, Alabama Power, to determine the best and most cost-effective option for the proposed arrays. The findings in this study have the potential to propel Auburn to the front lines of sustainable design and renewable energy for colleges in the southern US. The proposed installation could be a research and learning opportunity for multiple entities on campus, from mechanical engineering students applying thermodynamics in renewable energy to building science or architecture students studying sustainable building design. Future studies could investigate the solar potential of non-rooftop areas of the campus. Being a land-grant institution, Auburn has a surplus of agricultural and forested land for multi-disciplinary use. Large solar ground arrays installed outside of the main campus could increase the amount of electricity that could be accounted for by renewable energy.
The adaptability of the framework used for processing means that it can be applied at any institution that is within the current geographic extent of USGS’s 3DEP or has similar lidar data collected. The Auburn University study utilized airborne lidar data provided by the City of Auburn. These data were collected in 2017 at a standard matching those of data from 3DEP, a three-dimensional elevation program from the US Geological Survey. The goal of 3DEP is to acquire high-quality lidar data nationwide and make those resources publicly available by 2023 [41]. By using entirely public data, the study can be replicated in any study area with high-resolution lidar data or digital surface models (DSMs). The methodology, modeled after standard NREL rooftop solar potential estimation methods and completed entirely with publicly available data, can be a resource for universities nationwide. With the entirety of processing completed in ArcGIS Pro with existing toolboxes, accessible user interface, and in-depth guidance provided by Esri, the methods can easily be recreated and adapted based on the needs of the user.

5. Conclusions

This study presented an assessment of the suitability for the installation of solar PV systems for electricity generation on a US university campus, focusing on a university campus in southern Alabama as a case study. This work, completed for Auburn University, assessed the rooftop potential of campus buildings using lidar point clouds and GIS methods and examined solar potential in conjunction with actual data from 2017. While current installations of solar arrays account for less than 1% of the campus energy needs, findings demonstrate the feasibility of installing PV systems in campus buildings with the potential to make greater contributions. Considering the rooftops of suitable size, azimuth, and slope, the estimated rooftop solar potential of the Auburn University campus is 27,068,555 kWh. Assuming all suitable buildings were fitted with solar arrays, the multiple systems would meet up to 21.07% of metered building electricity needs, approximately 14.42% of university electricity in 2017, when the data were collected. At residential pricing, the initial installation would cost approximately USD 62,032,105.21, with an additional annual electric fee of USD 1,802,765.76. Future work may investigate the solar potential of non-rooftop areas to further contribute to electricity demands and examine the implementation of these systems at the campus level.

Author Contributions

Conceptualization, V.S. and L.L.N.; methodology, V.S. and L.L.N.; formal analysis, V.S.; investigation, V.S. and L.L.N.; resources, V.S. and L.L.N.; writing—original draft preparation, V.S.; writing—review and editing, V.S. and L.L.N.; visualization, V.S.; supervision, L.L.N.; funding acquisition, V.S. and L.L.N. Both authors have read and agreed to the published version of the manuscript. All authors have read and agreed to the published version of the manuscript.

Funding

This research was supported by Auburn University’s Undergraduate Research Fellowship Program and the School of Forestry and Wildlife Sciences.

Institutional Review Board Statement

Not applicable.

Informed Consent Statement

Not applicable.

Acknowledgments

We thank Auburn University’s Office of Sustainability and the Auburn University Department of Energy Management for their technical support. We are grateful to Christopher Mixon for his assistance with obtaining county-wide airborne lidar data and the City of Auburn for lidar data and building polygons used in this study. Our sincere thanks to anonymous reviewers for their insightful comments and suggestions.

Conflicts of Interest

The authors declare no conflict of interest.

References

  1. February 19; Denchak, 2021 Melissa Paris Climate Agreement: Everything You Need to Know. Available online: https://www.nrdc.org/stories/paris-climate-agreement-everything-you-need-know (accessed on 20 July 2021).
  2. Alabama Solar. Available online: https://www.seia.org/state-solar-policy/alabama-solar (accessed on 20 July 2021).
  3. U.S. Solar Market Insight. Available online: https://www.seia.org/us-solar-market-insight (accessed on 29 July 2021).
  4. Better Buildings Alliance–Higher Education. Available online: https://betterbuildingsinitiative.energy.gov/alliance/sector/higher-education (accessed on 1 December 2021).
  5. Van Geet, O.; Polly, B.; Pless, S.; Heeter, J. Zero Energy University Campuses: A 2018 Progress Update on Reaching Campus Energy Goals: Preprint; National Renewable Energy Laboratory: Golden, CO, USA, 2018. Available online: https://www.nrel.gov/docs/fy18osti/71822.pdf (accessed on 1 December 2021).
  6. Kanters, J.; Davidsson, H. Mutual Shading of PV Modules on Flat Roofs: A Parametric Study. Energy Procedia 2014, 57, 1706–1715. [Google Scholar] [CrossRef] [Green Version]
  7. Gagnon, P.; Margolis, R.; Melius, J.; Phillips, C.; Elmore, R. Rooftop Solar Photovoltaic Technical Potential in the United States: A Detailed Assessment; National Renewable Energy Laboratory: Golden, CO, USA, 2016; p. 70. [Google Scholar]
  8. Average Annual Sunshine by USA State-Current Results. Available online: https://www.currentresults.com/Weather/US/average-annual-state-sunshine.php (accessed on 29 July 2021).
  9. Mean Number of Days with Precipitation 0.01 Inches or More. Available online: https://www.weather.gov/ddc/meanprecip (accessed on 30 July 2021).
  10. Auburn University Climate Action Plan V.1.1. Available online: https://www.ncei.noaa.gov/pub/data/ccd-data/prge0118.dat (accessed on 1 December 2021).
  11. Auburn University|Quick Facts–Enrollment. Available online: http://www.auburn.edu (accessed on 29 July 2021).
  12. Nelson, J.R.; Grubesic, T.H. The use of LiDAR versus unmanned aerial systems (UAS) to assess rooftop solar energy potential. Sustain. Cities Soc. 2020, 51, 102353. [Google Scholar] [CrossRef]
  13. Gassar, A.A.; Cha, S.H. Review of geographic information systems-based rooftop solar photovoltaic potential estimation approaches at urban scales. Appl. Energy 2021, 291, 116817. [Google Scholar] [CrossRef]
  14. Yang, Y.; Campana, P.E.; Stridh, B.; Yan, J. Potential analysis of roof-mounted solar photovoltaics in Sweden. Appl. Energy 2020, 279, 115786. [Google Scholar] [CrossRef]
  15. Gergelova, M.B.; Kuzevicova, Z.; Labant, S.; Kuzevic, S.; Bobikova, D.; Mizak, J. Roof’s Potential and Suitability for PV Systems Based on LiDAR: A Case Study of Komárno, Slovakia. Sustainability 2020, 12, 10018. [Google Scholar] [CrossRef]
  16. Mansouri Kouhestani, F.; Byrne, J.; Johnson, D.; Spencer, L.; Hazendonk, P.; Brown, M. Evaluating solar energy technical and economic potential on rooftops in an urban setting: The city of Lethbridge, Canada. Int. J. Energy Environ. Eng. 2018, 10, 13–32. [Google Scholar] [CrossRef] [Green Version]
  17. Mansouri Kouhestani, F.; Byrne, J.; Johnson, D.; Spencer, L.; Hazendonk, P.; Brown, M.; Johnson, D. A comprehensive assessment of solar and wind energy potential at the University of Lethbridge campus, a medium-sized western Canadian university. Int. J. Green Energy 2019, 10, 1671400. [Google Scholar] [CrossRef]
  18. Amaral, A.R.; Rodriques, E.; Gaspar, A.R.; Gomes, A. A review of empirical data of sustainability initiatives in university campus operations. J. Clean. Prod. 2020, 250, 119558. [Google Scholar] [CrossRef]
  19. Amaral, A.R.; Rodriques, E.; Gaspar, A.R.; Gomes, A. Lessons from unsuccessful energy and buildings sustainability actions in university campus operations. J. Clean. Prod. 2021, 297, 126665. [Google Scholar] [CrossRef]
  20. Hernandez-Aguilera, J.N.; Anderson, W.; Bridges, A.L.; Fernandez, M.P.; Hansen, W.D.; Maurer, M.L.; Nebie, E.K.; Stock, A. Supporting interdisciplinary careers for sustainability. Nat. Sustain. 2021, 4, 374–375. [Google Scholar] [CrossRef]
  21. Pillot, B.; Al-Kurdi, N.; Gervet, C.; Linguet, L. An integrated GIS and robust optimization framework for solar PV plant planning scenarios at utility scale. Appl. Energy 2020, 260, 114257. [Google Scholar] [CrossRef] [Green Version]
  22. Ecoregions of Alabama and Georgia, (Color Poster with Map, Descriptive Text, Summary Tables, and Photographs): Reston, Virginia, U.S. Geological Survey (Map Scale 1:1,700,000). Available online: http://ecologicalregions.info/htm/ecoregions.htm (accessed on 3 January 2022).
  23. USGS EROS Archive—Aerial Photography—National Agriculture Imagery Program (NAIP). Available online: https://www.usgs.gov/centers/eros/science/usgs-eros-archive-aerial-photography-national-agriculture-imagery-program-naip?qt-science_center_objects=0#qt-science_center_objects (accessed on 3 January 2022).
  24. Graff, C. Lee, County, AL Aerial Lidar Terrain Data 2017; City of Auburn Information Technology: Auburn, AL, USA, 2017. [Google Scholar]
  25. Lukas, V.; Baez, V. 3D Elevation Program—Federal Best Practices; Fact Sheet; U.S. Geological Survey: Reston, VA, USA, 2021; p. 2. [Google Scholar]
  26. LAS To Raster Function—ArcGIS Pro|Documentation. Available online: https://pro.arcgis.com/en/pro-app/latest/help/analysis/raster-functions/las-to-raster-function.htm (accessed on 29 July 2021).
  27. Generate Elevation Data Using the DEMs Wizard—ArcGIS Pro|Documentation. Available online: https://pro.arcgis.com/en/pro-app/latest/help/data/imagery/generate-elevation-data-using-the-dems-wizard.htm (accessed on 29 July 2021).
  28. City of Auburn, AL-Community Data. Available online: https://data-coa.opendata.arcgis.com/ (accessed on 30 July 2021).
  29. An Overview of the Solar Radiation Toolset—ArcGIS Pro|Documentation. Available online: https://pro.arcgis.com/en/pro-app/latest/tool-reference/spatial-analyst/an-overview-of-the-solar-radiation-tools.htm (accessed on 29 July 2021).
  30. Melius, J.; Margolis, R.; Ong, S. Estimating Rooftop Suitability for PV: A Review of Methods, Patents, and Validation Techniques; National Renewable Energy Laboratory: Golden, CO, USA, 2013; p. 30. [Google Scholar]
  31. Aspect (Spatial Analyst)—ArcGIS Pro|Documentation. Available online: https://pro.arcgis.com/en/pro-app/latest/tool-reference/spatial-analyst/aspect.htm (accessed on 29 July 2021).
  32. United States Environmental Protection Agency. Green Power Equivalency Calculator-Calculations and References. Available online: https://www.epa.gov/greenpower/green-power-equivalency-calculator-calculations-and-references (accessed on 20 July 2021).
  33. Khanna, D. Estimate Solar Power Potential. Available online: https://learn.arcgis.com/en/projects/estimate-solar-power-potential/ (accessed on 20 July 2021).
  34. Auburn University’s Jay and Susie Gogue Performing Arts Center Receives Prestigious LEED Gold Certification. Available online: http://ocm.auburn.edu/newsroom/news_articles/2020/09/291440-gpac-leed-gold-certification.php (accessed on 28 July 2021).
  35. Solar Costs: Residential System Pricing. Available online: https://www.alabamapower.com/smart-energy/sustainability/renewables/solar-energy/solar-costs.html (accessed on 1 July 2021).
  36. Auburn University Sustainability Policy 2011. Available online: https://sites.auburn.edu/admin/universitypolicies/Policies/SustainabilityPolicy.pdf (accessed on 3 January 2022).
  37. Community Solar Basics. Available online: https://www.energy.gov/eere/solar/community-solar-basics (accessed on 30 July 2021).
  38. Baumgartner, F.; Büchel, A.; Carigiet, F.; Baumann, T.; Epp, R.; Wirtz, A.; Hügeli, A.; Graf, U. “Urban Plant” Light-Weight Solar System for Parking and Other Urban Double Use Applications. Environ. Sci. 2013. [Google Scholar] [CrossRef]
  39. Iringová, A.; Kovačic, M. Design and optimization of photovoltaic systems in a parking garage—A case study. Transp. Res. Procedia 2021, 55, 1171–1179. [Google Scholar] [CrossRef]
  40. Abu Sari, M.Y.; Rasib, A.; Mohd, H.; Razak, A.; Hassan, M.; Idris, K.M.; Ahmad, A.; Dollah, R. 3D Mapping based-on Integration of UAV Platform and Ground Surveying. Int. J. Adv. Comput. Sci. Appl. 2018, 9, 091223. [Google Scholar] [CrossRef]
  41. Thatcher, C.; Lukas, V.; Stoker, J. The 3D Elevation Program and Energy for the Nation; USGS: Lakewood, CO, USA, 2020. [Google Scholar] [CrossRef]
Figure 1. Auburn University in Auburn, AL visualized on 1 m 2017 National Agriculture Imagery Program (NAIP) aerial imagery and location of the study area with a supervised classification of maximum likelihood using ENVI software.
Sustainability 14 00626 g001
Figure 2. The methodology implemented in the Auburn University rooftop PV study.
Sustainability 14 00626 g002
Figure 3. Digital surface model extracted from the 2017 lidar point cloud of Auburn, AL, visualized in ArcGIS.
Sustainability 14 00626 g003
Figure 4. Solar radiation raster of Auburn University at N Donahue Dr and Heisman Dr visualized in ArcGIS.
Sustainability 14 00626 g004
Figure 5. Aspect raster of Auburn University at N Donahue Dr and Heisman Dr visualized in ArcGIS Pro.
Sustainability 14 00626 g005
Figure 6. Map of Auburn campus buildings as ranked by potential annual electricity production visualized in ArcGIS.
Sustainability 14 00626 g006
Table 1. Annual electric production potential of Auburn University buildings in 2017, ranked.
Building NameAnnual Electricity Production (kWh)% Metered Building
Energy Requirement (2017)
Beard–Eaves1,780,034.4351.39
Auburn Arena1,678,255.9191.31
Recreation and Wellness1,381,735.9591.08
Draughon Library1,035,638.2900.81
Student Activities Center977,317.3090.76
Haley Center813,243.2460.63
South Donahue Parking Deck795,006.7240.62
Stadium Parking Deck739,766.7290.58
Indoor Practice Facility668,337.9720.52
Foy Hall596,382.5120.46
Publisher’s Note: MDPI stays neutral with regard to jurisdictional claims in published maps and institutional affiliations.

