Article

Contribution of Livelihoods to the Well-Being of Coffee-Growing Households in Southern Colombia: A Structural Equation Modeling Approach

by
Adriana Eugenia Suárez
1,2,3,
Isabel Gutiérrez-Montes
4,
Fausto Andrés Ortiz-Morea
1,3,5,
Juan Carlos Suárez
2,3,5,*,
Julio Di Rienzo
6 and
Fernando Casanoves
4
1
Programa de Doctorado Ciencias Naturales y Desarrollo Sustentable, Facultad de Ciencias Agropecuarias, Universidad de la Amazonia, Florencia 180002, Colombia
2
Programa de Maestría en Sistema Sostenibles de Producción, Facultad de Ciencias Agropecuarias, Universidad de la Amazonia, Florencia 180002, Colombia
3
Centro de Investigaciones Amazónicas CIMAZ Macagual Cesar Augusto Estrada González, Grupo de Investigaciones Agroecosistemas y Conservación en Bosques Amazonicas-GAIA, Universidad de la Amazonia, Florencia 180002, Colombia
4
CATIE-Centro Agronómico Tropical de Investigación y Enseñanza, Turrialba 30501, Costa Rica
5
Programa de Ingeniería Agroecológica, Facultad de Ingeniería, Universidad de la Amazonia, Florencia 180002, Colombia
6
Facultad de Ciencias Agropecuarias, Universidad Nacional de Córdoba, Córdoba X5000HUA, Argentina
*
Author to whom correspondence should be addressed.
Sustainability 2022, 14(2), 743; https://doi.org/10.3390/su14020743
Submission received: 6 December 2021 / Revised: 4 January 2022 / Accepted: 5 January 2022 / Published: 10 January 2022

Abstract

:
Coffee cultivation is one of the main agricultural activities in Colombia, which increases the well-being of coffee-growing families. In order to determine the impact of coffee production, the capital endowment and well-being of coffee-growing families in the municipality of Pitalito, in the south of Colombia, were analyzed using the community capital index (CCI). Likewise, the relationships between the variables were identified through a Pearson correlation analysis, and the increase in well-being was identified and modeled by employing structural equations. The structural equation model showed a suitable fit to the data, indicated by the non-significant value of the χ2 statistic (p = 0.85), a high CFI (0.97), a low RMSEA (<0.001), a low stability index (0.23) and a low variance inflation factor (VIF = 1.42). At the capital level, political capital in synergy with social capital increased the well-being of coffee-growing families; meanwhile, capitals such as natural and physical-built capital did not have the greatest impact on well-being. Political capital variables such as the “possession of the coffee identification card” (CPI), as well as the variable “participates in the activities carried out by the community action board of the village” (PAC), increased by 9.9% and 8.66%, respectively, in the well-being of coffee-growing families measured by the CCI. The social capital variables that boosted the CCI were the benefits of the National Federation of Coffee Growers (FNC) (BFN, %V(variation): 8.32) and associativity (Aso, %V: 7.51). Other variables that make up human capital with high incidence in the CCI were family size (FSi) and the number of people who can read in the family (FLE) with a variation of 9.12% and 8.6%, respectively. However, other variables such as labor cost for disease management (CDM) and labor cost for harvesting (HCL) had no significant effect on the variation of the CCI. It was found that the level of well-being increases due to variables such as associativity and participation in grassroots organizations in the community, such as being a member of the National Federation of Coffee Growers, a quality represented by the possession of a coffee identification card that, in synergy with other variables, reduce inequality and poverty.

1. Introduction

World coffee production amounted to 169.6 million coffee bags (60 kg each) for 2020/21, and around 125 million people worldwide depending on this activity for their livelihood [1]. Coffee production in Colombia, one of the three largest coffee producers, amounted to 8.9% of the world’s total [1] in 2020. About 540,362 coffee producers were registered in the same year, living in 483,389 households, for a total population of 1,498,526 people across 23 departments [2,3] and contributing to 0.9% of total GDP (11% of total agricultural GDP) [4]. Due to the importance of coffee cultivation in Colombia, different studies have been carried out related to the characterization of coffee growing families [5,6,7,8], and in particular, an indicator has been generated that measures the well-being of coffee families called the community capital index (CCI) [9] that considers the endowment of the different capitals of the community [10,11,12].
The community capital index (CCI) is described as “the flow of assets through capitals” and allows a comparison of well-being in coffee farming families in southern Colombia, mainly due to the synergy between social and political capital [9]. These capitals enable the construction of assets upon assets, which led to the effect of an “upward spiral” [11]. The analysis of capitals and the variables that shape them, as a key livelihood process and mechanism, can provide evidence or characteristics that allow determining the differences between households [9,13,14]; therefore, they can describe how the endowment, synergy and flow between capitals contribute to the development of families and the community in general [15,16,17]. This knowledge of capital endowment, in general, allows us to prepare for sustainable livelihoods in order to reduce the impacts of shocks and stresses [18] and to better understand how to increase the well-being [19] of coffee-growing families.
Working with coffee farming families, the capital endowment has been a way to measure market participation [20], the impact of coffee certification programs [21] and fair trade [22]. Likewise, capitals have been used to determine the effects of on-farm diversification strategies on food security [13,23] and the adoption of agricultural practices in response to different environmental and economic conditions [14]. However, few studies have examined and explained how the different variables that make up the capitals and how the capitals themselves, in synergy with the other capitals, are responsible for increasing welfare [23,24,25]. In this sense, households have been found to combine capital assets, a process that involves human action and resourcefulness, to build livelihood strategies that can increase well-being [9,23]. Thus, understanding asset endowments and interactions become a central element of frameworks for conceptualizing and analyzing livelihoods.
Several studies have shown that improving the state of household food security, well-being, quality of life and sustainability requires the role of a capital or several capitals in synergy; for example, social capital has been described as increasing the level of food security [26,27,28]. However, social capital alone is insufficient; therefore, it must be accompanied by human capital [28] and political capital [9] to potentiate the increase of capacities in families and the community. Other studies have reported the importance of human capital, where specifically the level of education contributed directly to farmers’ environmental awareness [15]. Moreover, recent approaches propose additional capitals such as psychological capital, which effectively promotes the performance of human capital and physical-constructed capital with significant impacts on livelihoods [16]. Finally, asset-poor households have been shown to be more dependent on natural resources (natural capital) [29], therefore rural households with limited or no access to natural resources are particularly more vulnerable [30].
In the present study, we aim to evaluate and determine, through the “upward spiral” process [11], the driving variables within each capital that increase the welfare of coffee farming families in southern Colombia using the structural equation modeling (SEM) approach. These equations have been used to explore the key factors (variables) and capitals that affect livelihoods [15,31,32,33,34], allowing simultaneous measurement of interactions and their pathways for multiple independent variables with a dependent variable. This type of analysis considers unmeasurable latent variables (each capital) made up of a group of variables to explain the community capital index (CCI). Recently, different studies have been presented in which structural equation modeling (SEM) has been applied to livelihood approaches at different scales. For example, Sarkar et al. [35] with the use of SEM identified different indicators for sustainable agriculture from the perspective of agriculture in a developing country. Likewise, using SEMs, the effect of political economy factors (structure, institution and actor) on the sustainability and livelihoods of communities in the lowlands of Indonesia has been understood [36], the effects of rural site conditions and household subsistence capital on agricultural land transfers in China have also been explored [37], and the factors affecting the resilience of agricultural drought to food insecurity of livestock farmers in the Northern Cape province of South Africa have been identified [38]. Therefore, the analysis approach using SEM allows to identify and geographically differentiate the influences of agricultural systems on food security and can adapt any spatial unit, geographic disaggregation and type of data [39].
Therefore, the objective of this study was to determine, through a structural equation model, how subsistence capital contributes to the well-being of coffee-growing households in southern Colombia. To address this objective, we proposed to answer the following questions: (i.) What is the level of the relationship between the variables that make up the capitals? (ii.) What is the synergy between different capitals and their relationship with the CCI of coffee households? (iii.) What variables of each capital affect the CCI in the coffee households in the upward or downward spiral? (iv.) Which variables of each capital affect the CCI in the coffee households in the upward or downward spiral? It is expected that some variables that make up the capitals, or the capitals themselves, have a greater incidence on the welfare measured by the CCI. The information generated provides new knowledge to design policies that promote the management of capitals and specifically the variables that improve the welfare of coffee-growing families based on the variables that have the ability to mobilize well-being identified from structural equation models.

2. Materials and Methods

2.1. Study Area and Data Collection

The Colombian massif includes different municipalities in southern Colombia, including Pitalito (1°51′07″ North Latitude and 76°02′14″ West Longitude), located in the southern part of the department of Huila. The municipality of Pitalito stands out for having the largest area planted and harvested coffee at the national level [40]. Due to its spatial location, the coffee cup has very special sensory attributes [41], a situation that makes it more desirable in the international market. In addition to cultivating the Colombia variety, which is the most widely planted among the arabica coffees, there are also other varieties such as supremo, and geisha coffee, an exotic coffee with flavors of chili, pepper, lemongrass and aromatic plants.
In order to respond to our research questions, we selected families of coffee producers in the municipality of Pitalito. From the lists of the families that make up different coffee producer associations in the municipality, the production farms were classified into three strata according to the distance to Pitalito, those close (<5 km from Pitalito), those of medium distance (from 5 to 15 km) and those of greater distance (>15 km). Producers were randomly selected from the lists of families in each of the strata defined above (n = 97) proportionally to the size of the stratum (<5 km n = 28, between 5–15 km n = 54 and >15 km n = 15) and were surveyed independently.
Each family was visited at their farm and after agreeing to participate in the study, the following topics were inquired: (1) type of land tenure; (2) family characteristics; (3) land use; (4) coffee crop management; (5) coffee bean production; (6) PES (payment for environmental services); (7) coffee sales; (8) cost of production; (9) equipment and infrastructure; (10) labor; (11) associativity. Each question was related to the seven types of capital: natural, human, social, cultural, political, physical-constructed and financial [11,42,43,44,45], and with this information, the available assets were determined [9].
From a matrix of 66 variables used by Suárez et al. [9], which allowed characterizing coffee-producing households, only those variables that presented significant differences between typologies were selected (Table 1). These variables were chosen with the objective of being able to determine the contribution of the different capitals on the level of well-being of coffee-growing households in southern Colombia through a structural equation modeling approach.

2.2. Statistical Analysis

Processing of the data was carried out in three stages. First, to avoid collinearity, a correlation analysis was carried out between the 35 variables that presented significant differences between the different typologies of coffee farms in the south of Colombia described by Suárez et al. [9].
In the second stage, structural equation modeling (SEM) was carried out, which allows the hypothesis testing of linear relationships of direct and indirect effects in complex networks [46], in this case, composed of the variables of the capitals, as well as the variables that make them up [33]. The analysis with SEM has the potential to allow modeling multiple regression equations to explain the contribution of household livelihood capitals on the CCI; this index was constructed by Suárez et al. [9] to evaluate the degree of endowment and well-being of coffee families in the municipality of Pitalito. SEM has been widely used to explore different situations, for example, the effects of wetlands on people’s livelihoods [47], to characterize the interactions between farmers’ livelihoods and their environmental perceptions [15,17] and to determine the contribution of livelihoods to the sustainable development of small producers [16,33]. In SEM, variables corresponding to different community capitals were measured indirectly through latent variables (LVs [17]). These latent variables constructed within each SEM serve as the sole mediating variable and allow the SEM to test the mediating role of capital between coffee household characteristics and the CCI [34]. Based on the conceptual model and the different hypotheses proposed, the SEM was structured with an internal model (or structural model) made up of the interactions or relationships between the LVs and an external model (or measurement model) that corresponds to the characteristics of the relationships between the measured variables (Table 1) and the LVs which are specified as [17]:
x = Λxξ + δ
y = Λyn + ε
η = Bη + Γξ + ζ
where x and y are exogenous and endogenous measurable variables, respectively; ξ and η are exogenous and endogenous LVs, respectively; Λx is the ratio between x and ξ; Λy is the ratio between y and η; and δ and ε are measured residual errors for x and y, respectively. Γ are both path coefficients, where B indicates the impact between exogenous LSVs and Γ indicates the impact of exogenous LVs on endogenous latent variables; and ζ is the error term for SEMs, representing the unexplained term within SEMs.
A confirmatory factor analysis (CFA [48]) was used to determine the fit of the predefined factor model to estimate the index of each capital (LVs) from each of the standardized variables collected on coffee households [49], and from these, the community capital index (CCI) was derived. The full SEM model involved several variables from each of the capitals (Table 2).
Structural equation model fit evaluation criteria were adopted, such as maximum likelihood χ2 values, goodness-of-fit index (GFI) and root mean square error of approximation (RMSEA) [50]. RMSEA values <0.10 suggest an accepted model fit and the lowest RMSEA value indicates the best fit, and in the GFI, the cutoff criterion ≥0.90 indicates a good fit [51]. The 95% confidence intervals were used to decide whether the estimated parameters differed from zero. According to the conventional null hypothesis test, if the confidence interval did not include zero, the estimated parameters could be considered significant. Models were fitted with the cfa function of the sem package [52] of the R language version 4.0.4 [53]. Visualization of the fitted models was performed using the semPaths function of the semPlot package [54]. The R software was run in the InfoStat statistical software interface [55].
In the third stage, a sensitivity analysis [56] was carried out with each of the variables to determine and identify the most sensitive variables of each capital on the well-being of coffee families measured through the CCI. Based on the current conditions found for each of the variables in coffee families, scenarios of 100% reduction and increase of these variables and their impact on the CCI were simulated. With the different scenarios, the percentage increase of the CCI and its sensitivity to different capital variables were calculated by evaluating the slope of a linear regression model.

3. Results

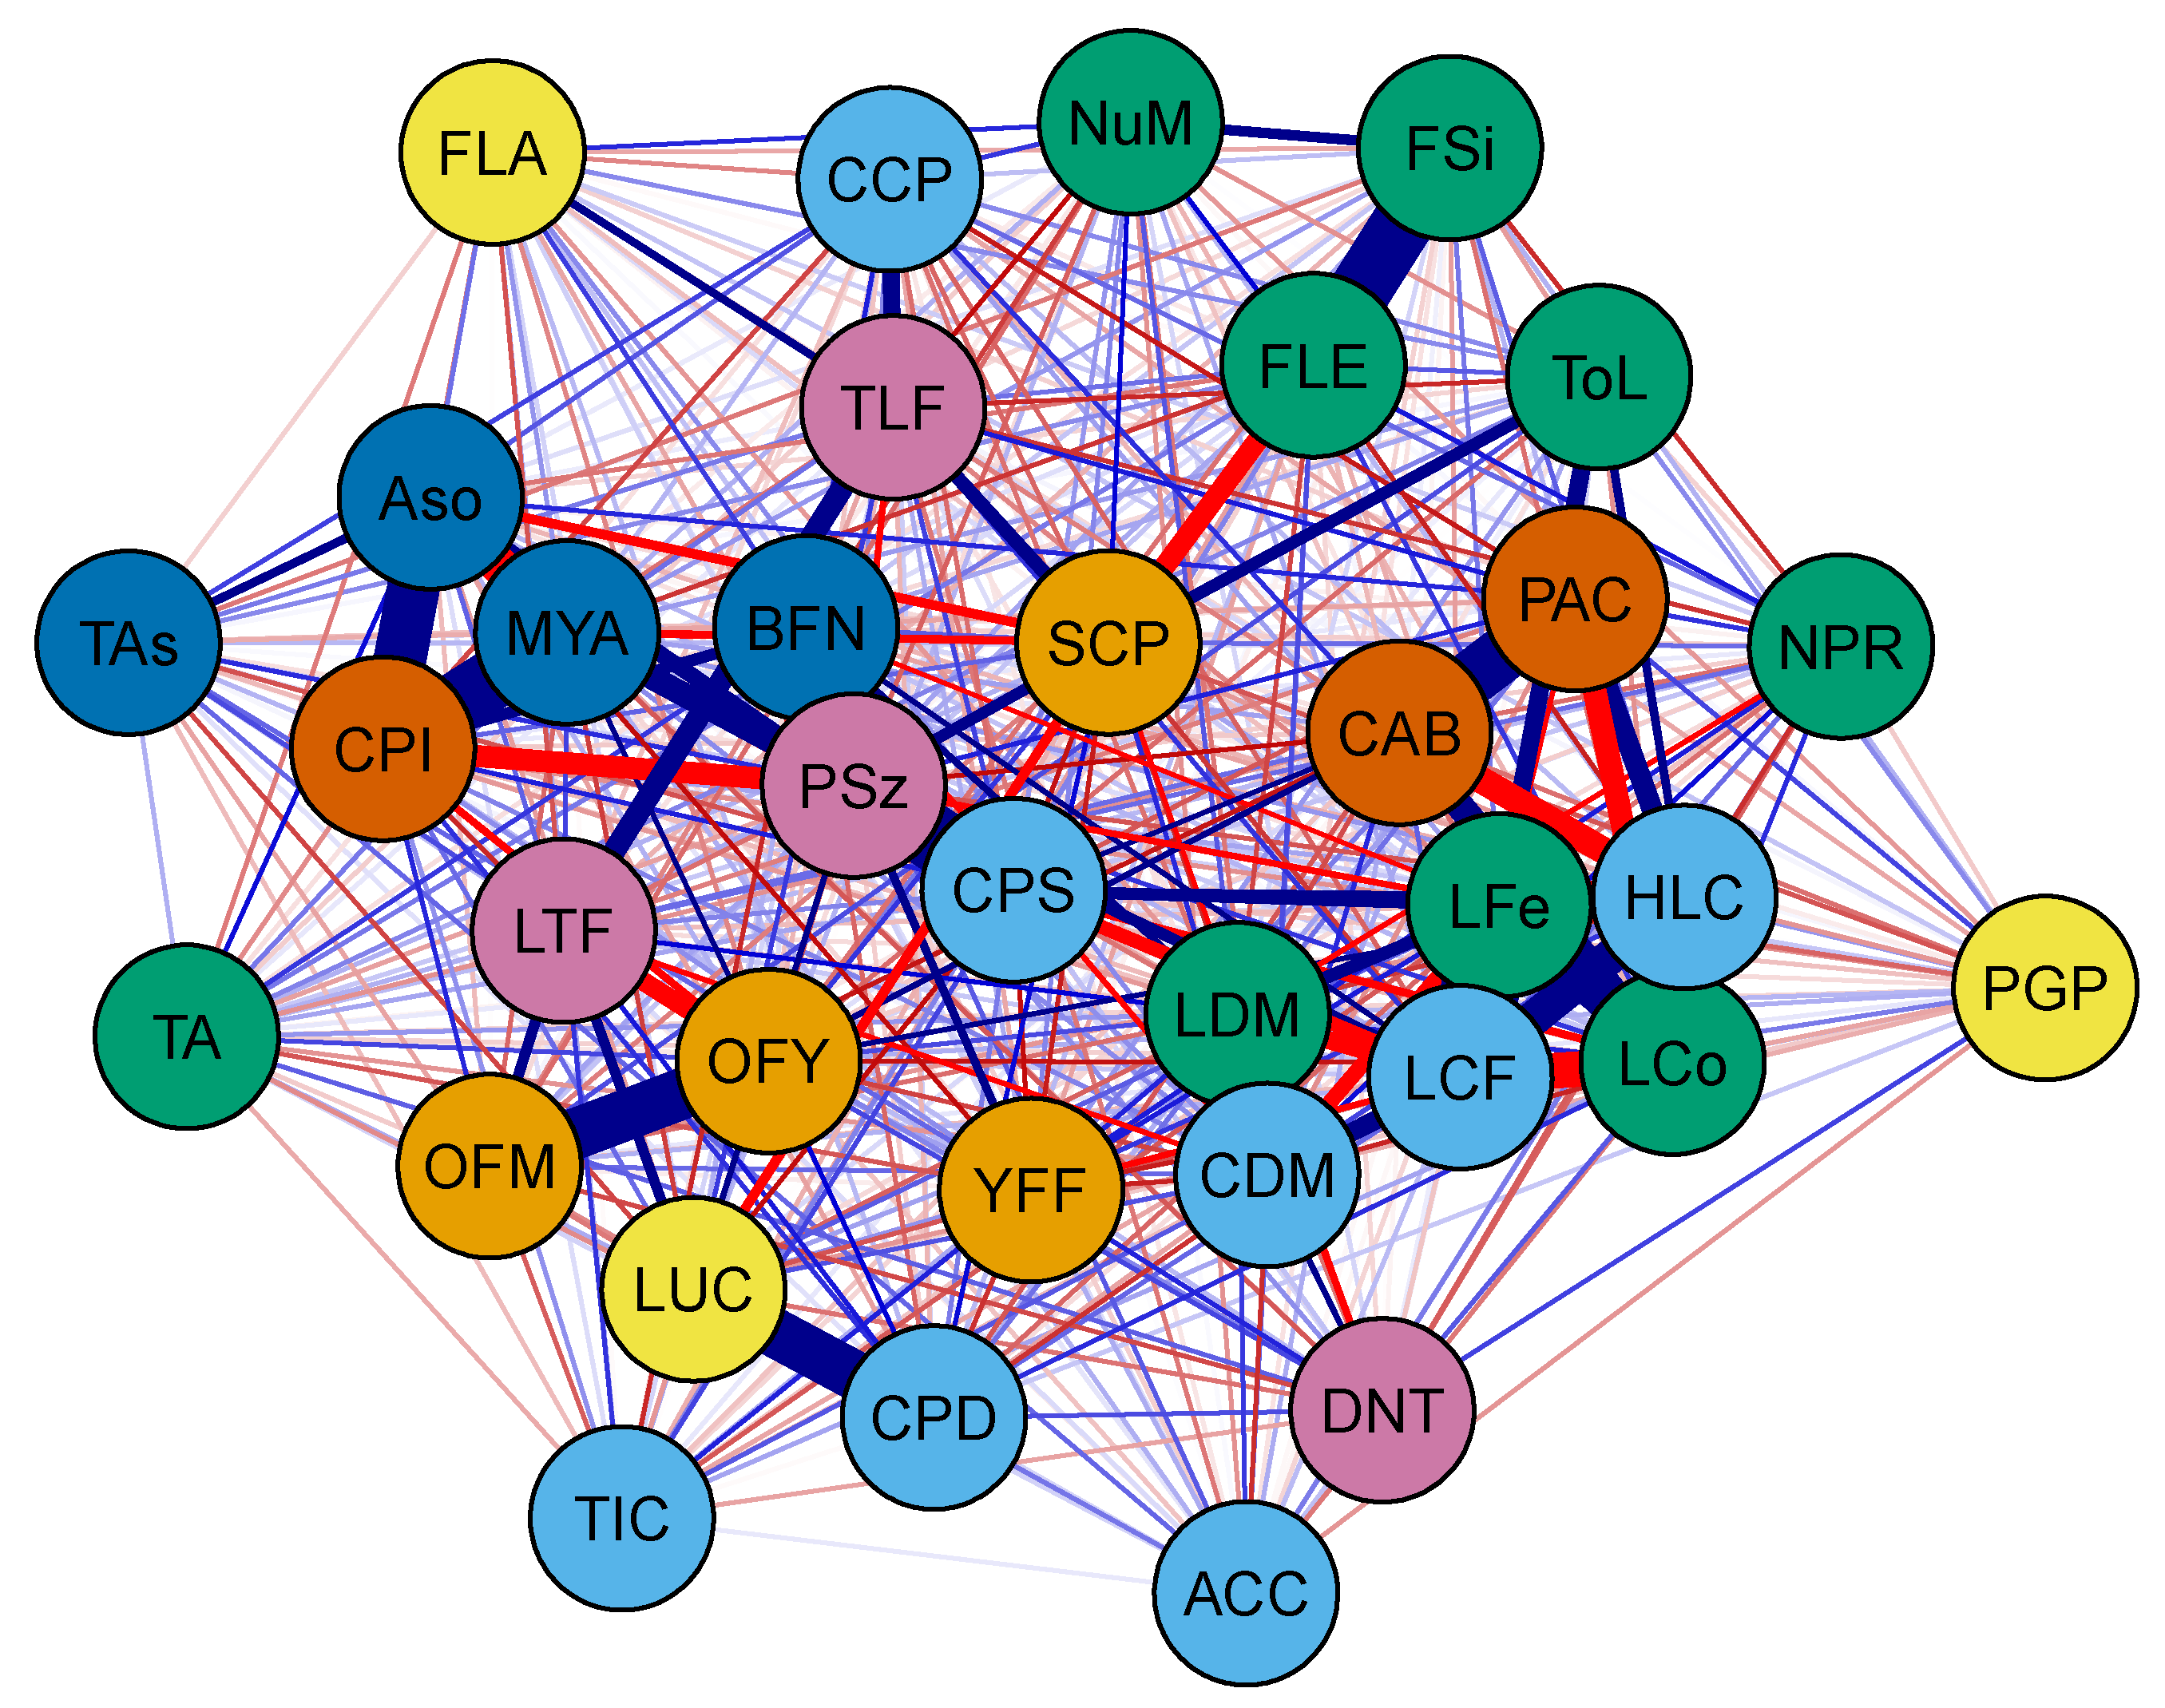
3.1. Synergies and Trade-Offs between the Variables That Make up the Capitals

Analyzing the relationships between the variables that make up the different capitals (Figure 1), we found, for example, that the possession of a coffee ID (CPI) of the political capital presents a high positive relationship with variables of the social capital such as years of association (MYA) and associativity (Aso); however, this same variable (CPI) correlated negatively with the size of the land (PSz), a variable of the physical-constructed capital (Table 1).
PSz (size of the land) was positively correlated with CPS (cost of farm size-financial capital), contrary to that presented with CPI (possession of a coffee ID of political capital) (Figure 1). In the case of physical- constructed capital, the variable related to the level of tools on the farm (LTF) was positively and negatively correlated with cultural capital variables such as management strategies and doses of organic fertilizer type (OFY and OFM), respectively (Figure 1). Political capital variables, belonging to a community action board (CAB) and participation in activities of the community action (PAC), were found to be negatively correlated with harvesting labor costs (HLC); On the other hand, the soil conservation practices (SCP) variable of cultural capital was correlated with physical-constructed capital variables such as the technological level of the farm (TLF) or the size of the farm (PSz), but SCP was negatively correlated with the average level of education of the family (FLE) of human capital and the use of land for coffee (LUC) (Figure 1).

3.2. Structural Equation Models to Predict the Effect of Variables on the Community Capital Index (CCI)

Using SEM analysis, the relationships of the CCI with the variables of each capital were estimated (Table 2). According to the results obtained through structural equation modeling, the latent variables that significantly affected the CCI were cultural, social, political and financial capitals. The structural model represented the link and strength between the latent variables (capitals) with each of the variables that comprise it and the CCI based on the coefficient of each of the arrows that connect one oval with another (Figure 2). According to the variance inflation factor, no collinearity problems were found between the latent variables (VIF = 1.42). In general, the SEM analysis showed a good fit to the data, indicated by the non-significant value of the χ2 statistic (p = 0.85), high CFI (0.97), low RMSEA (<0.001) and low stability index (0.23).
According to the results obtained, we found that only the variable fertilization labor per year (LFe) of human capital was significant in the model (p < 0.05); the same occurred with cultural capital with variables management of organic fertilizer type (OFM) and organic fertilizer dose per year (OFY). Likewise, technical assistance (TA), being a beneficiary of the National Federation of Coffee Growers (BFN) and being associated (Aso), variables of social capital, presented a significant effect in the model (p < 0.05). Of political capital, all the variables presented a significant effect in the model (p < 0.05). Finally, of the eight financial capital variables initially considered, only the cost of farm size (CPS), coffee production (CPD) and income from total coffee sales (TIC) had a significant effect on the model (p < 0.05).

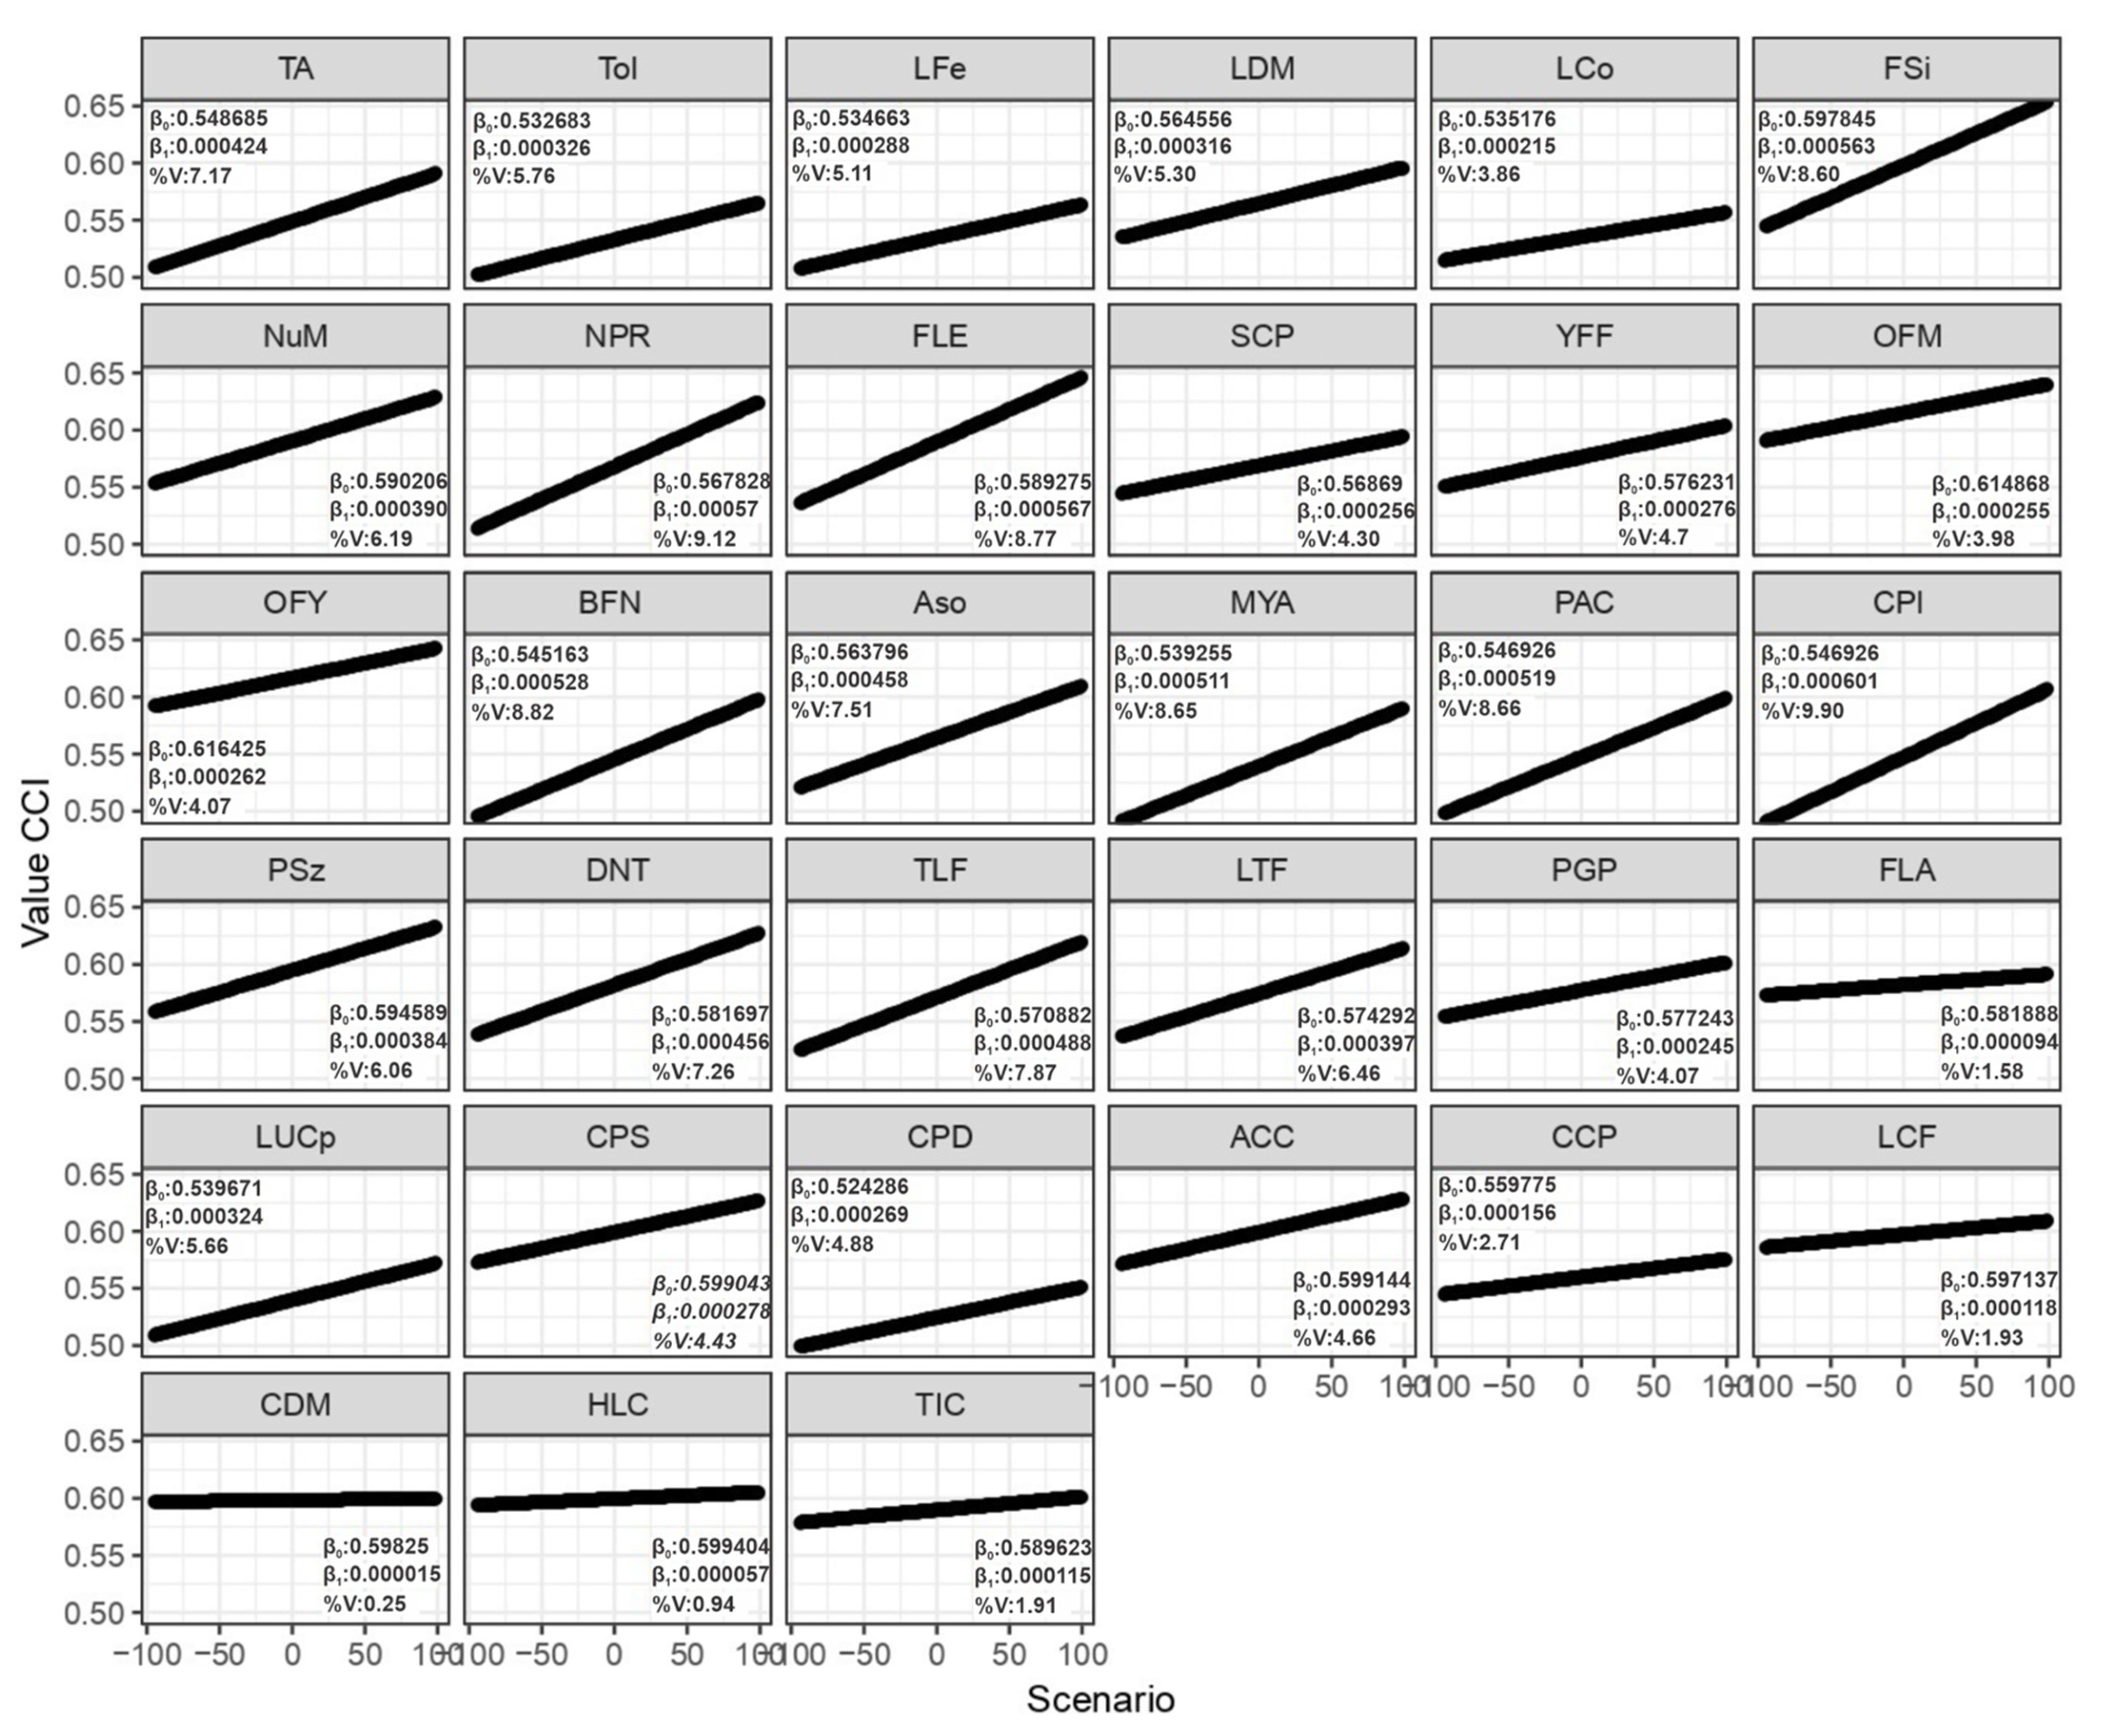
3.3. Sensitivity Analysis of Each Variable on the Community Capital Index

From the linear regression, the variation (%) of the community capital index (CCI) was modeled and the slope (B1) with which the CCI varies when decreasing or increasing each variable was obtained (Figure 3). It was found that the possession of the coffee identification card (CPI) as well as the variable “participates in the activities carried out by the communal action board of the village” (PAC) had an impact of 9.9% and 8.66%, respectively, in the variation of the CCI, being the previous variables with the greatest capacity to mobilize the well-being of the coffee-growing families that correspond in their totality to variables of political capital. Likewise, variables of the social capital that boosted the CCI were: (i.) benefits of the FNC (National Federation of Coffee Growers %V: 8.32 BFN); (ii.) associativity (%V: 7.51 Aso); and (iii.) other variables that make up human capital with a high incidence on the CCI were the size of the family (FSi) and the number of people who can read in the family (FLE) with a variation of 9.12% and 8.6%, respectively. However, other variables such as labor cost for disease management (CDM) and labor cost for harvesting (HCL) did not significantly affect the variation of the CCI.

4. Discussion

In this study, we evaluated how the different variables that make up the capitals impact the community capital index (CCI), generating important information to make decisions aiming to improve the well-being of coffee-growing families. Political and social capital allowed increasing the well-being of coffee-growing families, while capitals such as natural and physical-constructed capital exhibited minor impact.

4.1. Driving Variables of Well-Being in Coffee-Growing Families

Based on the results obtained from the structural equation models and supported by the sensitivity analysis, we found that there are five crucial variables that allow the increase of the well-being of coffee-growing families. Among them are (i.) associativity, which is related to (ii.) participation in community action boards and (iii.) years of seniority in the associations, as well as being part of it, (iv.) being associated with the National Federation of Coffee Growers, as well as (v.) the possession of the coffee identification card, which is a document that represents the member of the federation; variables that are part of the political and social capital. These variables, together with others such as the level of education and the size of the families and the attendance to training, when in synergy, constitute the basis for the increase in the well-being of coffee-growing families.
For example, associativity allows achieving the degree of cooperation or the tendency to solidarity of individuals who are in the framework of a process, a very common situation in coffee families in Colombia [57,58]. These authors agree with our results since they show that the most important figures of associativity are the participation in the community action boards of the village and the coffee growers’ committees, spaces where they can elect and be elected; likewise, there are the coffee growers’ cooperatives which are a business structure for the commercialization of the grain and correspond to the majority buyers in the coffee municipalities.
Cooperatives are a prevalent form of associativity in different regions of the world [59,60,61], where it has been found that the associativity allows the development of different values such as leadership and transparency [55,56], allowing the creation of capacities at the local level [62,63,64] mainly related to marketing, financial education, conflict resolution and teamwork [3], which translates into the reduction of risk at the economic level [60]. Therefore, as mentioned by Bono and Loopmans [59], cooperatives are responsible for the well-being of their members and their families: cooperatives work to meet the material, social, educational, cultural and spiritual needs of their members and families, consistent with what was found in our study. In this sense and based on the theory of the “upward spiral” [11], cooperatives are a means to enhance the synergies of political capital with social capital and increase well-being [9], they are a catalytic means of solidarity in different socio-spatial dimensions [59] through which most of the state aid for coffee families is channeled, as well as the adoption of new technologies [65]. This is why the National Federation of Coffee Growers of Colombia has as a policy the strengthening of marketing services to complement the work of cooperatives in the purchase guarantee service in the territory [3]. The figure of commercialization presented in the studied area, which currently corresponds to the municipality with the highest production of coffee in Colombia [66].
Likewise, the possession of the coffee identification card is a document that not only identifies the coffee grower as a member of the largest trade organization in Colombia [67], but is also an instrument that allows the member to be able to commercialize their coffee at stable prices as well as carry out banking transactions. The coffee identification card became a bank account with all the services of a transactional account with preferential rates [2], achieving the banking of 75% of the guild, that is to say, more than 385,000 coffee growers [3]. It is also a means to mobilize and allocate economic resources to attend to different emergencies such as winter waves or the last pandemic caused by COVID19. Therefore, our study demonstrates the importance of this document for the improvement of the well-being of coffee-growing families in Colombia, which can be an instrument that can be applied to other coffee-producing countries.
In order to achieve the above, the coffee producer must have basic conditions such as having a certain level of education and attending training (human capital variables). The above conditions allow the decision-maker on the farm to interact and collaborate with the exchange of information or experiences, since based on the degree of knowledge, different management factors can be considered, for example, those related to organic or environmentally friendly practices [68], an exchange of information that can also have an impact on the supply of different services that the coffee plantation can provide [69]. In addition to impacting the environment, these types of practices have allowed the product to be positioned with different organic certifications, which has increased the sale price of the coffee. In this sense, it has been identified that one of the factors that influence the commercialization of specialty coffees is the level of education [70,71], which can benefit small producers in being able to know the quality of the coffee they are commercializing, this being a collaborative process that can generate a sense of equity between the seller (producer) and buyer (roaster) [72].
In the Colombian coffee context, Echavarría et al. [73] highlighted that the high vulnerability of coffee families is related, among other factors, to the level of education. According to the Sisbén (System for the Identification of Potential Beneficiaries of Social Programs), which allows classifying the population according to their living conditions and income, by 2020, 54.4% of coffee producers are in poverty or vulnerable to poverty: 15.6% of coffee producers are in extreme poverty, 25% in moderate poverty and 13.8% are vulnerable to being poor [3]. This is related to the fact that 10.7% of the members of coffee growing households reported having no formal education at all, 57.0% had barely attained primary education, 27.6% had attained secondary and middle school education and only 2.8% had higher education. The average years of education per person is 4.6 years in coffee-growing households, while at the national rural level, it is 5.1 years. Additionally, illiteracy among coffee growers is 9.4%, while at the national rural level, it is 12.4%. These figures reflect that coffee-growing families have a lower level of illiteracy but the average years of education remains very low, as well as the national rural level. In view of this situation, and as identified by the National Federation of Coffee Growers of Colombia, the challenge is to continue working to achieve better well-being for coffee growers by increasing education [2,74], a situation that coincides with our results.

4.2. Synergies and Compensations of Capital to Increase the Well-Being of Coffee Families

Different studies have explored the ways in which assets are related, mobilized and opportunities available to coffee families are used to increase well-being finding that the lack of access to assets prevents individuals and households from engaging in strategies that generate more benefits at the societal level [15,17,61]. A common situation where poorer households do not have sufficient capital assets to reconfigure their livelihoods toward goals beyond basic survival, therefore, it is necessary to prioritize the families with the lowest levels of capital endowment described by Suárez et al. [9], which correspond to the “small conventional” type of coffee family that depend economically on the sale of their labor to satisfy other basic needs, in addition to coffee.
In this sense, it is necessary to recognize a meshing or synergy between capitals to increase the well-being of coffee households [9]. For example, social capital is configured to covary with financial capital, meaning that the greater the trust of coffee growing families with organizations such as cooperatives, the coffee grower can ensure financial control as they can sell coffee at stable prices or manage to have credit for the purchase of inputs and materials [75]. Additionally, social capital is considered an important factor in building social norms and financial capital, which influences the adoption of sustainable agricultural practices by farmers [76,77]. These findings confirm that the implementation of technological innovations in the agricultural sector that improve productivity in the field contributes to increased farmer well-being [65], but this adoption is influenced by their perception of social pressure and their abilities to perform sustainable agriculture, as a consequence of the level of education, attendance to training and level of technical assistance on the farm [78].
Coffee households with higher social capital prefer to invest more assets and adopt different agricultural production practices to cope with livelihood pressure [79], as social pressure is lower than economic pressure. Faced with this situation, households coordinate adjustment strategies to increase well-being, as it is more resilient to social capital compared to economic capital. One strategy in response to market prices is certification, which has reduced poverty [80,81], but most farmers cannot break even, regardless of their certification status [82]. By relating the variables that make up the capitals, for example, farmers who are members of an organization can have access to more information, updated practices and knowledge as part of the social capital that has an impact on financial capital since improving quality and with certified standards, they can enter specialized markets and receive higher prices for coffee with certification premiums. On the other hand, in our study and based on the results of the structural equations, political capital has an impact on households so that they can escape from poverty, increasing to a certain extent the level of well-being through economic organizations such as farmers’ cooperatives, since it supports the development of livelihoods in terms of technology, capacity and funds. Coffee families belonging to a farmer organization have been found to perceive less risk to market conditions [83].

4.3. Policy Implications for Improving the Well-Being of Coffee Families

In well-being, assessments are often conducted with economic indicators for objective well-being, but little is known about comprehensive well-being, especially subjective well-being, which reflects social and cultural effects. In our study, we have clearly and precisely demonstrated the magnitude of change of motor variables on well-being as measured by the community capital index (CCI). It was found that only the possession of a coffee identification card and the participation in organizations at the level of village and guild organizations allows an increase of more than 8%. In this sense, the importance of the possession and use of this digital device that opens the doors to many banking benefits (discounts, credits, transactions, among others) for coffee growing families should be demonstrated more widely. Likewise, at the government level, emphasis should be placed on expanding the channels for rural households to increase their income by increasing technical and vocational training in order to improve their financial capital and reduce their economic pressure by increasing their income [2,32,57,61].
It has been shown that in southern Colombia, coffee families have unequal conditions [9] and the cause of this is the low endowment of capitals such as social capital, as it has been observed that this would aggravate inequality [61]. Therefore, emphasis should be placed on strengthening social capital, which requires physical-constructed capital to produce positive synergies and reduce poverty. In general, we mentioned that coffee-growing families worldwide are very vulnerable to different factors and conditions such as price volatility and current climate variability conditions; therefore, based on our results, we suggest working on increasing social and political capital to increase well-being. For this, specific interventions are necessary for variables such as associativity and participation in grassroots organizations in the community, such as being a member of the National Federation of Coffee Growers, a quality represented by the possession of a coffee identification card.

5. Conclusions

In this study, we determined through a structural equation model how livelihood capital contributes to the well-being of coffee-growing households in southern Colombia. We found a high relationship between different variables as well as between capitals, specifically between the social and political capitals in synergy with the others having the capacity to increase the level of well-being of coffee growing families as measured by the community capital index (CCI). It is necessary to work specifically on increasing and strengthening the associativity of coffee growing families at different levels (community action boards, coffee grower committees) that allow the channeling of different benefits through the possession of the coffee identification card, a document that identifies the coffee grower as well as being part of the National Federation of Coffee Growers, a quality represented by the possession of a coffee identification card.

Author Contributions

Conceptualization, A.E.S.; I.G.-M.; F.A.O.-M.; J.C.S.; J.D.R. and F.C.; methodology, A.E.S.; I.G.-M.; F.A.O.-M.; J.C.S.; J.D.R. and F.C.; software, J.C.S.; J.D.R. and F.C.; validation, J.C.S.; J.D.R. and F.C.; formal analysis, A.E.S.; I.G.-M.; F.A.O.-M.; J.C.S.; J.D.R. and F.C.; investigation, A.E.S.; resources, A.E.S.; data curation, A.E.S.; J.C.S. and F.C.; writing—original draft preparation, A.E.S. and J.C.S.; writing—review and editing, A.E.S.; I.G.-M.; F.A.O.-M.; J.C.S.; J.D.R. and F.C.; visualization, A.E.S. and J.C.S.; supervision, A.E.S.; I.G.-M.; F.A.O.-M.; J.C.S.; J.D.R. and F.C.; project administration, A.E.S.; funding acquisition, A.E.S. All authors have read and agreed to the published version of the manuscript.

Funding

This research received no external funding.

Institutional Review Board Statement

Not applicable.

Informed Consent Statement

Not applicable.

Data Availability Statement

Relevant data applicable to this research are within the paper.

Conflicts of Interest

The authors declare no conflict of interest.

References

  1. ICCO. Trade Statistics Tables: Coffee Production by Exporting Countries; ICCO: Abidjan, Côte d’Ivoire, 2021. [Google Scholar]
  2. FNC. Federación Nacional de Cafeteros de Colombia. Demografía, inclusión social y pobreza de los hogares cafeteros (1993–2020). Ens. Sobre Econ Cafe 2021, 34, 7–34. [Google Scholar]
  3. FNC. Federación Nacional de Cafeteros de Colombia. Caracterización ambiental del sector cafetero en Colombia. Ens. Sobre Econ Cafe 2021, 34, 51–73. [Google Scholar]
  4. Departamento Nacional de Estadistica DANE (2020). Cuentas Nacionales Año 2020, Información Consolida de PIB. Colombia. Available online: https://www.dane.gov.co/index.php/estadisticas-por-tema/cuentas-nacionales/cuentas-nacionales-trimestrales/historicos-producto-interno-bruto-pib (accessed on 6 December 2021).
  5. Jurado, H.R.O.; Estrada, J.F.N.; Possú, W.B. Tipificación de sistemas de producción de café en La Unión Nariño, Colombia. Temas Agrar. 2019, 24, 53–65. [Google Scholar] [CrossRef] [Green Version]
  6. Escobar, H.C.; Burbano, T.C.L.; Ibarra, T.B.; Belalcazar, J.A.M. Caracterización de los sistemas productivos de café en Nariño, Colombia. Rev. UDCA Actual. Divulg. Científica 2016, 19, 105–113. [Google Scholar]
  7. Suarez, A.E.; Suárez, J.C.; Ordoñez, C.M. Caracterización del estado actual de los capitales de la comunidad en el marco de los medios de vida en familias cafeteras en el sur de Colombia. Momentos Cienc. 2013, 10, 97–111. Available online: http://www.uniamazonia.edu.co/revistas/index.php/momentos-de-ciencia/article/view/258 (accessed on 16 November 2021).
  8. Dussán, L.; Duque, H.; González, J. Caracterización Tecnológica De Caficultores De Economía Campesina, De Los Principales Municipios Cafeteros De Colombia. Cenicafé 2006, 57, 167–186. Available online: https://biblioteca.cenicafe.org/handle/10778/204 (accessed on 16 November 2021).
  9. Suárez, A.E.; Gutiérrez-Montes, I.; Ortiz-Morea, F.A.; Ordoñez, C.; Suárez, J.C.; Casanoves, F. Dimensions of social and political capital in interventions to improve household wellbeing: Implications for coffee-growing areas in southern Colombia. PLoS ONE 2021, 16, e0245971. [Google Scholar] [CrossRef] [PubMed]
  10. Scoones, I. Livelihoods Perspectives and Rural Development. J. Peasant. Stud. 2009, 36, 171–196. [Google Scholar] [CrossRef]
  11. Emery, M.; Fey, S.; Flora, C. Using Community Capitals to Develop Assets for Positive Community Change. CD Pract. 2006, 13, 1–19. Available online: https://scholar.google.es/scholar?hl=es&as_sdt=0%2C5&q=Using+community+capitals+to+develop+assets+for+positive+community+change.+&btnG= (accessed on 16 November 2021).
  12. Van Dillen, S. Rural Livelihoods and Diversity in Developing Countries. J. Dev. Econ. 2003, 70, 248–252. Available online: https://books.google.es/books?hl=es&lr=&id=gCKQs-3NKhUC&oi=fnd&pg=PR9&dq=Rural+livelihoods+and+diversity+in+developing+countries&ots=vXQf5xklki&sig=GaFllsOxbJxwH_8MIm6Xg8lSudE#v=onepage&q=Rurallivelihoodsanddiversityindevelopingcountries&f=false (accessed on 16 November 2021). [CrossRef]
  13. Anderzén, J.; Luna, A.G.; Luna-González, D.V.; Merrill, S.C.; Caswell, M.; Méndez, V.E.; Jonapá, R.H.; Cacho, M.M.Y.T.G. Effects of on-farm diversification strategies on smallholder coffee farmer food security and income sufficiency in Chiapas, Mexico. J. Rural. Stud. 2020, 77, 33–46. [Google Scholar] [CrossRef]
  14. Jezeer, R.E.; Verweij, P.; Boot, R.G.; Junginger, M.; Santos, M.J. Influence of livelihood assets, experienced shocks and perceived risks on smallholder coffee farming practices in Peru. J. Environ. Manag. 2019, 242, 496–506. [Google Scholar] [CrossRef] [PubMed] [Green Version]
  15. Dang, X.; Gao, S.; Tao, R.; Liu, G.; Xia, Z.; Fan, L.; Bi, W. Do environmental conservation programs contribute to sustainable livelihoods? Evidence from China’s grain-for-green program in northern Shaanxi province. Sci. Total Environ. 2020, 719, 137436. [Google Scholar] [PubMed]
  16. Li, W.; Shuai, C.; Shuai, Y.; Cheng, X.; Liu, Y.; Huang, F. How Livelihood Assets Contribute to Sustainable Development of Smallholder Farmers. J. Int. Dev. 2020, 32, 408–429. Available online: https://onlinelibrary.wiley.com/doi/full/10.1002/jid.3461 (accessed on 16 November 2021). [CrossRef]
  17. Guo, S.; Lin, L.; Liu, S.; Wei, Y.; Xu, D.; Li, Q.; Su, S. Interactions between sustainable livelihood of rural household and agricultural land transfer in the mountainous and hilly regions of Sichuan, China. Sustain. Dev. 2019, 27, 725–742. Available online: https://onlinelibrary.wiley.com/doi/full/10.1002/sd.1937 (accessed on 16 November 2021). [CrossRef]
  18. Kwazu, G.; Chang-Richards, A.Y. A metric of indicators and factors for assessing livelihood preparedness: A systematic review. Int. J. Disaster Risk Reduct. 2021, 52, 101966. [Google Scholar] [CrossRef]
  19. King, M.F.; Reno, V.F.; Novo, E.M.L.M. The Concept, Dimensions and Methods of Assessment of Human Well-Being within a Socioecological Context: A Literature Review. Soc. Indic. Res. 2013, 116, 681–698. Available online: https://link.springer.com/article/10.1007/s11205-013-0320-0 (accessed on 1 January 2022). [CrossRef]
  20. Donovan, J.; Poole, N. Changing asset endowments and smallholder participation in higher value markets: Evidence from certified coffee producers in Nicaragua. Food Policy 2014, 44, 1–13. [Google Scholar] [CrossRef] [Green Version]
  21. Bray, J.G.; Neilson, J. Reviewing the impacts of coffee certification programmes on smallholder livelihoods. Int. J. Biodivers. Sci. Ecosyst. Serv. Manag. 2017, 13, 216–232. Available online: https://www.tandfonline.com/doi/abs/10.1080/21513732.2017.1316520 (accessed on 16 November 2021). [CrossRef]
  22. Jena, P.R.; Grote, U. Fairtrade Certification and Livelihood Impacts on Small-scale Coffee Producers in a Tribal Community of India. Appl. Econ. Perspect. Policy 2016, 39, 87–110. Available online: https://onlinelibrary.wiley.com/doi/full/10.1093/aepp/ppw006 (accessed on 16 November 2021). [CrossRef]
  23. Manlosa, A.O.; Hanspach, J.; Schultner, J.; Dorresteijn, I.; Fischer, J. Livelihood strategies, capital assets, and food security in rural Southwest Ethiopia. Food Secur. 2019, 11, 167–181. Available online: https://link.springer.com/article/10.1007/s12571-018-00883-x (accessed on 16 November 2021). [CrossRef] [PubMed] [Green Version]
  24. Campbell, D. Environmental change and the livelihood resilience of coffee farmers in Jamaica: A case study of the Cedar Valley farming region. J. Rural. Stud. 2020, 81, 220–234. [Google Scholar] [CrossRef]
  25. Shinbrot, X.A.; Jones, K.W.; Rivera-Castañeda, A.; López-Báez, W.; Ojima, D.S. Smallholder Farmer Adoption of Climate-Related Adaptation Strategies: The Importance of Vulnerability Context, Livelihood Assets, and Climate Perceptions. Environ. Manag. 2019, 63, 583–595. Available online: https://link.springer.com/article/10.1007/s00267-019-01152-z (accessed on 16 November 2021). [CrossRef] [PubMed]
  26. Kansanga, M.M.; Luginaah, I.; Kerr, R.B.; Lupafya, E.; Dakishoni, L. Beyond ecological synergies: Examining the impact of participatory agroecology on social capital in smallholder farming communities. Int. J. Sustain. Dev. World Ecol. 2019, 27, 1–14. Available online: https://www.tandfonline.com/doi/abs/10.1080/13504509.2019.1655811 (accessed on 16 November 2021). [CrossRef]
  27. Nosratabadi, S.; Khazami, N.; Abdallah, M.B.; Lackner, Z.; Band, S.S.; Mosavi, A.; Mako, C. Social Capital Contributions to Food Security: A Comprehensive Literature Review. Foods 2020, 9, 1650. Available online: https://www.mdpi.com/2304-8158/9/11/1650/htm (accessed on 16 November 2021). [CrossRef]
  28. Sseguya, H.; Mazur, R.E.; Flora, C.B. Social capital dimensions in household food security interventions: Implications for rural Uganda. Agric. Hum. Values 2017, 35, 117–129. Available online: https://link.springer.com/article/10.1007/s10460-017-9805-9 (accessed on 16 November 2021). [CrossRef]
  29. Fisher, M. Household welfare and forest dependence in Southern Malawi. Environ. Dev. Econ. 2004, 9, 135–154. Available online: https://www.cambridge.org/core/journals/environment-and-development-economics/article/abs/household-welfare-and-forest-dependence-in-southern-malawi/0946FD2F3AA11878053DB67D140B59FE (accessed on 16 November 2021). [CrossRef] [Green Version]
  30. Mbiba, M.; Collinson, M.; Hunter, L.; Twine, W. Social capital is subordinate to natural capital in buffering rural livelihoods from negative shocks: Insights from rural South Africa. J. Rural Stud. 2018, 65, 12–21. [Google Scholar] [CrossRef]
  31. Epanda, M.A.; Donkeng, R.T.; Nonga, F.N.; Frynta, D.; Adi, N.N.; Willie, J.; Speelman, S. Contribution of Non-Timber Forest Product Valorisation to the Livelihood Assets of Local People in the Northern Periphery of the Dja Faunal Reserve, East Cameroon. Forests 2020, 11, 1019. Available online: https://www.mdpi.com/1999-4907/11/9/1019/htm (accessed on 16 November 2021). [CrossRef]
  32. Liu, Y.; Zhang, Q.; Liu, Q.; Yan, Y.; Hei, W.; Yu, D.; Wu, J. Different Household Livelihood Strategies and Influencing Factors in the Inner Mongolian Grassland. Sustainability 2020, 12, 839. Available online: https://www.mdpi.com/2071-1050/12/3/839/htm (accessed on 16 November 2021). [CrossRef] [Green Version]
  33. Marulanda, L.P.; Lavelle, P.; Jepsen, M.R.; Castro-Nunez, A.; Francesconi, W.; Camilo, K.; Vanegas-Cubillos, M.; Romero, M.A.; Suárez, J.; Solarte, A.; et al. Farmscape Composition and Livelihood Sustainability in Deforested Landscapes of Colombian Amazonia. Agriculture 2020, 10, 588. Available online: https://www.mdpi.com/2077-0472/10/12/588/htm (accessed on 16 November 2021). [CrossRef]
  34. Shah, S.H.; Wagner, C.H.; Sanga, U.; Park, H.; Demange LHM de, L.; Gueiros, C.; Niles, M.T. Does Household Capital Mediate the Uptake of Agricultural Land, Crop, and Livestock Adaptations? Evidence From the Indo-Gangetic Plains (India). Front. Sustain. Food Syst. 2019, 30, 1. [Google Scholar]
  35. Sarkar, A.; Azim, J.A.; Asif AAl Qian, L.; Peau, A.K. Structural equation modeling for indicators of sustainable agriculture: Prospective of a developing country’s agriculture. Land Use Policy 2021, 109, 105638. [Google Scholar] [CrossRef]
  36. Purnomo, H.; Kusumadewi, S.D.; Ilham, Q.P.; Puspitaloka, D.; Hayati, D.; Sanjaya, M.; Okarda, B.; Dewi, S.; Dermawan, A.; Brady, M.A. A political-economy model to reduce fire and improve livelihoods in Indonesia’s lowlands. For. Policy Econ. 2021, 130, 102533. [Google Scholar] [CrossRef]
  37. Wang, W.; Gong, J.; Wang, Y.; Shen, Y. Exploring the effects of rural site conditions and household livelihood capitals on agricultural land transfers in China. Land Use Policy 2021, 108, 105523. [Google Scholar] [CrossRef]
  38. Myeki, V.; Bahta, Y. Determinants of Smallholder Livestock Farmers’ Household Resilience to Food Insecurity in South Africa. Climate 2021, 9, 117. Available online: https://www.mdpi.com/2225-1154/9/7/117/htm (accessed on 31 December 2021). [CrossRef]
  39. Galeana-Pizaña, J.M.; Couturier, S.; Figueroa, D.; Jiménez, A.D. Is rural food security primarily associated with smallholder agriculture or with commercial agriculture? An approach to the case of Mexico using structural equation modeling. Agric. Syst. 2021, 190, 103091. [Google Scholar]
  40. Agronet. Estadísticas Agrícola 2021. Available online: http://www.agronet.gov.co. (accessed on 20 February 2021).
  41. di Donfrancesco, B.; Guzman, N.G.; Chambers, E. Similarities and differences in sensory properties of high quality Arabica coffee in a small region of Colombia. Food Res. Int. 2019, 116, 645–651. [Google Scholar] [CrossRef]
  42. Flora, C.B.; Flora, J.L. Rural communities: Legacy and change. Rural. Sociol. 2004, 69, 576. Available online: https://scholar.google.es/scholar?hl=es&as_sdt=0%2C5&q=Rural+Communities%3A+Legacy+and+Change.+Boulder+Westview+Press.+&btnG= (accessed on 16 November 2021).
  43. Gutierrez-Montes, I.; Siles, J.; Bartol, P.; Imbach, A.C. Merging a Landscape Management Planning Approach with the Community Capitals Framework: Empowering Local Groups in Land Management Processes in Bocas del Toro, Panama. Community Dev. 2009, 40, 220–230. Available online: https://www.tandfonline.com/doi/abs/10.1080/15575330903004418 (accessed on 16 November 2021). [CrossRef]
  44. Flora, C.B.; Flora, J.L.; Gasteyer, S.P. Rural Communities: Legacy + Change Rural Communities: Legacy + Change; Taylor and Francis: Abingdon-on-Thames, UK, 2018; pp. 1–488. Available online: https://www.taylorfrancis.com/books/mono/10.4324/9780429494697/rural-communities-cornelia-butler-flora-jan-flora-stephen-gasteyer (accessed on 16 November 2021).
  45. Scoones, I. Sustainable Rural Livelihoods: A Framework for Analysis. Available online: https://opendocs.ids.ac.uk/opendocs/handle/20.500.12413/3390 (accessed on 16 November 2021).
  46. Voth-Gaeddert, L.E.; Oerther, D.B. Utilizing Structural Equation Modeling in the development of a standardized intervention assessment tool. Procedia Eng. 2014, 78, 218–223. [Google Scholar] [CrossRef] [Green Version]
  47. Aazami, M.; Shanazi, K. Tourism wetlands and rural sustainable livelihood: The case from Iran. J. Outdoor Recreat. Tour. 2020, 30, 100284. [Google Scholar] [CrossRef]
  48. Rosseel, Y. lavaan: An R Package for Structural Equation Modeling and More Version 0.5-12 (BETA). 2012. Available online: http://cran.r-project.org/ (accessed on 16 November 2021).
  49. Hoyle, R.H. Handbook of Structural Equation Modeling; Guilford Press: New York, NY, USA, 2012. [Google Scholar]
  50. Grace, J.B. Structural Equation Modeling and Natural Systems; Cambridge University Press: New York, NY, USA, 2006. [Google Scholar]
  51. Hooper, D.; Coughlan, J.; Mullen, M. Structural Equation Modelling: Guidelines for Determining Model Structural Equation Modelling: Guidelines for Determining Model Fit Fit. Electron. J. Bus. Res. Methods 2008, 6, 53–60. Available online: https://arrow.tudublin.ie/buschmanart (accessed on 16 November 2021).
  52. Fox, J.; Nie, Z.; Byrnes, J.; Culbertson, M.; DebRoy, S.; Friendly, M.; Goodrich, B.; Jones, R.; Kramer, A.; Monette, G.R.-C. Sem: Structural Equation Models. R Package Version 3.1-11. 2021. Available online: https://cran.r-project.org/package=sem (accessed on 16 November 2021).
  53. R Development Core Team. R: The R Project for Statistical Computing. In Foundation for Statistical Computing; Austria, V., Ed. 2021. ISBN 3-900051-07-0. Available online: https://www.r-project.org/ (accessed on 6 December 2021).
  54. Epskamp, S. semPlot: Unified Visualizations of Structural Equation Models. Struct. Equ. Model. A Multidiscip. J. 2015, 22, 474–483. Available online: https://www.tandfonline.com/doi/abs/10.1080/10705511.2014.937847 (accessed on 16 November 2021). [CrossRef]
  55. Di Rienzo, J.A.; Casanoves, F.; Balzarini, M.; Gonzalez, L.; Tablada, M.; Robledo, C.W. Infostat—Software Estadístico. InfoStat Versión 2019; Centro de Transferencia InfoStat, FCA, Universidad Nacional de Córdoba: Córdoba, Argentina, 2019; Available online: https://www.infostat.com.ar/ (accessed on 17 November 2021).
  56. Kiruki, H.; van der Zanden, E.H.; Zagaria, C.; Verburg, P.H. Sustainable woodland management and livelihood options in a charcoal producing region: An agent-based modelling approach. J. Environ. Manag. 2019, 248, 109245. [Google Scholar] [CrossRef] [PubMed]
  57. FNC. Federación Nacional de Cafeteros de Colombia. Diagnóstico de la asociatividad en el sector cafetero colombiano. Ens. Sobre. Econ. Cafe 2020, 33, 9–36. [Google Scholar]
  58. Sanabria, P.P. Práctica Social y Cultural del Campesinado Cafetero en Cuatro Municipios de Caldas (Colombia). 2017. Available online: https://repositorio.unal.edu.co/handle/unal/66148 (accessed on 16 November 2021).
  59. Bono, F.; Loopmans, M. Spatializing Solidarity: Agricultural Cooperatives as Solidarity Transformers in Cuba*. Rural Sociol. 2021, 86, 809–836. Available online: https://onlinelibrary.wiley.com/doi/full/10.1111/ruso.12386 (accessed on 16 November 2021). [CrossRef]
  60. Fischer, E.F.; Victor, B.; de Barrios, L.A. Quality versus solidarity: Third Wave coffee and cooperative values among smallholding Maya farmers in Guatemala. J. Peasant. Stud. 2020, 48, 640–657. Available online: https://www.tandfonline.com/doi/abs/10.1080/03066150.2019.1694511 (accessed on 16 November 2021). [CrossRef]
  61. Xiong, F.; Zhu, S.; Xiao, H.; Kang, X.; Xie, F. Does Social Capital Benefit the Improvement of Rural Households’ Sustainable Livelihood Ability? Based on the Survey Data of Jiangxi Province, China. Sustainability 2021, 13, 10995. Available online: https://www.mdpi.com/2071-1050/13/19/10995/htm (accessed on 16 November 2021). [CrossRef]
  62. Lyon, S. Coffee and Community: Maya Farmers and Fair-Trade Markets; University Press of Colorado: Boulder, CO, USA, 2011. [Google Scholar]
  63. Isher, J. Fair or Balanced? The Other Side of Fair Trade in a Nicaraguan Sewing Cooperative. Anthr. Q. 2013, 86, 527–557. Available online: https://www.jstor.org/stable/41857336 (accessed on 17 November 2021).
  64. Bacon, C.M. Who decides what is fair in fair trade? The agri-environmental governance of standards, access, and price. J. Peasant. Stud. 2010, 37, 111–147. Available online: https://www.tandfonline.com/doi/abs/10.1080/03066150903498796 (accessed on 16 November 2021). [CrossRef] [Green Version]
  65. Rueda, G.J. Cambio tecnológico y mejoras en el bienestar de los caficultores en Colombia: El caso de las variedades resistentes a la roya. Ens. Sobre. Econ. Cafe 2017, 32, 121–152. [Google Scholar]
  66. FNC. SICA Sistema de información cafetero–. Comité Departamental de Cafeteros del Huila. Estado de la Caficultura del Departamento Por Seccionales y Municipios. 2021. Available online: https://federaciondecafeteros.org/ (accessed on 1 January 2022).
  67. Sanabria-Gómez, S.A.; Caro-Moreno, J.C.; Sanabria-Gómez, S.A.; Caro-Moreno, J.C. Progreso tecnológico en la caficultura colombiana, 1930-2015: El rol de la Federación Nacional de Cafeteros. Rev. EAN 2020, 88, 223–241. Available online: http://www.scielo.org.co/scielo.php?script=sci_arttext&pid=S0120-81602020000100223&lng=en&nrm=iso&tlng=es (accessed on 16 November 2021). [CrossRef]
  68. Quiñones-Ruiz, X.F. The Diverging Understandings of Quality by Coffee Chain Actors—Insights from Colombian Producers and Austrian Roasters. Sustainability 2020, 2, 6137. Available online: https://www.mdpi.com/2071-1050/12/15/6137/htm (accessed on 16 November 2021). [CrossRef]
  69. De Leijster, V.; Santos, M.J.; Wassen, M.W.; Camargo García, J.C.; Llorca Fernandez, I.; Verkuil, L.; Verweij, P.A. Ecosystem services trajectories in coffee agroforestry in Colombia over 40 years. Ecosyst. Serv. 2021, 48, 101246. [Google Scholar] [CrossRef]
  70. Servín-Juárez, R.; Trejo-Pech, C.J.O.; Pérez-Vásquez, A.Y.; Reyes-Duarte, Á. Specialty Coffee Shops in Mexico: Factors Influencing the Likelihood of Purchasing High-Quality Coffee. Sustainability 2021, 13, 3804. Available online: https://www.mdpi.com/2071-1050/13/7/3804/htm (accessed on 16 November 2021). [CrossRef]
  71. Muñoz-Rios, L.A.; Vargas-Villegas, J.; Suarez, A. Local perceptions about rural abandonment drivers in the Colombian coffee region: Insights from the city of Manizales. Land Use Policy 2019, 91, 104361. [Google Scholar] [CrossRef]
  72. Quiñones-Ruiz, X.F. Social brokerage: Encounters between Colombian coffee producers and Austrian Buyers—A research-based relational pathway. Geoforum 2021, 123, 107–116. [Google Scholar] [CrossRef]
  73. Echavarría, J.; Esguerra, P.; Mcallister, D.; Robayo, C. Misión de estudios para la competitividad de la caficultura en Colombia. Available online: https://www.urosario.edu.co/Mision-Cafetera/Archivos/Mision-de-estudios-para-competitividad-de-la-Cafic/ (accessed on 6 December 2021).
  74. FNC. Federación Nacional de Cafeteros de Colombia. Informe de Gestión 2020. 2021. Available online: https://federaciondecafeteros.org/wp/tipos/informes/ (accessed on 7 December 2021).
  75. Hurri, S.; Ngoc, Q.N. Rural Finance of Coffee Smallholders in Vietnam-Case Study in Dak Nong Province; IFAD: Hanoi, Vietnam, 2015. [Google Scholar]
  76. Azadi, Y.; Yazdanpanah, M.; Mahmoudi, H. Understanding smallholder farmers’ adaptation behaviors through climate change beliefs, risk perception, trust, and psychological distance: Evidence from wheat growers in Iran. J. Environ. Manag. 2019, 250, 109456. [Google Scholar] [CrossRef] [PubMed]
  77. Gifford, R. The dragons of inaction: Psychological barriers that limit climate change mitigation and adaptation. Am. Psychol. 2011, 64, 290–302. [Google Scholar] [CrossRef] [PubMed]
  78. Nguyen, N.; Drakou, E.G. Farmers intention to adopt sustainable agriculture hinges on climate awareness: The case of Vietnamese coffee. J. Clean. Prod. 2021, 303, 126828. [Google Scholar] [CrossRef]
  79. Yang, X.; Guo, S.; Deng, X.; Xu, D. Livelihood Adaptation of Rural Households under Livelihood Stress: Evidence from Sichuan Province, China. Agriculture 2021, 11, 506. [Google Scholar] [CrossRef]
  80. Santika, T.; Wilson, K.A.; Law, E.A.; St John, F.A.; Carlson, K.M.; Gibbs, H.; Morgans, C.L.; Ancrenaz, M.; Meijaard, E.; Struebig, M.J. Impact of palm oil sustainability certification on village well-being and poverty in Indonesia. Nat. Sustain. 2021, 4, 109–119. Available online: https://www.nature.com/articles/s41893-020-00630-1 (accessed on 16 November 2021). [CrossRef]
  81. Bravo-Monroy, L.; Potts, S.; Tzanopoulos, J. Drivers influencing farmer decisions for adopting organic or conventional coffee management practices. Food Policy 2016, 58, 49–61. [Google Scholar] [CrossRef] [Green Version]
  82. Dietz, T.; Chong, A.E.; Grabs, J.; Kilian, B. How Effective is Multiple Certification in Improving the Economic Conditions of Smallholder Farmers? Evidence from an Impact Evaluation in Colombia’s Coffee Belt. J. Dev. Stud. 2019, 56, 1141–1160. Available online: https://www.tandfonline.com/doi/abs/10.1080/00220388.2019.1632433 (accessed on 16 November 2021). [CrossRef]
  83. Sisay, D.T.; Verhees, F.J.H.M.; Van Trijp, H.C.M. The influence of market orientation on firm performance and members’ livelihood in Ethiopian seed producer cooperatives. Agrekon 2017, 56, 366–382. [Google Scholar] [CrossRef] [Green Version]
Figure 1. Correlation analysis of different variables that make up each capital that contributes to the well-being of coffee households in southern Colombia. The color of each circle signifies each capital. The thickness of the line between the circles signifies the level of correlation. Blue and red signify positive and negative correlation, respectively. (the acronyms of each variable are found in Table 1).
Sustainability 14 00743 g001
Figure 2. Relationships between capitals and between variables of each capital obtained through the structural equation model. The thickness and color of the line show the magnitude and relationship between the variables and the capital (latent variable). The green and red colors denote the positive and negative relationship, respectively. (The acronyms of each variable are found in Table 1).
Sustainability 14 00743 g002
Figure 3. Sensitivity analysis of the different variables on the community capital index (CCI). B0: intercept, B1: slope, %V: variation of the CCI in relation to each variable. The acronyms of each variable are found in Table 1.
Sustainability 14 00743 g003
Table 1. Definition and dispersion measures of the variables used in the structural equation model.
CapitalVariableAcronymsMeanS.E.MinimumMaximum
Human (HC)Training attendanceTA1.820.1405
Total laborToL28.222.150113
Fertilization labor/yearLFe15.841.45072
Labor for disease managementLDM1.590.1406
Labor for harvestingLCo6.620.91040
Family sizeFSi3.520.1517
Number of men in the familyNuM1.870.1105
How many can read in the familyNPR6.270.282.514
Average education level of the familyFLE3.190.1516
Cultural (CC)Management of soil conservation practicesSCP1.450.1506
Frequency of foliar fertilization per yearYFF0.620.0902
Management of organic fertilizer typeOFM0.670.0803
Organic fertilizer dosage per yearOFY0.780.1103
Social (CS)Benefits of the FNC (National Federation of Coffee Growers)BFN1.70.1103
AssociativityAso1.410.0803
Years of membership in the associationsMYA1.60.103
Political (CP)Belonging to a community action councilCAB0.870.0301
Participation in the activities carried out by the community action board of his/her villagePAC0.750.0401
Has a coffee identification card (identification as a coffee grower)CPI0.870.0301
Physical-constructed (CPC)Size of the farmPSz6.680.49123.5
Distance from the nearest population centerDNT9.70.63028
Technological level of the farmTLF4.890.28012
Level of tools on the farmLTF31.231.89103
Natural (CN)Process that generates contaminationPGP0.580.0803
Land use in forestFLA1.250.26018
Land use in coffeeLUC4.340.350.2516.5
Financial (CF)Cost Farm sizeCPS143.7213.3110.7754.41
Coffee productionCPD3.150.28014
Access to creditACC0.910.0803
Certification of your coffee plantationCCP0.560.1104
Labor cost of fertilizer applicationLCF0.190.0200.77
Labor costs for disease managementCDM0.02000.06
Labor cost of harvestingHLC0.080.0100.45
Total income per coffeeTIC20.753.530264.85
Table 2. Variables and estimators resulting from structural equation modeling (the acronyms of each variable are found in Table 1).
Latent Variable VariableEstimateS.E.p-ValueStd.lvStd.all
HC=~Cap0.0810.0970.4010.0810.06
MFe13.0576.0840.03213.0850.944
Men0.0720.1640.6620.0720.053
MRe3.3362.1990.1293.3440.383
TFa0.0160.1210.8910.0170.011
GeM0.0250.090.7810.0250.024
NEF−0.3930.3580.272−0.393−0.147
NLF−0.110.1270.383−0.111−0.079
CC=~PCS−0.1590.1760.366−0.167−0.113
FFo−0.0290.1060.782−0.031−0.038
TFO0.6130.138<0.00010.6440.841
DFO0.7670.177<0.00010.8060.786
SC=~FAT0.4620.072<0.00010.4810.667
FNC0.6040.116<0.00010.630.591
Aso0.6820.073<0.00010.7110.882
Van0.1680.1210.1660.1750.179
PC=~JAC−0.2130.049<0.0001−0.227−0.677
PJC−0.4020.062<0.0001−0.428−0.992
CeC−0.0720.0410.084−0.076−0.227
PCC=~TPr0.4710.2970.1131.130.239
DCP0.2140.3250.5090.5150.085
NTF0.8840.5370.12.1230.789
NHF6.5424.3270.13115.7020.909
NC=~GCo−0.0020.0020.396−0.103−0.13
UCu0.0010.0030.6970.0620.045
UCf0.0480.0610.4282.8970.857
FC=~cTP124.00819.67<0.0001127.5570.999
PCf0.4230.1410.0030.4350.163
iCfT11.8574.0370.00312.1960.361
CCI=~HC0.0660.1090.5480.0660.066
CC−0.3220.1180.006−0.307−0.307
SC0.2970.1360.0290.2850.285
PC−0.3650.1070.001−0.343−0.343
PCC2.1821.6320.1810.9090.909
NC60.08376.030.42911
FC0.2410.054<0.00010.2340.234
Std.lv column shows results that are standardized so that the latent variables have a variance of one. Std. all column shows results that are standardized so that both the latent variables and the observed variables have a variance of one.
Publisher’s Note: MDPI stays neutral with regard to jurisdictional claims in published maps and institutional affiliations.

