Article

Detecting Natural Hazard-Related Disaster Impacts with Social Media Analytics: The Case of Australian States and Territories

1
School of Architecture and Built Environment, Queensland University of Technology, 2 George Street, Brisbane, QLD 4000, Australia
2
Department of Town and Country Planning, University of Moratuwa, Bandaranayaka Mawatha, Katubedda, Moratuwa 10400, Sri Lanka
3
High Performance Computing Center, King Abdulaziz University, Jeddah 21589, Saudi Arabia
*
Author to whom correspondence should be addressed.
Sustainability 2022, 14(2), 810; https://doi.org/10.3390/su14020810
Submission received: 9 December 2021 / Revised: 7 January 2022 / Accepted: 11 January 2022 / Published: 12 January 2022
(This article belongs to the Special Issue The Adaptability of Cities to Climate Change)

Abstract

:
Natural hazard-related disasters are disruptive events with significant impact on people, communities, buildings, infrastructure, animals, agriculture, and environmental assets. The exponentially increasing anthropogenic activities on the planet have aggregated the climate change and consequently increased the frequency and severity of these natural hazard-related disasters, and consequential damages in cities. The digital technological advancements, such as monitoring systems based on fusion of sensors and machine learning, in early detection, warning and disaster response systems are being implemented as part of the disaster management practice in many countries and presented useful results. Along with these promising technologies, crowdsourced social media disaster big data analytics has also started to be utilized. This study aims to form an understanding of how social media analytics can be utilized to assist government authorities in estimating the damages linked to natural hazard-related disaster impacts on urban centers in the age of climate change. To this end, this study analyzes crowdsourced disaster big data from Twitter users in the testbed case study of Australian states and territories. The methodological approach of this study employs the social media analytics method and conducts sentiment and content analyses of location-based Twitter messages (n = 131,673) from Australia. The study informs authorities on an innovative way to analyze the geographic distribution, occurrence frequency of various disasters and their damages based on the geo-tweets analysis.

1. Introduction

The catastrophic impacts of climate change are global. Nevertheless, some regions of the world are, now, more sensitive to the anthropogenic climate change impacts [1,2]. For instance, Australia is one of these sensitive regions [3]. Australia’s range of unique climates has contributed to the country’s history of diverse natural hazard-related disasters, including, bushfires, flooding, hurricanes, cyclones, earthquakes, and tsunamis [4], where a natural hazard-related disaster is defined as “an extreme event that occurs naturally and causes harm to humans or to other things that we care about, though usually the focus is on humans—which, we might note, is anthropocentric” [5]. Natural hazard-related disasters have presented increasingly significant challenges to the country’s urban and rural environments, as a result of higher density development and population growth within these areas [4]. Particularly, anthropogenic climate change has increased the severity and frequency of these disastrous events drastically [6,7,8].
The construction of urban infrastructure within modern cities aims to benefit the local population by providing easier access to essential goods and services, as well as supporting environmental and social factors for the community [9,10]. Nonetheless, with Australian cities expanding their footprint, natural hazard-related disasters impact larger areas and populations and causes more vulnerability to communities [11,12,13]. In this sense, the adaptability of cities to climate change requires smart infrastructure and urban design that is resilient to natural hazard-related disasters impacts [14,15,16].
In order to build climate resilient urban infrastructure, the existing and forthcoming impacts of climate change on cities and societies should be adequately estimated [17,18]. This also includes identifying the existing and future natural hazard-related disaster damages on urban infrastructures and properties [19,20]. The traditional methods of such estimations have their limitations, particularly not being able to offer accurately and timely estimates due to data collection challenges [21,22]. Hence, this emphasizes the need for an improved method of damage estimation for these disastrous events [23,24,25]. Coming up with a novel damage estimation method will assist Australian communities with their recovery process and enhance resilience within urban environments.
The Royal Commission into National Natural Disaster Arrangements, which was established in response to the 2019–2020 bushfires, determined that natural hazard-related disasters will impact Australian communities more frequently, with an increased likelihood of areas experiencing simultaneous disasters before they are fully recovered in 2020. The concurrent nature and extreme intensity of these threats can be attributed to human influences on climate change, as well as increased hazard exposure through coastal and regional developments [26,27,28].
In addition, the higher frequency of natural hazard-related disasters, increased economic and materialistic losses are also resulting from damage caused in urban areas [29]. Redevelopment and recovery from these impacts consume natural resources, further contributing to climate change as a result [26]. Consequently, improvements in disaster risk reduction and community restoration should be prioritized by future developments, to help manage multiple, nation-wide natural hazard-related disaster events and reduce their negative effects on urban environments [30].
Besides, while the ingenuity of humankind has driven unimaginable advancements in science and technology particularly over the last two centuries [31], our unsatiable nature, provoked by the ruthless capitalism and irresponsible innovation, is causing irreversible damages to the planet’s fragile ecosystems [32,33,34]. This in turn has initiated exacerbating changes in the climate and led to an increasingly high frequency and severity of natural hazard-related disasters [35,36]. The situation and risks are worse for cities where the population densities and human activities are high. There is a need to monitor, prevent and manage the continuing damages to our environment and climates, particularly around the large population clusters, such as cities and urban regions. This includes improving the climate resilience and adaptability of cities and urban regions for climate change.
Responsible innovation and use of technology for social good, however, can help in generating some positive outcomes in addressing the challenges our cities and urban regions face [37,38,39]. For instance, artificial intelligence-driven big data analytics has a major role to play in urban resilience and climate change adaptability of cities [40,41]. Social media analytics enables dynamic interactions with public and hence can be used by governments as sensors, information dissemination, and social intervention tools [42].
Moreover, scholars investigating the effects of natural hazard-related disasters frequently lack demographic and growth pattern data for urban populations [29]. Social media platforms such as Twitter can provide diverse perspectives on climate change impacts and natural hazard-related disaster events affecting the individual’s area, their communities and cities (e.g., identifying emotional changes over space and time in the context of a natural hazard-related disaster) allowing for more accessible data collection from different communities and additional sources for quantitative research [43,44].
In recent years, big data social media analytics has become a popular approach to investigate various urban issues [45]. For instance, some studies focused on multiple human languages and a range of diverse topics including COVID-19-related governance matters [46,47], while others explored traffic-related event detection [48], detecting critical diseases and symptoms in and across cities [49]. Additionally, some scholars used big data social media analytics in examining urban logistics [50], public sentiment analyses of government services [51], and disaster severity prediction [23]. Some other urban scholars conducted studies by using social media analytics techniques to capture public perception of smart city concepts and technologies [52], and public perception of artificial intelligence and urban planning technologies [53]. Furthermore, some studies also benefited from social media analytics techniques in developing technology-led urban solutions for disaster management.
Considering the significance of managing climate change-induced natural hazard-related disasters across cities and urban areas, this paper contributes a methodological approach involving the use of social media analytics for improving government awareness of, and government-public interaction on disaster-related issues. Specifically, this study aims to form an understanding of how social media analytics can be utilized to assist government authorities in estimating the damages linked to natural hazard-related disaster impacts on urban centers in the age of climate change. To this end, this study analyzes crowdsourced natural hazard-related disaster big data from Twitter users in the testbed case study of Australian states and territories. The methodological approach of this study employs the social media analytics method and conducts sentiment and content analyses of location-based Twitter messages, or tweets, (n = 103,291) on natural hazard-related disaster events from Australia’s states and territories between 1 January 2019 and 31 December 2020. The study informs authorities on an innovative way to analyze the geographic distribution, occurrence frequency of various disasters and their damages based on the geo-tweets analysis.
Following this introduction, Section 2 provides a concise review of the literature and highlights the knowledge gap. Subsequently, Section 3 introduces methodology of the research, while Section 4 presents the findings of the data analysis. An evaluation and discussion of these results are performed in Section 5 of the paper. Lastly, Section 6 summarizes the study and its findings, as well as highlights future recommendations.

2. Literature Background

2.1. Climate Change-Induced Natural Hazard-Related Disasters

Australia is well-known for its frequent and intense natural hazard-related disasters, most notably flooding, droughts, cyclones, and bushfires that have shown a dramatic increase in recent years [54]. The extent of damage caused to land and property is determined by a range of factors, such as the severity of the disaster itself, location, the property’s build quality, and how well the community is prepared. Nevertheless, in recent history, there is sufficient evidence to support that these natural hazard-related disasters are already increasing in their intensity due to global climate change [55,56]. Australia’s national science research agency has provided alarming statistics showcasing the rise in the mean temperature over the last century.
The Commonwealth Scientific and Industrial Research Organization (CSIRO) highlighted that the mean temperature has significantly increased and has had a staggered yet consistently upward trend for over a century [57]. In that time, we see an increase of the country’s temperature of 2.5 °C with more rapid growth during the last four decades by an estimated 1.5 °C. The proven cause is the human contribution to the carbon footprint, resulting in warmer average temperatures. As the world population grows, this trend is expected to continue [57].
Seeto (2020) published a report regarding the natural hazard-related disasters in Australia showing which of these disastrous events caused the most damage to land and property [58]. Findings of this study included insurance money claimed following various natural hazard-related disasters. Flooding and cyclones cause the most amount of damage when they occur. In 2011, $2.1 billion was claimed through insurance from flooding damage, and $1.5 billion from cyclones. Hail and storms occur more frequently but cause less damage. The only exception is the extremely high cost of the 2019/2020 Black Summer bushfires that resulted in approximately $2.3 billion in damages [57,58,59]. However, we note that the actual figure of damages would be much more than what it is mentioned here as there are likely a significant amount of rejected insurance claims, unclaimed losses, and uninsured assets.
According to Ewart [60], local radio, newspapers, and community media have revealed the crucial and often underappreciated role such media fulfill at times of natural hazard-related disasters. Additionally, Ewart [60] stated that publicly funded broadcaster ABC is essential to get urgent information out to rural communities. Rural areas rely heavily on large-grid energy and communication networks. According to Freeman [59], damage to these networks could put the communities at great risk considering the common occurrence of natural hazard-related disasters yearly in Australia.
Tippett [61] investigated the programs to get effective emergency messaging out to those individuals during natural hazard-related disaster response and recovery phases. That study aimed to examine programming that would pass essential information and instructions via formal and informal messages such as social media. Their findings detailed that there is a need for a clearer understanding of decision-making under stress [61]. However, at the time, there was limited published evidence that threatened communities would base their decisions on emergency instructions.

2.2. Digital Technology and Natural Hazard-Related Disaster Management

Digital technology in the natural hazard-related disaster management sector has provided numerous advancements to disaster detection and warning which in turn has certainly saved lives [62,63]. Martin’s [45] research in the Disaster Prevention and Management Journal covers the importance of emergency communication and warning systems (ECWS). Martin [45] stated that emergency communications and warning systems allow people to make decisions and take actions before, during and after the emergency or disaster. Furthermore, the purpose of the article was to determine the critical capacities of Australia’s own EWCS’s. The research was performed by collecting qualitative data submissions from stakeholders by summarizing coded statements. Findings concluded that there is a broad range of ECWS in Australia but are limited by technology, suggesting that future development needs more resources and time to improve our emergency and disaster management [45].
Whittaker [64] detailed two current types of warnings for bushfires. Those that communicate the potential dangers based on intensity, rate of spread, and suppression likeliness, and those that provide alerts to the local communities and advise them how to respond. It further elaborated that although some residents found the process easy and useful, others either took on the advice too late or stayed to defend their homes. Accordingly, there is a tendency for people to seek confirmation of the bushfire threat before taking protective action, most commonly to avoid unnecessary evacuation and its associated costs [63].
Some detection and warning systems over Australia’s history have had severe consequences from failing technology. Victoria’s failure to respond to the Black Saturday bushfire is a prime example. On 7 February 2009, a devastating bushfire raged through the forest hills north of Melbourne killing 173, displacing over 7500 families, and destroyed a few small towns [65]. Australian news media organizations are still far more conservative in using social media platforms, even compared with international conglomerates, although a few real-time blogs existed [65].
On 2 April 2007, a magnitude 8.1 earthquake occurred 10 km below the sea level near Solomon Islands of Papua New Guinea. The east coast of Australia detected the tsunami and prepared for similar damage declaring a state of emergency [66]. Until recently, Australia did not have any similar detection technologies for any of its more common natural hazard-related disasters. During the 2019–2020 bushfires, Australia used unmanned aerial vehicles (UAV) to locate and monitor the bushfires potential path. Ullah [67] stated that the bushfires can be mapped using geographical information systems (GIS) and remote sensing techniques, and subsequently, the hotpots can be monitored, and damages can be assessed. Additionally, the data provided by the UAV’s combined with the Australian Bureau of Meteorology and GIS data can be used to develop mapping to identify patterns and fire development [67].

2.3. Social Media Analytics and Natural Hazard-Related Disaster Management

In 2015, the School of Creative Media in Hong Kong published a comprehensive research article on the lack of professional monitorization of content on social media. Li & Suh [68] examined how the credibility of public social media is affected because of misleading or insignificant information posted just to attract attention. They [67] further supported his findings through careful examinations of various Facebook posts that showed that activeness and argument strength were the key factors of credibility. Nonetheless, social media has proven itself useful and effective in times of natural hazard-related disasters. Chatfield et al. [69] detailed in their study that Twitter provided a viable substitute to traditional communication channels during the recent disasters. It is concluded that a Twitter-based warning system that is government-run would provide quick, publicly accessible, and comprehensive disaster management to reduce the risk to life in natural hazard-related disasters [69].
To further advocate social media’s importance to natural hazard-related disaster damage management, Wang & Ye [7] stated that despite a large variety of metadata fields in social media data, four dimensions (i.e., space, time, content, and network) have been given particular attention for mining useful information to gain situational awareness and improve disaster response. Their study [7] went on to conclude that there is a need for public human-centric information to better enhance our disaster management timing, quantity, and accuracy. Using the Black Saturday bushfires in Victoria as an example of a natural hazard-related disaster, Akama [70] identified the role of social media to be a critical aspect of resilience. It disclosed that those communities that have well-established social media networks and connections had the better adaptive capacity and greater awareness of the imposing risks, thereby leading to a higher chance of survival [70]. According to Mirbabaie et al. [71], agencies can distribute and gather relevant information to help improve their own management methods, however, several human communication barriers can limit their effectiveness. They [71] proposed a social-psychological theory called nudging in which human behavior is influenced in an easily reversible way without resulting in any particular action. In the context of social media analytics, a qualitative social media data analysis of Twitter messages relevant to the 2019–2020 Australian bushfires was performed. Mirbabaie et al. [71] stated that their findings implied that it provides initial insights into what nudges seem to effectively tempt people, in extreme situations, to make decisions in the interest of their own and others’ safety as well as how they can be applied in a social media context.
As evidenced in the reviewed literature, big data social media analytics is a promising method in estimating natural hazard-related disaster damages. Nonetheless, there is limited understanding and empirical evidence on the use of such an analytic method. This is an important gap in the literature and, hence, this study attempts to showcase how social media analytics can be utilized to assist government authorities in estimating the damages linked to natural hazard-related disaster impacts on urban centers in the age of climate change. The methodological approach is detailed in the following section.

3. Materials and Methods

The case study employed in this research paper examines Twitter data localized to the states and territories of Australia. As the research question presents social media analytics as a metric for estimating disaster damage in property and land, it was pertinent that the case study centers upon a geographical area in which it is not uncommon for natural hazard-related disasters to occur, as well as one whose population included a significant portion of social media users. To illustrate the impact natural hazard-related disasters have had upon Australia, CANSTAR [72] has produced the following hierarchy of natural hazard-related disasters faced by Australians between 1900 and 2015 (Table 1), ordered by number of fatalities.
Heatwaves, floods, cyclones, fires, storms, wind, landslides, tornadoes, and hailstorms each render severe impacts not only to human life, but to property and land accordingly in Australia. While the damages of such events have previously been difficult to accurately and timely capture using common metrics [73], real-time big data of widely adopted social media platforms may present a solution. As of 2021, 79.9% of the Australian population are active users of some form of social media, spending an average of one hour and 46 min on various social media platforms [74].
The platform of twitter is the sixth most used social media outlet nation-wide [74]. While other platforms such as Facebook, Snapchat or Instagram may represent a larger portion of the Australian market, Twitter’s comparatively concise 280-character limit on users’ posts and messaging allows for extraction of big data that is more readily available for processing, analysis, and evaluation for the purposes of this research. A case can be made that the research framework of this study could be tailored to apply to other, more robust social media inputs from various platforms to estimate natural hazard-related disaster damage.
Instead of using a traditional data collection method, the methodological approach that was applied in this study employs a contemporary method. Social media analysis is an ever-changing platform, where people can share their opinions and has recently become a new source of qualitative data. This data collection method started to be used as the main data source in many studies. The major benefit of analysis social media data is that it offers an opportunity to engage with a larger group of people, in an unbiased setting. Furthermore, it allows researchers to engage with people from broader geographic areas with the help of location of social media users, which is tagged in their post. Accordingly, geo-Twitter data have been a successful data type and have been adopted in this study. A geo-twitter analysis increased efficiency in analysis large datasets of shared opinions and real-time information on ongoing social issues.
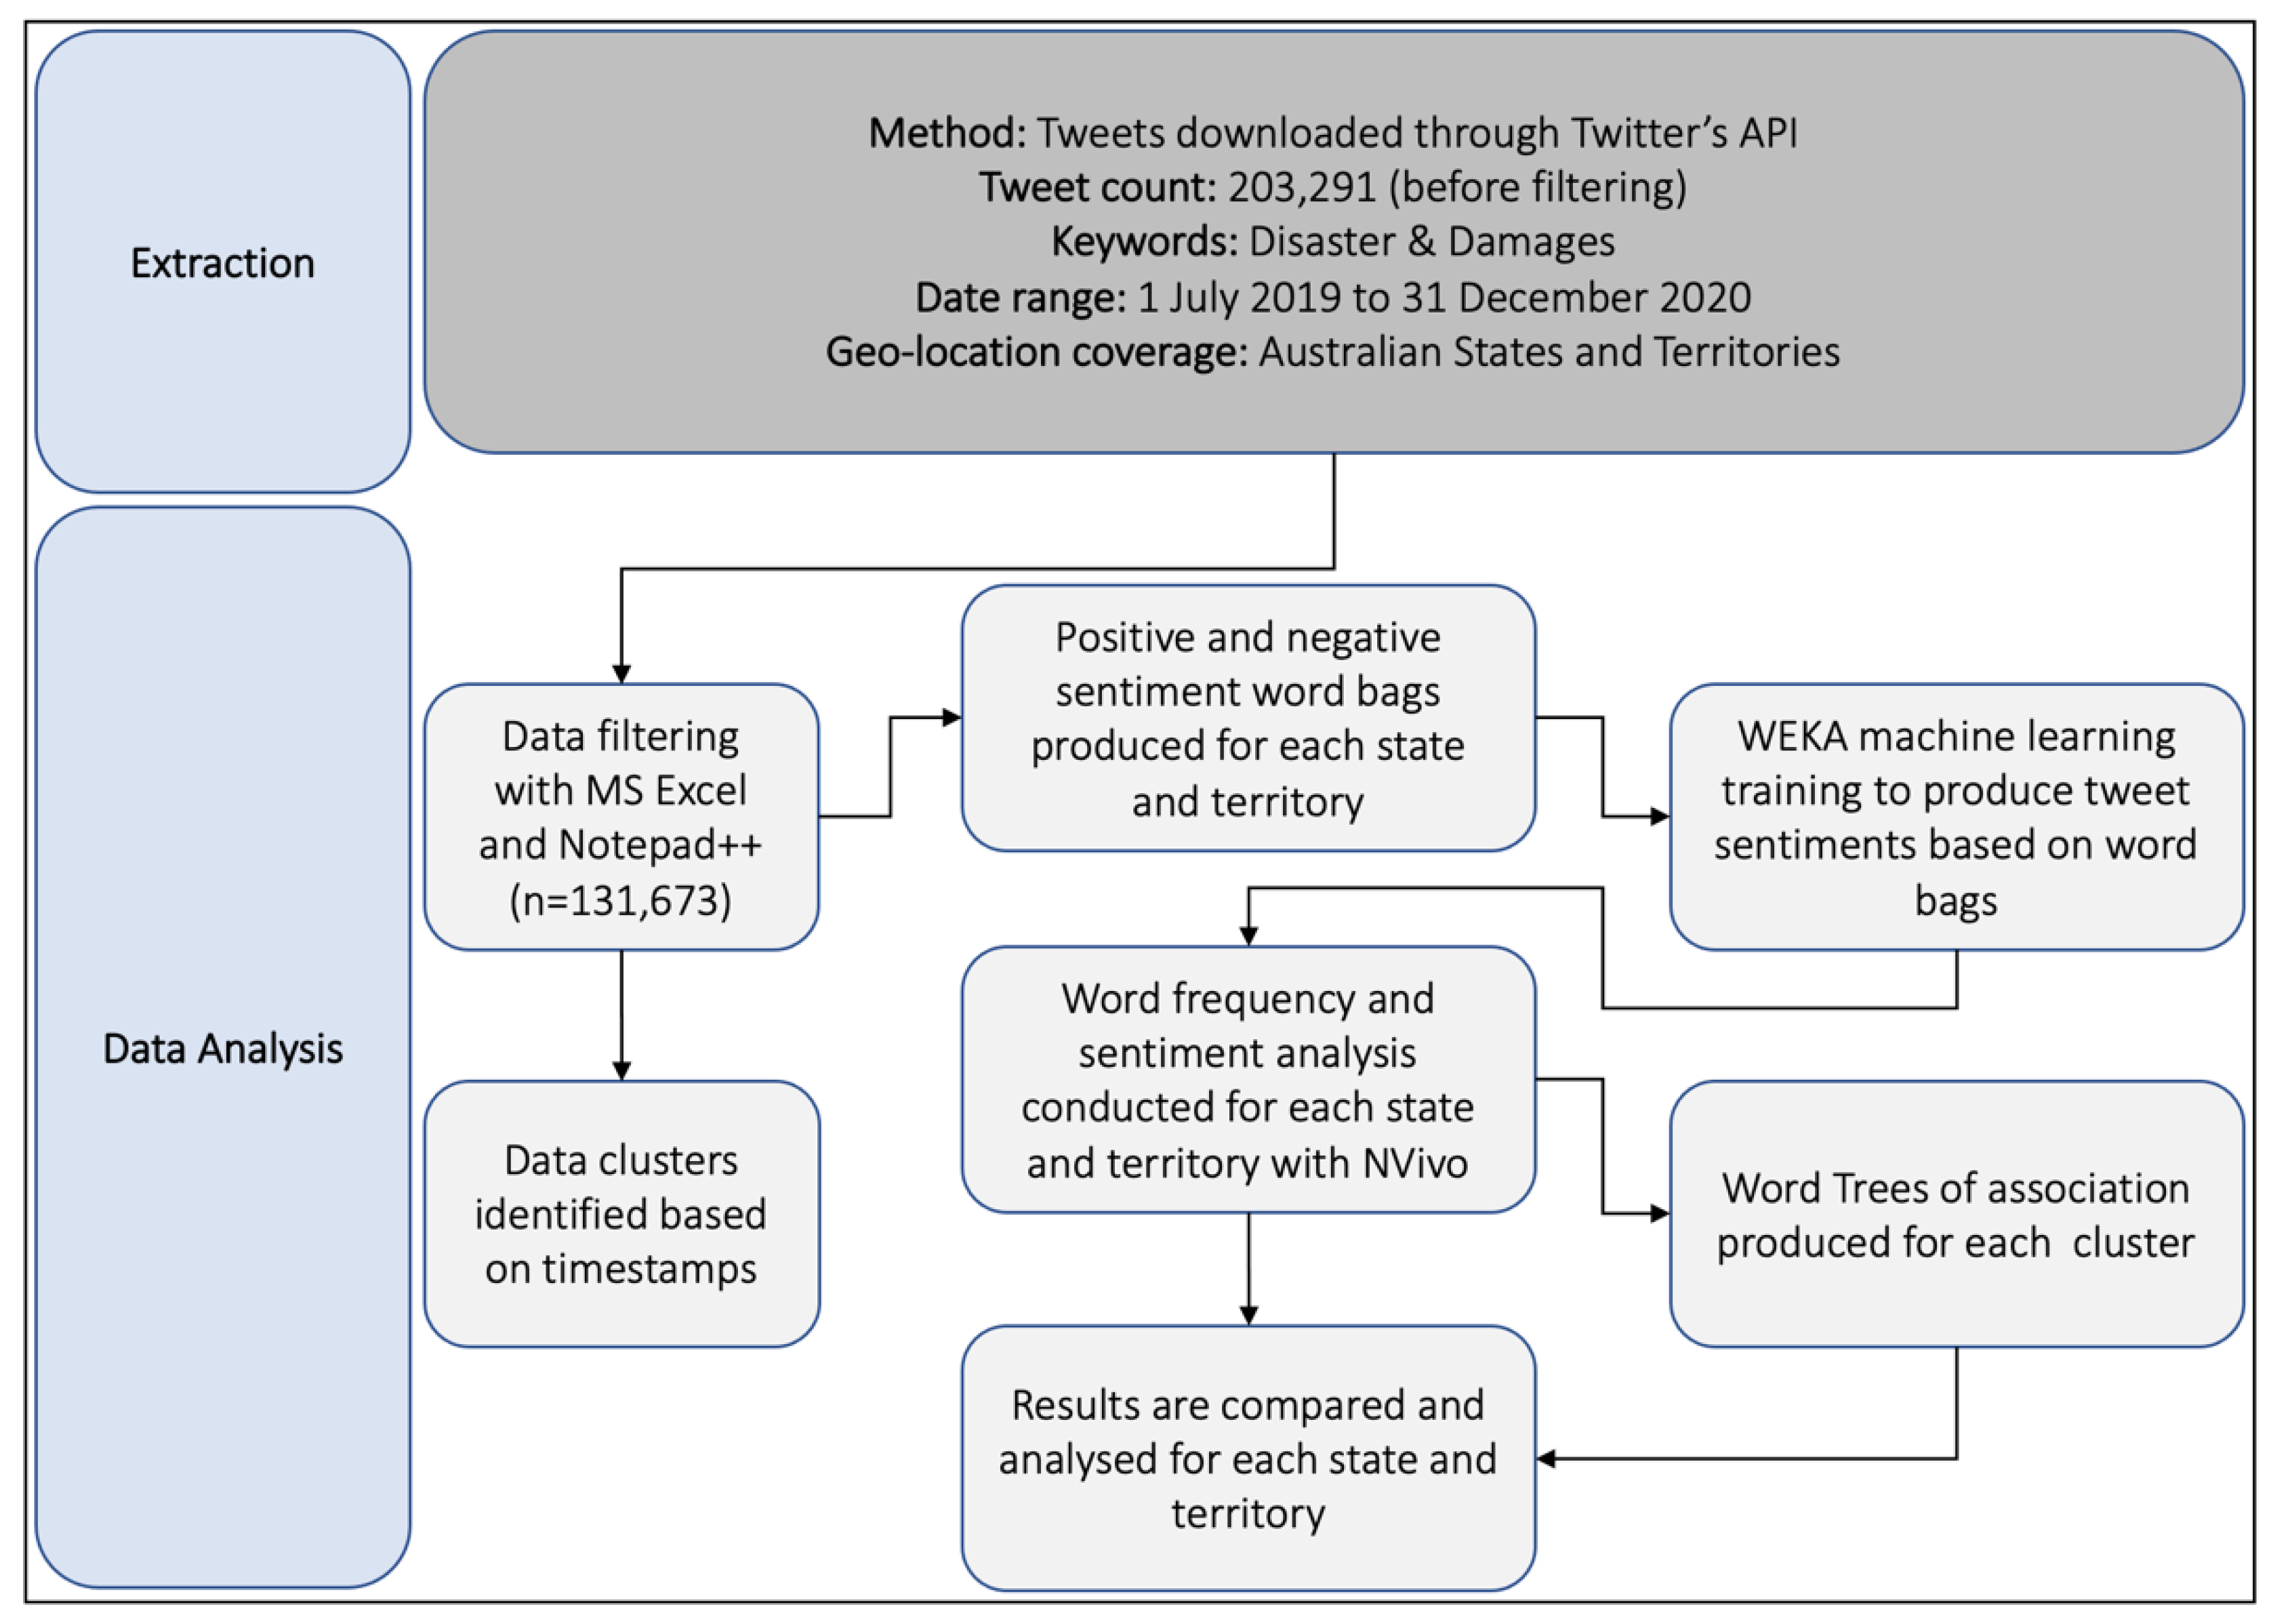
Initially, sentiment and contents analysis were completed for the total number of location-based Twitter message as seen in Figure 1. To do this, the original dataset was obtained from the QUT Digital Observatory (https://www.qut.edu.au/institute-for-future-environments/facilities/digital-observatory/digital-observatory-databank, access on 5 April 2021). The original dataset included 203,291 tweets. Later, these tweets were filtered down to 131,673 tweets. This was done using four data filtering processes, which included frequency analysis, location, date, and relevance filter. While a bot filter is used to remove mass-produced Twitter messages, VPN users, proxies and fake accounts are not investigated as we believe they will be in minimal quantity in a large dataset of over 100,000 messages. The data extraction of twitter messages of the Australian public concerning natural hazard-related disaster damages was carried out for the purpose of a qualitative social media analysis. In the extraction and analysis of these data, several different software tools and processes were utilized.
Firstly, we selected a time period for the analysis. Therefore, any tweets outside of Australia and not within 1 July 2019 to 31 December 2020 were removed from the dataset. The reason for selecting an 18-month period was to capture the latest natural hazard-related disasters in Australia. In addition, this was done to ease the analysis task, as there have been over 400,000 tweets on disasters and damages shared annually in Australia during the past five years. During this screening process, despite the overall ‘disaster’ term is used as keyword, a manual check is conducted to make sure these disasters are actually ‘natural hazard-related disasters’. Similarly, for the keyword of ‘damage’, a manual screening is undertaken to make sure the meaning of ‘damage to infrastructure or property or livelihood’ is maintained.
Secondly, a program called Nvivo, which is a content analysis automatic software system, filtered all the tweet repetition. A word frequency was also conducted using Nvivo, with the aim of identifying important themes, concepts, and clusters.
Thirdly, a word co-occurrence identified tweets that discussed both disasters and damages in a single twitter message. For this analysis, Nvivo was also employed.
Fourthly, a spatial analysis was conducted to complement the content analysis. This includes tweets being separated by location and connected to help categorize themes, concepts, disasters, and damages based on these locations. This analysis created an overview of disaster and damage clusters for each state/territory in Australia.
Then, a sentiment analysis was conducted using WEKA [75,76] to further analyze the word content. These words were classified on a scale of one to three to measure the sensitivity. The following is the scale used to conduct the sentiment analysis: 1 = positive sentiment, 2 = negative sentiment and 3 = neutral sentiment. The sensitivity of these specific words was showcased in Table 2 with exemplary tweets.
Finally, a network analysis was conducted to present the relationship between disaster and damages themes, concept, and clusters. Based on the time-stamp of each tweet provided, the process involved narrowing the scope of the research upon ‘clusters’ of tweets. The rationale behind this was that a cluster of disaster-related tweets around the same time would mostly indicate the occurrence of a significant disaster currently taking place.

4. Results

4.1. General Observations

After the initially obtained 203,291 tweets were filtered, from the final dataset of 131,673 tweets, 21.8% (n = 28,673) were originated from New South Wales ‘NSW’, 21.8% (n = 28,661) were from Victoria ‘VIC’, 19.2% (n = 25,286) were from Queensland ‘QLD’, 18.4% (n = 24,275) were from Western Australia ‘WA’, 9.5% (n = 12,563) were from South Australia ‘SA’, 5.8% (n = 7602) were from Australian Capital Territory ‘ACT’, 2.7% (n = 3528) were from Tasmania ‘TAS’, and 0.8% (n = 1085) were from Northern Territory ‘NT’. As Australia is an urban nation with well over 80% of the population residing in the major urban centers of the country, an overwhelming portion of the data (118,111 representing 89.7%) originated from urban centers of these states and territories.
Figure 2 visualizes the distribution of positive and negative sentiment per state/territory across Australia. This revealed the low interest among the SA, VIC and NT communities regarding disaster and damages. A wide range of hashtags were used in the circulated tweet. Among them, hashtags such as: #Bushfires, #Winds, #Floods, #Drought, #Climate, #Alert and #Emergency.

4.2. Community Sentiments

Out of the analyzed 131,673 tweets, 74% (n = 97,438) of them carried negative sentiment towards disasters and damages in Australia. Around 16% (n = 21,068) were positive sentiments, and 10% (n = 13,167) were neutral sentiments, where such tweets used only a set of hashtags to express their opinion rather than elaborative comments (Table 3).
From the tweets originating from QLD and WA, n = 25,286 and n = 24,275, which contained a negative sentiment of 90.60% and 88.70%, respectively. Both states had very negative sentiment towards damages and disasters. VIC had the third highest amount of negative sentiment (n = 28,661) which resulted in 77.70%. Out of the tweets from TAS (n = 3528) and ACT (n = 7602), both state and territory had similar negative sentiment, 66.40% and 66.60%, respectively. From the tweets originating from NSW (n = 28,673) and SA (n = 12,563), 50.90% and 64.40%, respectively, were negative in nature, resulting in the two lowest states showing negative sentiment towards disaster and damages. NT had the lowest number of tweets relating to disaster and damages (n = 1085), among them, 68.90% were negative. It is noted that user behaviors of the twitter platform indicate that overall, negative sentiments in twitter posts tend to have greater ’virality’ and reach, incentivizing negative sentiments even beyond the focus topic of disaster damages [77]. Example tweets for each sentiment category are given in Table 2.

4.3. Temporal Analysis

Victoria (VIC): The results shown in the tables are the four positive and negative clusters derived from all Australian state/territory tweets. Using the word frequency analysis technique, 0–100 key frequently used words originated from the collected tweets. Key frequently used words for positive clusters were ‘bushfires’ (n = 2595), ‘disasters’ (n = 895), ‘damage’ (n = 834) and ‘wind’ (n = 557). Similarly, VIC negative clusters are as follows: ‘bushfires’ (n = 10,074), ‘damage’ (n = 3464), ‘disasters’ (n = 3252) and ‘wind’ (n = 2078) as shown in Table 4 and Figure 3.
Queensland (QLD): Based on a word frequency analysis, 0–100 key positive and negative frequently used words were derived from QLD tweets. As indicated in Figure 2, the number of negative tweets is higher than the number of positive tweets in QLD. The key negative words were ‘bushfire’ (n = 8485), ‘damage’ (n = 4931), ‘disaster’ (2216) and ‘wind’ (n = 1428). Positive key concepts were ‘bushfire’ (n = 808), ‘disaster’ (n = 91), ‘damage’ (n = 91) and ‘wind’ (n = 17) as shown in Table 5 and Figure 4.
New South Wales (NSW): Figure 5 represents the number of negative and positive tweets for the state of NSW. Table 6 and Figure 5 show the negative and positive clusters with the highest word frequencies. The key word frequencies found in the negative tweets are ‘bushfires’ (n = 9674), ‘damage’ (n = 2406), ‘disaster’ (n = 1937) and ‘wind’ (n = 1903). The positive cluster words were ‘bushfires’ (2045), ‘damage’ (n = 743), ‘disasters’ (n = 823) and ‘floods’ (n = 281).
Australian Capital Territory (ACT): The keywords generated from the negative tweets of ACT were ‘bushfires’ (n = 2211), ‘disaster’ (n = 718). ‘damage’ (n = 691) and ‘wind’ (n = 411). The positive keywords were ‘damage’ (n = 316), ‘disasters’ (n = 453) and ‘flood’ (n = 88)—as seen in Table 7 and Figure 6.
Northern Territory (NT): NT has the lowest number of negative and positive word frequency generated from the tweets as shown in Table 8 and Figure 7. These were ‘bushfire’ (n = 48), ‘damage’ (n = 32), ‘disaster’ (n = 30) and ‘wind’ (n = 11). The negative words of all clusters were ‘bushfire’ (n = 244), ‘disaster’ (n = 85), ‘floor’ (n = 69) and ‘damage’ (n = 60).
South Australia (SA): Positive and negative numbers of tweets for SA are displayed in Table 9 and Figure 8. The positive words were ‘bushfires’ (n = 632), ‘disaster’ (n = 519), ‘damage’ (n = 338) and ‘wind’ (n = 130). The frequently used negative words were ‘bushfire’ (n = 3354), ‘disaster’ (n = 1206), ‘damage’ (n = 1146) and ‘wind’ (n = 791).
Tasmania (TAS): The term ‘bushfire’ (n = 173) was the most mentioned positive keyword as well as ‘damage’ (n = 115), ‘wind’ (n = 119) and ‘disaster’ (n = 85). The most tweeted negative words were ‘bushfire’ (n = 955), ‘damage’ (n = 336), ‘disaster’ (n = 288) and ‘flood’ (n = 204) in tweets from TAS—as seen in Table 10 and Figure 9.
Western Australia (WA): Most of the tweets made in WA are negative as shown in Table 11 and Figure 10. The most frequent negative words were ‘bushfire’ (n = 5151), ‘disaster’ (n = 1269), ‘damage’ (n = 1241), and ‘wind’ (n = 604), whereas frequent positive words from tweets were ‘bushfires’ (n = 207), ‘wind’ (n = 149) ‘flood’ (n = 143) and ‘damage’ (n = 105).

5. Discussion

5.1. How Social Media Analytics Can Be Used in Estimating Natural Hazard-Related Disaster Damage

Climate change-induced natural hazard-related disasters are the reality of our time [78,79]. In adopting our communities and cities to these disastrous events, innovative approaches have become a savior; social media data analytics is one of these innovative approaches [80,81]. Social media have become an important alternative information channel to traditional media during emergencies and natural hazard-related disasters. Given that in the age of climate change, the severity and frequency of natural hazard-related disasters are on the rise, it is critical to benefit from innovative technology solutions, such as social media data analytics [82,83]. Data obtained from these social media platforms can be used to warn others on unsafe areas and fundraising for disaster relief [84].
At the onset of disasters and emergencies, local and national governments are tasked to respond and rescue. In the event of an emergency, local government areas need to know the disaster and location of the situation, severity and geographical measures of the impact and which sectors (infrastructure, economic, environment or social) are affected. While the dataset of this study was derived from past data, current emergencies require live information and actionable reports for decision-making. The data captured in the findings reveal themes and overall sentiment of people that may be impacted from these disasters can be found in Table 12.
The collected dataset from Twitter was divided in five categories: bushfire, damage, disaster, floods, and winds. These disasters were very common and usually affected a big portion of the human population. The statistics of the tweet dataset from all five categories of natural hazard-related disasters used in this study are provided below.
  • Total number of tweets for Bushfires: 40,148;
  • Total number of tweets for Damages: 14,275;
  • Total number of tweets for Disasters: 10,971;
  • Total number of tweets for Floods: 7352;
  • Total number of tweets for Winds: 6003.
Situational awareness and information sharing: Cluster 1 had the lowest negative (n = 10,764) and positive (n = 2408) sentiment from the four clusters. Bushfire was the most mentioned negative (n = 3748) and positive (n = 10,746) sentiment keyword. The cluster dates were similar between QLD, NSW and ACT which represented the major bushfire that impacted the eastern states. VIC and NT were also impacted by bushfires during the May 2019 period. However, WA and TAS Cluster 1 appeared in the October 2019 period which also represented bushfires.
Cluster 2 has the highest negative (n = 38,555) and positive (n = 5520) sentiment from the four clusters. Bushfire was also the most mentioned negative (n = 22,347) and positive (n = 5520) sentiment keyword. The cluster dates were similar between all the states and territories. This shows a major disaster has directly or indirectly impacted all the communities in Australia. This is evident as Australia experienced one of the worst bushfire seasons in its recorded history. This caused massive damage throughout the country, with fires in each state and territory. The east coast (QLD, VIC, NSW) experienced widespread destruction from mega-blazes, such as the Currowan bushfire, which was just one of many catastrophic bushfires during the September 2019 to March 2020 period. In terms of the impact, Australia saw 34 fatalities, 3500 homes lost, and 18.7 million hectares of area were burnt. It is noted that TAS was not directly impacted by the fires, however, people were sharing information and reacting highly negatively.
Cluster 3 was the second highest negative (n = 16,314) and positive (n = 3228) sentiment from the four clusters. The most mentioned negative (n = 8097) and positive (n = 3228) keyword was also bushfire. The cluster dates were also very similar between all the states and territory. Nonetheless, the difference between positive and negative tweets diminished from Cluster 2. This is due to bushfires becoming controlled and there was more positive sentiment within the community.
Cluster 4 was the third highest negative (n = 15,266) and positive (n = 2832) sentiment from the four clusters. Bushfire was still the most mentioned negative (n = 6252) and positive (n = 1196) keyword. There was also a strong correlation between the states and territories. There were a range of small bushfires that began from severe weather. Nevertheless, the impact was low and is translated into minimal negative sentiment from the community.
The clusters show that individuals use social media to gather and disperse useful information regarding disasters in Australia. Individuals that use Twitter to spread awareness can be categorized into two groups, situational awareness, and information sharing [85]. Clusters 1 and 2 were examples of situational awareness as the tweets provided a useful insight into time and safety of a critical situation [86]. These tweets will be able to assist first responder’s in assessing the amount of damage, victims’ location and needs. Information sharing was evident in Clusters 3 and 4 as the disaster has already occurred and could be used for directing needed resources into local communities that may have felt an additional burden from the bushfires. Both situational awareness and information sharing help accelerate disaster response and alleviate both property and human losses in crisis management [87].
Sentiment analysis is a technique that could detect post for situation awareness. It is useful to better understand the dynamics of the network, including user feelings, panics and concerns, to identify polarity sentiment during disaster events [88]. A sentiment analysis has revealed that from these clusters, it can be noted that the most frequently used keyword was ‘bushfire’ as a natural hazard-related disaster in Australia. It was also the most common negative keyword throughout all the states and territories. This is evident in VIC (n = 4642), Qld (n = 4764), NSW (n = 7700), ACT (n = 1633), NT (n = 189), SA (n = 264), TAS (n = 346) and SA (n = 2452). The most frequent positive keyword was also ‘bushfire’ in VIC (n = 1139), QLD (n = 353), NSW (n = 1124), NT (n = 21), TAS (n = 62) and WA (n = 62). Whereas in the ACT, ‘damage’ (n = 112) and, in WA, ‘wind’ (n = 321) were the most positive keywords.
Acknowledging the negative sentiment during the bushfire crisis as seen in Clusters 1 and 2 allows for improved decision-making and helps authorities find answers to their questions and make better decisions regarding disaster event assistance. As the 2019–2020 bushfire was the worst bushfire event that Australia has ever experienced, the high negative sentiment that was found in the findings could have been used to project the information regarding the devastation and recovery situation and donation requests to the public in more efficient ways [84].
Further, it is important for government agencies to capture the community perceptions and demands immediately after a disaster event. Presently, in general, the governments or related emergency agencies come to know about the community demands after several months of an incident [22]. However, social media offers live or near real-time updates about the community vulnerabilities of a disaster zone. Therefore, the government should take necessary actions to benefit from the knowledge/situation awareness opportunities social media channels provide. For that, responsible government agencies should present and maintain a good role within the social networks. By being within these networks, the authorities can quickly identify immediate community vulnerabilities and demands. At the same time, these agencies also should take measures to filter misinformation/false information that exists in social media networks [64].

5.2. Myths and Facts about Social Media Data for Disaster Damage Assessments

The emergence of the presence of the social network and crowdsourcing in disaster damage assessment-related studies have enabled the application of inclusive disaster management approaches more than ever before. However, since the first application of social media data managing the Haiti earthquake and Tsunami, lots of myths and facts emerged discouraging and encouraging the use of social media data in disaster management. Among these, the most critical and valid arguments are: (a) social inequality in the usage of social media—digital divide; (b) limited information from severely damaged areas—spatial heterogeneity [89]; (c) low information accuracy, and (d) inability to do a detailed disaster damage assessment.
The most common criticism is that not all people have equal access to social media data, which is mostly referred to as ‘digital divide’ in the literature. Still, the authenticity of this argument is considerably decreasing over time [90]. Social media and related platforms became popular around 2006. There were 3.4 billion social media users by 2019 January, and it is growing at an increasing rate. Especially with the COVID-19 pandemic, people used more online platforms to work and study and the continuous lockdowns increased the use of social media data. Therefore, digital devices and technology overtook many of the priorities even low-income people had before the pandemic [91]. Even with the issues of low bandwidths, coverage issues and related other issues, people have formulated their own ways to overcome them [92].
Spatial heterogeneity in generating information from highly damaged areas during a disaster is the second critical argument against the use of social media data in disaster damage assessment. Besides, there is a high possibility of receiving more tweets from the areas with more people [93]. Consequently, it is hard to determine the disaster damage extent by simply using disaster damage-related data. For instance, this study tried to identify ‘emerging unusual Twitter peaks’ in each state.
Low information accuracy is the third critical argument. Nevertheless, not particularly for disaster damage assessment, this argument is plural towards most of the research studies that follow social media data analytics. Sharing rumors, false information and generating imaginary information could reduce the accuracy of the social media data. During a disaster event, the social media usage becomes high and, eventually, the possibility of sharing false information also becomes high. Therefore, the studies need to undertake specific methods that have been adopted and discovered in the literature to limit the spreading of misinformation. The respective authority presence in the social media networks can be adopted to provide guaranteed information to the people.
Mostly, geolocated social media data or social media data with location information are used in disaster management-related studies. Still, the accuracy of the locations tagged in tweets may not be perfect [94]. Among many social media, Twitter is the prominent social media that provides geotagged information for research purposes. Sometimes tagged locations may not represent the exact location information of the sender. This is a possible drawback in using geotagged social media data for disaster management. Albeit this is also becoming an outdated fact, as the social media platforms allow people to tag distant locations. Consequently, any person can tag any location which relates to the content discussed in the message. Moreover, circulation of geotagged images and videos in social media is becoming a trendy topic that provides more location-specific, trust-worthy information than the text messages [95].
Inability to do a detailed disaster damage assessment is the fourth argument that exists specially for disaster damage-related studies. Disaster damage assessments can be done from national level damage assessment to the local level disaster damage assessments. This study factually proved the possibility of obtaining a bigger picture about the disaster damages at state level. Therefore, based on the state level assessments, the national level damage assessments can be obtained. In addition, with the prevalence of geotagged social media messages, images and videos of certain locations, damaged buildings and so on, disaster damage assessment-related studies on the local level will become popular in future research studies since it has already become more a fashion than a practice to monitor the environment through cameras of mobile handheld devices [96].

6. Conclusions

Climate change-induced natural hazard-related disasters have become frequent events of our time sparing no corners of the world [97]. They are so common and disruptive that even disaster terminology has been subject to change over the last decade [98,99,100]. These more severe and frequent disasters are causing catastrophic results for many urban centers around the globe [101]. Due to the magnitude of the problem, almost every time, local, regional, and national emergency service authorities fail to manage the externalities of these climate change-induced natural hazard-related disasters [102]. Novel and innovative solutions are therefore needed to strengthen these authorities’ capabilities to combat with the disruptive impacts of these disasters [103]. These solutions will also contribute to the knowledge-based development of cities, and in return will help in the adaptability of cities to climate change impacts [104,105].
The study reported in this paper focused on capturing the emotional state of local populations during the event of natural hazard-related disasters occurrence through the means of analysis of disaster damage-related geo-tweets. This analysis, in the context of Australian states and territories, sheds light on how to analyze the geographic distribution and occurrence frequency of various disasters and their damages based on the geo-tweets analyzed. By doing so, the paper showcases the advantages of the use of social media data, i.e., Twitter data, as an effective and (to a degree) unbiased source for natural hazard-related disaster analytics. This provides insights into the impact of a particular disastrous event may impose over a local community or a city/region. In sum, the study informs authorities on an innovative way to analyze the geographic distribution, occurrence frequency of various disasters and their damages based on the geo-tweets analysis.
In terms of prospective studies, we will expand the methodological approach to incorporate social media data from other networks such as Facebook and Instagram to increase the dataset and capture broader audiences. In addition to this, future studies will also collect data from the disaster and emergency services related agencies’ social media accounts. Investigating how information could be pre-processed to be immediately usable by corresponding authorities is another future research direction. Additionally, we will explore the use of real-time social media feeds and algorithmic analysis to provide timely, critical and a deeper insight into real-time public perception of a natural hazard-related disaster event. Lastly, in this study, our geographic unit of analysis was states and territories. Thus, the paper presents an aggregated view on the use of social media analytics in detecting natural hazard-related disaster impacts. Our prospective studies will focus on more disaggregate level of analysis that includes cities, local government areas, and suburbs.

Author Contributions

Conceptualization, supervision, and writing—review and editing, T.Y.; methodology, data curation, resources, formal analysis, project administration, writing—original draft preparation, M.R. and N.K.; investigation, formal analysis, and writing—original draft preparation, J.D., S.L., S.N., A.B.; writing—review and editing, R.M. All authors have read and agreed to the published version of the manuscript.

Funding

This research received no external funding.

Data Availability Statement

The data for this study are obtained from QUT Digital Observatory, https://www.qut.edu.au/institute-for-future-environments/facilities/digital-observatory/digital-observatory-databank. An ethical approval was obtained from Queensland University of Technology’s Human Research Ethics Committee (#1900000214) to access and analyze the data. This dataset is not openly available from QUT Digital Observatory; however, the data can be obtained using Twitter API see https://developer.twitter.com/en/products/twitter-api.

Acknowledgments

The authors thank the managing editor and anonymous referees for their constructive comments.

Conflicts of Interest

The authors declare no conflict of interest.

References

  1. Conway, D.; Nicholls, R.; Brown, S.; Tebboth, M.; Adger, W.; Ahmad, B.; Wester, P. The need for bottom-up assessments of climate risks and adaptation in climate-sensitive regions. Nat. Clim. Chang. 2019, 9, 503–511. [Google Scholar] [CrossRef] [Green Version]
  2. Zhao, Z.; Wang, G.; Chen, J.; Wang, J.; Zhang, Y. Assessment of climate change adaptation measures on the income of herders in a pastoral region. J. Clean. Prod. 2019, 208, 728–735. [Google Scholar] [CrossRef]
  3. Head, L.; Adams, M.; McGregor, H.; Toole, S. Climate change and Australia. Wiley Interdiscip. Rev. Clim. Chang. 2014, 5, 175–197. [Google Scholar] [CrossRef] [Green Version]
  4. Natural Disaster Risk. Available online: https://naturaldisaster.royalcommission.gov.au/publications/html-report/chapter-02 (accessed on 3 September 2021).
  5. What Is a Natural Hazard? Available online: https://www.e-education.psu.edu/geog30/node/378 (accessed on 10 September 2021).
  6. Dixon, G.; Bullock, O.; Adams, D. Unintended effects of emphasizing the role of climate change in recent natural disasters. Environ. Commun. 2019, 13, 135–143. [Google Scholar] [CrossRef]
  7. Wang, Z.; Ye, X. Social media analytics for natural disaster management. Int. J. Geogr. Inf. Sci. 2018, 32, 49–72. [Google Scholar] [CrossRef]
  8. Williams, A.P.; Abatzoglou, J.T.; Gershunov, A.; Guzman-Morales, J.; Bishop, D.A.; Balch, J.K.; Lettenmaier, D.P. Observed impacts of anthropogenic climate change on wildfire in California. Earth’s Future 2019, 7, 892–910. [Google Scholar] [CrossRef] [Green Version]
  9. Cramer, W.; Guiot, J.; Fader, M.; Garrabou, J.; Gattuso, J.P.; Iglesias, A.; Xoplaki, E. Climate change and interconnected risks to sustainable development in the Mediterranean. Nat. Clim. Chang. 2018, 8, 972–980. [Google Scholar] [CrossRef] [Green Version]
  10. Dyer, M.; Dyer, R.; Weng, M.H.; Wu, S.; Grey, T.; Gleeson, R.; Ferrari, T.G. Framework for soft and hard city infrastructures. Proceedings of the Institution of Civil Engineers. Urban Des. Plan. 2019, 172, 219–227. [Google Scholar]
  11. Filion, P.; Sands, G.; Skidmore, M. Cities at Risk: Planning for and Recovering from Natural Disasters, 1st ed.; Routledge: London, UK, 2016; pp. 52–53. [Google Scholar]
  12. Kabir, M.I.; Rahman, M.B.; Smith, W.; Lusha, M.F.; Azim, S.; Milton, A.H. Knowledge and perception about climate change and human health: Findings from a baseline survey among vulnerable communities in Bangladesh. BMC Public Health 2016, 16, 266. [Google Scholar] [CrossRef] [Green Version]
  13. Blennow, K.; Persson, E.; Persson, J. Are values related to culture, identity, community cohesion and sense of place the values most vulnerable to climate change? PLoS ONE 2019, 14, e0210426. [Google Scholar] [CrossRef] [PubMed]
  14. Leichenko, R. Climate change and urban resilience. Curr. Opin. Environ. Sustain. 2011, 3, 164–168. [Google Scholar] [CrossRef]
  15. Chirisa, I.; Bandauko, E.; Mazhindu, E.; Kwangwama, N.A.; Chikowore, G. Building resilient infrastructure in the face of climate change in African cities: Scope, potentiality and challenges. Dev. S. Afr. 2016, 33, 113–127. [Google Scholar] [CrossRef]
  16. Ramyar, R.; Ackerman, A.; Johnston, D.M. Adapting cities for climate change through urban green infrastructure planning. Cities 2021, 117, 103316. [Google Scholar] [CrossRef]
  17. Huq, S.; Kovats, S.; Reid, H.; Satterthwaite, D. Reducing risks to cities from disasters and climate change. Environ. Urban. 2017, 19, 3–15. [Google Scholar] [CrossRef]
  18. Hallegatte, S.; Corfee-Morlot, J. Understanding climate change impacts, vulnerability and adaptation at city scale: An introduction. Clim. Chang. 2011, 104, 1–12. [Google Scholar] [CrossRef]
  19. Solecki, W.; Leichenko, R.; O’Brien, K. Climate change adaptation strategies and disaster risk reduction in cities: Connections, contentions, and synergies. Curr. Opin. Environ. Sustain. 2011, 3, 135–141. [Google Scholar] [CrossRef]
  20. Smith, A.; Matthews, J. Quantifying uncertainty and variable sensitivity within the US billion-dollar weather and climate disaster cost estimates. Nat. Hazards 2015, 77, 1829–1851. [Google Scholar] [CrossRef]
  21. West, C.; Lenze, D. Modeling the regional impact of natural disaster and recovery: A general framework and an application to Hurricane Andrew. Int. Reg. Sci. Rev. 1994, 17, 121–150. [Google Scholar] [CrossRef]
  22. Ladds, M.; Keating, A.; Handmer, J.; Magee, L. How much do disasters cost? A comparison of disaster cost estimates in Australia. Int. J. Disaster Risk Reduct. 2017, 21, 419–429. [Google Scholar] [CrossRef]
  23. Kankanamge, N.; Yigitcanlar, T.; Goonetilleke, A. How engaging are disaster management related social media channels? The case of Australian state emergency organisations. Int. J. Disaster Risk Reduct. 2020, 48, 101097. [Google Scholar] [CrossRef]
  24. Edwards, B.; Gray, M.; Borja, J. Measuring Natural Hazard-Related Disasters through Self-Reports. Int. J. Disaster Risk Sci. 2021, 12, 540–552. [Google Scholar] [CrossRef]
  25. Kucharczyk, M.; Hugenholtz, C. Remote sensing of natural hazard-related disasters with small drones: Global trends, biases, and research opportunities. Remote Sens. Environ. 2021, 264, 112577. [Google Scholar] [CrossRef]
  26. Uitto, J.; Shaw, R.; Abedin, M. Sustainable Development and Disaster Risk Reduction, 287th ed.; Springer: Tokyo, Japan, 2016; pp. 35–38. [Google Scholar]
  27. Bevacqua, E.; Maraun, D.; Vousdoukas, M.I.; Voukouvalas, E.; Vrac, M.; Mentaschi, L.; Widmann, M. Higher probability of compound flooding from precipitation and storm surge in Europe under anthropogenic climate change. Sci. Adv. 2019, 5, eaaw5531. [Google Scholar] [CrossRef] [PubMed] [Green Version]
  28. Huang, J.; Tang, Z.; Liu, D.; He, J. Ecological response to urban development in a changing socio-economic and climate context: Policy implications for balancing regional development and habitat conservation. Land Use Policy 2020, 97, 104772. [Google Scholar] [CrossRef]
  29. Exposure and Vulnerability to Natural Disasters for World’s Cities. Available online: https://digitalcommons.fiu.edu/srhreports/natural-disasters/natural-disasters/31 (accessed on 12 September 2021).
  30. Royal Commission into National Natural Disaster Arrangements Report. Available online: https://naturaldisaster.royalcommission.gov.au/publications/html-report (accessed on 5 September 2021).
  31. Nelson, R. Capitalism as an engine of progress. Res. Policy 1990, 19, 193–214. [Google Scholar] [CrossRef]
  32. Guston, D. Responsible innovation: Who could be against that? J. Responsib. Innov. 2015, 2, 1–4. [Google Scholar] [CrossRef] [Green Version]
  33. Isenhour, C. Unearthing human progress? Ecomodernism and contrasting definitions of technological progress in the Anthropocene. Econ. Anthropol. 2016, 3, 315–328. [Google Scholar] [CrossRef]
  34. Anderson, J.; Goodman, J. Crises of capital and climate: Three contradictions and prospects for contestation. In The Routledge Handbook of Transformative Global Studies; Routledge: London, UK, 2020; pp. 58–68. [Google Scholar]
  35. Benevolenza, M.; DeRigne, L. The impact of climate change and natural disasters on vulnerable populations: A systematic review of literature. J. Hum. Behav. Soc. Environ. 2019, 29, 266–281. [Google Scholar] [CrossRef]
  36. Bergquist, M.; Nilsson, A.; Schultz, P. Experiencing a severe weather event increases concern about climate change. Front. Psychol. 2019, 10, 220. [Google Scholar] [CrossRef] [Green Version]
  37. Owen, R.; Stilgoe, J.; Macnaghten, P.; Gorman, M.; Fisher, E.; Guston, D. A framework for responsible innovation. Responsib. Innov. 2013, 31, 27–50. [Google Scholar]
  38. Nagenborg, M. Urban robotics and responsible urban innovation. Ethics Inf. Technol. 2020, 22, 345–355. [Google Scholar] [CrossRef] [Green Version]
  39. Yigitcanlar, T.; Corchado, J.; Mehmood, R.; Li, R.; Mossberger, K.; Desouza, K. Responsible urban innovation with local government artificial intelligence (AI): A conceptual framework and research agenda. J. Open Innov. Technol. Mark. Complex. 2021, 7, 71. [Google Scholar] [CrossRef]
  40. Yigitcanlar, T.; Desouza, K.; Butler, L.; Roozkhosh, F. Contributions and risks of artificial intelligence (AI) in building smarter cities: Insights from a systematic review of the literature. Energies 2020, 13, 1473. [Google Scholar] [CrossRef] [Green Version]
  41. Yigitcanlar, T. Greening the artificial intelligence for a sustainable planet: An editorial commentary. Sustainability 2021, 13, 13508. [Google Scholar] [CrossRef]
  42. Yigitcanlar, T.; Mehmood, R.; Corchado, J. Green artificial intelligence: Towards an efficient, sustainable and equitable technology for smart cities and futures. Sustainability 2021, 13, 8952. [Google Scholar] [CrossRef]
  43. Sun, Y.; Shao, Y.; Chan, E. Co-visitation network in tourism-driven peri-urban area based on social media analytics: A case study in Shenzhen, China. Landsc. Urban Plan. 2020, 204, 103934. [Google Scholar] [CrossRef]
  44. Garske, S.; Elayan, S.; Sykora, M.; Edry, T.; Grabenhenrich, L.; Galea, S.; Gruebner, O. Space-time dependence of emotions on Twitter after a natural disaster. Int. J. Environ. Res. Public Health 2021, 18, 5292. [Google Scholar] [CrossRef]
  45. Martin, N.; Rice, J. Emergency communications and warning systems: Determining critical capacities in the Australian context. Disaster Prev. Manag. 2012, 21, 529–540. [Google Scholar] [CrossRef]
  46. Alomari, E.; Katib, I.; Albeshri, A.; Mehmood, R. COVID-19: Detecting government pandemic measures and public concerns from Twitter data using distributed machine learning. Int. J. Environ. Res. Public Health 2021, 18, 282. [Google Scholar] [CrossRef]
  47. Yigitcanlar, T.; Kankanamge, N.; Preston, A.; Gill, P.; Rezayee, M.; Ostadnia, M.; Ioppolo, G. How can social media analytics assist authorities in pandemic-related policy decisions? Insights from Australian states and territories. Health Inf. Sci. Syst. 2020, 8, 37. [Google Scholar] [CrossRef]
  48. Alomari, E.; Katib, I.; Albeshri, A.; Yigitcanlar, T.; Mehmood, R. A big data tool with automatic labeling for road traffic social sensing and event detection using distributed machine learning. Sensors 2021, 21, 2993. [Google Scholar] [CrossRef]
  49. Alotaibi, S.; Mehmood, R.; Katib, I.; Rana, O.; Albeshri, A. A big data analytics tool for healthcare symptoms and diseases detection using Twitter, Apache Spark, and Machine Learning. Appl. Sci. 2020, 10, 1398. [Google Scholar] [CrossRef] [Green Version]
  50. Suma, S.; Mehmood, R.; Albugami, N.; Katib, I.; Albeshri, A. Enabling next generation logistics and planning for smarter societies. Procedia Comput. Sci. 2017, 109, 1122–1127. [Google Scholar] [CrossRef]
  51. Alsulami, M.; Mehmood, R. Sentiment Analysis Model for Arabic Tweets to Detect Users Opinions about Government Services in Saudi Arabia: Ministry of Education as a case study. In Proceedings of the Information and Communication Technology Forum, London, UK, 5 August 2020. [Google Scholar]
  52. Yigitcanlar, T.; Kankanamge, N.; Vella, K. How are smart city concepts and technologies perceived and utilized? A systematic geo-Twitter analysis of smart cities in Australia. J. Urban Technol. 2021, 28, 135–154. [Google Scholar] [CrossRef]
  53. Yigitcanlar, T.; Kankanamge, N.; Regona, M.; Ruiz Maldonado, A.; Rowan, B.; Ryu, A.; Li, R. Artificial intelligence technologies and related urban planning and development concepts: How are they perceived and utilized in Australia? J. Open Innov. Technol. Mark. Complex. 2020, 6, 187. [Google Scholar] [CrossRef]
  54. Hein, W.; Wilson, C.; Lee, B.; Rajapaksa, D.; de Moel, H.; Athukorala, W.; Managi, S. Climate change and natural disasters: Government mitigation activities and public property demand response. Land Use Policy 2019, 82, 436–443. [Google Scholar] [CrossRef]
  55. Morrissey, S.; Reser, J. Natural disasters, climate change and mental health considerations for rural Australia. Aust. J. Rural Health 2017, 15, 120–125. [Google Scholar] [CrossRef]
  56. McAneney, J.; Sandercock, B.; Crompton, R.; Mortlock, T.; Musulin, R.; Pielke Jr, R.; Gissing, A. Normalised insurance losses from Australian natural disasters: 1966–2017. Environ. Hazards 2019, 18, 414–433. [Google Scholar] [CrossRef] [Green Version]
  57. Bushfire History Project. Available online: https://naturaldisaster.royalcommission.gov.au/2019-20-bushfire-history-project (accessed on 3 September 2021).
  58. Natural Disasters in Australia: What Does the Most Damage? Available online: https://www.canstar.com.au/home-insurance/natural-disasters-australia (accessed on 3 September 2021).
  59. Freeman, J.; Hancock, L. Energy and communication infrastructure for disaster resilience in rural and regional Australia. Reg. Stud. 2017, 51, 933–944. [Google Scholar] [CrossRef]
  60. Ewart, J. Drought is a disaster in the city: Local news media’s role in communicating disasters in Australia. In Media, Journalism and Disaster Communities; Palgrave Macmillan: Cham, Switzerland, 2020; pp. 67–82. [Google Scholar]
  61. Tippett, V.; Mehta, A.M.; Greer, D.; Dootson, P.; Duncan, D.; Christensen, S.; Stickley, A.; Baker-Jones, M. Effective communication during disasters. In Proceedings of the Australian & New Zealand Disaster and Emergency Management Conference, London, UK, 5 May 2015. [Google Scholar]
  62. Yigitcanlar, T.; Butler, L.; Windle, E.; Desouza, K.; Mehmood, R.; Corchado, J. Can building “artificially intelligent cities” safeguard humanity from natural disasters, pandemics, and other catastrophes? An urban scholar’s perspective. Sensors 2020, 20, 2988. [Google Scholar] [CrossRef]
  63. Kankanamge, N.; Yigitcanlar, T.; Goonetilleke, A. Public perceptions on artificial intelligence driven disaster management: Evidence from Sydney, Melbourne and Brisbane. Telemat. Inform. 2021, 65, 101729. [Google Scholar] [CrossRef]
  64. Whittaker, J. Why don’t bushfire warnings work as intended? Responses to official warnings during bushfires in New South Wales, Australia. Int. J. Disaster Risk Reduct. 2020, 45, 101476. [Google Scholar] [CrossRef]
  65. Burns, A.; Eltham, B. ‘Catastrophic Failure’ Theories and Disaster Journalism: Evaluating Media Explanations of the Black Saturday Bushfires. Media Int. Aust. 2020, 137, 90–95. [Google Scholar] [CrossRef] [Green Version]
  66. Dominey-Howes, D.; Papathoma-Kohle, M.; Bird, D.; Mamo, B.; Anning, D. The Australian Tsunami Warning System and lessons from the 2 April 2007 Solomon Islands tsunami alert in Australia. Nat. Hazards Earth Syst. Sci. 2007, 7, 571–572. [Google Scholar] [CrossRef] [Green Version]
  67. Ullah, F.; Khan, S.; Munawar, H.; Qadir, Z.; Qayyum, S. UAV based spatiotemporal analysis of the 2019–2020 New South Wales bushfires. Sustainability 2021, 13, 10207. [Google Scholar] [CrossRef]
  68. Li, R.; Suh, A. Factors influencing information credibility on social media platforms: Evidence from Facebook pages. Procedia Comput. Sci. 2015, 72, 314–328. [Google Scholar] [CrossRef] [Green Version]
  69. Chatfield, A.T.; Reddick, C.G. All hands-on deck to tweet# sandy: Networked governance of citizen coproduction in turbulent times. Gov. Inf. Q. 2018, 35, 259–272. [Google Scholar]
  70. Akama, Y.; Chaplin, S.; Fairbrother, P. Role of social networks in community preparedness for bushfire. Int. J. Disaster Resil. Built Environ. 2014, 5, 277–291. [Google Scholar] [CrossRef]
  71. Mirbabaire, M.; Ehnis, C.; Stieglitz, S.; Bunker, B.; Rose, T. Digital Nudging in Social Media Disaster Communication. Inf. Syst. Front. 2021, 23, 1097–1113. [Google Scholar] [CrossRef]
  72. Top Natural Disasters in Australia. Available online: https://www.canstar.com.au/home-insurance/natural-disasters-australia (accessed on 18 May 2020).
  73. How Can We Measure the Impact of Natural Disasters? Available online: https://www.weforum.org/agenda/2015/03/how-can-we-measure-the-impact-of-natural-disasters (accessed on 20 June 2021).
  74. Digital Trends 2021. Available online: https://www.hootsuite.com/pages/digital-trends-2021 (accessed on 23 June 2021).
  75. Frank, E.; Hall, M.; Trigg, L.; Holmes, G.; Witten, I. Data mining in bioinformatics using Weka. Bioinformatics 2004, 20, 2479–2481. [Google Scholar] [CrossRef] [Green Version]
  76. Hornik, K.; Buchta, C.; Zeileis, A. Open-source machine learning: R meets Weka. Comput. Stat. 2009, 24, 225–232. [Google Scholar] [CrossRef] [Green Version]
  77. Negativity Found to Increase Chances of Twitter Posts Going Viral. Available online: https://phys.org/news/2021-04-negativity-chances-twitter-viral.html (accessed on 25 June 2021).
  78. O’Brien, G.; O’Keefe, P.; Rose, J.; Wisner, B. Climate change and disaster management. Disasters 2006, 30, 64–80. [Google Scholar] [CrossRef]
  79. Cappelli, F.; Costantini, V.; Consoli, D. The trap of climate change-induced “natural” disasters and inequality. Glob. Environ. Chang. 2021, 70, 102329. [Google Scholar] [CrossRef]
  80. Goh, T.; Sun, P. Reaching social media analytics: An assessment based on natural disaster postings. J. Inf. Syst. Educ. 2015, 26, 27. [Google Scholar]
  81. Lovari, A.; Bowen, S. Social media in disaster communication: A case study of strategies, barriers, and ethical implications. J. Public Aff. 2020, 20, e1967. [Google Scholar] [CrossRef]
  82. Wu, D.; Cui, Y. Disaster early warning and damage assessment analysis using social media data and geo-location information. Decis. Support Syst. 2018, 111, 48–59. [Google Scholar] [CrossRef]
  83. Said, N.; Ahmad, K.; Riegler, M.; Pogorelov, K.; Hassan, L.; Ahmad, N.; Conci, N. Natural disasters detection in social media and satellite imagery: A survey. Multimed. Appl. 2019, 78, 31267–31302. [Google Scholar] [CrossRef] [Green Version]
  84. Social Media and Disasters: Current Uses, Future Options, and Policy Considerations. Available online: https://mirror.explodie.org/CRS-Report-SocialMediaDisasters-Lindsay-SEP2011.pdf (accessed on 17 May 2021).
  85. Beigi, G.; Hu, X.; Maciejewski, R.; Liu, H. An overview of sentiment analysis in social media and its applications in disaster relief. Sentim. Anal. Ontol. Eng. 2016, 2, 313–340. [Google Scholar]
  86. Sakaki, T.; Matsuo, Y.; Kurihara, S.; Toriumi, F.; Shinoda, K.; Noda, I.; Kazama, K. The possibility of social media analysis for disaster management. In Proceedings of the 2013 IEEE Region 10 Humanitarian Technology Conference, London, UK, 6 June 2013. [Google Scholar]
  87. Baro, R.; Palaoag, T. Disaster Sentiment Analysis: Addressing the Challenges of Decision-Makers in Visualizing Netizen Tweets. In Proceedings of the IOP Conference Series: Materials Science and Engineering, New York, NY, USA, 9 March 2020. [Google Scholar]
  88. Shekhar, H.; Setty, S. Disaster analysis through tweets. In Proceedings of the 2015 International Conference on Advances in Computing, Communications and Informatics, New York, NY, USA, 19 April 2015. [Google Scholar]
  89. Xiao, Y.; Huang, Q.; Wu, K. Understanding social media data for disaster management. Nat. Hazards 2015, 79, 1663–1679. [Google Scholar] [CrossRef]
  90. Hedman, U.; Djerf-Pierre, M. The social journalist: Embracing the social media life or creating a new digital divide? Digit. J. 2013, 1, 368–385. [Google Scholar] [CrossRef]
  91. Wood, B.R.; Young, J.D.; Abdel-Massih, R.C.; McCurdy, L.; Vento, T.J.; Dhanireddy, S.; Scott, J.D. Advancing digital health equity: A policy paper of the infectious diseases society of America and the HIV medicine association. Clin. Infect. Dis. 2021, 72, 913–919. [Google Scholar] [CrossRef] [PubMed]
  92. Correia, A. Healing the Digital Divide during the COVID-19 Pandemic. Q. Rev. Distance Educ. 2020, 21, 13–21. [Google Scholar]
  93. Queensland Floods Commission of Inquiry, Queensland. Available online: http://www.floodcommission.qld.gov.au/publications/final-report/ (accessed on 14 June 2021).
  94. Torpan, S.; Hansson, S.; Rhinard, M.; Kazemekaityte, A.; Jukarainen, P.; Meyer, S.; Schieffelers, A.; Lovasz, G.; Orru, K. Handling false information in emergency management: A cross-national comparative study of European practices. Int. J. Disaster Risk Reduct. 2021, 57, 102151. [Google Scholar] [CrossRef]
  95. Harrison, S.; Johnson, P. Crowdsourcing the disaster management cycle. Int. J. Inf. Syst. Crisis Response Manag. 2016, 8, 17–40. [Google Scholar] [CrossRef] [Green Version]
  96. Handmer, J.; Choy, S.; Kohtake, N. Updating warning systems for climate hazards: Can navigation satellites help? J. Telecommun. Digit. Econ. 2014, 2, 70–71. [Google Scholar] [CrossRef] [Green Version]
  97. Sangha, K.; Russell-Smith, J.; Edwards, A.; Surjan, A. Assessing the real costs of natural hazard-induced disasters: A case study from Australia’s Northern Territory. Nat. Hazards 2021, 108, 479–498. [Google Scholar] [CrossRef]
  98. Staupe-Delgado, R. Analysing changes in disaster terminology over the last decade. Int. J. Disaster Risk Reduct. 2019, 40, 101161. [Google Scholar] [CrossRef]
  99. Chmutina, K.; Sadler, N.; von Meding, J.; Abukhalaf, A. Lost (and found?) in translation: Key terminology in disaster studies. Disaster Prev. Manag. 2021, 30, 149–162. [Google Scholar] [CrossRef]
  100. Yazdani, M.; Mojtahedi, M.; Loosemore, M.; Sanderson, D.; Dixit, V. Hospital evacuation modelling: A critical literature review on current knowledge and research gaps. Int. J. Disaster Risk Reduct. 2021, 66, 102627. [Google Scholar] [CrossRef]
  101. Han, S.; Tsou, M.; Knaap, E.; Rey, S.; Cao, G. How do cities flow in an emergency? Tracing human mobility patterns during a natural disaster with big data and geospatial data science. Urban Sci. 2019, 3, 51. [Google Scholar] [CrossRef] [Green Version]
  102. Zhao, M.; Liu, X. Development of decision support tool for optimizing urban emergency rescue facility locations to improve humanitarian logistics management. Saf. Sci. 2018, 102, 110–117. [Google Scholar] [CrossRef]
  103. Bojovic, D.; Giupponi, C. Understanding the dissemination and adoption of innovations through social network analysis: Geospatial solutions for disaster management in Nepal and Kenya. J. Environ. Plan. Manag. 2020, 63, 818–841. [Google Scholar] [CrossRef]
  104. Yigitcanlar, T.; Bulu, M. Dubaization of Istanbul: Insights from the knowledge-based urban development journey of an emerging local economy. Environ. Plan. A 2015, 47, 89–107. [Google Scholar] [CrossRef] [Green Version]
  105. Sarimin, M.; Yigitcanlar, T. Towards a comprehensive and integrated knowledge-based urban development model: Status quo and directions. Int. J. Knowl. Based Dev. 2012, 3, 175–192. [Google Scholar] [CrossRef]
Figure 1. Extraction and data analysis methodology.
Sustainability 14 00810 g001
Figure 2. Positive and negative sentiment per state/territory.
Sustainability 14 00810 g002
Figure 3. VIC positive and negative number of tweets.
Sustainability 14 00810 g003
Figure 4. QLD positive and negative number of tweets.
Sustainability 14 00810 g004
Figure 5. NSW positive and negative number of tweets.
Sustainability 14 00810 g005
Figure 6. ACT positive and negative number of tweets.
Sustainability 14 00810 g006
Figure 7. NT positive and negative number of tweets.
Sustainability 14 00810 g007
Figure 8. SA positive and negative number of tweets.
Sustainability 14 00810 g008
Figure 9. TAS positive and negative number of tweets.
Sustainability 14 00810 g009
Figure 10. WA positive and negative number of tweets.
Sustainability 14 00810 g010
Table 1. Fatalities due to natural hazard-related disasters in Australia.
Natural Hazard-Related DisastersNumber of Fatalities
Extreme heat4555
Floods1911
Tropical cyclones1216
Bushfire974
Lightning562
Gusts527
Landslide96
Tornado53
Earthquakes17
Hail3
Table 2. Example tweets for two sentiment categories.
Date and TimeState/TerritoryTweetSentiment
20 October 2020 18:06WA‘The union for firefighters has issued a dire warning over catastrophic bushfire conditions and the lack of necessary resources. It says lives were at risk because the city headquarters was left with insufficient trucks.’Negative
20 October 2020 18:05TAS‘As a ferocious bushfire reached his farm, 12-year-old Lucas grabbed his dog and drove to safety.’Positive
25 June 2020 18:35NT‘It’s not good enough that bushfire victims who lost their home in January still haven’t had debris cleared from their property in July.’Negative
23 December 2019 19:09ACT‘Wild storms lashed last night flooding local roads and backyards across the region.’Negative
5 November 2020 7:25SA‘So many koalas were burnt and killed in the bush fires.’Negative
21 December 2019 15:38QLD‘Gold Coast as emergency authorities warn of flooding risk for properties.’Negative
19 November 2019 0:34NSW‘The most important and positive thing to emerge in Bushfire communities has been how people have organized to help themselves. We have the recovery plan.’Positive
10 April 2019 9:23VIC‘Unbelievable scenes coming from coastal Victoria with around 4000 people stranded on a beach at Mallacoota with a bushfire heading towards them.’Negative
Table 3. Positive and negative sentiment percentages per state/territory.
States and TerritoriesNegative Sentiments %Positive Sentiments %Neutral Sentiments %Total Tweets Analyzed
New South Wales (NSW)50.90%29.11%19.99%28,673
Victoria (VIC)77.70%8.18%14.12%28,661
Queensland (QLD)90.60%4.44%4.96%25,286
Western Australia (WA)88.70%7.41%3.89%24,275
South Australia (SA)64.40%25.08%10.52%12,563
Australian Capital Territory (ACT)66.60%26.40%7.00%7602
Tasmania (TAS)66.40%21.21%12.39%3528
Northern Territory (NT)68.90%25.75%5.35%1085
Table 4. Positive and negative clusters.
Positive SentimentsNegative Sentiments
KeywordsCluster 1 (C1)Cluster 2 (C2)Cluster 3 (C3)Cluster 4 (C4)TotalCluster 1 (C1)Cluster 2 (C2)Cluster 3 (C3)Cluster 4 (C4)Total
Bushfire36711395904992595138546422185186210,074
Damage12642819214989547616127306463464
Disaster12338318014883442915556905783252
Wind90235135975573119634453592078
Floods5919183814142328473732971749
Table 5. Positive and negative clusters.
Positive SentimentsNegative Sentiments
KeywordsC1C2C3C4TotalC1C2C3C4Total
Bushfire35320413613680811234746132112958485
Damage43---43652179462318624931
Disaster2542--9142311843562532216
Wind98--173924522453391428
Floods1313--13308205194248955
Table 6. Positive and negative clusters.
Positive SentimentsNegative Sentiments
KeywordsC1C2C3C4TotalC1C2C3C4Total
Bushfire5611245233422045296770010928829674
Damage18612018625174363412974286812406
Disaster216321134152823981716611601937
Wind174532211155377366315361903
Floods769951552815855182734541245
Table 7. Positive and negative clusters.
Positive SentimentsNegative Sentiments
KeywordsC1C2C3C4TotalC1C2C3C4Total
Bushfire-----1716332892722211
Damage43386285316138206152195691
Disaster571126285316139267143169718
Floods-----363082450418
Wind37-3021881189166136411
Table 8. Positive and negative clusters.
Positive SentimentsNegative Sentiments
KeywordsC1C2C3C4TotalC1C2C3C4Total
Bushfire-2113144821892726244
Damage8 101432152421-60
Disaster36912301738151585
Floods6--6121418132469
Wind-632112434352
Table 9. Positive and negative clusters.
Positive SentimentsNegative Sentiments
KeywordsC1C2C3C4TotalC1C2C3C4Total
Bushfire-1171881236323026413852983354
Damage7224162873382643023192611146
Disaster79-941055192385091902691206
Floods21688433197168145221731
Wind363211412130286802657791
Table 10. Positive and negative clusters.
Positive SentimentsNegative Sentiments
KeywordsC1C2C3C4TotalC1C2C3C4Total
Bushfire52286231173182152346275955
Damaging263948421556158116101336
Disaster131531268558509486288
Floods81429197045356262204
Wind1427413411636287161196
Table 11. Positive and negative sentiment clusters.
Positive SentimentsNegative Sentiments
KeywordsC1C2C3C4TotalC1C2C3C4Total
Bushfire62326251207713644245213425151
Damaging291522391051731506782401241
Disaster17243211841651496263291269
Floods293245371439990169163521
Wind3712594114996115234159604
Table 12. Sentiment clusters by state/territory.
Cluster 1Cluster 2Cluster 3Cluster 4
VIC29 April 2019 to 29 May 201929 October 2019 to 1 March 20201 June 2020 to 15 July 202023 September 2020 to 15 December 2020
QLD5 May 2019 to 15 June 20195 October 2019 to 1 May 20205 June 2020 to 8 July 20205 November 2020 to 19 December 2020
NSW5 May 2019 to 20 June 20198 October 2019 to 10 May 202010 June 2020 to 13 July 202012 November 2020 to 21 December 2020
SA19 May 2019 to 16 June 201916 October 2019 to 13 January 202010 June 2020 to 8 July 202015 November 2020 to 22 December 2020
NT20 April 2019 to 15 June 201920 October 20219 to 20 January 202025 June 2020 to 18 August 202015 November 2020 to 16 December 2020
ACT5 May 2019 to 16 May 202014 October 2019 to 16 April 202018 June 2020 to 3 July 202013 November 2020 to 5 December 2020
WA10 May 2019 to 18 May 201910 October 2019 to 18 December 202010 May 2020 to 19 June 202015 November 2020 to 5 December 2020
TAS4 October 2019 to 10 October 20196 October 2019 to 12 October 20206 June 2020 to 14 June 202015 October 2020 to 1 December 2020
Publisher’s Note: MDPI stays neutral with regard to jurisdictional claims in published maps and institutional affiliations.

