
Circular Economy Impact Analysis on Stock Performances: An Empirical Comparison with the Euro Stoxx 50® ESG Index


Abstract
:1. Introduction
2. Literature Review
3. Materials and Methods
3.1. Data Description: EuroStoxx50 and Its ESG Recalibration
- There is still no scoring that allows appreciating the degree of compliance reached with the precepts of the CE, and that would have allowed to directly estimate the indicated statistical relationship.
- The attention paid by individual companies to the problem of reusability of products sold in their production cycle is relatively recent.
- It is useful for verifying whether there is a direct relationship between the two different, but still connected, activities aimed at improving the internal level of sustainability and whether these, together or separately, have an impact on the variability of the stock returns being analyzed.
- The EuroStoxx50 Index is Europe’s leading blue-chip index for the Eurozone, providing a representation of the region’s supersectoral leaders. The index covers 50 stocks from 8 Eurozone countries: Belgium, Finland, France, Germany, Ireland, Italy, the Netherlands, and Spain. Today it has 40 issuers with ESG scoring, including 32 with launched CE initiatives.
- In 2012, the Deutsche Börse Groups’ operator, Stoxx Ltd. [47], which is also the creator of the homonymous Euro Stoxx 50, released the recalibration of the latter, based on ESG classification method, named Euro Stoxx 50-ESG. With this method, the index is not equally weighted, but the components of the original index are represented in the new index with weights expressing the ESG score (https://www.stoxx.com/rulebooks, accessed on 5 January 2022) of their issuers. The particularity of this procedure lies in the substitution of the 20% of the component stocks of the original index that is the last in the chart classified according to the ESG classification methods. Namely, the less ESG compliant firms (those with the lowest ESG scores) are excluded independently from their market capitalization and their historical performances. The substitution procedure was conducted by referring to the ranking of the EuroStoxx50 universe adjusted for the ESG score. Indeed, the index creator assigned a rank to each potential future component beyond the present components. So, by adjusting this ranking for the ESG score, it is possible to immediately identify the replacing stocks. (https://www.stoxx.com/document/Indices/Common/Indexguide/stoxx_index_guide.pdf, accessed on 5 January 2022). In this index, all components have an ESG scoring and 40 have also launched Circular Economy initiatives.
3.2. Model Description
- The Eurostoxx50 index, reminding that, to date, it has 40 issuers with ESG scoring, of which 32 have launched CE initiatives;
- The Eurostoxx50-ESG index, in which all components have an ESG scoring and of which 40 have also launched CE initiatives.
- -
- In the first basket:
- Companies with ESG scoring are preferable, and therefore more selected, than the others;
- Companies with ESG scoring and that have, at the same time, launched CE initiatives are preferable to those that do not possess both characteristics.
- -
- In the second basket:
- Companies that, having ESG Scoring, have launched CE initiatives are preferable to those that have not launched such initiatives.
- SECTION 1—Input
- Loading database of the returns (n), with (T) records.
- Selection of the number of titles (m) on which to perform the analysis (with n > m).
- Definition of the period in the sample, the so-called learning period (t, with t <= T) and by the difference in the period Out of sample, or the back test period.
- Selection of strategies (z) to be used.
- Selection of the number of securities to invest in (sub portfolio p <= m <= n).
- SECTION 2—Core
- 6.
- Calculation of the Sharpe ratio and effective return by applying the chosen strategies (five strategies that do not allow short selling, the so-called only-long, known in the literature and also used in operational practice) on the set of stocks selected on to perform the analysis (m).
- 7.
- Identification of the winning strategy, or the one with the highest Sharpe ratio.
- 8.
- Identification of the best stock (p), selected from the set (m), on which to invest identified by ordering the weights in descending mode of the winning strategy (Roll 0).
- 9.
- Reapplication of all chosen strategies to the best (p) stocks.
- 10.
- Calculation of the Sharpe ratio and effective return for all strategies.
- 11.
- Identification of the winning strategy, or the one with the highest Sharpe ratio.
- 12.
- Identification of the units to invest in.
- SECTION 3—Rolling
- 13.
- Repetition (T-t) of the points ranging from 6 to 12, expelling the oldest data and including the new one.
- 14.
- Calculation of the Sharpe ratio and the actual yield by applying the chosen strategies on the new set of selected stocks on which to perform the analysis (m).
- 15.
- Identification of the winning strategy, or the one with the highest Sharpe ratio.
- 16.
- Identification of the best securities (p), selected from the set (m), on which to invest identified by ordering the weights in descending mode of the winning strategy (Roll 0).
- 17.
- Reapplication of all chosen strategies to the best (p) stocks.
- 18.
- Calculation of the Sharpe ratio and the effective return for all strategies.
- 19.
- Identification of the winning strategy, or the one with the highest Sharpe ratio.
- 20.
- Identification of the stock on which to invest.
- SECTION 4—Output
- 21.
- Finally, the process described will generate:
- The vector of the cumulative returns in the back test period;
- The matrix of the stocks on which to invest from time to time along the back test period;
- The vector of the extraction percentages of each single security as a proxy for market satisfaction.
- (1)
- Global minimum variance constraints strategy (GMVC).
- (2)
- Most diversified portfolio strategy (MDP).
- (3)
- Risk parity strategy (RP).
- (4)
- Mean variance constraints strategy (MVC).
- (5)
- Equally weighted strategy (EW).
4. Results
- -
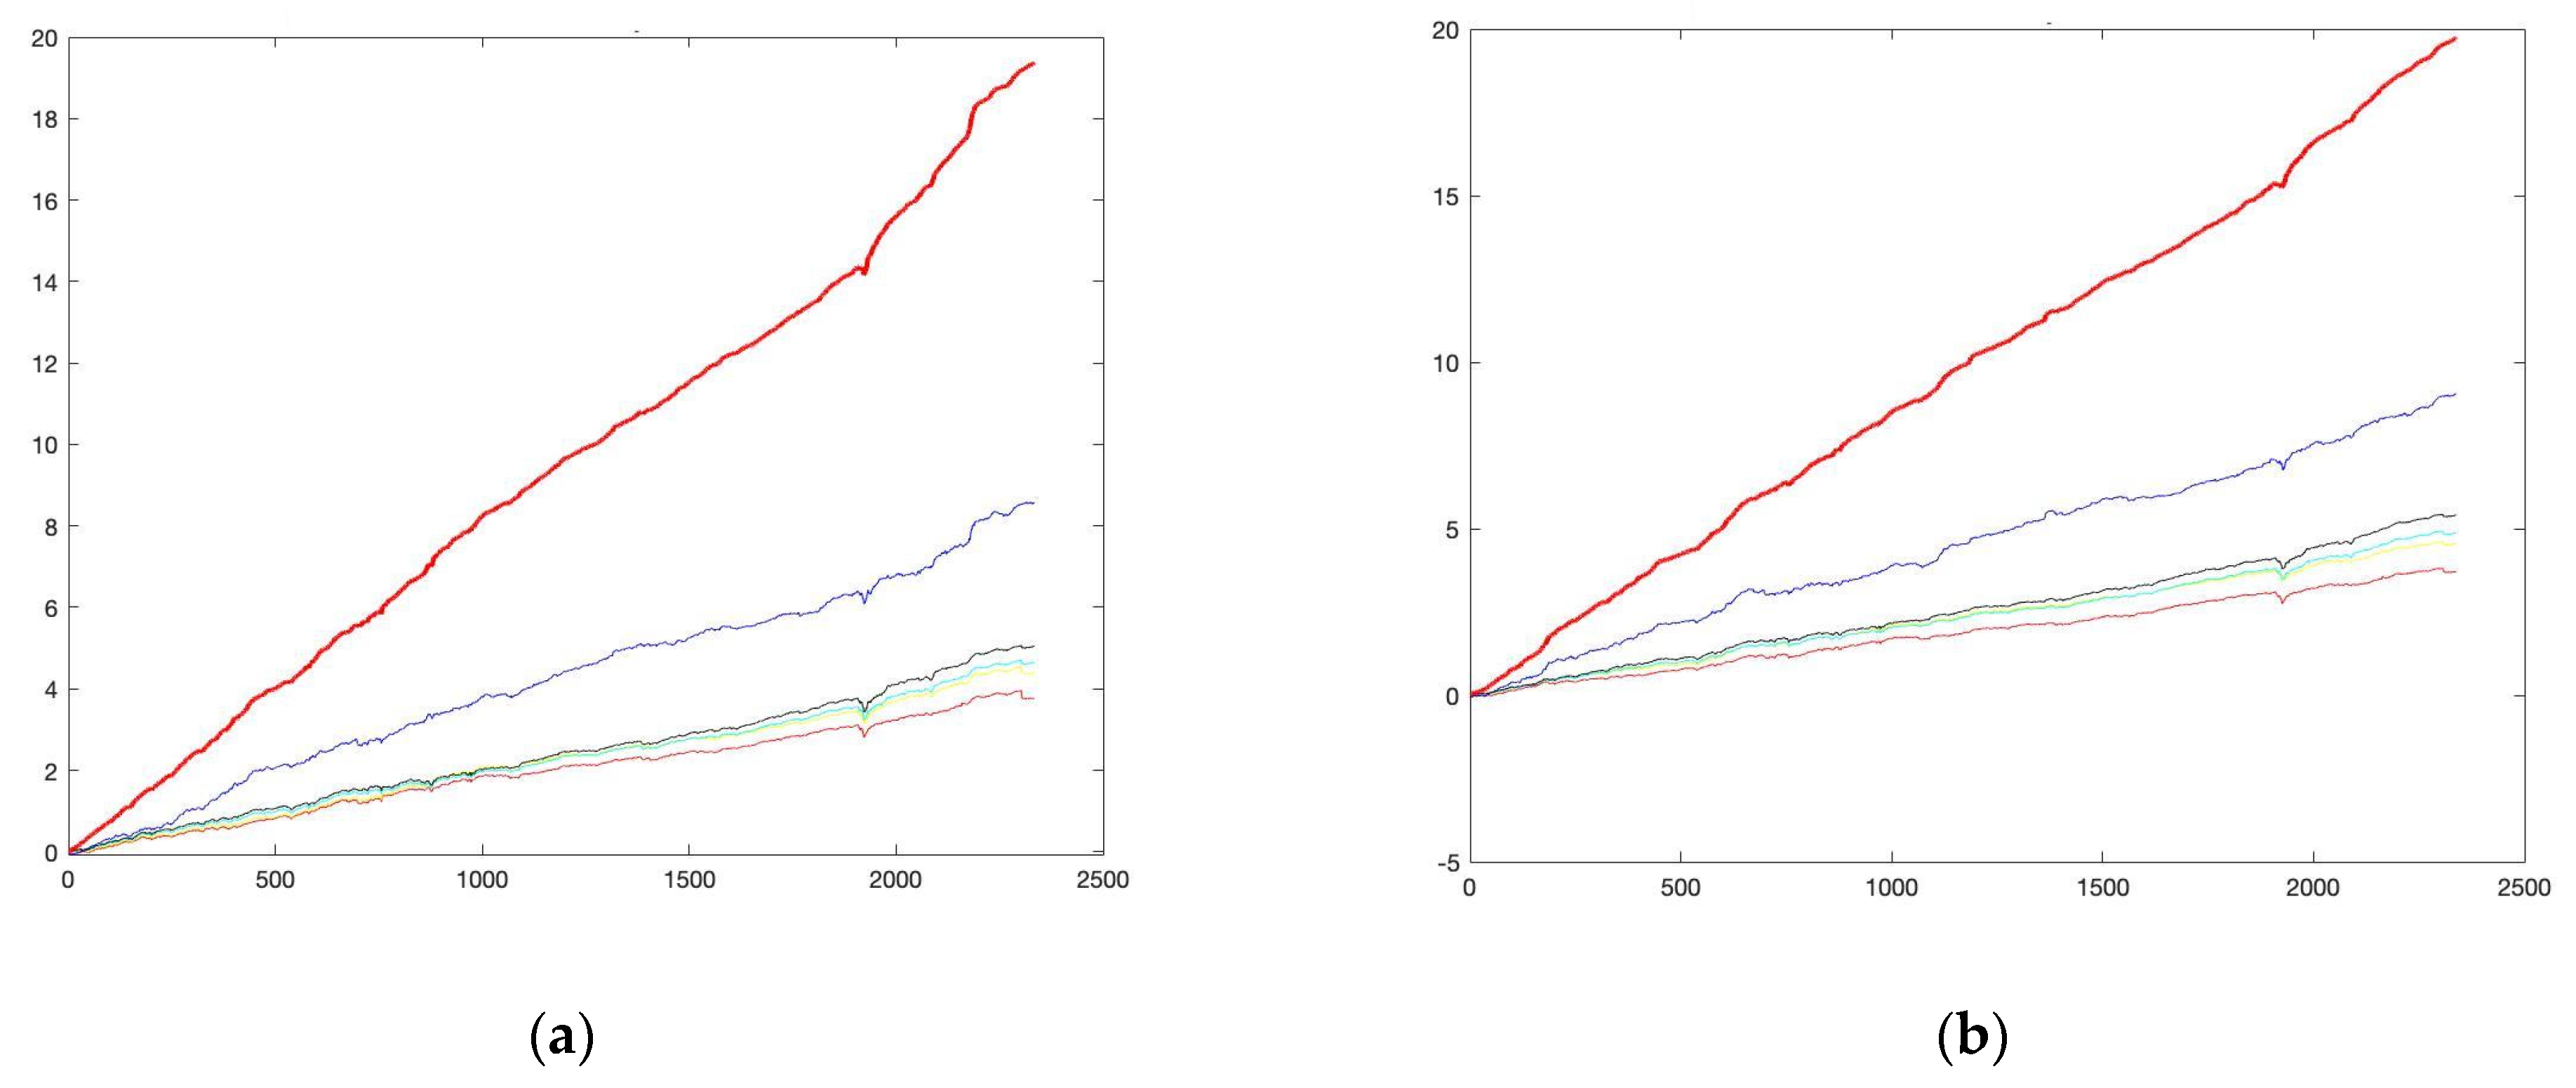
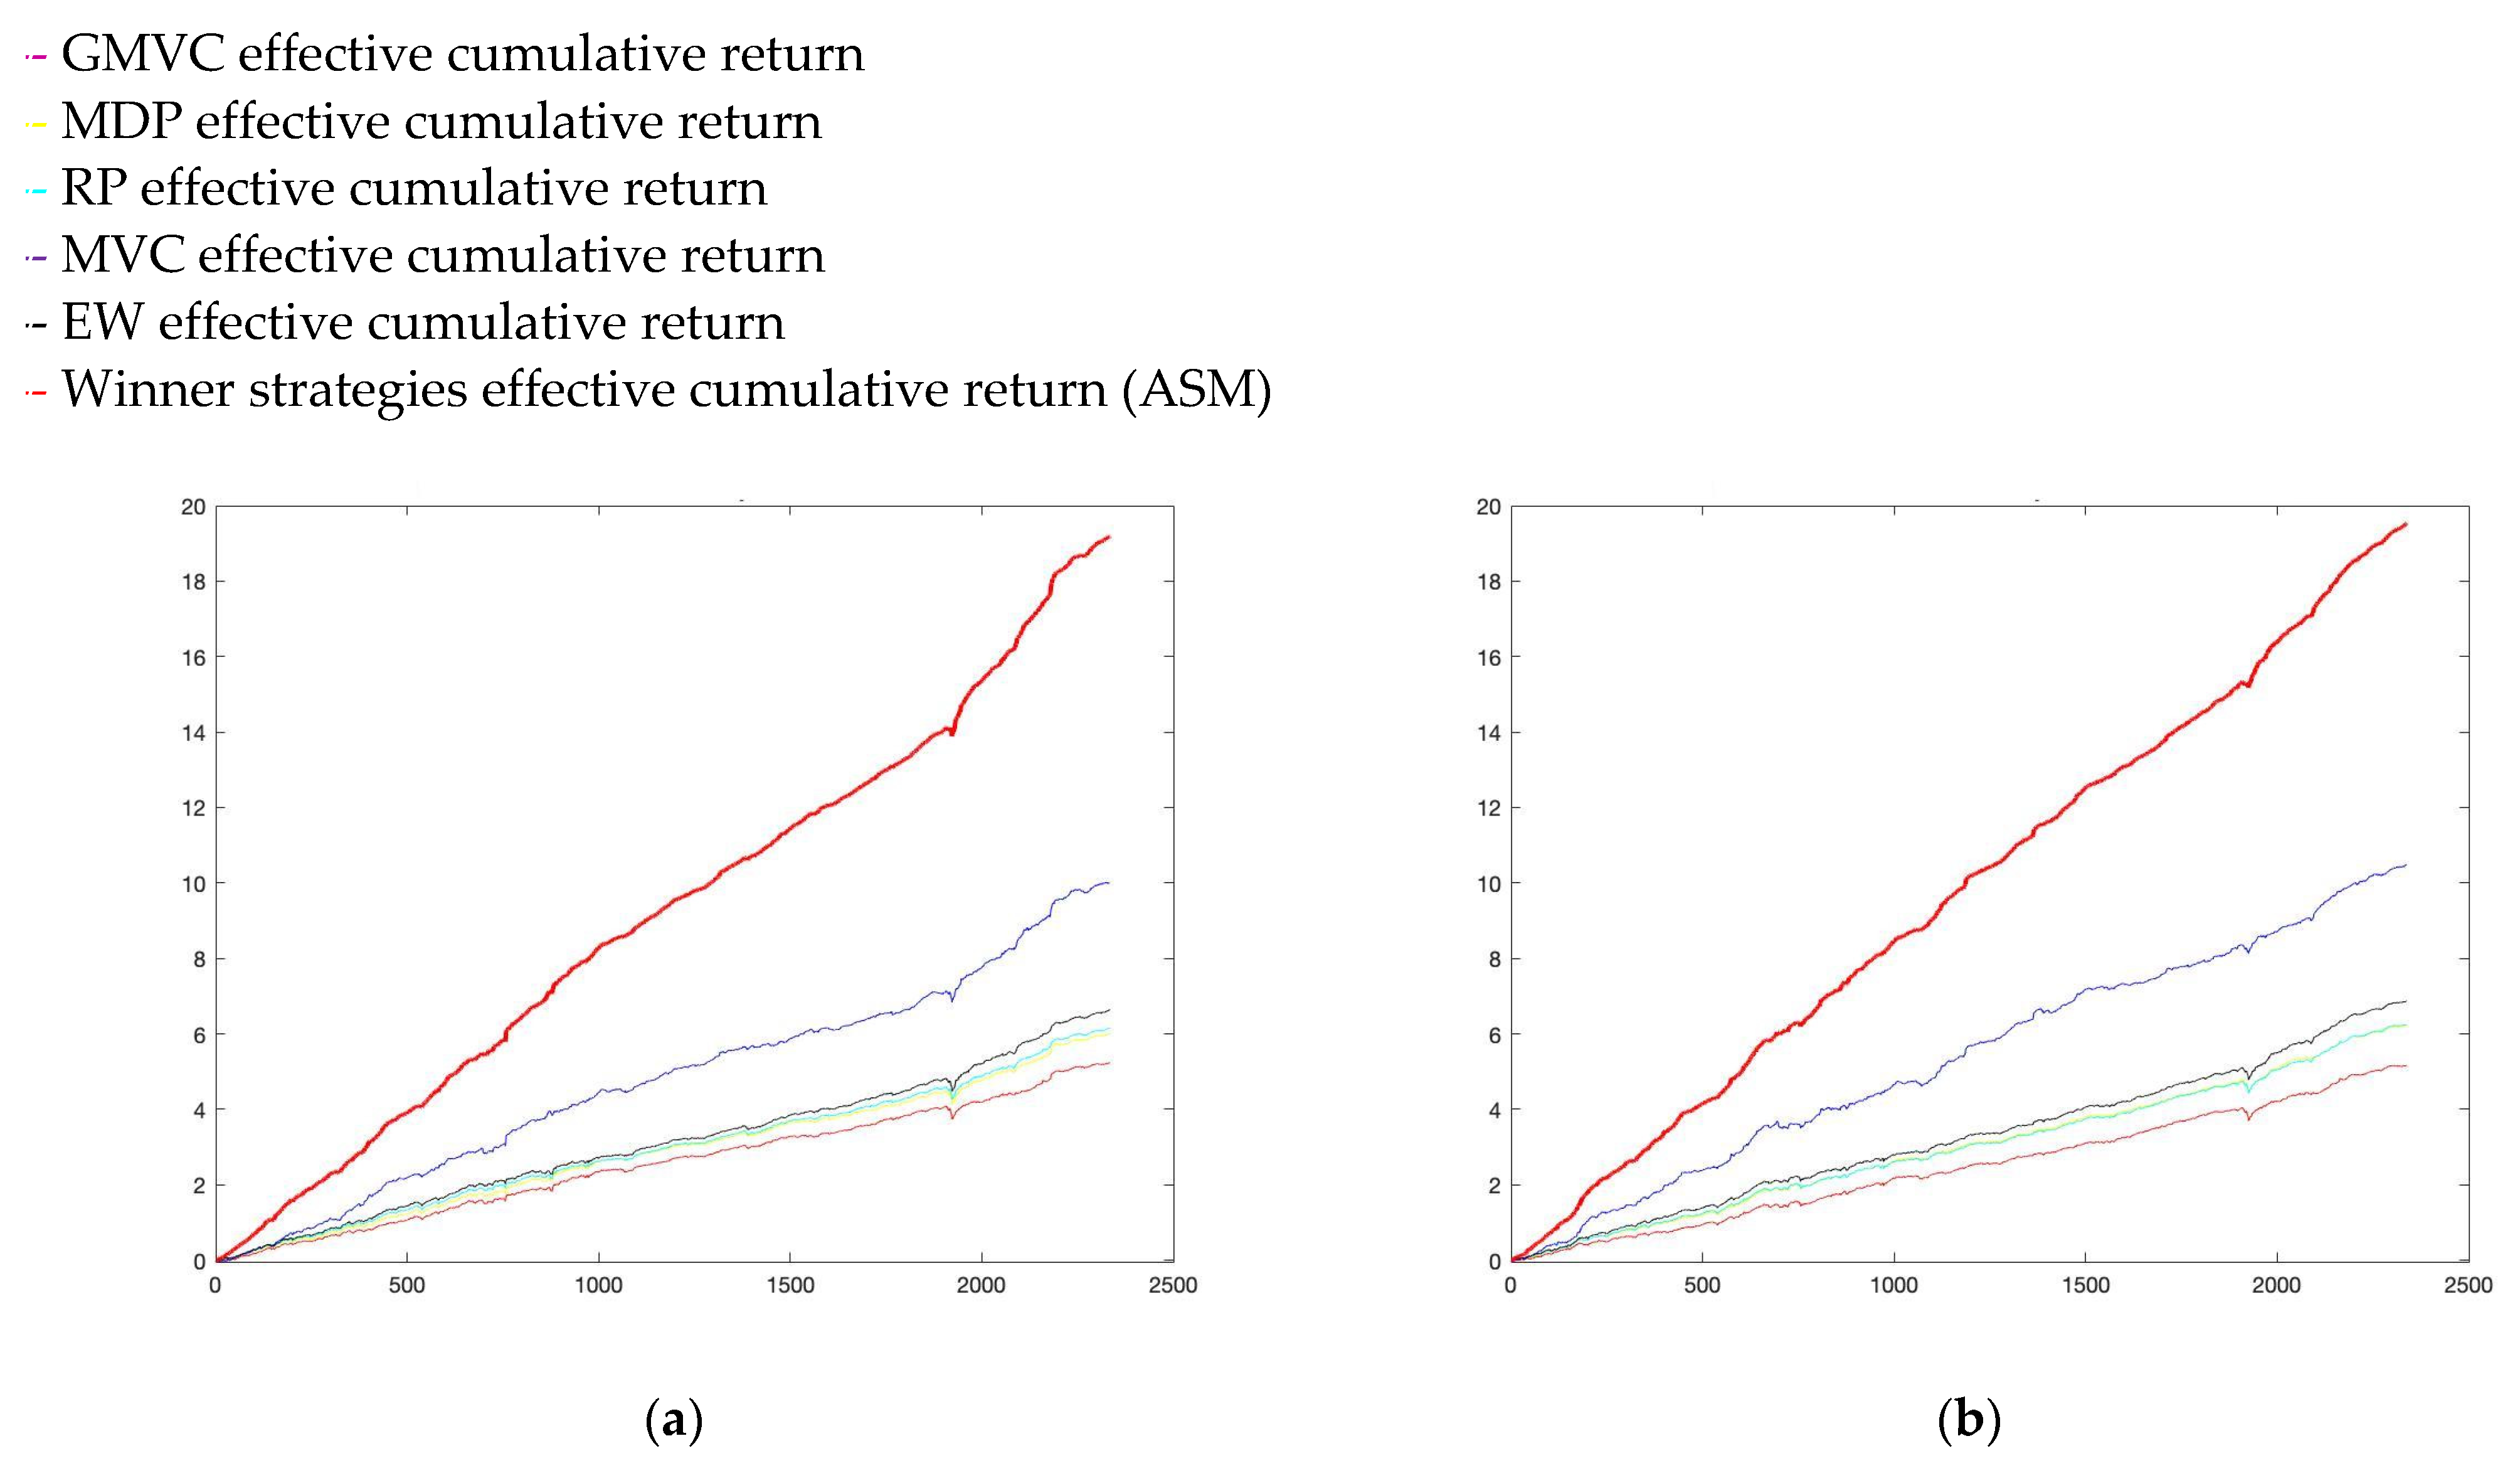
- The preselection of securities, in all three different draws (5, 10, 15) shows positive results, i.e., the trend of cumulative returns is always positive for each strategy adopted, albeit lower than that of the ASM;
- -
- Individual strategies improve performance when applied with stocks identified by the ASM preselection;
- -
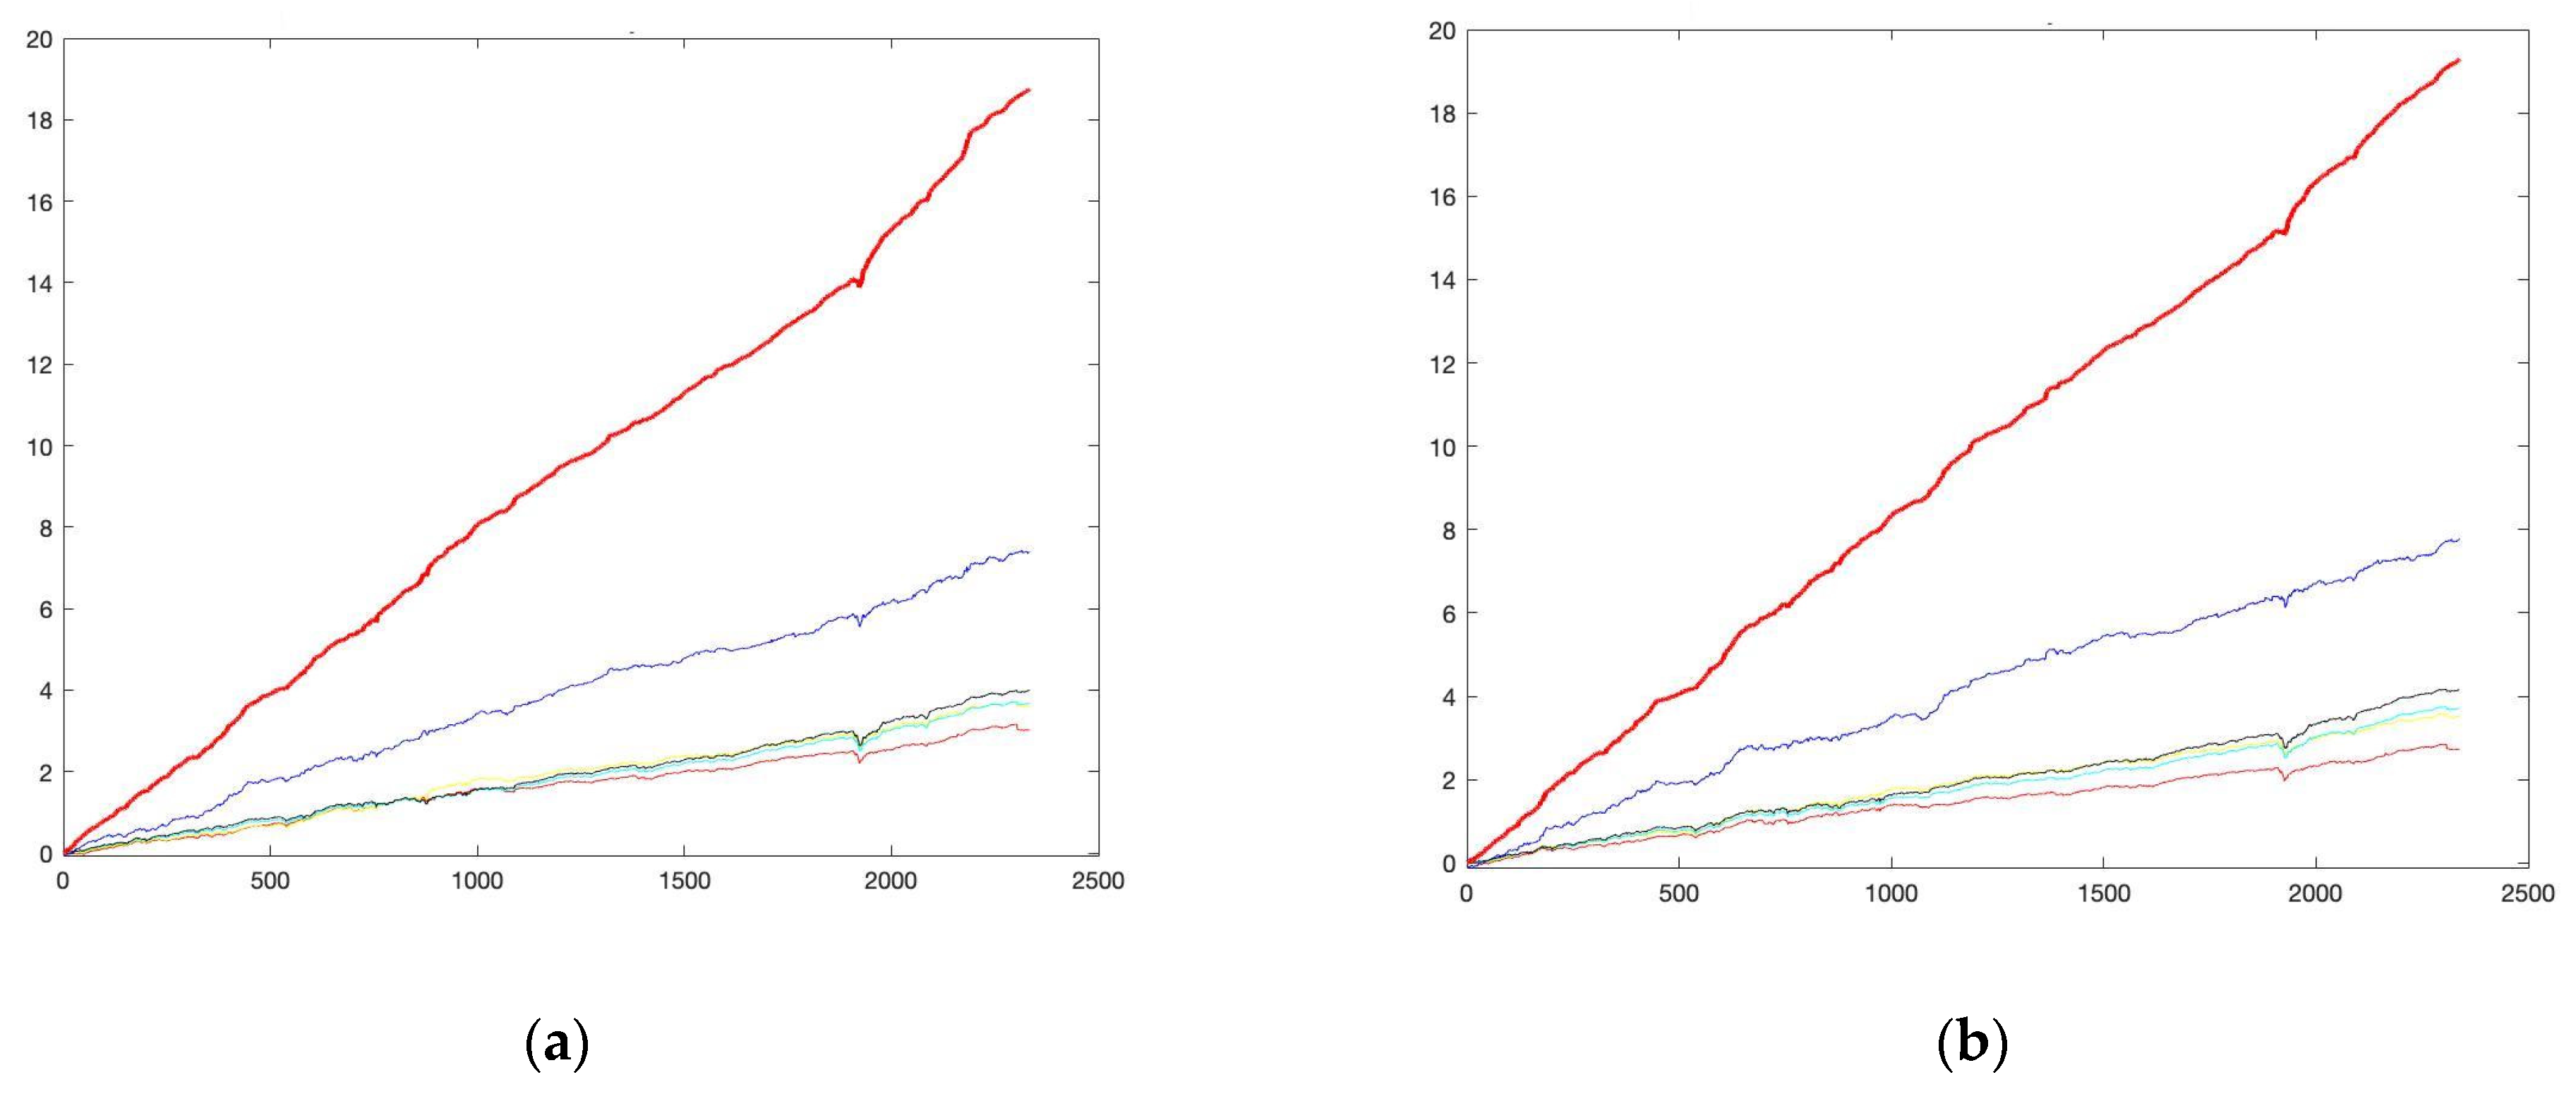
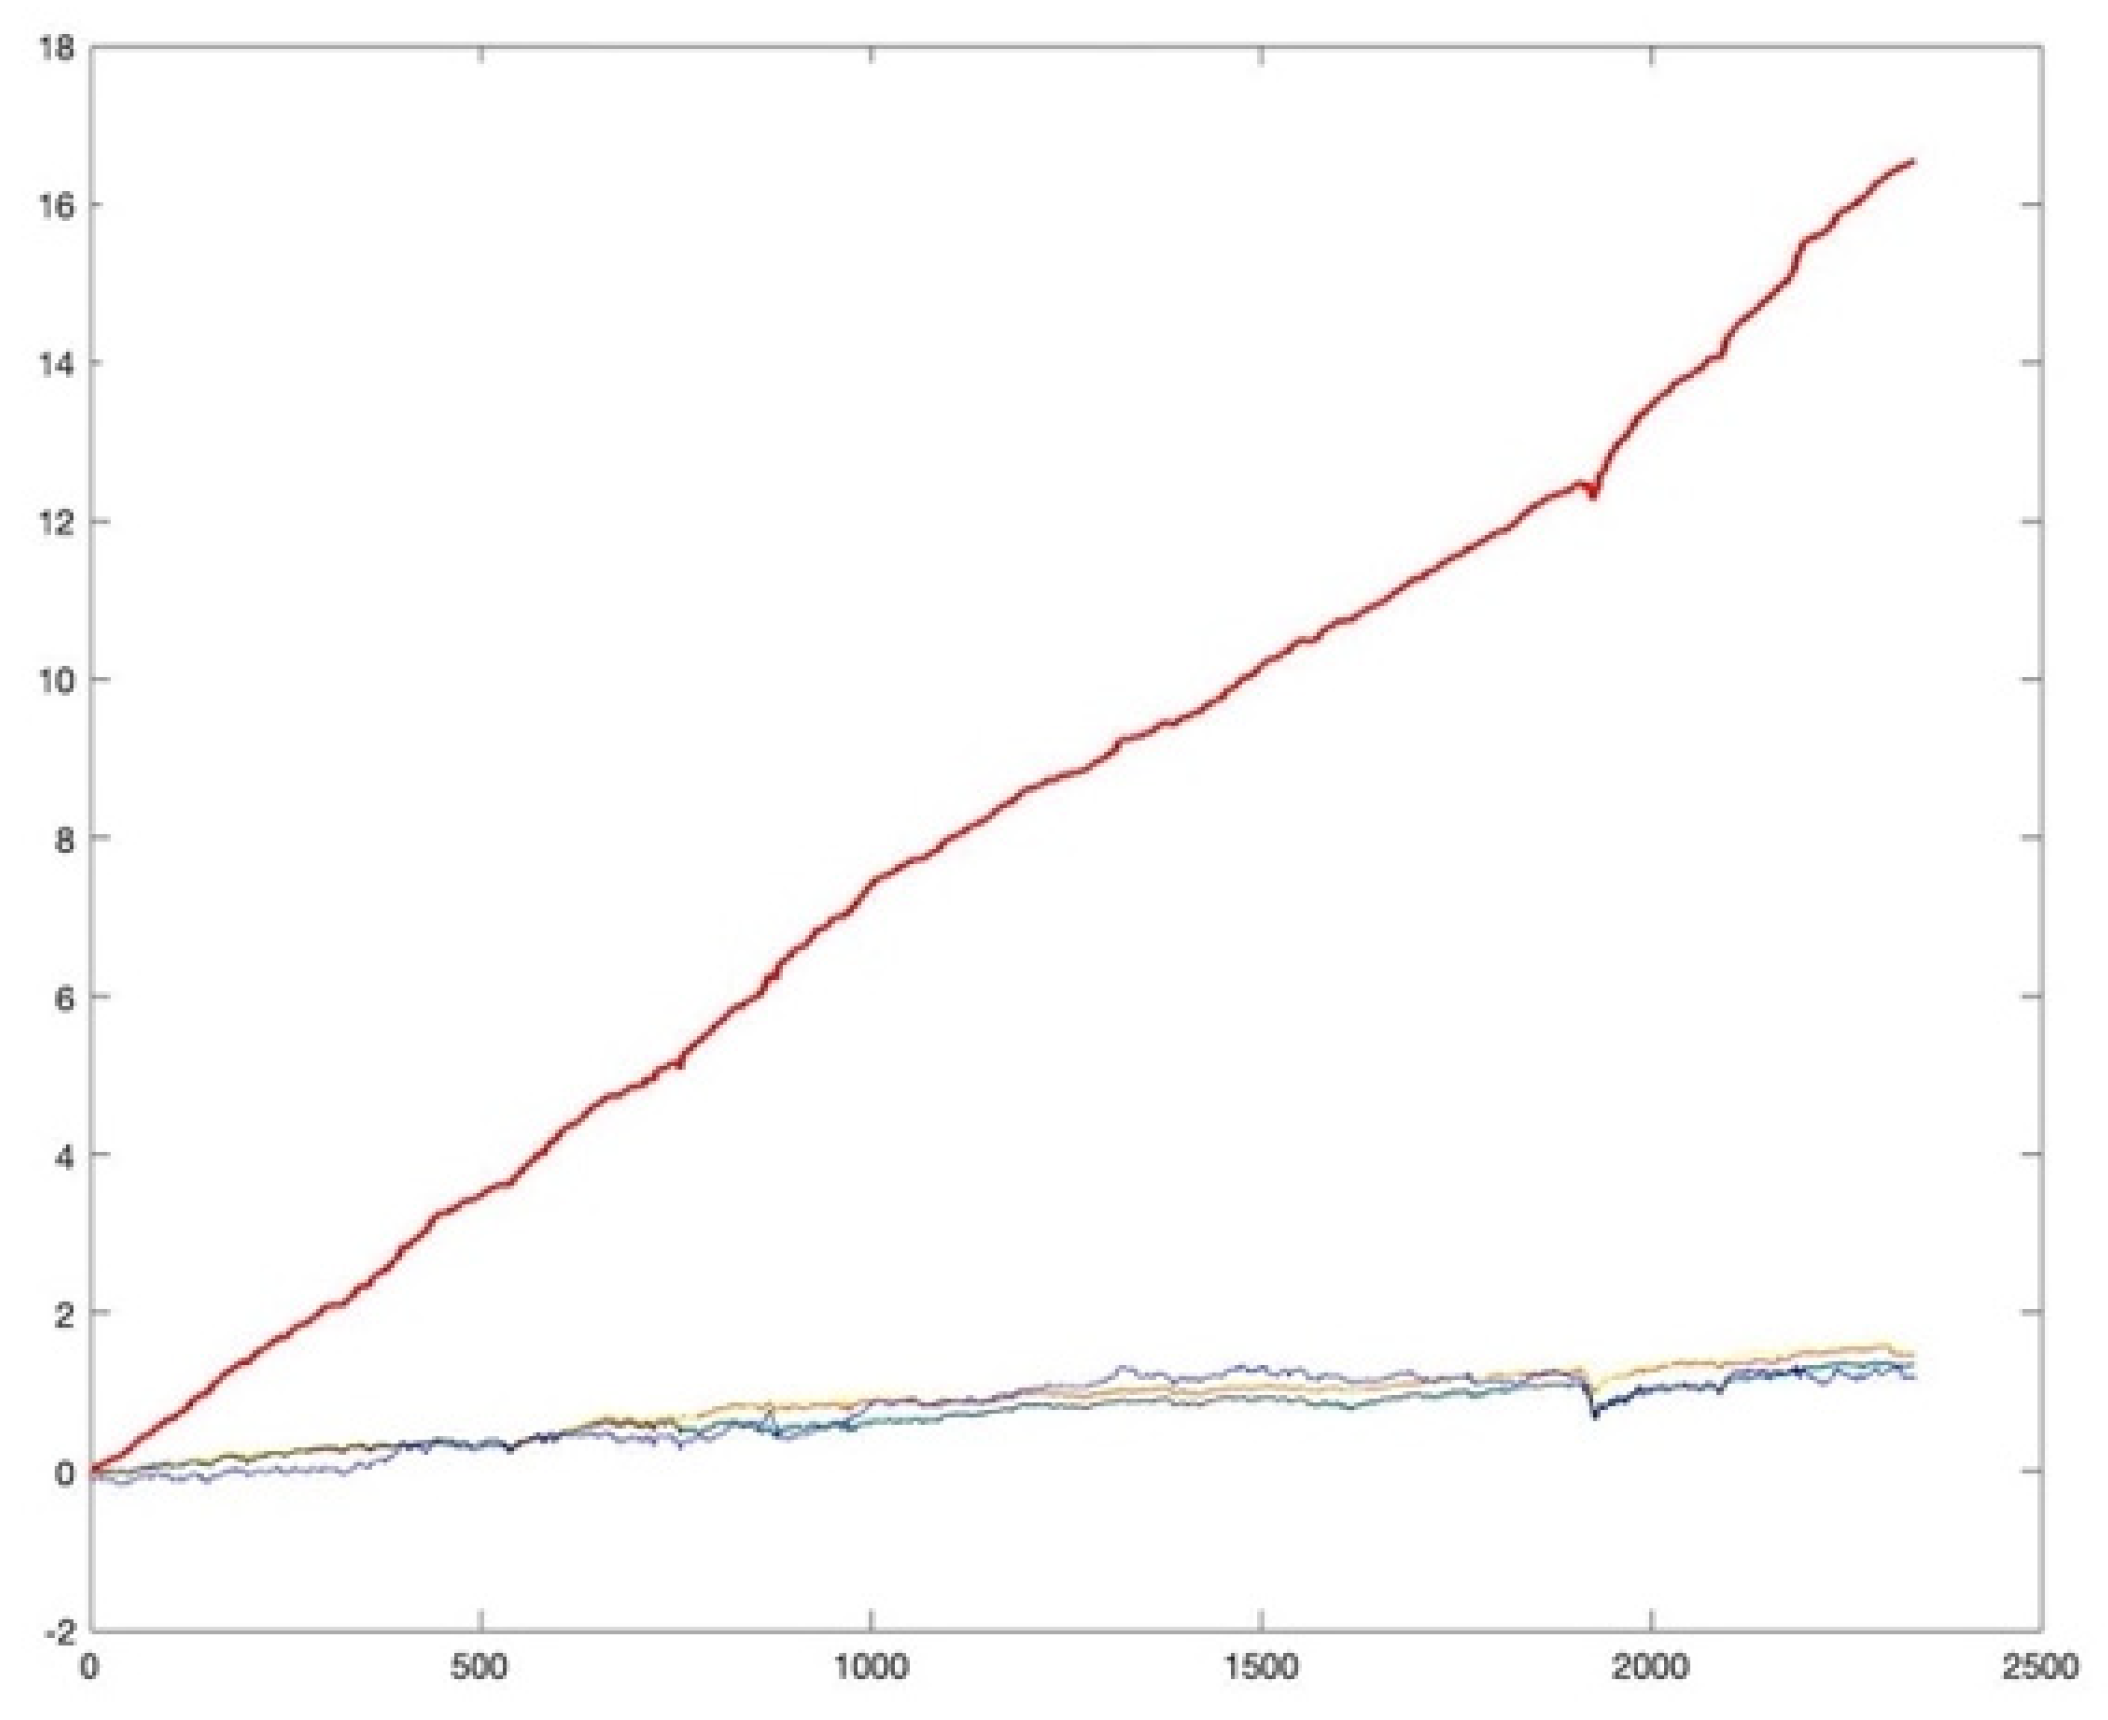
- In absence of preselectiom, this does not happen. Figure 5 shows the investing in the full basket of the Eurostoxx50;
- -
- The best results are obtained for Eurostoxx50-ESG;
- -
- The ASM is a robust model to identify the best Stocks to invest.
- -
- Securities with ESG scoring, present in the highest number in Eurostoxx50 (40 out of 50), are not systematically more profitable than those without ESG scoring;
- -
- Securities with ESG scoring, attributable to the Eurostoxx50-ESG blue chips, are not systematically more profitable than substitutes (10 out of 50) for securities without ESG scoring.
5. Discussion
- On the left column of the matrix, the percentage of stocks that are excluded from the initial Eurostoxx50 to construct the Eurostoxx50-ESG on the total of stocks preselected (black color) and the percentage of the latter who have launched CE initiatives (blue color);
- On the right column of the matrix, the percentage of stocks that are included to form the Eurostoxx50-ESG on the total of stocks preselected (black color) and the percentage of the latter who have launched CE initiatives (blue color);
- On the left column of the matrix the percentage of stocks that are not excluded from the initial Eurostoxx50, on the total of stocks preselected (black color) and the percentage of Eurostoxx50 stocks which have launched CE initiatives (blue color);
- On the right column of the matrix, the percentage of stocks in the Eurostoxx50-ESG which are ESG compliant on the total of stocks preselected, clearly, for the Eurostoxx50 ESG is 1 (Black color), and the percentage of the Eurostoxx50-ESG index stocks which have launched CE initiatives (Blue color).
6. Conclusions
Author Contributions
Funding
Institutional Review Board Statement
Informed Consent Statement
Data Availability Statement
Conflicts of Interest
References
- Financial Stability Board. Available online: https://www.fsb.org/wp-content/uploads/P231120.pdf (accessed on 5 January 2022).
- Morea, D.; Poggi, L.A. Islamic Finance and Renewable Energy: An Innovative Model for the Sustainability of Investments. In Proceedings of the International Annual Conference (AEIT), Capri, Italy, 5–7 October 2016. [Google Scholar] [CrossRef]
- OECD. Available online: https://www.oecd.org/finance/ESG-Investing-Practices-Progress-Challenges.pdf (accessed on 5 January 2022).
- Global Sustainable Investment Alliance. Available online: http://www.gsi-alliance.org/trends-report-2020/ (accessed on 5 January 2022).
- EUR-Lex. Available online: https://eur-lex.europa.eu/legal-content/EN/TXT/?uri=CELEX%3A52018DC0097 (accessed on 5 January 2022).
- European Commission. Available online: https://ec.europa.eu/info/publications/sustainable-finance-technical-expert-group_en (accessed on 5 January 2022).
- Korhonen, J.; Honkasalo, A.; Seppälä, J. Circular Economy: The Concept and its Limitations. Ecol. Econ. 2018, 143, 37–46. [Google Scholar] [CrossRef]
- Kirchherr, J.; Reike, D.; Hekkert, M. Conceptualizing the circular economy: An analysis of 114 definitions. Resour. Conserv. Recycl. 2017, 127, 221–232. [Google Scholar] [CrossRef]
- Murray, A.; Skene, K.; Haynes, K. The Circular Economy: An Interdisciplinary Exploration of the Concept and Application in a Global Context. J. Bus. Ethics 2017, 140, 369–380. [Google Scholar] [CrossRef] [Green Version]
- Morea, D.; Fortunati, S.; Martiniello, L. Circular economy and corporate social responsibility: Towards an integrated strategic approach in the multinational cosmetics industry. J. Clean. Prod. 2021, 315, 128232. [Google Scholar] [CrossRef]
- Alhawari, O.; Awan, U.; Bhutta, M.K.S.; Ali Ülkü, M. Insights from Circular Economy Literature: A Review of Extant Definitions and Unravelling Paths to Future Research. Sustainability 2021, 13, 859. [Google Scholar] [CrossRef]
- Awan, U.; Kanwal, N.; Bhutta, M.K.S. A Literature Analysis of Definitions for a Circular Economy. In Logistics Operations and Management for Recycling and Reuse; Golinska-Dawson, P., Ed.; Springer: Berlin/Heidelberg, Germany, 2020; pp. 19–34. [Google Scholar] [CrossRef]
- Fortunati, S.; Morea, D.; Mosconi, E.M. Circular Economy and Corporate Social Responsibility in the Agricultural System: Cases Study of the Italian Agri-Food Industry. Agric. Econ. 2020, 66, 489–498. [Google Scholar] [CrossRef]
- European Commission. Available online: https://ec.europa.eu/info/strategy/priorities-2019-2024/european-green-deal_en (accessed on 5 January 2022).
- European Union. Available online: https://europa.eu/next-generation-eu/index_en (accessed on 5 January 2022).
- European Commission. Available online: https://ec.europa.eu/environment/strategy/circular-economy-action-plan_en (accessed on 5 January 2022).
- European Commission. Available online: https://ec.europa.eu/info/business-economy-euro/banking-and-finance/sustainable-finance/eu-taxonomy-sustainable-activities_en (accessed on 5 January 2022).
- Figge, F.; Thorpe, A.S.; Givry, P.; Canning, L.; Franklin-Johnson, E. Longevity and circularity as indicators of eco-efficient resource use in the circular economy. Ecol. Econ. 2018, 150, 297–306. [Google Scholar] [CrossRef]
- Sassanelli, C.; Rosa, P.; Rocca, R.; Terzi, S. Circular economy performance assessment methods: A systematic literature review. J. Clean. Prod. 2019, 229, 440–453. [Google Scholar] [CrossRef]
- Corona, B.; Shen, L.; Reike, D.; Carreon, J.R.; Worrell, E. Towards sustainable development through the circular economy—A review and critical assessment on current circularity metrics. Resour. Conserv. Recycl. 2019, 151, 104498. [Google Scholar] [CrossRef]
- Elia, V.; Gnoni, M.G.; Tornese, F. Measuring circular economy strategies through index methods: A critical analysis. J. Clean. Prod. 2017, 142, 2741–2751. [Google Scholar] [CrossRef]
- Haas, W.; Krausmann, F.; Wiedenhofer, D.; Heinz, M. How circular is the global economy? An assessment of material flows, waste production, and recycling in the European Union and the world in 2005. J. Ind. Ecol. 2015, 19, 765–777. [Google Scholar] [CrossRef]
- Awan, U.; Kraslawski, A.; Huiskonen, J. Understanding the relationship between stakeholder pressure and sustainability performance in manufacturing firms in Pakistan. Procedia Manuf. 2017, 11, 768–777. [Google Scholar] [CrossRef]
- Friede, G.; Busch, T.; Bassen, A. ESG and financial performance: Aggregated evidence from more than 2000 empirical studies. J. Sustain. Financ. Invest. 2015, 5, 210–233. [Google Scholar] [CrossRef] [Green Version]
- Krüger, P. Corporate goodness and shareholder wealth. J. Financ. Econ. 2015, 115, 304–329. [Google Scholar] [CrossRef]
- Naughton, J.P.; Wang, C.; Yeung, I. Investor Sentiment for Corporate Social Performance. Account. Rev. 2019, 94, 401–420. [Google Scholar] [CrossRef]
- Flammer, C. Corporate social responsibility and shareholder reaction: The environmental awareness of investors. Acad. Manag. J. 2013, 56, 758–781. [Google Scholar] [CrossRef] [Green Version]
- Capelle-Blancard, G.; Petit, A. Every little helps? ESG news and stock market reaction. J. Bus. Ethics 2019, 157, 543–565. [Google Scholar] [CrossRef]
- Cheng, I.H.; Hong, H.; Shue, K. Do Managers Do Good with Other People’s Money? National Bureau of Economic Research: Cambridge, MA, USA, 2013. [Google Scholar] [CrossRef]
- Dhaliwal, D.S.; Li, Z.O.; Tsang, A.; Yang, Y.G. Voluntary Nonfinancial Disclosure and the Cost of Equity Capital: The Initiation of Corporate Social Responsibility Reporting. Account. Rev. 2011, 86, 59–100. [Google Scholar] [CrossRef]
- Ioannou, I.; Serafeim, G. The Impact of Corporate Social Responsibility on Investment Recommendations: Analysts’ Perceptions and Shifting Institutional Logics. Strateg. Manag. J. 2015, 36, 1053–1081. [Google Scholar] [CrossRef] [Green Version]
- Khan, M.; Serafeim, G.; Yoon, A. Corporate Sustainability: First Evidence on Materiality. Account. Rev. 2016, 91, 1697–1724. [Google Scholar] [CrossRef] [Green Version]
- Eccles, R.G.; Ioannou, I.; Serafeim, G. The Impact of Corporate Sustainability on Organizational Processes and Performance. Manag. Sci. 2014, 60, 2835–2857. [Google Scholar] [CrossRef] [Green Version]
- Dimson, E.; Karakaş, O.; Li, X. Active ownership. Rev. Financ. Stud. 2015, 28, 3225–3268. [Google Scholar] [CrossRef] [Green Version]
- Cui, B.; Docherty, P. Stock Price Overreaction to ESG Controversies. Available online: https://papers.ssrn.com/sol3/papers.cfm?abstract_id=3559915 (accessed on 5 January 2022).
- Latino, C.; Pelizzon, L.; Rzeźnik, A. The Salience of ESG Ratings for Stock Pricing: Evidence From (Potentially) Confused Investors. Available online: https://www.econstor.eu/handle/10419/243279 (accessed on 5 January 2022).
- Shanaev, S.; Ghimire, B. When ESG meets AAA: The effect of ESG rating changes on stock returns. Financ. Res. Lett. 2021, in press. [Google Scholar] [CrossRef]
- Demers, E.; Hendrikse, J.; Joos, P.; Lev, B. ESG did not immunize stocks during the COVID-19 crisis, but investments in intangible assets did. J. Bus. Financ. Account. 2021, 48, 433–462. [Google Scholar] [CrossRef] [PubMed]
- Pizzutilo, F.; Mariani, M.; Caragnano, A.; Zito, M. Dealing with Carbon Risk and the Cost of Debt: Evidence from the European Market. Int. J. Financ. Stud. 2020, 8, 61. [Google Scholar] [CrossRef]
- Whelan, T.; Atz, U.; Van Holt, T.; Clark, C. ESG and Financial Performance: Uncovering the Relationship by Aggregating Evidence from 1000 Plus Studies Published between 2015–2020. Leonard N. Stern School of Business New York, Center for Sustainable Business. Available online: https://www.stern.nyu.edu/sites/default/files/assets/documents/NYU-RAM_ESG-Paper_2021%20Rev_0.pdf (accessed on 5 January 2022).
- La Torre, M.; Mango, F.; Cafaro, A.; Leo, S. Does the ESG index affect the stock returns? Evidence for the Eurostoxx 50. Sustainability 2020, 12, 6387. [Google Scholar] [CrossRef]
- Sahut, J.M.; Pasquini-Descomps, H. ESG Impact on Market Performance of Firms: International Evidence. Manag. Int. 2015, 19, 40–63. [Google Scholar] [CrossRef] [Green Version]
- Lööf, H.; Sahamkhadam, M.; Stephan, A. Is corporate social responsibility investing a free lunch? the relationship between ESG, tail risk, and upside potential of stocks before and during the COVID-19 crisis. Financ. Res. Lett. 2021. [Google Scholar] [CrossRef]
- Filbeck, G.; Robbins, E.; Zhao, X. Social capital during the coronavirus pandemic: The value of corporate benevolence. Appl. Econ. 2021. [Google Scholar] [CrossRef]
- Chen, H.Y.; Yang, S.S. Do investors exaggerate corporate ESG information? evidence of the ESG momentum effect in the taiwanese market. Pac. Basin Financ. J. 2020, 63, 1–13. [Google Scholar] [CrossRef]
- Engelhardt, N.; Ekkenga, J.; Posch, P. Esg ratings and stock performance during the COVID-19 crisis. Sustainability 2021, 13, 7133. [Google Scholar] [CrossRef]
- Broadstock, D.; Chan, K.; Cheng, L.T.W.; Wang, X. The role of ESG performance during times of financial crisis: Evidence from COVID-19 in China. Financ. Res. Lett. 2021, 38, 101716. [Google Scholar] [CrossRef] [PubMed]


| Index | Sample Mean | Sample Variance |
|---|---|---|
| EuroStoxx50 | 0.63593 | 37.38800 |
| EuroStoxx50-ESG | 0.02765 | 15.0072 |
| (a) | |
| EuroStoxx50 | P-Daily |
| AD.AS | 52.70% |
| FLTR.IR | 38.70% |
| AMS.MC | 35.30% |
| ADS.DE | 31.10% |
| KNEBV.BE | 25.00% |
| (b) | |
| EuroStoxx50-ESG | P-Daily |
| AD.AS | 48.70% |
| AMS.MC | 31.50% |
| ADS.DE | 29.50% |
| TEP.PA | 25.40% |
| KNEBV.HE | 24.50% |
| (a) | |
| EuroStoxx50 | P-Daily |
| AD.AS | 66.90% |
| AMS.MC | 49.70% |
| FLTR.IR | 47.30% |
| KNEBV.HE | 46.20% |
| ASML.AS | 42.30% |
| ADS.DE | 40.80% |
| DB1.DE | 38.00% |
| RI.PA | 35.30% |
| IBE.MC | 34.60% |
| VIV.PA | 27.30% |
| (b) | |
| EuroStoxx50-ESG | P-Daily |
| AD.AS | 64.50% |
| TEP.PA | 46.20% |
| AMS.MC | 45.90% |
| KNEBV.HE | 43.40% |
| ASML.AS | 40.80% |
| RYA.L | 40.50% |
| ADS.DE | 40.20% |
| MRK.DE | 35.40% |
| RI.PA | 33.60% |
| IBE.MC | 30.00% |
| (a) | |
| EuroStoxx50 | P-Daily |
| AD.AS | 77.00% |
| DB1.DE | 68.40% |
| AMS.MC | 60.20% |
| KNEBV.HE | 57.40% |
| FLTR.IR | 55.00% |
| ASML.AS | 54.60% |
| BN.PA | 54.30% |
| ADS.DE | 50.50% |
| RI.PA | 46.60% |
| IBE.MC | 43.00% |
| VIV.PA | 40.50% |
| AI.PA | 36.30% |
| SAN.PA | 35.60% |
| CS.PA | 34.00% |
| SAF.PA | 33.90% |
| (b) | |
| EuroStoxx50-ESG | P-Daily |
| AD.AS | 73.60% |
| TEP.PA | 59.30% |
| DB1.DE | 58.80% |
| AMS.MC | 56.00% |
| KNEBV.HE | 55.60% |
| ASML.AS | 50.60% |
| RYA.L | 49.90% |
| BN.PA | 49.80% |
| ADS.DE | 49.00% |
| MRK.DE | 46.70% |
| RI.PA | 43.50% |
| PUB.PA | 41.60% |
| IBE.MC | 39.40% |
| TRN.MI | 37.70% |
| VOW.PA | 37.30% |
| (a) | ||
| EuroStoxx50 | P-Daily | CE Approach |
| AD.AS | 52.70% | Yes |
| FLTR.IR | 38.70% | No |
| AMS.MC | 35.30% | Yes |
| ADS.DE | 31.10% | Yes |
| KNEBV.BE | 25.00% | Yes |
| (b) | ||
| EuroStoxx50-ESG | P-Daily | CE Approach |
| AD.AS | 48.70% | Yes |
| AMS.MC | 31.50% | Yes |
| ADS.DE | 29.50% | Yes |
| TEP.PA | 25.40% | No |
| KNEBV.HE | 24.50% | Yes |
| (a) | ||
| EuroStoxx50 | P-Daily | CE Approach |
| AD.AS | 66.90% | Yes |
| AMS.MC | 49.70% | Yes |
| FLTR.IR | 47.30% | No |
| KNEBV.HE | 46.20% | Yes |
| ASML.AS | 42.30% | Yes |
| ADS.DE | 40.80% | Yes |
| DB1.DE | 38.00% | No |
| RI.PA | 35.30% | Yes |
| IBE.MC | 34.60% | Yes |
| VIV.PA | 27.30% | Yes |
| (b) | ||
| EuroStoxx50-ESG | P-Daily | CE Approach |
| AD.AS | 64.50% | Yes |
| TEP.PA | 46.20% | No |
| AMS.MC | 45.90% | Yes |
| KNEBV.HE | 43.40% | Yes |
| ASML.AS | 40.80% | Yes |
| RYA.L | 40.50% | Yes |
| ADS.DE | 40.20% | No |
| MRK.DE | 35.40% | Yes |
| RI.PA | 33.60% | Yes |
| IBE.MC | 30.00% | Yes |
| (a) | ||
| EuroStoxx50 | P-Daily | CE Approach |
| AD.AS | 77.00% | Yes |
| DB1.DE | 68.40% | No |
| AMS.MC | 60.20% | Yes |
| KNEBV.HE | 57.40% | Yes |
| FLTR.IR | 55.00% | No |
| ASML.AS | 54.60% | Yes |
| BN.PA | 54.30% | No |
| ADS.DE | 50.50% | Yes |
| RI.PA | 46.60% | Yes |
| IBE.MC | 43.00% | Yes |
| VIV.PA | 40.50% | Yes |
| AI.PA | 36.30% | Yes |
| SAN.PA | 35.60% | Yes |
| CS.PA | 34.00% | No |
| SAF.PA | 33.90% | Yes |
| (b) | ||
| EuroStoxx50-ESG | P-Daily | CE Approach |
| AD.AS | 73.60% | Yes |
| TEP.PA | 59.30% | No |
| DB1.DE | 58.80% | No |
| AMS.MC | 56.00% | Yes |
| KNEBV.HE | 55.60% | Yes |
| ASML.AS | 50.60% | Yes |
| RYA.L | 49.90% | Yes |
| BN.PA | 49.80% | No |
| ADS.DE | 49.00% | Yes |
| MRK.DE | 46.70% | Yes |
| RI.PA | 43.50% | Yes |
| PUB.PA | 41.60% | Yes |
| IBE.MC | 39.40% | Yes |
| TRN.MI | 37.70% | Yes |
| VOW.PA | 37.30% | Yes |
| x | Excluded Stocks | ESG Substitutes | |
|---|---|---|---|
| Simulation | |||
| x/5 | 0.20 | 0.20 | |
| x/10 | 0.10 | 0.30 | |
| x/15 | 0.13 | 0.33 | |
| x | Excluded Stocks/CE | ESG Substitutes/CE | |
|---|---|---|---|
| x/Preselected Num. | |||
| x/5 | 0.20 (0.0) | 0.20 (0.0) | |
| x/10 | 0.10 (0.0) | 0.30 (0.20) | |
| x/15 | 0.13 (0.06) | 0.33 (0.26) | |
| x | ESG + CE Approach EuroStoxx50 | ESG + CE Approach EuroStoxx50-ESG | |
|---|---|---|---|
| x/Preselected Num. | |||
| x/5 | 0.80 (0.80) | 1 (0.80) | |
| x/10 | 0.90 (0.80) | 1 (0.80) | |
| x/15 | 0.86 (0.73) | 1 (0.80) | |
Publisher’s Note: MDPI stays neutral with regard to jurisdictional claims in published maps and institutional affiliations. |
© 2022 by the authors. Licensee MDPI, Basel, Switzerland. This article is an open access article distributed under the terms and conditions of the Creative Commons Attribution (CC BY) license (https://creativecommons.org/licenses/by/4.0/).
Share and Cite
Morea, D.; Mango, F.; Cardi, M.; Paccione, C.; Bittucci, L. Circular Economy Impact Analysis on Stock Performances: An Empirical Comparison with the Euro Stoxx 50® ESG Index. Sustainability 2022, 14, 843. https://doi.org/10.3390/su14020843
Morea D, Mango F, Cardi M, Paccione C, Bittucci L. Circular Economy Impact Analysis on Stock Performances: An Empirical Comparison with the Euro Stoxx 50® ESG Index. Sustainability. 2022; 14(2):843. https://doi.org/10.3390/su14020843
Chicago/Turabian StyleMorea, Donato, Fabiomassimo Mango, Mavie Cardi, Cosimo Paccione, and Lucilla Bittucci. 2022. "Circular Economy Impact Analysis on Stock Performances: An Empirical Comparison with the Euro Stoxx 50® ESG Index" Sustainability 14, no. 2: 843. https://doi.org/10.3390/su14020843
APA StyleMorea, D., Mango, F., Cardi, M., Paccione, C., & Bittucci, L. (2022). Circular Economy Impact Analysis on Stock Performances: An Empirical Comparison with the Euro Stoxx 50® ESG Index. Sustainability, 14(2), 843. https://doi.org/10.3390/su14020843