Article

Travel-Related Influencer Content on Instagram: How Social Media Fuels Wanderlust and How to Mitigate the Effect

Department of Business Administration, University of Bamberg, 96045 Bamberg, Germany
Sustainability 2022, 14(2), 855; https://doi.org/10.3390/su14020855
Submission received: 5 November 2021 / Revised: 21 December 2021 / Accepted: 22 December 2021 / Published: 12 January 2022
(This article belongs to the Section Environmental Sustainability and Applications)

Abstract

:
Tremendous efforts will be required in the coming decades to limit the harmful effects of climate change. This includes travel behavior, which not only has a significant impact on climate but also affects the perceived justice and trust necessary to manage the transition to net zero successfully. Technologies such as social media can promote behavioral change; unfortunately, also for the negative. Drawing on social comparison theory, social identity theory, and the theory of planned behavior, this study uses a PLS-SEM model to investigate if and under which circumstances exposure to travel-related content posted by professional influencers affects their followers’ travel intentions. It extends previous studies by explicitly focusing on influencers that use Instagram to make a living and considers the effect of pro-environmental attitudes. On the one hand, it shows that influencers are not only responsible for their travel behavior. Their content stimulates their audiences’ wanderlust through benign envy. On the other hand, the study suggests that reinforcing pro-environmental attitudes can help mitigate the negative climate effects of imitating influencer travel behavior.

1. Introduction

The Paris Agreement was set up to limit global warming to under two degrees Celsius to keep the resulting negative effects tolerable. To achieve this goal, greenhouse gas emissions must be significantly reduced. At the heart of these considerations is the concept of the “remaining carbon budget”. Currently, global annual emissions are estimated to be 42 gigatons (Gt) of CO2-equivalents (CO2e). Rogelj et al. [1] argued that for a 50% chance of limiting global warming to 1.5 degrees Celsius by 2050, only 480 Gt of CO2e remain. Assuming an average population of 8.2 billion between 2020 and 2050, this results in an annual budget of 1.95 tons of CO2e per capita. In 2019, however, the global average annual per capita emission was 4.93 tons of CO2e. With the world’s highest per capita emissions amounting to 15.5 tons of CO2e, the United States is well above average, followed by Russia (12.5 tons of CO2e) and China (8.1 tons of CO2e) [2].
The current values exceed the justifiable level, which inevitably raises the question of how to achieve the needed reductions. One option that involves a comparatively minor intrusion into basic human needs is to critically reflect on tourism, which is estimated to contribute between 5–8% of total emissions [3,4,5]. In turn, since 92–95% are not due to tourism, the question is whether it is worth worrying about. While the mere contribution appears somewhat limited, there are strong arguments in favor. First, before the COVID-19 pandemic, the emissions from travel and tourism were dramatically increasing. Lenzen et al. [4] found that tourism’s global carbon footprint has increased by 15% (from 3.9 to 4.5 Gt CO2e) between 2009 and 2013, four times more than previously estimated. Once COVID-19 related travel restrictions are removed, the previous growth path is expected to be quickly regained. Consequently, the problem will not get smaller in the future, but bigger.
Second, and even more importantly, it is a question of social justice. Several studies show a strong correlation between income and emissions. According to the UNEP [6], the top 1% earners emit more than twice the combined share of the poorest 50%. At the same time, lower-income populations are more vulnerable because they lack the means to protect themselves from the consequences of climate change, such as floods and droughts. This means that climate change primarily affects those who have contributed the least. In that regard, travel, particularly long-distance travel, which has the most significant carbon footprint, manifests high-income lifestyles. Gössling and Humpe [7] showed that only 11% of the world population traveled by air in 2018 and argued that 1% of the most frequent flyers account for more than half of total air travel emissions. Against this background, failure to address travel and tourism-related emissions would increase feelings of injustice, damage trust, and thus affect the necessary transition to climate neutrality.
To prevent this, tourism and travel must not be spared. The temporary disruption of the travel industry due to COVID-19 provided an idea of how lifestyle changes contribute to achieving necessary reductions. According to Le Quéré et al. [8], the restrictions on public life decreased daily global emissions by 17%. Moreover, handling the pandemic has shown a need for leadership that provides clear guidance and social norms to address the problem successfully. In that regard, politicians and celebrities come to mind. For the younger generation, so-called influencers play an increasingly important role [9]. Influencers follow a business model that, at its core, builds a supposedly close and trustworthy relationship amongst a virtual audience on social media platforms with whom they communicate and interact to spread paid advertising messages [10,11].
One of the most popular platforms with more than one billion users since 2018 is Instagram, which this study refers to [12]. To be successful, influencers must be authentic while sticking out of the masses [13], attracting attention through unique and creative content. One way to achieve this is exclusive travel, on which this article focuses. A look at the advertising budgets shows how effective professional influencers are at triggering and reinforcing needs and thus affecting consumer decisions. While advertisers spent only USD 1.78 billion on influencer marketing in 2016, this figure rose to USD 9.78 billion in 2020. By 2021, the market size will jump to USD 13.8 billion [14]. Alongside fashion and beauty, food and fitness, travel is one of the most important campaigning categories. However, traveling and showing off to their audience entails direct and indirect responsibilities.
Direct effects refer to influencers’ behavior. Gössling [15] showed that well-known personalities have a high individual carbon footprint due to frequent air travel. For example, Bill Gates’ flight activities caused more than 1600 tons of CO2e [15]. In contrast, indirect effects address the influence of someone’s behavior on others. Previous research has shown that content on social media platforms, such as Instagram, can effectively change the behavioral intentions of followers [16,17]. There is evidence that user-generated content affects booking decisions [18]. The works most closely related to this investigation are Liu et al. [19] and Latif et al. [20]. Liu et al. [19] drew on the social comparison theory (SCT) and investigated how electronic word-of-mouth by a social media friend about a positive travel experience influences Millennial consumers’ intention to visit that destination. The study used a sample of 303 Millennial Amazon Mechanical Turk workers and conducted an experiment in which they distinguished three stimuli: the travel experience (luxury vs. non-luxury travel), someone’s self-esteem (low vs. high), and the similarity of the experience sharer (similar other vs. dissimilar other). They found a significant three-way interaction effect, i.e., the intention to visit the shared destination was higher among Millennial consumers with low self-esteem when the experience was shared by a similar other and represented luxury travel. If shared by a dissimilar other, such as an influencer, the intention to visit was significantly higher if a displayed destination was perceived as luxurious, while the level of self-esteem had no effect. Besides, they found that the increase in the intention to visit a tourist destination could be explained by benign envy. However, the mediation was only significant if someone had low self-esteem, the experience was shared by a similar other, and the destination was perceived as luxurious.
Latif et al. [20] examined whether benign envy mediates the positive relationship between the exposure to travel pictures posted by social media friends and the intention to visit a tourist destination. In addition, they referred to social identity theory (SIT) and investigated a potential moderating role of online social identity. Data from 295 Facebook users from Pakistan were collected to test their research model. They found evidence for both, i.e., (1) benign envy partially mediated the relationship between the exposure to travel content and the intention to visit a tourist destination and (2) the relationship between content exposure and travel intention was stronger with higher online social identities.
This work complements these two studies by drawing on their general research model (the exposure to travel content on social media positively influences someone’s travel intention, mediated by benign envy). However, this study is the first to investigate this effect for Instagram (vs. unspecified social media [19] or Facebook [20]), influencers (vs. personal friends [19,20]), and for German (vs. American [19] or Pakistani [20]) consumers. Moreover, it is the first study to replicate the reported moderating role of online social identity. Research in social sciences is often driven by novelty and originality. Nevertheless, replication should not be neglected to ensure a robust, generalizable evidence base and allow for meta-analyses [21]. However, the purpose of this study is not only to replicate previous findings but also to provide an extension. In that regard, this research is the first to incorporate the followers’ pro-environmental attitudes. Given the positioning of the study, the overarching research questions are: Does the travel-related influencer content of Instagram influencers affect their followers’ intention to travel by themselves? If so, how can this effect on someone’s travel intention be explained?
The following section establishes the theoretical background while introducing the relevant literature and deriving the hypotheses.

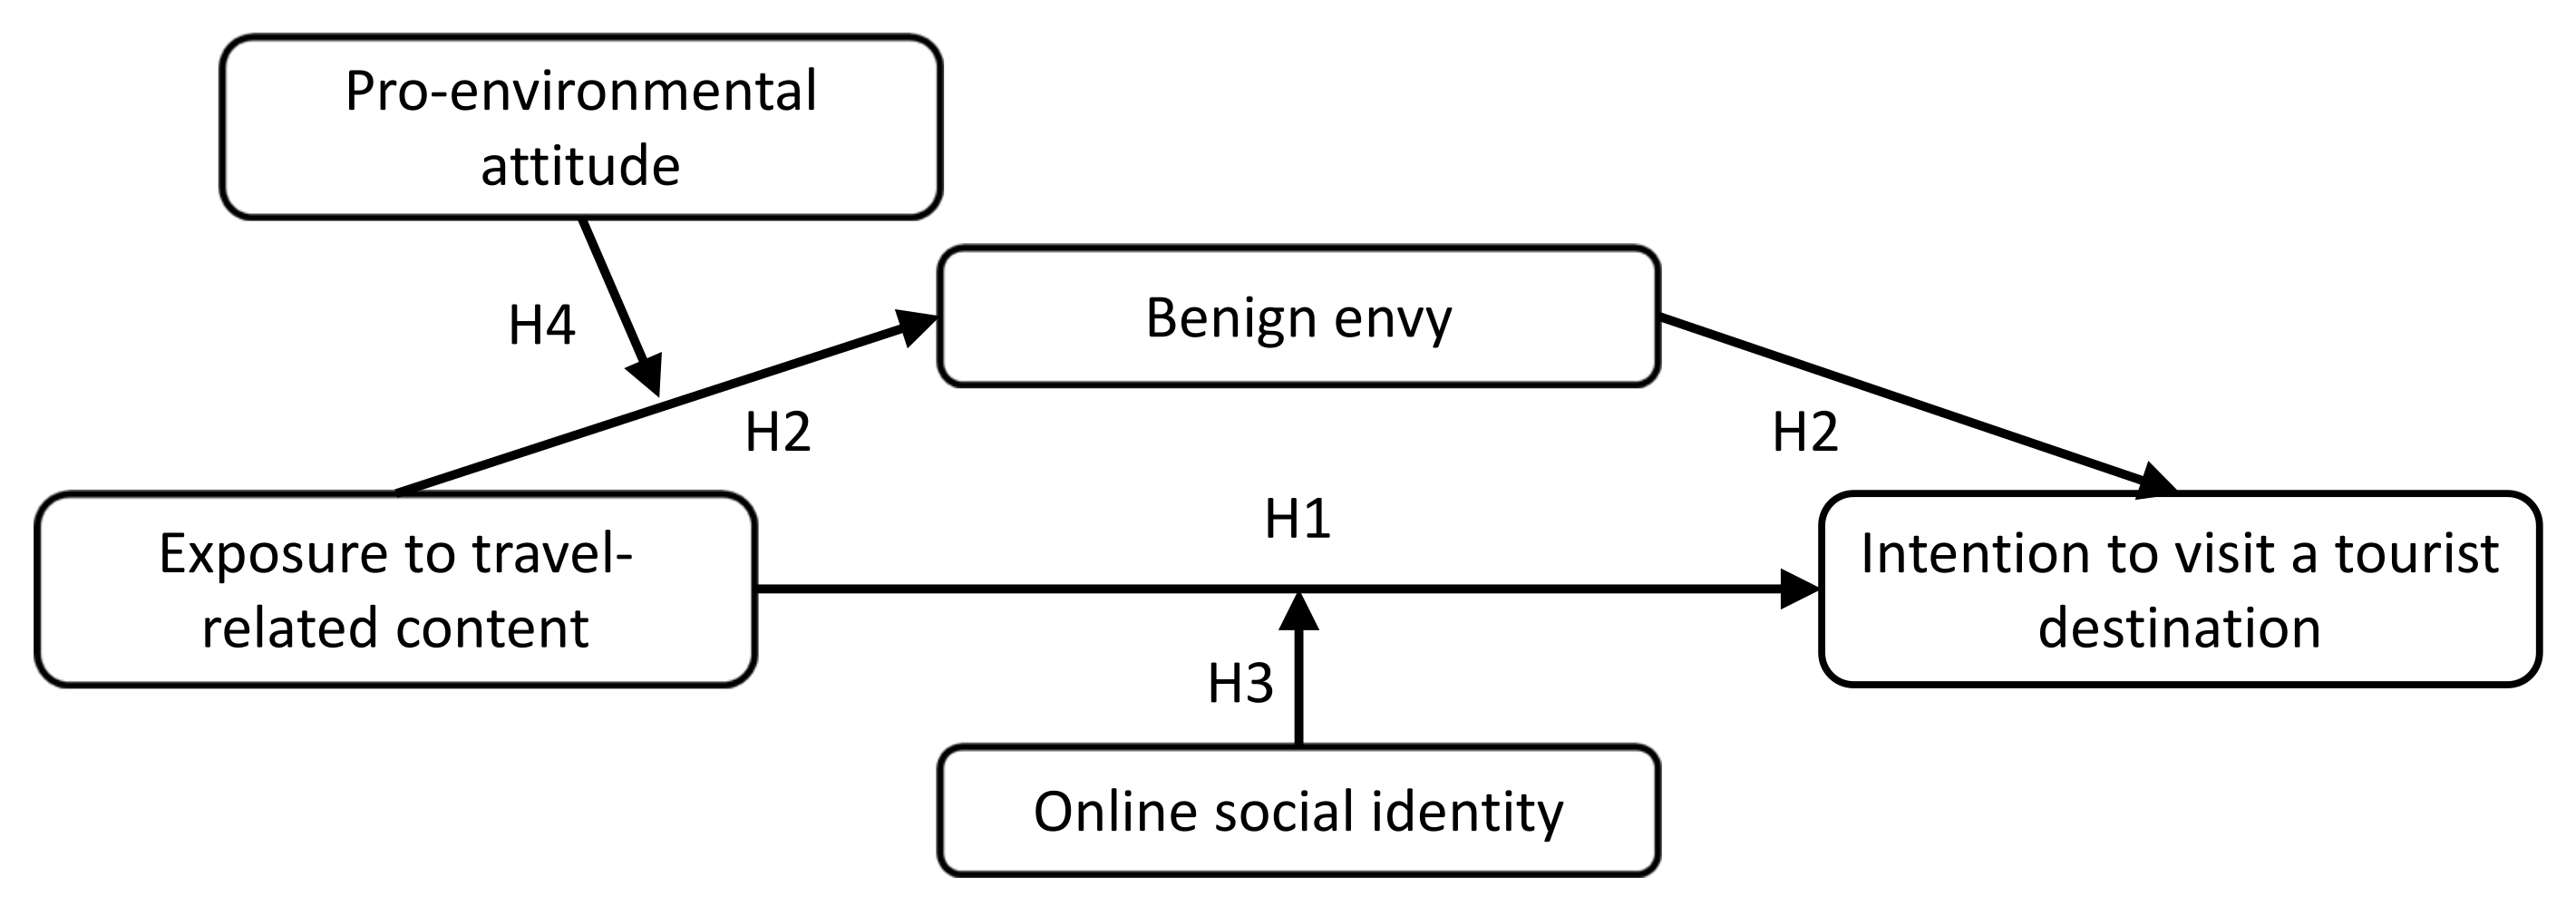
2. Theoretical Background and Derivation of Hypotheses

The most important theoretical lens used in this research is the SCT described by Festinger [22]. Accordingly, people tend to reflect and compare themselves with others to reduce uncertainty through better self-evaluations. Such comparisons are widespread when there is a lack of objectively measurable criteria, when there is uncertainty about one’s abilities and opinions, and when others have similar characteristics [23]. Depending on the status of the person or group with whom someone is comparing, downward or upward social comparisons may occur. The former uses people worse off or as bad off as oneself, which, in turn, raises self-esteem and subjective well-being [24]. The latter is a comparison with someone better-off and perceived as superior [25].
SCT is complemented with SIT, put forward by Tajfel and Turner [26], which posits that people derive part of their identity from the groups they belong to. The strength of the social identity is determined by the identification with the respective group and manifests through the group’s common features, habits, and norms. Social identity can affect not only someone’s feelings but also their behavior [27].
While the SCT and the SIT form the theoretical basis for the replicative part of the research model, the extension regarding pro-environmental attitude is based on the theory of planned behavior (TPB) established by Ajzen [28]. He defined attitude as “(…) the degree to which a person has a favorable or unfavorable evaluation or appraisal of the behavior in question” [28] (p. 188). According to the theory, attitudes, such as pro-environmental attitudes, affect behavioral intention and, thus, behavior.
The nature and circumstances of social comparisons, the idea of social identity on the Internet, and the influence of attitudes are used to establish a research model in the following paragraphs.

2.1. Exposure to Travel-Related Content and the Intention to Visit a Tourist Destination

Traditionally, social comparisons were mainly limited to personally-known, close people such as colleagues, friends, or family. However, the Internet and social media have multiplied the sources of comparisons [29,30]. For instance, Kerr et al. [31] and Liu et al. [19] found upward social comparison on social networking sites, which are predominantly used to share exceptional experiences, status, professional success, and happiness. Recommendation algorithms reinforce this effect, suggesting similar content based on users’ previous behavior and preferences [32]. Verduyn et al. [30] noted that the emergence of social comparisons on social media depends on who uses the platform and how it is used, with passive users that only observe the lives of others particularly affected.
Upward social comparisons triggered by content on social media also pose enormous risks for someone’s subjective well-being. For example, a whistleblower recently reported that internal research shows that exposure to Instagram content contributes to anxiety, eating disorders, depression, and suicidal thoughts, particularly among teenage girls. Accordingly, Instagram makes “(…) body image issues worse for one in three teenage girls” [33]. The internal reports also noted that “social comparison is worse on Instagram” than other social media, such as Facebook or Twitter, because it focuses heavily on body and lifestyle [33]. Based on these results, it can be assumed that exposure to content triggers behavioral responses and not the other way around.
Regarding travel-related content, Latif et al. [20] showed that exposure to travel-related content posted by friends on Facebook initiates upward social comparison to influence one’s self-evaluation positively. As a result, this increases the intention to visit the destination themselves. Since influencers successfully pretend a close, authentic, and trusting relationship with their followers, it is assumed that this effect can also be observed in the studied context of Instagram. In addition, the design of Instagram promotes passive usage, which should further strengthen the effect [34,35]. That is, users are permanently induced to scroll through their Instagram feed, which provides them with a never-ending stream of new pictures, videos, and profiles relevant to their interests. Therefore, employing SCT leads to the first hypothesis:
Hypothesis H1:
Exposure to travel-related content posted by influencers on Instagram increases their followers’ intention to visit a tourist destination themselves.

2.2. The Mediating Role of Benign Envy

In general, people need social connections and social media platforms satisfy those needs in a virtual environment [30]. Therefore, one might expect that the use of such platforms positively impacts someone’s subjective well-being. However, meta-analyses instead suggest an overall negative effect [36,37]. Negative consequences can be lower self-esteem, which often leads to envy. There are two types of envy: malicious envy and benign envy [38].
Malicious envy is a harmful emotion that involves the desire to deprive others of coveted possessions [39]. It refers to toxic, self-consuming, and destructive emotional impulses with the goal of deteriorating the situation of the superior other [40]. In contrast, benign envy involves no hostility. Instead, it is based on self-reflection processes on the reasons for feeling envious. As a result, the mainly negative emotion can unfold something positive by motivating and inspiring self-improvement [41]. The desire to level up can be fulfilled, for example, through consumption [39]. These positive consequences, which are the exception rather than the rule in social comparisons [30], reportedly may improve subjective well-being [42,43].
Whether someone experiences malicious or benign envy depends on perceived deservingness and controllability [40]. If the other’s superiority is perceived as undeserved, the probability of experiencing malicious envy is higher. In contrast, benign envy is experienced when the other’s superiority is perceived as deserved and the desire to level up can be controlled, i.e., the resources for improving one’s situation are available. This investigation focuses on influencers who are admired by their audience. Followers want to assimilate to the influencer and act similarly. Otherwise, they would, on the one hand, have no such audience and, on the other hand, not be considered by advertisers. Therefore, in this particular study context, benign envy is the relevant outcome of the underlying social comparison processes that needs to be examined. In that regard, benign envy serves as an explanatory mechanism. Travel-related content posted by influencers on Instagram inspires followers to self-improve and helps achieve a similar lifestyle, reinforcing the followers’ wanderlust [38]. Therefore, based on the principles of SCT, it is assumed that benign envy acts as a mediator in a way that:
Hypothesis H2:
Benign envy positively mediates the relationship between the exposure to travel-related content posted by influencers on Instagram and the intention to visit a tourist destination.

2.3. The Moderating Role of Online Social Identity

Making comparisons is highly dependent on the social context, i.e., the sense of belonging to a particular group. One concept that describes social affiliation on the Internet is online social identity, which adapts the SIT [26,44] to the context of online communities. It can be defined as the part of one’s identity that “(…) is derived from knowledge of his or her membership in an online social group (or groups) together with the value and emotional significance attached to that membership” [45] (p. 1763). In this study, online social identity refers to the Instagram membership with which one can identify, similar to belonging to a group of supporters of a sports club. Being an Instagram member reflects a particular lifestyle and norms, such as the constant search for the next photo motif, extraordinary poses, filters, and the permanent drive for self-affirmation. Pegg et al. [46] showed that exposure to alcohol-related content positively influences alcohol consumption among adolescents, but only for those with a high online social identity. Latif et al. [20] found that online social identity moderates the positive relationship between the exposure to travel-related content posted by family and friends on Facebook and the intention to visit a tourist destination. The relationship was stronger when someone’s online social identity was higher. In this study, online social identity reflects the sense of belonging to Instagram. The more one feels connected to the social media platform and the more important and highly valued the membership, the greater the online social identity. Based on SIT and the results of the available research, it is therefore postulated:
Hypothesis H3:
The user’s online social identity moderates the positive relationship between the exposure to travel-related content posted by influencers on Instagram and the intention to visit a tourist destination. It is stronger with a higher online social identity.

2.4. The Moderating Mediation Role of Pro-Environmental Attitude

The question of why people travel has received constant interest within tourism research. In general, motivational processes are grounded in both internal motives (e.g., values and emotions) and external motives (e.g., recognition and rewards). In one of the first studies in the travel context, Dann [47] identified anomie and ego-enhancement as two basic motivational factors. The former suggests that living in an anomic society fosters a desire for social interaction. This need must be satisfied while traveling since it is practically nonexistent at home due to normlessness and the lack of belonging. Crompton [48] conducted 39 qualitative interviews to identify seven psychological needs (escape from a perceived mundane environment, exploration and evaluation of self, relaxation, prestige, regression, enhancement of kinship relationships, facilitation of social interaction) and two cultural needs (novelty, education) that motivate travel. In a similar attempt, Iso-Ahola [49] highlighted the relevance of two fundamental motivational forces that are desired psychological outcomes: (1) escaping and (2) seeking, with both having a personal and an interpersonal dimension. Later on, in an attempt to measure tourist motivation, Fodness [50] used factor analysis to present five factors that influence travel motivation, namely, (1) the search for knowledge in the world, (2) punishment minimization, (3) reward maximization, (4) self-esteem, and (5) ego-enhancement. While these motives have been successfully used to explain travel behavior for decades, it seems necessary to also consider envy triggered by shared travel experiences on the Internet in the age of social media. In that regard, Liu et al. [19] and Latif et al. [20] provided strong evidence that the intention to travel is motivated by benign envy.
We expand on this position by arguing that traveling must be perceived as a desirable outcome for the effect to unfold. While this used to be relatively uncontroversial, in recent years, a societal debate has been established about how travel can be justified in times of climate change. One manifest of this development is ‘flygskam’, the Swedish word for flight shame, coined by a Swedish musician in 2017 to describe the motivation to travel less by air due to its environmental impact [51]. According to the TPB, changes in attitudes may affect actual behavior [28]. Previous TPB-based research strongly suggests that people who are more concerned about the environment are more likely to engage in environmentally friendly activities [52,53,54]. Drawing on the TPB in combination with the SCT, this work, therefore, argues that someone’s pro-environmental attitude regulates the underlying social comparison and thereby reduces the influence of benign envy as a motivating factor for travel.
At the same time, pro-environmental attitude is not assumed to have a general influence on the intention to travel. As the preceding remarks show, travel motives vary widely and are—at best—only partially influenced by pro-environmental attitudes. For example, suppose someone has a strong inherent interest in expanding their knowledge of the world. In that case, it seems plausible that even a pro-environmental attitude will not prevent them from traveling. This is further supported by looking at the younger generations that protest climate change but continue to travel extensively despite their awareness of the environmental consequences. Carty [55] noted that the travel activities of generation Z could even surpass those of millennials. According to the WYSE Travel Confederation [56], young people have undertaken significantly more long-haul trips in recent years. They estimate that youth travel accounted for 23% of all international arrivals in 2017, equivalent to 304 million trips. The work of Alcock et al. [57] highlighted that pro-environmental attitudes translate into eco-friendly household routines but do not affect someone’s flying behavior. Furthermore, Hares et al. [58] showed that tourists disregard environmental protection when planning their holidays. In conclusion, this research expects the moderating mediation effect described below:
Hypothesis H4:
The strength of the mediation between the exposure to travel content posted by influencers on Instagram and the intention to visit a tourist destination through benign envy depends on someone’s pro-environmental attitude in a way that it is weaker if the pro-environmental attitude is higher.
Figure 1 summarizes the derived research model.

3. Methodology

Data must be collected to test the derived research model. This section provides an overview of the measurement scales used and the data collection process.

3.1. Measurement Scales

The scales for the exposure to travel-related content (EXP), benign envy (BE), the intention to visit a tourist destination (INT), online social identity (OSI), and pro-environmental attitude (PEA) were taken from other studies. If necessary, they adapted to the context of Instagram (see Table 1).
EXP, INT, BE, and OSI were measured using a seven-point Likert scale as in the respective original studies. While EXP refers to the number of travel-related pictures someone has been exposed to on Instagram (1 = “none” to 7 = “30 or more times”), INT, BE, and OSI refer to the agreement with the respective statements (1 = “strongly disagree” to 7 = “strongly agree”). The construct PEA also referred to the level of agreement, but following the original scale as a five-point measure (1 = “definitely disagree” to 5 = “definitely agree”). The seven- and five-point Likert scales for INT, BE, OSI, and PEA allowed the respondents to express neutral or indifferent views.
Since this research was conducted among German-speaking Instagram users, all items were translated into German. As part of this step, a forward-backward-forward technique ensured conceptual and literal consistency. The original items were first translated into German and checked for comprehensibility. The German items were then translated back into English using a professional translation service. If there were no deviations from the original item, the translation was retained. In case of discrepancies, the translation was put up for discussion again until a consensus was reached.
The presented measurement scales were queried in the first part of the questionnaire after an initial question about whether the respondents had an Instagram account. The second part referred to descriptive data such as demographic information (age, gender) or the average daily time spent on Instagram. Before the actual field phase, six Instagram users pre-tested the survey. They pointed out some typos and unclear, overly convoluted wording, which was corrected afterward. Besides, the provided comments reinforced the decision to place the questions for the dependent variable INT between the questions for the mediating variable BE and moderating variable OSI. This way, the underlying research model should become less noticeable, thus achieving measurement separation to reduce the risk of common method bias, as suggested by Craighead et al. [61].
The following paragraph documents the development of the questionnaire, describes how the sample was obtained, and addresses the measures taken to ensure sufficient data quality.

3.2. Data Collection

To collect the data, this research used an online questionnaire. A major advantage of online surveys is that they can be accessed via mobile devices regardless of time and place. Therefore, they can reach many people in a short period and are very convenient for respondents [62]. Besides, since this research investigates the behavior of Instagram users, it appears only logical to survey on the Internet. Only participants who did not follow dedicated Instagram travel accounts were invited. This measure addressed the risk of endogeneity due to reverse causality as it can be argued that some users enjoy traveling and therefore follow influencers that constantly post such content. In such cases, it could be the case that travel intention is increasing the number of exposures, not vice versa.
The survey was in the field for two months, from mid-August to mid-October 2020 and then again from mid-January to mid-February 2021. The main reason for the two-part data collection phase is that more students from different university courses could participate during these periods. Students appear to be suitable participants because Instagram use is exceptionally high among college students and graduates [63]. In addition, the survey invitation was shared via Facebook and Instagram. Finally, the authors of this study used SurveyCircle. The basic principle of this platform is that you can acquire participants for your research by supporting other studies.
During the field phase, a total of 869 clicks on the survey link were recorded. Of these, 421 started the survey and 330 completed it. This corresponds to a completion rate of 78.4%. However, 44 indicated that they did not have an Instagram account and were excluded from further analysis.
Since the invitation to participate was not sent to a closed group but was openly advertised via Instagram, Facebook, and SurveyCircle, measures are required to identify careless responses and ensure a high quality of the collected data [64]. In particular, this applies to respondents recruited via SurveyCircle as they receive points for participation. Against this background, both response speed and behavior were analyzed. Unrealistically fast response times (e.g., answering the questionnaire in less than 180 s) and conspicuous response behavior (e.g., consistently selecting the same response option) led to the exclusion of 21 and 18 participants, respectively, resulting in a final sample of n = 247.

4. Data Analysis and Results

This section first describes the characteristics of the sample obtained. The second part justifies the selection of the data analysis method and provides insights into the assessment of the measurement model. After that, the findings are presented and discussed.

4.1. Sample Characteristics

The study participants were on average 24.2 years old and thus represented the typical young audience on Instagram [63]. The young age is also reflected by the participant’s comparatively low monthly disposable income. Instagram’s global user statistics show that the gender mix on Instagram is almost even (51% female, 49% male), albeit with vast regional differences [65]. In India, for example, the second-largest market with over 120 million users, 72.5% identify as male and only 27.5% as female [65].
In Germany, Instagram reported that 52% of its advertisement audience is female. However, advertisement data must be treated with caution, as such audience figures may not represent unique individuals or match the active user base, making assumptions about the underlying population challenging [66]. Despite these difficulties, men are most certainly underrepresented in the sample. Table 2 summarizes the demographic sample characteristics.
Furthermore, participants were asked about user behavior on Instagram (see Table 3). The data show that the participants are active users of Instagram. On average, the participants have 497 followers and follow 290 other accounts themselves. It should be noted that the mean values are distorted by three participants who act as influencers themselves, each with over 9000 followers. The median is 250 accounts each. Most of the sample spends up to 2 h per day on the platform.

4.2. Assessment of the Measurement Model

This study uses partial least squares structural equation modeling (PLS-SEM) for data analysis. Compared to covariance-based SEM, PLS-SEM offers numerous advantages. Most importantly, PLS-SEM is not subject to any strict distribution assumptions [67], achieves high levels of statistical power even with smaller sample sizes, and provides significantly better convergence behavior. Besides, the PLS method is more robust against improperly operationalized constructs [68]. Finally, it is considered particularly useful for exploratory research that provides extensions to existing work because it examines the hypothesized direct effects and the model’s indirect effects [69].
The PLS-SEM consists of two submodels: (1) the measurement model and (2) the structural model. The method applies an iterative algorithm in which the SEM is solved by estimating the latent variables using the measurement model and the structural model in alternating steps. This process is repeated until convergence is achieved and the maximum amount of variance is explained.
To ensure the quality of the SEM, we tested for (1) common method bias, (2) construct reliability, and (3) construct validity. Common method bias refers to systematic measurement errors that create a covariation between variables due to the same measurement method and sources. It can inflate or deflate the observed relationships between constructs, thus generating type I and type II errors [70]. This is of particular concern if dependent and independent variables are collected from the same source, which is the case in this study. To make such bias less likely, a Harman one-factor test was performed. It showed that the total variance extracted by one factor is 36.755%, which is below the threshold of 50%, indicating that there is no common method bias in the data [71]. The inner variance inflation factor (VIF) values at the factor level were examined to validate this result. If all VIFs are equal to or lower than 3.3, it can be assumed that a common method bias should be no concern [72], which is the case in this research (see Table 4). The low levels are also a strong indicator that multicollinearity is not present [67].
Construct reliability refers to the accuracy of measurements. For that purpose, we examined Cronbach’s alpha (CA) and Rho_A, which should both exceed the threshold of 0.7 [73]. Because CA tends to underestimate reliability in PLS-SEM, Hair et al. [67] recommended additionally considering composite reliability (CR), which should be greater than 0.7. Table 5 shows that CA, Rho_A, and CR indicate sufficient construct reliability.
Construct validity can be defined as the extent to which the conceptualized latent variable measures what it claims to measure. Construct validity comprises (1) convergent validity and (2) discriminant validity. Convergent validity refers to the extent to which measures that are supposed to be related are indeed related. As a first step, this study conducted a confirmatory factor analysis. Table 6 shows that all standardized factor loadings except PEA4, OSI2*EXP, and PEA5*EXP are greater than 0.6. This can be considered the first indicator for convergent validity [67].
In addition, the average variance explained (AVE) of each construct is greater than 0.5 (see Table 5), which implies that no other factor explains a higher proportion of the variance of the underlying items than the one used in the model. This result provides a further indicator that convergent validity is met.
By contrast, discriminant validity tests whether measures that are supposed to be unrelated are actually unrelated. To test for discriminant validity, the Fornell–Larcker criterion is commonly used. Accordingly, discriminant validity can be assumed if a construct’s AVE is greater than the squared correlation with other constructs [74]. This is the case in this study; however, the criterion has proven less reliable in variance-based SEM [75]. For this reason, it is recommended to additionally refer to the heterotrait-monotrait criterion (HTMT) [76].
Henseler et al. [75] assume discriminant validity if the maximum HTMT ratio is less than 0.9. In this study, the maximum HTMT value is 0.772 (see Table 7). Consequently, the requirements for discriminant validity are met. Overall, the quality of the measurement model can be considered satisfactory.

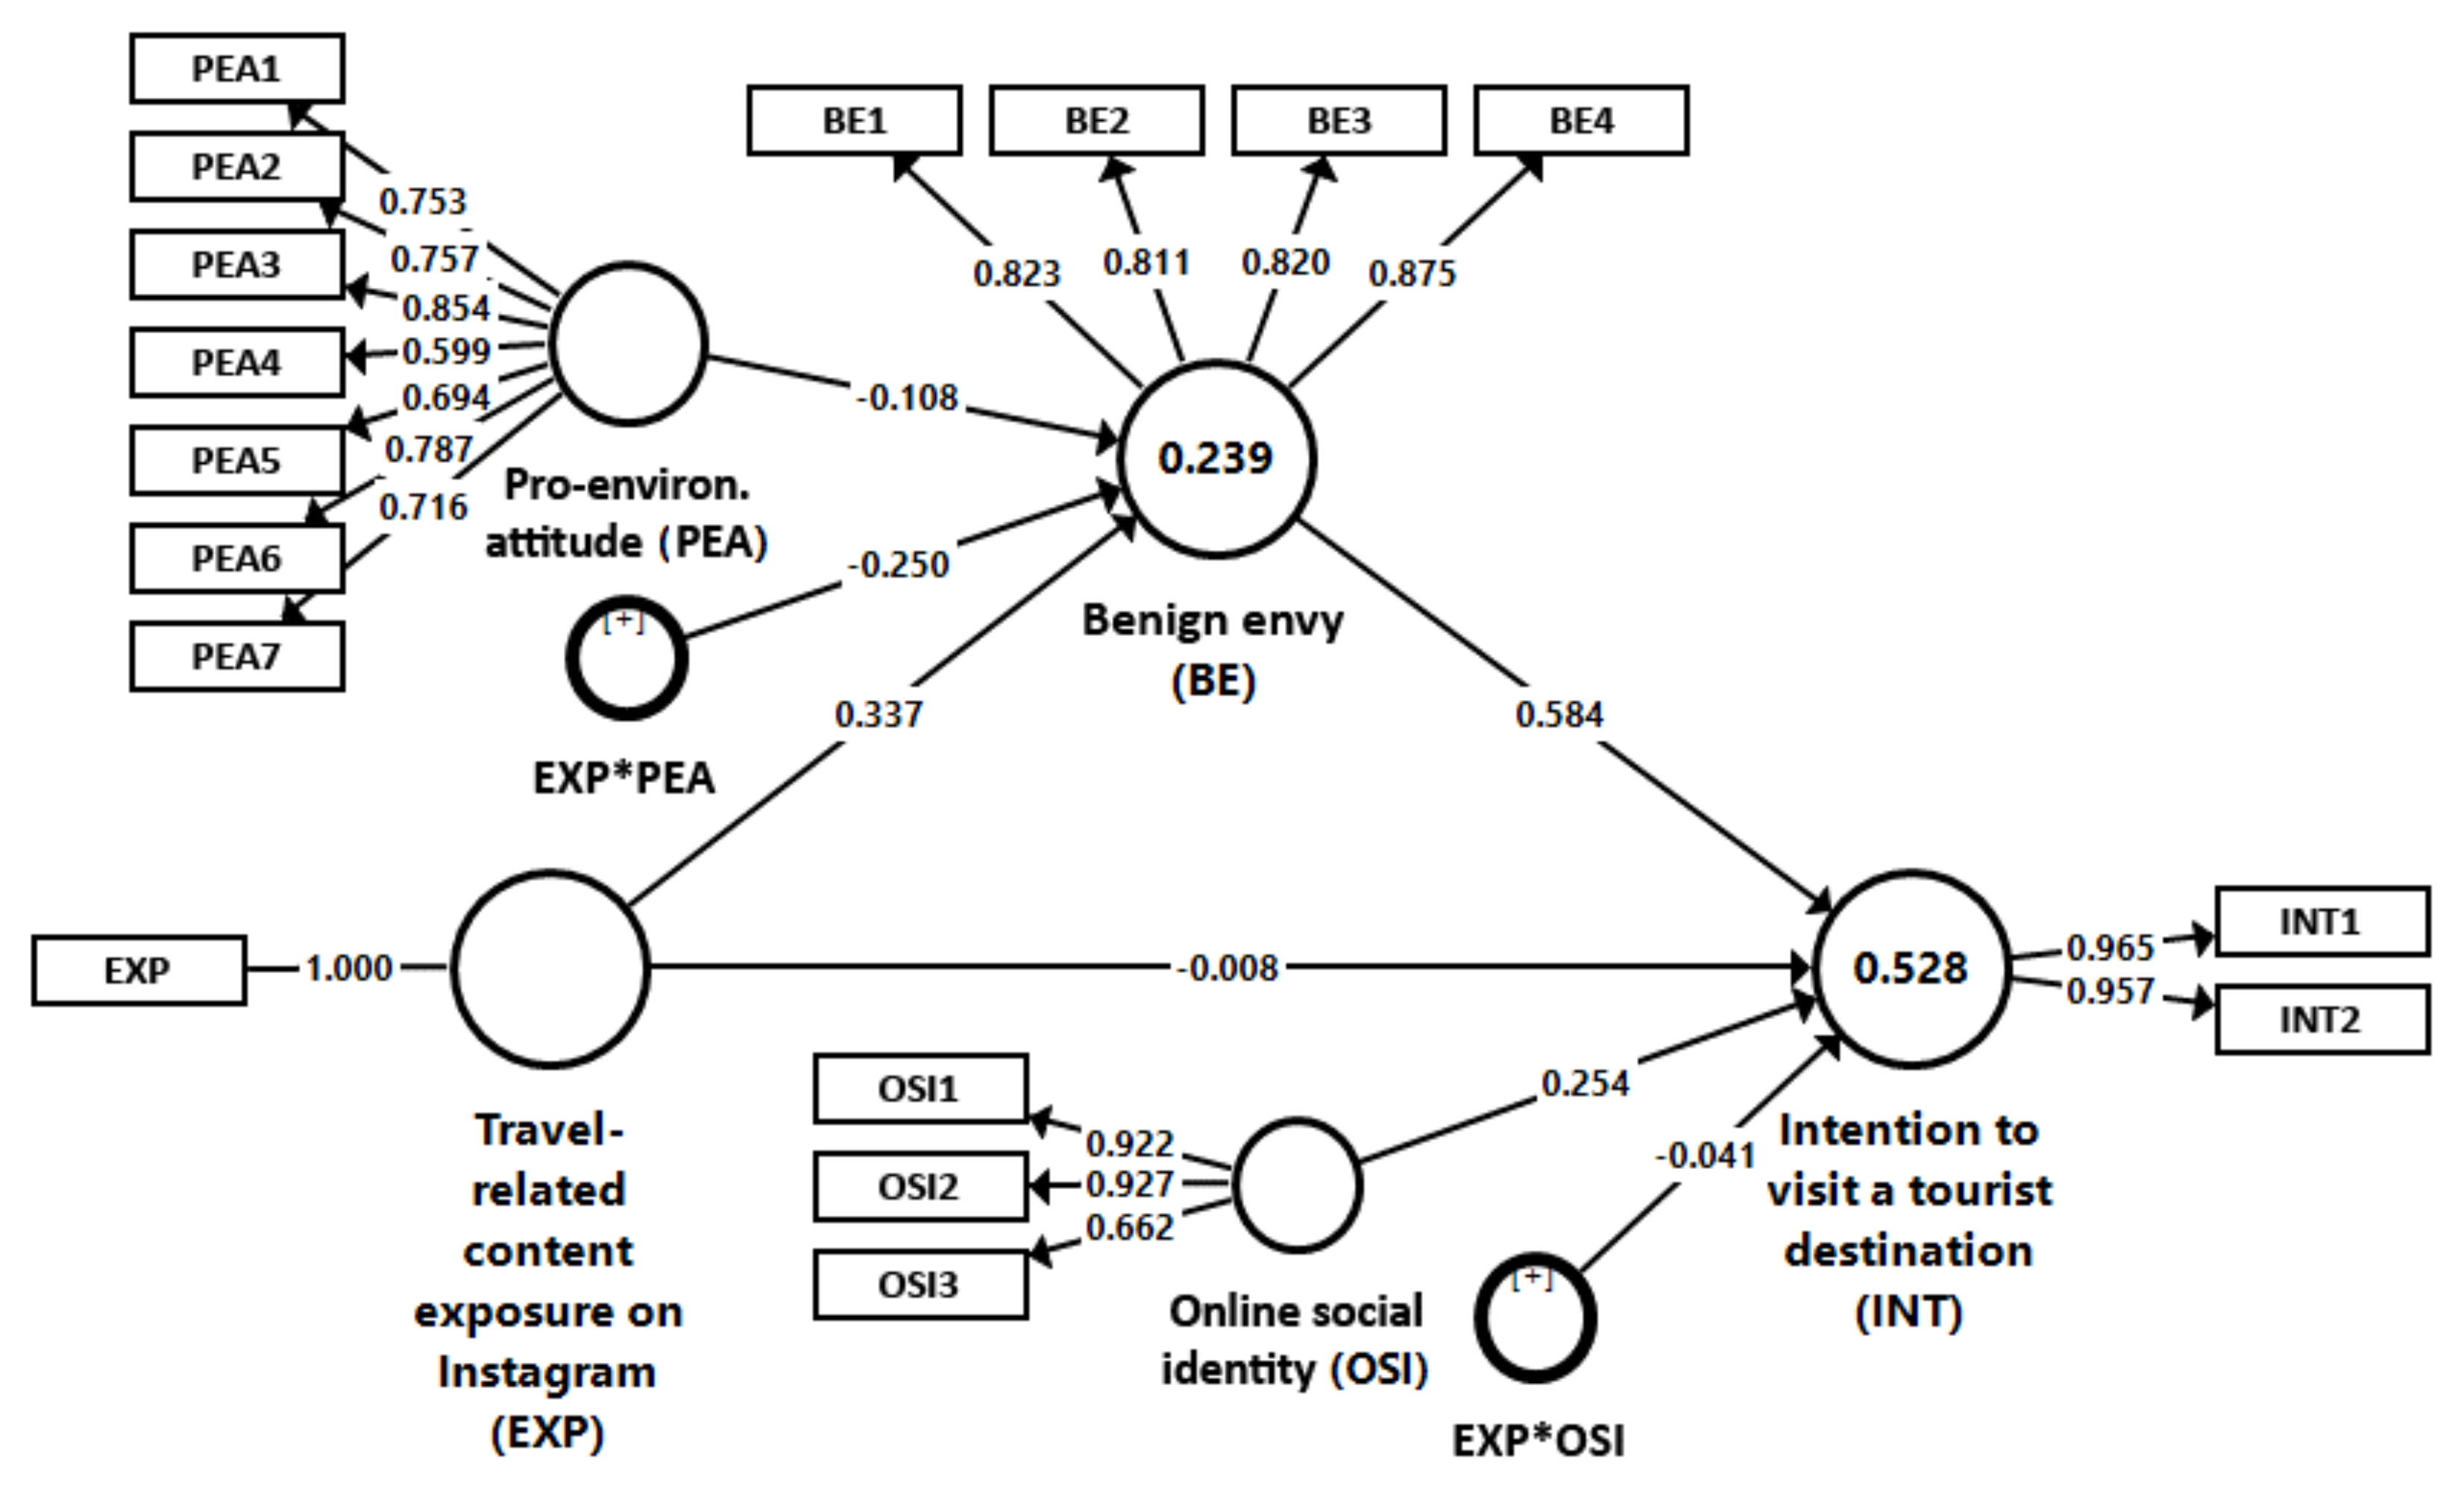
4.3. Testing the Structural Equation Model

After ensuring construct reliability and validity, the model’s significance, relevance, and hypothesized relationships are analyzed. Before carrying out statistical tests, the level of significance must be specified. The most popular conventional cutoff is α = 0.05, which this study also applies. As recommended, we used bootstrapping with 5000 resamples to test the derived hypotheses [67,77]. Figure 2 shows the structural model.
The corresponding Table 8 contains the test statistics for the individual relationships. It shows that the direct effect of EXP on INT is insignificant in the model (β = −0.008, t = 0.167, p = 0.867). Nevertheless, the indirect effect between the two variables is significant (β = 0.197, t = 4.958, p = 0.000). It becomes evident that exposure to travel-related content on Instagram increases the followers’ wanderlust. However, this relationship is fully mediated by benign envy. Consequently, H1 and H2 are supported.
Furthermore, the moderating roles of online social identity and pro-environmental attitude were investigated. In SEM, a moderation analysis can be performed either by group comparisons or the product term method. The product term approach is recommended when the surveyed variables are continuous, which can be assumed for the Likert scales used in this research [78]. The product term can be created in multiple ways. This work uses the product indicator approach, which multiplies each indicator of the exogenous variable by each indicator of the moderator variable. It is considered appropriate for reflective models, as in this study [79]. Besides, it is also the standard procedure for forming the interaction term in regression-based analyses (see also [19,20]) and therefore provides a higher degree of comparability.
The test statistics show that the interaction term EXP*OSI is not significant (β = −0.041, t = 0.635, p = 0.525). Only the direct influence of OSI on INT is significant (β = 0.254, t = 4.821, p < 0.000), which was not expected. Consequently, the postulated moderation effect is not present. H3 must be rejected. In contrast, the interaction term EXP*PEA is significant (β = −0.250, t = 4.802, p = 0.000). That is, an Instagram user’s pro-environmental attitude moderates the strength of the observed mediation between content exposure and travel intention through benign envy. The mediation effect is lower the higher someone’s pro-environmental attitude is. The direct effect between PEA and BE (β = −0.108, t = 1.852, p = 0.064) is not significant, as is the indirect effect between PEA and INT (β = −0.063, t = 1.835, p = 0.067). The structural model was adapted to explore the possibility that PEA moderates the relationship between EXP and INT, contrary to the derived hypotheses. The complementing analysis showed that the direct relationship between PEA and INT (β = −0.009, t = 0.178, p = 0.858) and the moderating effect were insignificant in the adapted model (β = −0.022, t = 0.446, p = 0.656). To conclude, these findings confirm H4.
A suitable criterion for assessing the quality of the structural model is the coefficient of determination (R2). Following a rule of thumb, R2 values of 0.25, 0.5, and 0.75 are considered weak, moderate, and substantial [79]. The R2 value for BE implies a weak level of predictive power. Accordingly, the exogenous variables EXP and PEA explain 23.9% of the variance in BE. Furthermore, EXP, BE, and OSI explain 52.2% of the variance in INT, which is a moderate amount and implies a satisfactory model quality. While R2 is the most commonly used measure of model quality, it should not be the only one in PLS-SEM [80]. Another important indicator is Stone–Geisser’s Q2, which determines how well the path model can predict the original values. Q2 values larger than zero for an endogenous latent variable indicate relevance for the respective dependent construct. To determine Q2, a blindfolding process is used for a specified omission distance D, recommended to be between 5 and 10 [67]. We set D = 7 and obtained a Q2 = 0.160 for BE and a Q2 = 0.477 for INT, thus indicating an out-of-sample predictive power.
Finally, to examine the relevance of the significant effects, the effect size f2 is used [69]. For direct effects, values of 0.02, 0.15, and 0.35 are considered weak, medium and strong effects [81]. In this study, the effect of EXP on BE is between weak and medium (f2 = 0.145), the effect of OSI on INT is weak (f2 = 0.108), and the effect of BE on INT is strong (f2 = 0.506). Consequently, the reported mediation effect through benign envy is significant and of substantial relevance for the model. Since the average effect size of moderation is significantly smaller than direct effects, Hair et al. [79] suggested the lower, more realistic thresholds of 0.005, 0.01, and 0.025, which constitute small, medium, and strong moderation effect sizes. Thus, the effect of the moderator EXP*PEA can be characterized as strong (f2 = 0.069).

4.4. Discussion

The results of the data analysis show that on Instagram, exposition to travel-related content increases benign envy, which in turn strengthens someone’s intention to travel. The effect appears to be even stronger than in Liu et al. [19] and Latif et al. [20], as they only demonstrated partial mediation, whereas this study reports full mediation. From an SCT perspective, viewers of such Instagram content are encouraged to travel to maintain or improve their self-evaluation. In other words, Instagram posts that show tourist destinations, such as deserted beaches, stunning panoramas, or must-see sights, trigger upward comparisons in viewers, which, in turn, lead to behavioral intentions. Previous research argued that exposure to travel-related content contributes to malicious envy [59], which may fuel harmful, destructive emotions [82] that eventually contribute to social media discontinuance [83]. However, in line with Liu et al. [19] and Latif et al. [20], the present study shows that these concerns are unfounded for travel-related content posted by influencers on Instagram. Since benign envy generates positive emotions, the opposite seems true, provided the influencer’s travel activity is perceived as deserved and one feels able to travel as well [40].
One key finding of Latif et al. [20] was the moderating role of online social identity. In their study, online social identity increased the impact of exposure to travel-related content on the intention to visit a tourist destination. According to the authors, this highlighted the “(…) pivotal role (…)” (p. 1) of online social identity in the social comparison process. The findings of our study question such a role, at least in part, because the moderating effect is not significant, contrary to the derived hypothesis. Accordingly, Instagram users with strong online social identities, i.e., they had a compelling sense of belonging to the platform, were not particularly inclined to travel after exposure to travel-related content. One plausible reason is platform-specific differences that limit the ability to develop online social identity and thus affect the role in the social comparison process. Facebook, which was the context of the Latif et al. [20] study, is a virtual representation of someone’s circle of acquaintances in the real world that offers in-depth bios with detailed personal information, allows various media, and enables exchange among friends and in groups. In contrast, Instagram is less about actively socializing on a personal level and more about passively consuming moments in someone’s life. Only photos and short videos are used. The platform is much more anonymous than others since detailed personal profiles are not provided, the use of clear names is rare, and the ways to interact with others are mostly limited to reactions to new content in the form of likes and comments. Thematic groups, which promote exchange on specific fields of interest, do not exist.
Given that only the moderation effect is insignificant while the direct positive influence on the intention to visit a tourist destination is significant, we suggest an alternative interpretation of the role of online social identity. According to the underlying social identity theory, social identification requires categorization [44]. This psychological mechanism is based on perceived commonalities [26]. The less commonality is perceived in someone’s vita and personal relationships, the more influential the published content becomes. Thus, content exposure and the perception of content would promote social categorization that allows and strengthens social identification. Such a perspective suggests a mediating effect for online social identity instead of a moderating role. Therefore, the research model has been adjusted accordingly. It showed that the path coefficients between EXP and OSI and between OSI and INT were significantly positive (p < 0.01 in each case), which further substantiates this argumentation and shows two things. First, the role of online social identity depends on the respective platform. After all, this supports the view that Instagram is indeed different from other social media [33]. Second, it also shows that content exposure increases the sense of belonging. This contributes to why social media users tend to use it more frequently over time and some even develop signs of addiction [84].
Finally, this study is the first to investigate the role of pro-environmental attitude in a social comparison context on social media. Previous research has shown that pro-environmental attitude positively affects household routines (e.g., switching off lights in rooms that are not used, buying recycled paper products). However, Alcock et al. [57] found that this does not extend to leisure travel. Accordingly, a pro-environmental attitude does not directly affect someone’s propensity to take flights or travel distances. This somewhat disillusioning result from an environmental point of view is also supported by this study since the direct effect of pro-environmental attitude on the intention to travel is not significant.
However, the study also shows that pro-environmental attitude moderates the mediation effect between content exposure and travel intention through benign envy. Referring to the TPB and the SCT, this implies that in traveling pro-environmental attitude regulates the underlying social comparison process and thereby reduces the influence of benign envy as a motivating factor for travel in a social media context. This may be interpreted as a way to limit someone’s perceived self-discrepancies that usually foster upward social comparisons [85]. In other words, pro-environmental attitude acts as a reaction inhibitor, which may indirectly reduce the intention to travel and thus limits the indirect environmental effects of social media platforms and their usage. Therefore, while a pro-environmental attitude directly prevents environmentally harmful behavior in other areas of life, at least an indirect effect limits the desire to travel after exposure to travel-related content. This may also add a novel perspective to the TPB, which posits that attitudes alongside subjective norms and perceived behavioral control directly influence behavioral intention [28]. However, there may also be an indirect effect in a social comparison context, i.e., pro-environmental attitude takes on a moderating role.

5. Conclusions, Limitations and Outlook

Motivated by climate change and the urgent question of how to reduce global CO2e-emissions, this study examines the role of social media influencers that post travel-related content. On the one hand, influencers cause direct emissions with their travels. On the other hand, there can be indirect effects because influencer content on social media platforms may trigger their followers’ wanderlust. This study turns to the indirect effects and contributes to the literature by investigating if and how exposure to travel-related content on Instagram is linked to travel intentions. The presented results lead to several theoretical implications at the intersection of sustainability, social media, influencer marketing, and tourism research.
Previous studies showed that user-generated content on social media affects booking decisions [18]. There was also evidence that electronic word-of-mouth and travel-related content posted by Facebook friends influences someone’s travel intention [19,20]. The study at hand confirms this finding for professional influencers on Instagram. Moreover, this study contributes to the question of why the relationship between content exposure and the intention to travel exists. Previous research assumed that the effect is due to malicious envy triggered by upward social comparison [82]. This kind of envy has the potential to disturb someone’s well-being and can lead to depression in the long run [86,87]. A counter position is provided by the works of Liu et al. [19] and Latif et al. [20], who instead suggest the positively connoted benign envy as the underlying cause. The results of this study strengthen such a position.
Furthermore, the effect appears to be very robust, since it (1) not only exists among personal friends [19,20] but also with influencers, (2) is not only apparent on Facebook [20] but also on Instagram, (3) not only affects Millennials [19] but also the surveyed Generation Y, and (4) is not only present in the United States [19] or Pakistan [20] but also in Germany. Therefore, it can generally be assumed that such content has the potential to inspire people rather than be a burden. However, the good news for the social media platforms comes at a cost to the environment. The underlying SCT is mainly used to explain the effect of social comparisons on someone’s subjective well-being. Yet, this study shows that the effects go far beyond the individual level and extend to actual behavior. This is especially relevant for social networks since they provide a fertile ground for an inspiration spiral. Imagine that a popular influencer posts a stunning holiday picture. As a reaction to experiencing benign envy, some followers may be inclined to travel themselves and post a picture on Instagram to better cope with their feeling of inferiority. This newly created content may, in turn, develop feelings of envy in others, which multiplies the original effect [30,82].
In addition, two implications arise regarding the antecedents under which the general effect is present. First, the results should stimulate discussions on the role of online social identity in the social comparison process. The study results indicate that online social identity may not be a moderator variable as previously assumed [20] but a mediator. Accordingly, online social identity does not change the strength of the effect between content exposure and travel intention. Instead, the content someone is exposed to fosters a sense of belonging and identification with the platform, increasing the intention to imitate the behavior displayed. Those unexpected, counter-intuitive findings underscore the value of replication studies that are sometimes considered unworthy for publication due to the lack of novelty. However, the opposite is the case. A critical perspective on existing findings is imperative to ensure continuous progress [88]. Therefore, replication studies are essential to increase credibility, limit the growing theory-practice gap, stimulate the academic discussion, and reduce uncertainty in the empirical knowledge base [21]. Against this background, the findings obtained call for further research to clarify the role that social identity has in social media. Second, the study filled an existing research gap by integrating and addressing pro-environmental attitudes. The presented results indicate that individuals with a higher pro-environmental attitude develop less travel intention in response to travel-related content because it limits the development of benign envy because of social comparisons. Thus, it appears that in social media, pro-environmental attitudes can limit perceived self-discrepancies [85] when the content exhibits environmentally questionable behavior such as travel.
Managerially, this study has implications for social media platforms and online travel advertisers. Concerning social media platforms, their business model is to create a virtual place of exchange that is mainly monetized via advertising revenues [89]. With this in mind, platforms are looking at ways to increase the time users spend on the platform, which includes considering what content to show. This study demonstrates that travel-related content generates benign envy, which is not associated with negative feelings. Consequently, there is no reason to make such content less visible or accessible. On the contrary, it provides an almost ideal advertising environment for travel services. In that regard, benign envy serves the internal desire to level up and thus creates the grounds for a subsequent consumption decision. Besides, online travel advertisers are interested in understanding the factors influencing the intention to travel. Since travel-related content fosters benign envy, a successful strategy in the social media environment may be to invite influencers on complimentary trips and, in return, require them to post pictures of it.
Societally, this research shows that influencers bear a responsibility beyond the emissions they cause themselves, which are already well above average [15]. As described in the introduction, climate change is the greatest challenge known to humankind to date. Because nature and the laws of physics know no compromise, everyone’s behavior needs to change. Therefore, influencers must ask themselves whether they want to be part of the problem or the solution. While one may view travel as a necessary evil to create fascinating content and succeed in the profession, influencers still have a choice. They can either refrain from flaunting their travels or even motivate others to do the same by conveying their awareness. Moreover, even if they cannot or will not stop creating such content, this work shows that there are indeed possibilities to limit the negative effects. If influencers are interested in doing so, they should pursue strategies that strengthen the pro-environmental attitude of their followers. This may include posts that motivate others to engage in environmentally friendly behaviors and a transparent approach to the climate impact of the trips taken. To increase the awareness and live up to their responsibility, influencers should also consider offsetting reporting their emissions in their posts.
This argument extends to the platforms that provide the technology and economically benefit from the monetization of the created content. For instance, the platform referred to in this research, Instagram, reportedly generated USD 20 billion in ad revenue in 2019 [90]. Against this background, it is necessary that social media platforms finally embrace their responsibilities more broadly. In the past, they used to downplay their impact, i.e., regarding teenagers’ mental health, and even withheld clear internal reports from the public [33]. This study shows that Instagram content not only affects the well-being of adolescents but also extends to other areas, such as the desire to travel. Clearly, such platforms encourage questionable behaviors that impact the environment and society. Therefore, they should no longer look the other way when it comes to the ugly side of their business model. Instead, they must be held responsible for making more efforts to minimize the negative effects. For instance, they could display additional information to travel-related content that reinforces pro-environmental attitudes, similar to the provision of big tobacco to highlight the direct and indirect consequences of smoking on their packages.
One limitation of this study is that the research model only considered the exposure to travel-related content on Instagram, benign envy, online social identity, and pro-environmental attitude as explanatory constructs. There might be other relevant variables that were not investigated. Therefore, other researchers should be encouraged to conduct qualitative research, for instance, by using focus groups or a Delphi technique to gain a deeper, more detailed understanding of which other factors might impact the investigated relationships. In addition, this study only measured the intention to visit, which may not correspond to the actual behavior. For instance, the TPB suggests that behavior is influenced by intention and perceived behavioral control. Therefore, even if the intention is low, individuals may still perform the behavior. Future studies should therefore address such influences and investigate actual travel behavior. Another notable limitation is that only German Instagram users were surveyed. While the confirmation of some previously reported effects provides a strong indication that the generated sample is appropriate for this research, additional work is needed to further investigate the role of online social identity and pro-environmental attitude to increase the results’ generalizability. This may also include possible cross-cultural research and the consideration of multiple content-centric platforms such as TikTok or YouTube. Finally, it should be noted that not all traveling is equally bad. Over the past years, new forms of tourism such as nature-based ecotourism (e.g., local fishing, hiking) that have a notably lower ecological footprint became more popular [91]. The underlying problem and the need to mitigate someone’s wanderlust are less relevant for this type of travel. Nevertheless, nature-based travel is still a niche market and even in these forms, the general problem that traveling contributes to climate change remains.

Funding

This research received no external funding.

Institutional Review Board Statement

Not applicable.

Informed Consent Statement

Not applicable.

Data Availability Statement

Not applicable.

Acknowledgments

I would like to thank my students Jannik Stefan Nüßlein, Sven Raffin, and Florian Reithmeier who administered the data collection and contributed to the literature search.

Conflicts of Interest

The author declares no conflict of interest.

References

  1. Rogelj, J.; Forster, P.M.; Kriegler, E.; Smith, C.J.; Séférian, R. Estimating and tracking the remaining carbon budget for stringent climate targets. Nature 2019, 571, 335–342. [Google Scholar] [CrossRef] [Green Version]
  2. Crippa, M.; Guizzardi, D.; Muntean, M.; Schaaf, E.; Solazzo, E.; Monforti-Ferrario, F.; Olivier, J.; Vignati, E. Fossil CO2 Emissions of All World Countries-2020 Report; Publications Office of the European Union: Luxembourg, 2020; ISBN 978-92-76-21515-8. [Google Scholar]
  3. UNWTO/UNEP/WMO. Climate Change and Tourism: Responding to Global Challenges; World Tourism Organization, United Nations Environment Programme, World Meteorological Organization: Paris, France; Madrid, Spain, 2008; ISBN 978-92-844-1234-1. [Google Scholar]
  4. Lenzen, M.; Sun, Y.-Y.; Faturay, F.; Ting, Y.-P.; Geschke, A.; Malik, A. The carbon footprint of global tourism. Nat. Clim. Change 2018, 8, 522–528. [Google Scholar] [CrossRef]
  5. UNWTO/ITF. Transport-Related CO2 Emissions of the Tourism Sector—Modelling Results; World Tourism Organization: Madrid, Spain, 2019; ISBN 9789284416660. [Google Scholar]
  6. UNEP. Emissions Gap Report 2020; United Nations Environment Programme: Nairobi, Kenia, 2020; ISBN 978-92-807-3812-4. [Google Scholar]
  7. Gössling, S.; Humpe, A. The global scale, distribution and growth of aviation: Implications for climate change. Glob. Environ. Change Hum. Policy Dimens. 2020, 65, 102194. [Google Scholar] [CrossRef]
  8. Le Quéré, C.; Jackson, R.B.; Jones, M.W.; Smith, A.J.P.; Abernethy, S.; Andrew, R.M.; De-Gol, A.J.; Willis, D.R.; Shan, Y.; Canadell, J.G.; et al. Temporary reduction in daily global CO2 emissions during the COVID-19 forced confinement. Nat. Clim. Change 2020, 10, 647–653. [Google Scholar] [CrossRef]
  9. Jansom, A.; Pongsakornrungsilp, S. How Instagram Influencers Affect the Value Perception of Thai Millennial Followers and Purchasing Intention of Luxury Fashion for Sustainable Marketing. Sustainability 2021, 13, 8572. [Google Scholar] [CrossRef]
  10. Wu, L.; Li, J.; Qi, J.; Kong, D.; Li, X. The Role of Opinion Leaders in the Sustainable Development of Corporate-Led Consumer Advice Networks: Evidence from a Chinese Travel Content Community. Sustainability 2021, 13, 11128. [Google Scholar] [CrossRef]
  11. Berne-Manero, C.; Marzo-Navarro, M. Exploring How Influencer and Relationship Marketing Serve Corporate Sustainability. Sustainability 2020, 12, 4392. [Google Scholar] [CrossRef]
  12. Gretzel, U. Influencer Marketing in Travel and Tourism. In Advances in Social Media for Travel, Tourism and Hospitality: New Perspectives, Practice and Cases; Sigala, M., Gretzel, U., Eds.; Routledge Taylor & Francis Group: London, UK; New York, NY, USA, 2018; pp. 147–156. ISBN 978-1-472-46920-5. [Google Scholar]
  13. Lou, C.; Yuan, S. Influencer Marketing: How Message Value and Credibility Affect Consumer Trust of Branded Content on Social Media. J. Interact. Advert. 2019, 19, 58–73. [Google Scholar] [CrossRef]
  14. IMH. The State of Influencer Marketing 2021: Benchmark Report. Available online: https://influencermarketinghub.com/ebooks/influencer_marketing_benchmark_report_2021.pdf (accessed on 30 September 2021).
  15. Gössling, S. Celebrities, air travel, and social norms. Ann. Tour. Res. 2019, 79, 102775. [Google Scholar] [CrossRef]
  16. Shuqair, S.; Cragg, P. The immediate impact of Instagram posts on changing the viewers’ perceptions towards travel destinations. Asia Pac. J. Adv. Bus. Soc. Stud. 2017, 3, 1–12. [Google Scholar] [CrossRef] [Green Version]
  17. Kathuria, S.; Tandon, U.; Ertz, M.; Bansal, H. Social vacation: Proposition of a model to understand tourists’ usage of social media for travel planning. Technol. Soc. 2020, 63, 101438. [Google Scholar] [CrossRef]
  18. Kumar, S.; Gupta, A.; Gupta, S. Impact of social media on tourist decision making process. Int. J. Acad. Res. Dev. 2018, 4, 29–48. [Google Scholar]
  19. Liu, H.; Wu, L.; Li, X. Social media envy: How experience sharing on social networking sites drives millennials’ aspirational tourism consumption. J. Travel Res. 2019, 58, 355–369. [Google Scholar] [CrossRef]
  20. Latif, K.; Malik, M.Y.; Pitafi, A.H.; Kanwal, S.; Latif, Z. If you travel, I travel: Testing a model of when and how travel-related content exposure on Facebook triggers the intention to visit a tourist destination. Sage Open 2020, 10, 1–12. [Google Scholar] [CrossRef]
  21. Block, J.; Kuckertz, A. Seven principles of effective replication studies: Strengthening the evidence base of management research. Manag. Rev. Q 2018, 68, 355–359. [Google Scholar] [CrossRef] [Green Version]
  22. Festinger, L. A Theory of Social Comparison Processes. Hum. Relat. 1954, 7, 117–140. [Google Scholar] [CrossRef]
  23. Doran, R.; Larsen, S.; Wolff, K. Different but Similar: Social Comparison of Travel Motives Among Tourists. Int. J. Tour. Res. 2015, 17, 555–563. [Google Scholar] [CrossRef] [Green Version]
  24. Wills, T.A. Downward comparison principles in social psychology. Psychol. Bull. 1981, 90, 245–271. [Google Scholar] [CrossRef]
  25. Wood, J.V. Theory and Research Concerning Social Comparisons of Personal Attributes. Am. Psychol. Assoc. 1989, 106, 231–248. [Google Scholar] [CrossRef]
  26. Tajfel, H.; Turner, J.C. An integrative theory of intergroup conflict. In The Social Psychology of Intergroup Relations; Austin, W.G., Worchel, S., Eds.; Brooks/Cole: Monterey, CA, USA, 1979; pp. 33–47. ISBN 0818502789. [Google Scholar]
  27. Scheepers, D.; Ellemers, N. Social Identity Theory. In Social Psychology in Action; Sassenberg, K., Vliek, M.L., Eds.; Springer International Publishing: Cham, Germany, 2019; pp. 129–143. ISBN 978-3-030-13787-8. [Google Scholar]
  28. Ajzen, I. The theory of planned behavior. Organ. Behav. Hum. Decis. Processes 1991, 50, 179–211. [Google Scholar] [CrossRef]
  29. Vogel, E.A.; Rose, J.P.; Roberts, L.R.; Eckles, K. Social comparison, social media, and self-esteem. Psychol. Pop. Media Cult. 2014, 3, 206–222. [Google Scholar] [CrossRef]
  30. Verduyn, P.; Gugushvili, N.; Massar, K.; Täht, K.; Kross, E. Social comparison on social networking sites. Curr. Opin. Psychol. 2020, 36, 32–37. [Google Scholar] [CrossRef]
  31. Kerr, G.; Lewis, C.; Burgess, L. Bragging rights and destination marketing: A tourism bragging rights model. J. Hosp. Tour. Manag. 2012, 19, 7–14. [Google Scholar] [CrossRef] [Green Version]
  32. Renjith, S.; Sreekumar, A.; Jathavedan, M. An extensive study on the evolution of context-aware personalized travel recommender systems. Inf. Processing Manag. 2020, 57, 1–19. [Google Scholar] [CrossRef]
  33. McEvoy, J. Facebook Internal Research Found Instagram Can Be Very Harmful To Young Girls, Report Says. Available online: https://www.forbes.com/sites/jemimamcevoy/2021/09/14/facebook-internal-research-found-instagram-can-be-very-harmful-to-young-girls-report-says/ (accessed on 20 October 2021).
  34. Hu, Y.-T.; Liu, Q.-Q. Passive social network site use and adolescent materialism: Upward social comparison as a mediator. Soc. Behav. Pers. 2020, 48, 1–8. [Google Scholar] [CrossRef]
  35. Burnell, K.; George, M.J.; Vollet, J.W.; Ehrenreich, S.E.; Underwood, M.K. Passive social networking site use and well-being: The mediating roles of social comparison and the fear of missing out. Cyberpsychology 2019, 13. [Google Scholar] [CrossRef] [Green Version]
  36. Appel, M.; Marker, C.; Gnambs, T. Are Social Media Ruining Our Lives? A Review of Meta-Analytic Evidence. Rev. Gen. Psychol. 2020, 24, 60–74. [Google Scholar] [CrossRef]
  37. Yoon, S.; Kleinman, M.; Mertz, J.; Brannick, M. Is social network site usage related to depression? A meta-analysis of Facebook-depression relations. J. Affect. Disord. 2019, 248, 65–72. [Google Scholar] [CrossRef]
  38. Van de Ven, N.; Zeelenberg, M.; Pieters, R. Leveling up and down: The experiences of benign and malicious envy. Emotion 2009, 9, 419–429. [Google Scholar] [CrossRef] [Green Version]
  39. Belk, R. Benign envy. AMS Rev. 2011, 1, 117–134. [Google Scholar] [CrossRef]
  40. Van de Ven, N.; Zeelenberg, M.; Pieters, R. Appraisal patterns of envy and related emotions. Motiv. Emot. 2012, 36, 195–204. [Google Scholar] [CrossRef] [Green Version]
  41. Lockwood, P.; Kunda, Z. Superstars and me: Predicting the impact of role models on the self. J. Personal. Soc. Psychol. 1997, 73, 91–103. [Google Scholar] [CrossRef]
  42. Meier, A.; Schäfer, S. Positive Side of Social Comparison on Social Network Sites: How Envy Can Drive Inspiration on Instagram. Cyberpsychol. Behav. Soc. Netw. 2018, 21, 411–417. [Google Scholar] [CrossRef]
  43. Lim, M.; Yang, Y. Upward social comparison and Facebook users’ grandiosity. OIR 2019, 43, 635–652. [Google Scholar] [CrossRef]
  44. Turner, J.C.; Oakes, P.J. The significance of the social identity concept for social psychology with reference to individualism, interactionism and social influence. Br. J. Soc. Psychol. 1986, 25, 237–252. [Google Scholar] [CrossRef]
  45. Kim, H.-W.; Zheng, J.R.; Gupta, S. Examining knowledge contribution from the perspective of an online identity in blogging communities. Comput. Hum. Behav. 2011, 27, 1760–1770. [Google Scholar] [CrossRef]
  46. Pegg, K.J.; O’Donnell, A.W.; Lala, G.; Barber, B.L. The role of online social identity in the relationship between alcohol-related content on social networking sites and adolescent alcohol use. Cyberpsychol. Behav. Soc. Netw. 2018, 21, 50–55. [Google Scholar] [CrossRef] [PubMed]
  47. Dann, G.M. Anomie, ego-enhancement and tourism. Ann. Tour. Res. 1977, 4, 184–194. [Google Scholar] [CrossRef]
  48. Crompton, J.L. Motivations for pleasure vacation. Ann. Tour. Res. 1979, 6, 408–424. [Google Scholar] [CrossRef]
  49. Iso-Ahola, S.E. Toward a social psychological theory of tourism motivation: A rejoinder. Ann. Tour. Res. 1982, 9, 256–262. [Google Scholar] [CrossRef]
  50. Fodness, D. Measuring tourist motivation. Ann. Tour. Res. 1994, 21, 555–581. [Google Scholar] [CrossRef]
  51. Chiambaretto, P.; Mayenc, E.; Chappert, H.; Engsig, J.; Fernandez, A.-S.; Le Roy, F. Where does flygskam come from? The role of citizens’ lack of knowledge of the environmental impact of air transport in explaining the development of flight shame. J. Air Transp. Manag. 2021, 93, 102049. [Google Scholar] [CrossRef]
  52. Hinds, J.; Sparks, P. Engaging with the natural environment: The role of affective connection and identity. J. Environ. Psychol. 2008, 28, 109–120. [Google Scholar] [CrossRef]
  53. Bissing-Olson, M.J.; Iyer, A.; Fielding, K.S.; Zacher, H. Relationships between daily affect and pro-environmental behavior at work: The moderating role of pro-environmental attitude. J. Organiz. Behav. 2013, 34, 156–175. [Google Scholar] [CrossRef]
  54. Andersson, L.; Shivarajan, S.; Blau, G. Enacting Ecological Sustainability in the MNC: A Test of an Adapted Value-Belief-Norm Framework. J. Bus. Ethics 2005, 59, 295–305. [Google Scholar] [CrossRef]
  55. Carty, M. Gen Z Asserts Itself as Travel’s Next Big Opportunity. In Megatrends-Defining Travel in 2020; Rafat Ali, Ed.; Skift Research: New York, NY, USA, 2020; pp. 26–29. [Google Scholar]
  56. WYSE Travel Confederation. New Horizons IV: A Global Study of the Youth and Student Traveller; WYSE Travel Confederation: Amsterdam, The Netherlands, 2018. [Google Scholar]
  57. Alcock, I.; White, M.P.; Taylor, T.; Coldwell, D.F.; Gribble, M.O.; Evans, K.L.; Corner, A.; Vardoulakis, S.; Fleming, L.E. ‘Green’ on the ground but not in the air: Pro-environmental attitudes are related to household behaviours but not discretionary air travel. Glob. Environ. Change Hum. Policy Dimens. 2017, 42, 136–147. [Google Scholar] [CrossRef] [Green Version]
  58. Hares, A.; Dickinson, J.; Wilkes, K. Climate change and the air travel decisions of UK tourists. J. Transp. Geogr. 2010, 18, 466–473. [Google Scholar] [CrossRef]
  59. Craighead, C.W.; Ketchen, D.J.; Dunn, K.S.; Hult, G.T.M. Addressing Common Method Variance: Guidelines for Survey Research on Information Technology, Operations, and Supply Chain Management. IEEE Trans. Eng. Manag. 2011, 58, 578–588. [Google Scholar] [CrossRef]
  60. Hajli, N.; Wang, Y.; Tajvidi, M. Travel envy on social networking sites. Ann. Tour. Res. 2018, 73, 184–189. [Google Scholar] [CrossRef]
  61. Thornton, A.; Evans, L.; Bunt, K.; Simon, A.; King, S.; Webster, T. Climate Change and Transport Choices: Segmentation Model-A Framework for Reducing CO2 Emissions from Personal Travel; TNS-BMRB: London, UK, 2011. Available online: https://webarchive.nationalarchives.gov.uk/20181112102849/https://www.gov.uk/government/uploads/system/uploads/attachment_data/file/49971/climate-change-transport-choices-full.pdf (accessed on 29 September 2021).
  62. Wright, K.B. Researching Internet-Based Populations: Advantages and Disadvantages of Online Survey Research, Online Questionnaire Authoring Software Packages, and Web Survey Services. J. Comput. Mediat. Commun. 2005, 10, JCMC1034. [Google Scholar] [CrossRef]
  63. Perrin, A.; Anderson, M. Share of U.S. Adults Using Social Media, Including Facebook, Is Mostly Unchanged Since 2018. Available online: https://www.pewresearch.org/fact-tank/2019/04/10/share-of-u-s-adults-using-social-media-including-facebook-is-mostly-unchanged-since-2018/ (accessed on 20 July 2021).
  64. Meade, A.W.; Craig, S.B. Identifying careless responses in survey data. Psychol. Methods 2012, 17, 437–455. [Google Scholar] [CrossRef] [Green Version]
  65. Sehl, K. Instagram Demographics in 2021: Important User Stats for Marketers. Available online: https://blog.hootsuite.com/instagram-demographics/ (accessed on 20 October 2021).
  66. Kemp, S. Digital 2021: Germany. Available online: https://datareportal.com/reports/digital-2021-germany (accessed on 22 September 2021).
  67. Hair, J.F.; Ringle, C.M.; Sarstedt, M. PLS-SEM: Indeed a silver bullet. J. Mark. Theory Pract. 2011, 19, 139–152. [Google Scholar] [CrossRef]
  68. Reinartz, W.; Haenlein, M.; Henseler, J. An empirical comparison of the efficacy of covariance-based and variance-based SEM. Int. J. Res. Mark. 2009, 26, 332–344. [Google Scholar] [CrossRef] [Green Version]
  69. Ringle, C.M.; Sarstedt, M.; Straub, D.W. Editor’s Comments: A Critical Look at the Use of PLS-SEM in “MIS Quarterly”. MIS Q. 2012, 36, iii–xiv. [Google Scholar] [CrossRef] [Green Version]
  70. Chang, S.-J.; Van Witteloostuijn, A.; Eden, L. From the Editors: Common method variance in international business research. J. Int. Bus. Stud. 2010, 41, 178–184. [Google Scholar] [CrossRef]
  71. Podsakoff, P.M.; MacKenzie, S.B.; Lee, J.-Y.; Podsakoff, N.P. Common method biases in behavioral research: A critical review of the literature and recommended remedies. J. Appl. Psychol. 2003, 88, 879–903. [Google Scholar] [CrossRef]
  72. Kock, N. Common method bias in PLS-SEM: A full collinearity assessment approach. Int. J. e-Collab. 2015, 11, 1–10. [Google Scholar] [CrossRef] [Green Version]
  73. Hair, J.F.; Money, A.H.; Samouel, P.; Page, M. Research Methods for Business; John Wiley & Sons, Inc.: Chichester, UK, 2007; ISBN 9780470034040. [Google Scholar]
  74. Fornell, C.; Larcker, D.F. Evaluating structural equation models with unobservable variables and measurement error. J. Mark. Res. 1981, 18, 39–50. [Google Scholar] [CrossRef]
  75. Henseler, J.; Ringle, C.M.; Sarstedt, M. A new criterion for assessing discriminant validity in variance-based structural equation modeling. J. Acad. Mark. Sci. 2015, 43, 115–135. [Google Scholar] [CrossRef] [Green Version]
  76. Hair, J.; Hollingsworth, C.L.; Randolph, A.B.; Chong, A.Y.L. An updated and expanded assessment of PLS-SEM in information systems research. Ind. Mngmnt Data Syst. 2017, 117, 442–458. [Google Scholar] [CrossRef]
  77. Peng, D.X.; Lai, F. Using partial least squares in operations management research: A practical guideline and summary of past research. J. Oper. Manag. 2012, 30, 467–480. [Google Scholar] [CrossRef]
  78. Henseler, J.; Chin, W.W. A Comparison of Approaches for the Analysis of Interaction Effects Between Latent Variables Using Partial Least Squares Path Modeling. Struct. Equ. Modeling A Multidiscip. J. 2010, 17, 82–109. [Google Scholar] [CrossRef]
  79. Hair, J.F.; Hult, G.T.M.; Ringle, C.M.; Sarstedt, M. A Primer on Partial Least Squares Structural Equation Modeling (PLS-SEM), 2nd ed.; SAGE: Los Angeles, CA, USA; London, UK; New Delhi, India; Singapore; Washington, DC, USA; Melbourne, Australia, 2017; ISBN 148337744X. [Google Scholar]
  80. Hair, J.F.; Sarstedt, M.; Hopkins, L.; Kuppelwieser, V.G. Partial least squares structural equation modeling (PLS-SEM). Eur. Bus. Rev. 2014, 26, 106–121. [Google Scholar] [CrossRef]
  81. Cohen, J. Statistical Power Analysis for the Behavioral Sciences; Lawrence Erlbaum Associates: Mahwah, NJ, USA, 1988. [Google Scholar]
  82. Krasnova, H.; Widjaja, T.; Buxmann, P.; Wenninger, H.; Benbasat, I. Research note—Why following friends can hurt you: An exploratory investigation of the effects of envy on social networking sites among college-age users. Inf. Syst. Res. 2015, 26, 585–605. [Google Scholar] [CrossRef] [Green Version]
  83. Park, J.; Kim, B.; Park, S. Understanding the Behavioral Consequences of Upward Social Comparison on Social Networking Sites: The Mediating Role of Emotions. Sustainability 2021, 13, 5781. [Google Scholar] [CrossRef]
  84. Su, W.; Han, X.; Yu, H.; Wu, Y.; Potenza, M.N. Do men become addicted to internet gaming and women to social media? A meta-analysis examining gender-related differences in specific internet addiction. Comput. Hum. Behav. 2020, 113, 106480. [Google Scholar] [CrossRef]
  85. McIntyre, K.P.; Eisenstadt, D. Social Comparison as a Self-regulatory Measuring Stick. Self Identity 2011, 10, 137–151. [Google Scholar] [CrossRef]
  86. Li, Y. Upward social comparison and depression in social network settings. INTR 2019, 29, 46–59. [Google Scholar] [CrossRef]
  87. Wang, W.; Wang, M.; Hu, Q.; Wang, P.; Lei, L.; Jiang, S. Upward social comparison on mobile social media and depression: The mediating role of envy and the moderating role of marital quality. J. Affect. Disord. 2020, 270, 143–149. [Google Scholar] [CrossRef] [PubMed]
  88. Popper, K.; Notturno, M.A. The Myth of the Framework; Routledge: London, UK; New York, NY, USA, 2014; ISBN 978-11-3597-473-2. [Google Scholar]
  89. Brettel, M.; Reich, J.-C.; Gavilanes, J.M.; Flatten, T.C. What Drives Advertising Success on Facebook? An Advertising-Effectiveness Model. JAR 2015, 55, 162–175. [Google Scholar] [CrossRef]
  90. Price, R. Instagram Reportedly Generated $20 Billion in Ad Revenue in 2019—Even More Than YouTube. Available online: https://www.businessinsider.com/instagram-20-billion-ad-revenue-2019-report-2020-2 (accessed on 28 October 2021).
  91. Marzouki, M.; Froger, G.; Ballet, J. Ecotourism versus Mass Tourism. A Comparison of Environmental Impacts Based on Ecological Footprint Analysis. Sustainability 2012, 4, 123–140. [Google Scholar] [CrossRef] [Green Version]
Figure 1. Research model.
Sustainability 14 00855 g001
Figure 2. Results of the structural model analysis.
Sustainability 14 00855 g002
Table 1. Used measurement scales.
ConstructItem(s)Source(s)
Travel-related
content exposure (EXP)
(1)
In the last six months, how often have Instagram influencer accounts that you follow posted travel pictures?
[20,46]
Benign envy (BE)
(1)
When I see travel posts on Instagram, I am motivated to work hard to get similar travel opportunities in the future.
(2)
I compliment travel posts on Instagram (via like or comment).
(3)
I wish it were me taking these trips.
(4)
I want to follow travel posts on Instagram to experience these destinations one day.
[19]
Intention to visit a destination (INT)
(1)
If I get the chance to travel, I intend to visit the destinations mentioned and featured in travel photos on Instagram.
(2)
When I go on a trip, the probability that I visit the destinations shown in travel photos on Instagram is high.
[59]
Online social
identity (OSI)
(1)
Being a member of my online social group (on Instagram) is an important reflection of who I am.
(2)
In general, my Instagram membership is an important part of my self-image.
(3)
Generally, I feel good when I think about myself as a member of Instagram.
[46]
Pro-environmental
attitude (PEA)
(1)
There is too much concern with the environment.
(2)
It’s only worth doing environmentally-friendly things if they save you money.
(3)
I don’t have time to worry about my impact on the environment.
(4)
I find it hard to change my habits to be more environmentally friendly.
(5)
It takes too much time and effort to do environmentally friendly things.
(6)
Scientists will find a solution to global warming without people having to make big changes to their lifestyles.
(7)
The environment is a low priority compared with a lot of other things.
[57,60]
Table 2. Demographic sample characteristics.
Agen (%)Monthly
Income (Euro)
n (%)Gendern (%)
<1814 (5.7%)<800139 (56.3%)Male70 (28.3%)
18–2258 (23.5%)800–119944 (17.8%)Female177 (71.7%)
23–27140 (56.7%)1200–159921 (8.5%)Diverse0 (0%)
28–3226 (10.5%)1600–199913 (5.3%)
>329 (3.6%)>200030 (12.1%)
Table 3. Instagram usage within the sample.
Number of Followersn (%)Number of Accounts Followedn (%)Daily Time on Instagramn (%)
≤5014 (5.7%)≤50139 (56.3%)<2 h158 (64.0%)
51–15058 (23.5%)51–15044 (17.8%)2–4 h78 (31.6%)
151–250140 (56.7%)151–25021 (8.5%)4–6 h8 (3.2%)
251–35026 (10.5%)251–35013 (5.3%)>6 h3 (1.2%)
>3519 (3.6%)>35130 (12.1%)
Table 4. Variance inflation factors.
ConstructEXPBEOSIPEAINT
EXP1.0251.180
BE1.428
OSI1.267
OSI*EXP1.038
PEA1.251
PEA*EXP1.228
INT
Table 5. Measurement model analysis and inter-construct correlations (Note: Diagonal (bold) represents the square root of the AVE. Other entries represent the inter-construct correlations).
ConstructCARho_ACRAVEEXPBEOSIOSI*EXPPEAPEA*EXPINT
EXP1.0001.0001.0001.0001.000
BE0.8530.8600.9000.6940.3740.833
OSI0.8000.8800.8810.7160.1720.4510.846
OSI*EXP0.8081.0000.7980.575−0.0710.1120.1380.759
PEA0.8620.8840.8940.549−0.156−0.271−0.381−0.2550.741
PEA*EXP0.8641.0000.8950.552−0.078−0.327−0.322−0.3310.4310.743
INT0.9170.9260.9600.9240.2560.6910.5100.058−0.252−0.2730.961
Table 6. Cross loadings.
ConstructEXPBEOSIOSI*EXPPEAPEA*EXPINT
EXP11.0000.3740.172−0.071−0.156−0.0780.256
BE10.2900.8230.3810.081−0.243−0.2750.546
BE20.3240.8110.4020.029−0.246−0.2430.572
BE30.3200.8200.2700.087−0.182−0.2530.493
BE30.3130.8750.4330.165−0.229−0.3140.671
OSI10.1840.4360.9220.113−0.350−0.2920.514
OSI20.1350.4010.9270.108−0.360−0.2990.465
OSI30.1050.2880.6620.153−0.246−0.2240.268
OSI1*EXP1−0.0390.1240.0940.732−0.291−0.4040.033
OSI2*EXP1−0.1180.0530.0780.598−0.310−0.388−0.017
OSI3*EXP1−0.1050.0630.1290.913−0.212−0.2490.041
PEA1−0.040−0.162−0.280−0.2070.7530.261−0.174
PEA2−0.043−0.209−0.333−0.1610.7570.274−0.233
PEA3−0.150−0.207−0.336−0.2390.8540.339−0.211
PEA4−0.148−0.167−0.139−0.2440.5990.298−0.124
PEA5−0.109−0.156−0.327−0.2000.6940.319−0.179
PEA6−0.133−0.280−0.308−0.1590.7870.398−0.218
PEA7−0.188−0.174−0.232−0.1430.7160.314−0.140
PEA1*EXP1−0.053−0.177−0.217−0.2100.3380.733−0.213
PEA2*EXP1−0.089−0.281−0.234−0.2190.2630.777−0.197
PEA3*EXP1−0.050−0.269−0.197−0.2600.2920.758−0.227
PEA4*EXP1−0.061−0.303−0.315−0.2890.3670.879−0.244
PEA5*EXP1−0.006−0.157−0.227−0.1160.3220.580−0.136
PEA6*EXP1−0.078−0.283−0.249−0.3040.3450.735−0.212
PEA7*EXP1−0.037−0.138−0.242−0.3100.3840.706−0.160
INT10.2330.7000.5150.076−0.264−0.2840.965
INT20.2620.6230.4630.033−0.217−0.2370.957
Table 7. HTMT ratios.
ConstructEXPBEOSIOSI*EXPPEAPEA*EXPINT
EXP
BE0.405
OSI0.1870.532
OSI*EXP0.1140.1140.160
PEA0.1690.3040.4480.385
PEA*EXP0.0770.3580.3880.4840.509
INT0.2690.7720.5730.0620.2760.299
Table 8. Direct effects (path coefficients) of the structural model analysis.
PathStand. βStandard
Deviation
t-Valuep-Value
EXP → INT−0.0080.0500.1670.867
EXP → BE0.3370.0575.956<0.000 *
BE → INT0.5840.05211.205<0.000 *
OSI → INT0.2540.0534.821<0.000 *
EXP*OSI → INT−0.0410.0640.6350.525
PEA → BE−0.1080.0591.8520.064
EXP*PEA → BE−0.2500.0524.802<0.000 *
Legend: * significant at 0.05-level.
Publisher’s Note: MDPI stays neutral with regard to jurisdictional claims in published maps and institutional affiliations.

