Article

Nutrient Flows and Balances in Mixed Farming Systems in Madagascar

by
Marie Lucia Fanjaniaina
1,
Fabien Stark
2,
Noelly Phostin Ramarovahoaka
3,
Jeanny Fiononana Rakotoharinaivo
3,
Tovonarivo Rafolisy
3,
Paulo Salgado
2,4 and
Thierry Becquer
5,*
1
Fifamanor, BP 198, Antsirabe 110, Madagascar
2
SELMET, Institut Agro Montpellier, University Montpellier, INRAE, CIRAD, 34060 Montpellier, France
3
Laboratoire des Radio Isotopes, Department of Agronomy, University of Antananarivo, BP 3383, Route d’Andraisoro, Antananarivo 101, Madagascar
4
CIRAD, UMR SELMET, INRAE-SupAgro, BP 319, Antsirabe 110, Madagascar
5
Eco&Sols, Institut Agro Montpellier, University Montpellier, CIRAD, INRAE, IRD, 34060 Montpellier, France
*
Author to whom correspondence should be addressed.
Sustainability 2022, 14(2), 984; https://doi.org/10.3390/su14020984
Submission received: 21 December 2021 / Revised: 10 January 2022 / Accepted: 12 January 2022 / Published: 16 January 2022
(This article belongs to the Special Issue Sustainable Agricultural Intensification and Soil Fertility)

Abstract

:
Mixed farming systems are still prevalent in sub-Saharan Africa. In these systems, the recycling of nutrients through crop-livestock integration (CLI) practices is crucial for the sustainability of soil fertility and crop production. The objective of this study was to analyze nutrient (N, P, K) flows and balances of mixed farming systems to assess CLI contribution to the performance of those systems. We hypothesized that more intensive farms had a better nutrient balance at the farm level, and that improved biomass management methods improved their nutrient balance. Nine farms in the Madagascar highlands were selected, some corresponding to poor traditional farms with only draft cattle; some small or medium-sized, more intensive farms with a dairy herd; and some of the latter with some improvement to management methods of livestock effluents (manure composting, liquid manure collection). The nutrient balance of the farming systems was determined, and performance indicators were calculated at both farming, livestock, and CLI levels. Results showed that nutrient recycling through CLI is significant in the functioning of the systems studied, contributing primarily to circulating nutrient flows (up to 76%) and leading to greater efficiency and productivity. Nutrient flows resulting from these practices mainly concerned animal feeding (higher than 60% of nutrient flows), even if manure management was central for crop fertilization and that manure remained a desired animal product of these types of farms (up to 100% of animal products). Large negative balances of N and K (up to 80% of inputs) were observed in traditional livestock systems with draft cattle. They were smaller (39–68%) in more intensive dairy farms. Composting of manure did not decrease negative balances, whereas their magnitude was significantly reduced by the collection of liquid manure (19% for N; 42% for K). Better management of biomass at the farm level, in particular the collection of liquid manure, seemed to substantially reduce nutrient losses in MFS.

1. Introduction

In sub-Saharan Africa, crop-livestock mixed farming systems contribute to the livelihood of two-thirds of the population, producing almost half of the cereal and most of the meat and milk [1]. Animal husbandry is increasing due to the increasing demand for food products of animal origin in developing countries [2]. Agriculture and livestock are highly dependent on each other. The crop component of the system provides food for households or for sale, and feeds for the animals. In addition to the production of meat and milk for households or for sale, livestock provides draft power for crop management or transport, along with cash income and manure as a fertilizer to provide nutrients needed for crop production [3]. In this context, animals represent an essential lever for improving soil fertility through their ability to integrate, transform, enhance, and recycle nutrients [4]. In many African agricultural production systems, recycling crop residues and livestock effluents are the only accessible sources of nutrient return (nitrogen (N), phosphorus (P), etc.) to agricultural plots.
Crop-livestock mixed farming systems are, however, the subject of controversy or criticism. Livestock contributes to environmental pollution; the livestock sector is responsible for emitting 14.5% of all anthropogenic greenhouse gas (nitrous oxide, methane) [5]. Animal feed rations contain ingredients that can also serve as human food; livestock consumes one-third of global cereal production and uses about 40% of global arable land; among the 2 billion hectares of grassland, about 700 million hectares could be used as cropland [6]. Nevertheless, according to Lemaire et al. [2], domestic herbivores are not necessarily in competition with humans for food since they can utilize plant material unsuitable for the human diet. Moreover, they use grassland ecosystems located on soils/landscapes not suitable for efficient crop production. These contradictory points of view stress the need to improve the recycling of biomass produced for various purposes (food, feed, fuel) by crop-livestock mixed farming systems [7].
In Africa, traditional farming systems have led to severe soil nutrient depletion, low crop yields and poverty [8,9]. Cobo et al. [10], reporting 57 studies on nutrient balances in Africa, showed negative balances for N and K in most of the studies (i.e., 85 and 76% of studies, respectively). The export of nutrients in harvested products and crop residues accounted for approximately 50–70% of N, P, and K losses, while soil erosion accounted for about one-third of the losses [8]. Nutrient depletion occurs when nutrient exports are not balanced with suitable inputs from mineral and/or organic fertilizers, or by biological N fixation [8]. Leaving crop residues on the soil or returning livestock manure to the soil, has shown beneficial effects on soil quality and crop productivity [11]. However, they often cannot sustain crop production alone due to their limited availability and their poor quality [12], as well as to outputs through animal metabolism, growth, and animal products (meat, milk) and through losses during manuring (loss of faeces and urine, volatilization of N-compounds and leaching of nutrients).
In Madagascar’s densely populated central highlands (≈200 people km2), about 86% of workers are employed in the primary sector [13]. Staple crop production (rice, corn, cassava) dominates agriculture, but livestock production is almost systematically associated with mixed crop-livestock systems. Most of the farmers can be considered as poor or very poor, according to Franke et al. [14], i.e., with very small farms (<0.5 ha), small herds (≈1 zebu), and low sales of production surplus from the farm. A small number of farmers could be considered as well-off or rich, i.e., with more land (>1 ha), dairy production (2–5 cows), and sale of surplus from the farm. The latter generally buy more fertilizers for crops and feed complements for dairy production than the former. Our previous work in the Malagasy highlands has shown that nutrient losses from traditional manure management correspond to about three-quarters of the initial nutrients and that this type of manure cannot balance the exports induced by crop or fodder harvesting [15]. According to Cobo et al. [10], positive balances were generally associated with the land-use systems of wealthier farmers, whereas the land-use systems of poorer farmers usually had negative balances.
Organic matter and nutrient management in crop-livestock mixed farming systems is a key issue for more sustainable production systems [16]. The closing of nutrient cycles is indeed central to meeting the challenges of agroecology and thus improving the performance of livestock systems while reducing their negative impacts [17]. The objective of the study was to analyse the nutrient (N, P, K) flows and balances of crop-livestock farms of the Madagascar highlands and to assess their contributions to the overall performance of those systems [18]. Nine farms were studied that corresponded to different types of farms with different production systems (poor traditional farms with a cattle herd mainly composed of zebus; small or medium-sized, more intensive farms with a dairy herd) and different biomass management methods (traditional or improved management of livestock effluents). This study hypothesizes that (i) more intensive dairy farms, using feed complements, have a better nutrient balance at the farm level, and (ii) improved biomass management methods improve the balance at the cowshed level.

2. Materials and Methods

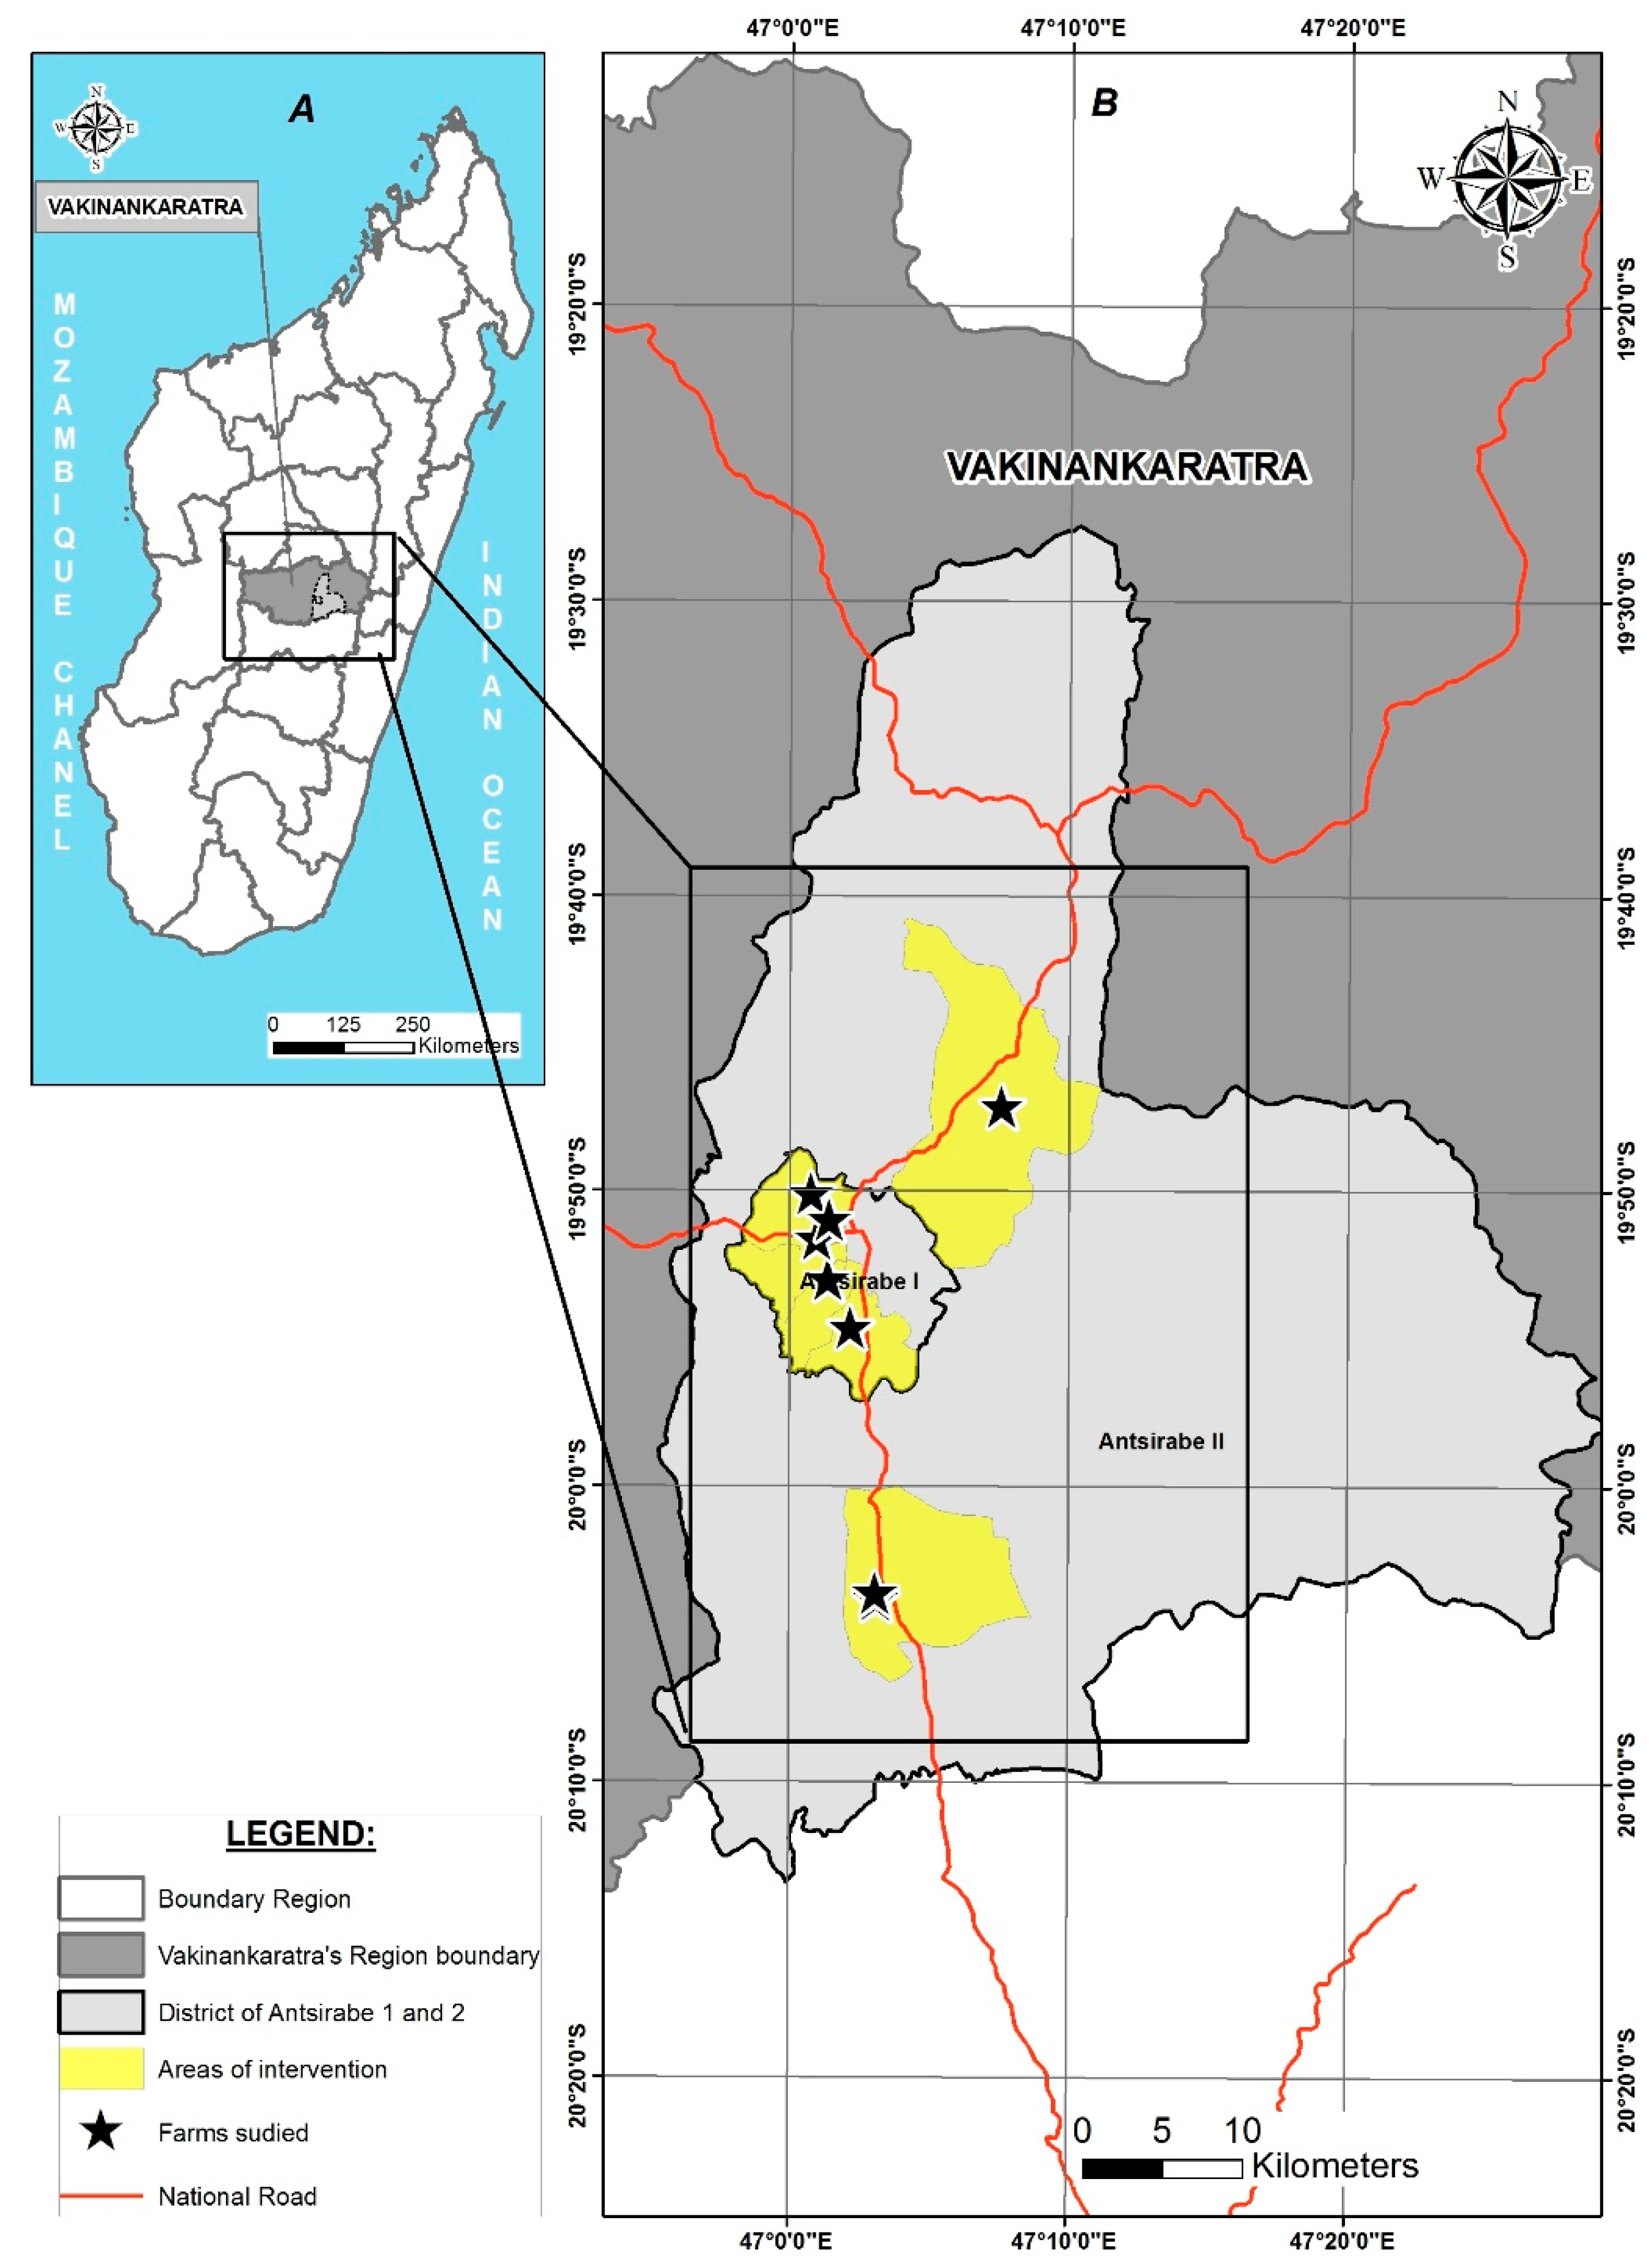
2.1. Study Site and Farming Systems

The study was carried out in the Vakinankaratra region, in the Central Highlands (1200–1550 m a.m.s.l.) of Madagascar (Figure 1). The tropical altitude climate of the area is characterized by a cool dry winter from May to October (mean rainfall 188 mm and mean temperature 15.0 °C) and a warm wet summer from November to April (mean rainfall 1300 mm and mean temperature 19.2 °C). The soils developed on the Precambrian crystalline basement are dominated by Ferralsols [19] on the hills. These soils are highly weathered and characterized by high acidity (pH in water usually below 5), a high content of aluminium (Al) in toxic forms, an organic matter content usually below 20 g kg−1, poor cation exchange capacity, high sorption capacity of phosphorus (P), and multi-nutrient deficiencies (P, Ca, N, Mg) [20]. The soils developed on the footslope and toeslope of the hills and in the valleys are mostly Fluvisols, Histosols, and Gleysols [19], periodically flooded with occasionally redoximorphic features. The conditions that develop on alluvial material enhance soil organic matter accumulation and smectite formation [21], leading to a higher cation exchange capacity. These soils, located in the lower areas of the landscapes, are also generally more humid than on the hills.
Agriculture is mainly practised on smallholder farms with a dominance of mixed crop-livestock farming systems. The hills are used for rainfed crops during the rainy season. The lowlands are mainly used for the production of irrigated rice in the rainy season and off-season production in the dry season. Rice (Oryza sativa), which is by far the most important staple crop of the Malagasy people, is the most important production. Other crops include cereals (maize (Zea mays)), tubers (manioc (Manihot esculenta), sweet potatoes (Ipomoea batatas), taro (Colocasia esculenta)), grain legumes (common bean (Phaseolus vulgaris), groundnuts (Arachis hypogea), green peas (Pisum sativum), and Bambara-beans (Vigna subterranea)), as well as various vegetables. These crops are produced both for family consumption and sale.
The Vakinankaratra region is located in the “dairy triangle”, which is the main Malagasy region for milk production [22]. Livestock production is dominated by small herds, with fewer than five head of cattle, ranging from low-productivity native zebu to more productive dairy cattle, based on pure European breeds (i.e., Norwegian Red and Holstein). For dairy cattle, cultivated fodders and natural pastures are used: perennial tropical forages (e.g., Pennisetum purpureum, Brachiaria spp.), grown on the hills, and/or temperate forages (e.g., oat, ryegrass), sown on the footslopes and in the lowlands during the dry season (off-season crops in rice fields). However, on most farms, where cattle are mainly used for draft power, crop residues (rice straw, maize residue, etc.) and weeds or natural grass species (locally called ‘bozaka’ and dominated by Aristida spp.) are mainly used for cattle breeding (feeding and litter). To ensure animal feed supplies, most of the available plant biomass (forage, crop residues, and bozaka) is exported from the fields to the cowshed, where the animals are generally located.

2.2. Description of Farms

Nine mixed farms, integrating agriculture and livestock within their production systems, were selected in three districts, namely, Antsirabe I, Antsirabe II, and Manandona (Figure 1B). To have an overview of diversified farming systems in the region, we selected mixed farms with various crop-livestock farming systems and livestock effluent management practices.
The farms (denoted F1, F2,…, F9) were divided into four groups (denoted I, II, III, IV) according to their Utilised Agricultural Area (UAA) and the size of their herd, as well as their Tropical Livestock Units (TLU), their animal carrying capacity and their manure management methods (Table 1). Group I (F1, F2) corresponded to traditional farms, with a small agricultural surface area (≤0.5 ha) and a herd with only one head of native zebu, without any dairy cows and with traditional manure management methods, i.e., stored in an uncovered heap or pit, without liquid manure collection. The breeding system was poorly intensive, the animals being fed exclusively with crop residues, with no on-farm production of fodder grasses. The farmers of this group can be considered as poor or very poor, according to Franke et al. [14]. Group II (F3, F4) corresponded to more intensive dairy farms. These were medium-sized farms (1.0 ha < UAA ≤ 1.5 ha), with only dairy cows (no zebus) and very few small livestock animals (pigs, poultry). Group III (F5, F6) were much larger farms, with 3 to 13 ha of land, 4 to 15 dairy cows, 2 to 6 zebus, and a larger number of pigs and poultry, but with the same level of intensification as the farms in Group II. In the two latter groups of farms, the forage crops had an important place in cattle feeding. Group IV (F7 to F9) had similar farming systems to Group II, but with improved manure management practices; farms F8 and F9 composted their manure, while F7 collected the liquid manure from the barn to then spread it on their fields.

2.3. Data Acquisition for Nutrient Flows

Qualitative and quantitative data concerning resource endowment, land use, crop and livestock activities, and management practices were collected, to depict the farm operation along with one whole-round production campaign. Semi-structured interviews with each farmer were performed to collect data on (i) the structure of the farms (the farmer’s family situation, the number of dependents, etc.); (ii) the characteristics of the livestock (number and species of animals, animal feed, quantity and destination of breeding products, quantity, management practices, and use of livestock effluents); (iii) the characteristics of agriculture (surface and type of crops, crop production and their destinations, the management of crop residues, the inputs used) (Table 1). The nutrient and biomass flows between the household and the external environment of the farm, as well as between the agriculture and livestock compartments, were also determined.
The interviews were complemented with on-farm measurements of daily manure production, daily milk production, and crop yields. Crop and manure samples were collected to determine the elemental composition (total contents of N, P, and K) of organic materials in order to calculate nutrient flows. Total N was determined by dry combustion in a Flash 2000 CHN Analyzer (Thermo Fisher Scientific, Waltham, MA, USA) [23]. Phosphorus and K were determined after the calcination of a sample (0.5 g) of dried and ground material at 550 °C [24]. After cooling, the ash was dissolved in warm 2% HCl before analysis. Total P was determined colorimetrically using the molybdenum blue-ascorbic acid method [25]. Potassium was determined by atomic absorption using an iCE 3000 spectrophotometer (Thermo Fisher Scientific, Waltham, MA, USA) [24].
Flows were calculated considering the quantity of biomass exchanged (information gathered from the interviews and on-farm measurements) and the biomass content (data determined from the analysis of the elemental composition of crop and manure samples collected on-farm or estimated using scientific available data for livestock products).

2.4. Data Analysis of Flows

Based on a common conceptual diagram of flows (Figure 2) to analyse the farms on the same basis, a matrix of flows was drawn up for each farm, based on data acquisition for each of these flows. The objective of this conceptual modelling step consists in representing the farming system structure and functioning as a diagram of flows, corresponding to farming system boundaries, compartments composing the farming system (livestock system with effluent management and processing; cropping system), and nutrient flows between them and their environment. Because of the fact that on some of the farms studied they sell their products while on others the products are mainly intended for household use, we chose to take the household out of the farming system, to compare them on the same biotechnical base.
Matrix modelling consists of computing data on nutrient flows to calculate indicators of interest, with the origin of flows in the columns, the destination of flows in the rows, and the amount of nutrients exchanged expressed at the intersection (Figure 3) [26,27].
The soil was considered as a “black box” in our study, and the internal flows into the soil were not considered in the calculations. They do not include inputs by atmospheric deposition, outputs by volatilization, denitrification, and leaching in the field, nor inputs/outputs related to soil erosion. The calculated balances are therefore considered as “apparent” [27]. The balances were calculated for an agricultural year for each nutrient (N, P, and K).
The calculation of element balances reflects the change in the amount of nutrients between compartments (Table 2). Three types of balances were calculated: (i) an overall balance at the level of the mixed crop-livestock farming system, comparing the inputs, outputs, and efficiency of nutrients from the system; (ii) a partial balance that corresponded to the flow linked to the livestock system in order to assess the contribution of livestock to the overall functioning of the systems studied; and (iii) partial balance related to crop-livestock integration (CLI) to analyze the specific contribution of CLI practices and related products to overall performances of the system studied.
Models performed correspond to flow quantification of nutrients (matrix) and allow calculation of the selected indicators through an Excel spreadsheet, based on information collected and synthesized on a figshare repository (see Data Availability Statement).

3. Results

3.1. Farming System Characterization

3.1.1. Structure: Area, Livestock, and Animal Carrying Capacity

Farms in Group I (F1 and F2) were traditional farms with a small UAA (≤ 0.6 ha) (Table 3). The fields were used mainly for food crops consumed by the households and for cash crops (maize, soya, potato, pea, tomato), with small or no areas of fodder crops. These farms had no dairy cows and only one draft cow, with an average TLU of 1.6 and an average animal carrying capacity of 3.8 TLU ha−1. The number of small livestock animals (e.g., pigs or, poultry) was very low. The farm’s financial resources came only from cash crops.
Group II farms (F3 and F4) were medium-sized dairy farms (0.5 ha < UAA ≤ 1.0 ha). Their agricultural products were quite similar to those of Group I. These farms had a small herd for dairy production (1–2 cows) and no draft cattle, with a larger number of small livestock animals. The average TLU was 3.5 and the average animal carrying capacity was also 3.8 TLU ha−1. The farm’s financial resources came from cash crops and animal products (mainly milk).
The farms in Group III (F5 and F6) were relatively large dairy farms with UAA > 1.0 ha. Most of their UAA was used for food crop production, a large part being sold. These farms were characterized by the dominance of dairy cattle, but also had numerous draft cattle (F5: 4 dairy cows + 2 zebus; F6: 15 dairy cows + 6 zebus). The TLU was 13 and 51 for F5 and F6, respectively, and the average animal carrying capacity was 4.7 TLU ha−1. The number of small livestock animals was larger than in Groups I and II, but it corresponded to a low percentage of the TLU (15%), due to the importance of cattle.
Group IV farms (F7, F8, and F9) were medium-sized dairy farms like the Group II farms (0.5 ha ≤ UAA ≤ 1.0 ha), but they differed from these in terms of biomass management practices and degree of intensification. These farms were characterized by a large number of dairy cows and small animals on a small area, corresponding to an animal carrying capacity from 9 to 48 TLU ha−1. The number of small livestock animals was large and varied from 14 to 60% of TLU.

3.1.2. Livestock and Cropping Management

The feeding system of the farms was highly dependent on off-farm inputs, which represent 30 to 75% of animal feed (Table 4). However, the off-farm inputs into the livestock system varied greatly according to the group of farms. For traditional farms in Group I, they were provided only by the fodder collected in the common rangelands, without the purchase of any supplement feeds. The collected fodder still represented, on average, 44% of off-farm inputs for Groups II to IV. The lower proportion of collected fodder in Group IV was replaced by the purchase of better-quality fodder (12% of off-farm inputs, on average) and concentrates (45% of off-farm inputs, on average).
The on-farm production of feeds (fodder and crop residues) on the dairy farms (Groups II, III, and IV) was dominated by the use of cultivated fodder (62–78% of the ration), whereas for Group I it was dominated by the use of crop residues (85% of the ration). Therefore, forage crops were present in the rotation of dairy farms (25% on average of the UAA), while they were of little importance to Group I. The areas occupied by forage crops were quite different depending on the degree of intensification (with an average of 10% for Group II, 17–25% for Group III, 8–85% for Group IV).
The use of mineral fertilizers was relatively low, but very variable depending on the farm, with inputs varying from 0 to 417 kg ha−1 of fertilizer (Table 4). While the inputs were on average 50 kg ha−1 for the farms in Groups I, II, and III, they reached 290 kg ha−1 for those in Group IV, i.e., the most intensified group of farms. Urea represents 27% of the amount of the fertilizers, the remainder being in the form of NPK fertilizers (mainly 11-22-16 formulation). This corresponds to inputs of 23 kg N ha−1, 19 kg P ha−1 and 13 kg K ha−1.
The organic fertilizers produced by the livestock system (manure, compost, liquid manure) (Table 4) played a key role in fertilization. The traditional farms (Group I), as well as the dairy farms from Groups II and III, were characterized by traditional management practices of animal effluents. Manures were collected every 1 to 3 days, to be stored in uncovered heaps or pits, with the exception of F5, which used a covered heap. Liquid manure was not collected in these farms. Farms in Group IV had improved practices for the management of manure or liquid manure: the farm F7 collected the liquid manure in a separate tank, and farms F8 and F9 composted the manure. For F8, the slurry from pig farming was added to the cattle manure.
The mean NPK contents of organic fertilizer were as follows: 16.9 g N kg−1, 4.2 g P kg−1, and 12.3 g K kg−1 for manure; 17.7 g N kg−1, 6.7 g P kg−1, and 13.7 g K kg−1 for compost; and 17.7 g N kg−1, 6.7 g P kg−1, and 13.7 g K kg−1 for liquid manure, on a dry weight basis. The mean inputs of NPK as organic fertilizers were 39 kg N ha−1, 11 kg P ha−1, and 28 kg K ha−1 for all the farms, except for farm F7, which collected the liquid manure. This corresponded to two-thirds of N and K inputs and one-third of P inputs. For F7, the inputs of NPK as organic fertilizers were 327 kg N ha−1, 79 kg P ha−1, and 570 kg K ha−1, i.e., 8–20 times more than in other farms.

3.2. Balance at the Farming System Level

3.2.1. Input Analysis

Group II corresponded to farms with low input levels (on average 42.5/13.2/43.5 kg ha−1 N/P/K), compared to the average levels in the sample (142.9/32.8/105.9 kg ha−1 N/P/K) (Figure 4). On the other hand, Group IV has the highest level of inputs (283.8/56.2/207.1 kg ha−1 N/P/K). Groups I and III had average input levels, with 85.9/27.9/86.9 kg ha−1 N/P/K, for Group I, and 89.2/22.2/35.5 kg ha−1 N/P/K for Group III).
The inputs of Group II, the lowest, were divided between fodder collection and concentrate for animal feed, as well as, to a very small extent, mineral fertilization and the purchase of manure. Group I, with an intermediate level of inputs, used the same type of practices (collected grass and mineral fertilization only) in a slightly more consistent manner on smaller surfaces and with a smaller herd (but with a similar stocking rate). Group III, also with an intermediate level of inputs, but with larger areas and a larger herd (with a slightly higher stocking rate than Groups I and II), corresponded mainly to inputs for animal feed (concentrate, fodder), with a very small share of inputs for crops (5% of inputs). Finally, Group IV, with the highest level of inputs, corresponded to small farms (equivalent to Group I) with the largest herd (and consequently a much larger stocking rate). These farms import fodder more consistently, and used mineral fertilization more consistently, accounting for one-third of total inputs.

3.2.2. Output Analysis

The farms in Group I had the lowest productivity level, with 15.1/3.1/10.5 kg ha−1 N/P/K, compared to an average of 103.5/15.9/30.7 kg ha−1 N/P/K for all the farms studied (Figure 4). Groups II and III had intermediate productivity levels, but they were below average, with 58.8/9.0/17.1 kg ha−1 N/P/K and 60.1/10.1/18 kg ha−1 N/P/K, respectively. Finally, Group IV had much higher productivity levels, about twice the sample average (221.2/33.0/61.8 kg ha−1 N/P/K).
The very low productivity of Group I is equally divided between animal products (exclusively from the sale of manure) and vegetable products (mainly for self-consumption and to a very small extent the sale of surplus). For the two groups of farms (II and III) with intermediate productivity levels, productivity was equally divided between animal products (mainly milk and to a lesser extent manure) and vegetable products (mainly for self-consumption and to a lesser extent sale of surplus). Finally, Group IV had high productivity based at 75% on animal products (mainly milk, supplemented by meat, manure, or slurry), and supplemented by vegetable products (self-consumption and sale of surplus to a greater extent).

3.2.3. Recycling and Crop-Livestock Integration

Group I had the lowest recycling levels (16.9/3.1/14 compared to 200.0/36.7/242.2 kg ha−1 N/P/K, on average for the sample) (Figure 4). Groups II and III had intermediate recycling levels but below the sample average (140.0/19.7/100.2 and 175.4/37.8/215.4 kg ha−1 N/P/K, respectively). Group IV had the highest recycling levels of the sample, with an average of 378.5/69.8/506.9 kg ha−1 N/P/K, but there was a great deal of variation among the individuals in the group.
The few CLI flows in Group I came mainly from manure recycling for fertilization and a small proportion from crop residues for animal feed. As for Groups II and III at the intermediate level of recycling, it was, on the contrary, the production of fodder and the use of crop residues for animal feed for 2/3 of the exchanges, and organic fertilization from manure for the rest. Finally, for Group IV, with the highest level of recycling, it was both plant resources for animal feed (fodder, crop residues, and pseudo-concentrates) and organic fertilization from manure, compost, and/or slurry.

3.2.4. Efficiency

Group I had the lowest levels of efficiency (17.8/11.5/12.4% versus 77.1/50.2/33.3% N/P/K on average for the sample) (Figure 4). Groups III and IV had efficiency levels close to the sample average (66.8/57.1/82.2% and 77.7/65.5/31.3% N/P/K, respectively). Group II had the highest efficiency levels in the sample for N, and average levels for P and K (146.9/67.9/39.7% N/P/K).
The low level of efficiency in Group I is explained by the very low level of productivity compared to an intermediate level of inputs. Group III had an intermediate efficiency profile, based on average productivity levels and intermediate input levels, offset by intermediate CLI levels. Group IV, with an average level of efficiency, was explained by a high level of inputs, despite good levels of productivity and CLI. Group II, with a better level of efficiency, was explained by a low level of inputs (compensated for by an intermediate level of CLI) and a relatively good level of productivity.

3.3. Specific Contributions to the Functioning of the Farming System

3.3.1. Contribution of the Livestock System

The results (Table 5), in terms of outputs, showed that for Groups I, II, and III, animal products contributed as much as plant products to the exported products (for households or sales). Group IV, on the other hand, had three times more animal products (for N, twice as much for P and K) than plant products exported.
For all the situations studied, inputs for livestock production were much higher than inputs for crop production (between 2 and 18 times the quantity of inputs for crop production for N and K, not for P).
In terms of CLI flows, the situation was more nuanced. In the case of Group I, where CLI flows are very low, the amount of nutrients for animal feed was lower than the amount of nutrients for crop fertilization (4.0/0.9/3.6 versus 12.8/2.2/10.5 kg ha−1 N/P/K). In the other three situations, where CLI flows were more consistent, the proportion of nutrients for animal feed was much higher, between 1.5 and 2.0 times the amount of nutrients recycled for organic fertilization.
It is interesting to note that in all groups of farms, animal manure represented a central product of livestock activities. Indeed, for Group I, manure was the only product of livestock activities (recycled or exported), two-thirds of the animal products in the case of Groups II and III (respectively 66.8/73.0/82.5 and 70.4/76.0/85.6% N/P/K), and half of the animal products in the case of Group IV (50.0/68.8/84.1% N/P/K).

3.3.2. CLI Contribution

The contribution of CLI flows to the functioning of the systems studied, seen as their contribution to animal feed and crop fertilization, in relation to the total quantity of feed distributed and the total quantity of fertilization applied, differed from one group to another (Table 5).
Indeed, Group I, which had the lowest overall CLI levels, still relied for almost half of its fertilization on manure utilization (46.3/9.4/40.7 in % N/P/K), which was much less true for animal feed (5.9/11.9/5.2 in % N/P/K). Groups II and III, which had intermediate levels of CLI (in absolute value), had, relative to the total amount of nutrients distributed or applied, the highest contribution of CLI to the functioning of the system. They had levels of CLI contribution to feeding of above 50% (71.8/64.2/56.2 and 52.6/45.1/79.7% N/P/K, respectively) and fertilization mainly based on CLI flows (86.3/52.7/76.2 and 92.5/83.5/90.8% N/P/K, respectively). Finally, Group IV, which had the highest level of CLI (in absolute value), showed a contribution of CLI flows accounting for half of the amount of feed and fertilization distributed (44.9/46.6/50.8 and 55.4/47.5/73.6 in % N/P/K, respectively).
These results allow us to nuance the quantities of CLI flows relative to the quantities of nutrient flows distributed for animal feed and applied for crop fertilization. Despite the low levels of CLI for Group I, these flows appear to be important for the fertilization of the crop systems present, which is not the case for animal feed, which comes almost exclusively from outside the farm. The same is true, and more markedly, for both animal feed and crop fertilization for Groups II and III, for which feed and especially fertilization rely mainly on these CLI flows. Finally, Group IV, which recycled significant amounts of nutrients through CLI practices, also consumed significant amounts of nutrients (high input levels), which partially diminished the relative importance of CLI flows to the overall functioning of the system.

3.4. Nutrient Balance of Livestock System

The nutrient balance of the livestock system corresponded to nutrient losses during the handling and storage of organic material on the farm. The livestock nutrient losses (L_Liv) and percentage of livestock nutrient losses (R_Liv) varied greatly between the farms, particularly between the farms in group IV, according to the methods of management of livestock effluents. This led us to distinguish, amongst the farms of group IV, between the ones that composted their manure (Farms F8 and F9; Group IVc), and the ones that collected their liquid manure (Farm F7; Group IVlm), in addition to groups I to III (Figure 5).
The livestock nutrient losses were large for N (54–166 kg ha−1) and K (58–439 kg ha−1), these two elements having quite similar dynamics (Figure 5a). They were much smaller for P (<18 kg ha−1), sometimes with a gain in P (31 kg ha−1), when the liquid manure was collected in the barn. The percentage of livestock nutrient losses varied considerably according to the groups and the biomass management practices (Figure 5b). For N and K, they reached 70–80% for Group I, the conservation of nutrients being very poor. They were lower (39–45% for N; 56–68% for K) for the farms in Groups II and III, as well as for Group IVc, which composted their manure. On the other hand, the losses were much lower (19% for N; 42% for K) for Group IVp which collected their liquid manure. For P, the losses were quite large for Groups I and III (47–56%) and low for Groups II and IVc (3–7%), while we observed a gain in P for Group IVp (28%).

4. Discussion

4.1. Nutrient Balance at the Farm Level

The off-farm inputs varied greatly between farm groups (Table 4). In traditional farms with draft cattle, they mainly depended on the fodder collected from the common rangelands. This corresponded to traditional livestock practices widely developed in SSA (e.g., Manlay et al. [29] and Bisson et al. [30] for West Africa). It also highlights the importance of common rangelands in biomass and nutrient flows in traditional livestock farming systems. However, on dairy farms, the inputs corresponded mainly to purchases of concentrates, rich in nitrogen and mineral elements [31], for lactating cows. The inputs were higher on the farms where the level of intensification of production was high (Group IV). The inputs were also related to mineral fertilizers, which on average represented one-third of the inputs of N and K and two-thirds of those of P. The use of mineral fertilizers on the farms studied in the Vakinankaratra region was 10–20 times greater than the Malagasy average (1.4 kg N, 0.6 kg P and 0.7 kg K ha−1 year−1 [32]).
The outputs were lower than the inputs in all groups of farms and for all nutrients, except for N in Group II (Figure 4), which resulted in positive nutrient balances at the farm level. Indeed, the amounts and/or nutrient contents of crop and livestock products exported from the farming system, i.e., consumed by household or sold, were rather low. Only a small proportion of crop products were exported. In the case of rice, the grain (exported out of the farming system) represented only 50% of the biomass produced (grains + straw), 57% of N, 87% of P, and only 20% of K [15]. Forages, richer in nutrients than rice [15], remained in the farming system. In the livestock system, a large part of the nutrients ingested by the animals were excreted in their urine and faeces [4,33] and therefore remained in livestock effluents. Animal products (milk, meat, eggs) exported from the farming system were relatively poor in nutrients [34,35].
On-farm nutrient balances averaged +41, +16, and +76 kg ha−1 for N, P, and K, respectively. These positive balances were lower than those determined by Alavrez et al. [36] in the same region for N (+80 to +246 kg N ha−1 year−1). Comparisons with other SSA situations were difficult because the scales, (plot, farm, village, etc.), the systems studied (farming system with or without the homestead), and the type of balances (partial or full balances) varied between studies [10]. Indeed, studies such as ours, on the scale of the farming system without the homestead with a partial balance calculation are scarce. The study by Zingore et al. [37] presented results consistent with ours, with positive nutrient balances at the farm level varying from 0 to 20 kg N ha−1 year−1 and 0 to 8 kg P ha−1 year−1, depending on the wealth of the farmers.

4.2. Effect of Recycling Intensity on Nutrient Balance

Nutrient recycling, through integrated farming-livestock practices, plays a central role in the functioning of the systems studied. With the exception of the farms in Group I, the amount of nutrients recycled through integration practices was far greater than the amount of nutrients imported into the system, regardless of input levels. This resulted in the greater efficiency of these systems, which, through the internal recycling of nutrients, allowed for a significant improvement in performance and especially in productivity. The performance of Group I corroborated these results with relatively low levels of integration, as well as their level of productivity and efficiency. These results are consistent with the work of Stark et al. [26], conducted in a Latin Caribbean context, and with Rufino et al. [38] in sub-Saharan Africa, who showed that farms with high levels of CLI had the best performance in terms of productivity and efficiency taken together.
However, the results of Stark et al. [26] suggested that the farms with the best performance were those with relatively high levels of inputs, which finally “feed” the internal recycling process, which was partially true in our case. The farms with the highest level of inputs were also those with the highest level of CLI, even if farms with lower levels of inputs also had a high level of CLI (GII and GIII). In the work conducted by Alvarez et al. [36] in Madagascar, the “rich farms” with the highest levels of inputs were also those with the highest levels of recycling.
The other notable result of this work was related to the distribution of CLI flows between crop fertilization and animal feeding. The result was that a greater proportion of nutrients were recycled through animal feeding than through crop fertilization, with the exception of Group I farms with very low CLI levels. These results are indeed close to the work of Stark et al. [39] in Guadeloupe (French West Indies), which showed the importance of CLI practices in the conduct of animal feeding in mixed crop-livestock systems.
However, these results showed the centrality of manure management in the functioning of this type of system [4]. Indeed, manure was the source of more than half of the fertilization brought to the present cropping systems (even almost all for the Group II and III farms) and was the main animal product of these farms (except for Group IV, for which manure represented 50% of animal products in terms of nitrogen).

4.3. Nutrient Balance at the Livestock Systems Levels

For livestock, traditional manure management resulted in high losses of nutrients (up to 80% for Group I; up to 70% for Groups II and III). In our previous work [15], we showed that the amount of nutrients remaining in manure compared with those of rice straw (the main fodder in traditional farming systems) were 36% for N, 69% for P, and 26% for K. For the whole rice (straw + grain), the figures were only 15% for N, 9% for P, 21% for K. According to Tittonell et al. [40], for a study on different manures in Kenya, the nutrients remaining in the manure after storage were 24–38% for N, 34–38% for P, and 18–34% for K. Both of these results are in line with our results, highlighting a loss of two-thirds to three-quarters of nutrients during traditional manuring.
However, the losses were lower for Groups II and III than for Group I. Group I manure came mainly from collected fodder, composed of very recalcitrant organic constituents. Their mineralization was low, which limited the immobilization of mineral nitrogen from faeces. For Groups II and III, the addition of less recalcitrant organic matter (cellulose-rich fodder, concentrates) resulted in a positive priming effect, leading to an increase in the mineralization of the organic matter and the immobilization of nitrogen (and other mineral elements) due to the increase of the activity of microorganisms [41]. The immobilization of nutrients in organic forms preserves them from leaching, which can occur when the nutrients in the faeces remain in mineral forms.
The losses in livestock systems where manure was composted (Group IVc) did not seem different from those in dairy farms with traditional manure management (Groups II and III). Indeed, composts were, like manure, subject to nitrogen losses by volatilization and losses of N, P, K, etc. by leaching [42]. Moreover, various authors have indicated that the losses of N and P were greater during composting compared to stock [43,44].
Better management of liquid manure (Group IVlm) allowed a more efficient collection of urine, and probably faeces. This resulted in a large reduction in the loss of nutrients in the livestock system. Indeed, according to Ruffino et al. [4], 54% of the nitrogen ingested by cattle is found in the urine and 29% in the faeces. For Gustafson et al. [33], the quantities excreted in the urine and the faeces, relative to the quantities ingested, were, respectively, 41 and 32% for N, 2 and 60% for P, 69 and 11% for K.
For the cropping systems of farms with traditional management of biomass (Groups I, II, and III), the nutrient balances were slightly positive. This showed that the nutrient contents of the soils were not depleted, unlike what is often observed in sub-Saharan Africa (SSA) [8,10]. However, as we have shown in a recent study [15], organic fertilizers were not sufficient to balance crop exports. Therefore, it was the inputs of mineral fertilizers, even in low quantities, that balanced the outputs of mineral elements. Indeed, many studies showed the need for mineral fertilizers in SSA agrosystems [45,46].
The intensification of production systems in dairy farms (Groups II and III) did not significantly change the nutrient balance of cropping systems. The higher flows from the cropping system related to harvest (Cli_Liv, Out_Crop) were balanced mainly by a better quality of manure, related to a better quality of the fodder supplied to the animals. The mineral fertilizer inputs being similar to those of Group I, these inputs also had a beneficial effect, as for Group I, but their contribution was proportionally smaller.
Manure composting (Group IVc) had no positive effect on the nutrient balance compared to Groups II and III. Compost often has a higher nutrient content than manure. However, this corresponds only to increased mineralization, which results in dry weight loss of the material during composting and a subsequent increase in the concentration of mineral elements [42]. However, composting manure can have a beneficial effect on soil fertility. Composting stabilizes organic compounds, which limits mineralization and promotes humification after application in the soil [47]. Therefore, compost could promote the accumulation of organic matter in the soil, leading to some positive effects on soil fertility [48]. Moreover, stable organic material is less prone to losing nitrogen through volatilization and nutrients through leaching.
Only the recycling of liquid manure affected the nutrient balance (Group IVp). This resulted in slightly more positive balances for N and P and a very high positive balance for K, leading to the excessive fertilization of cultivated fields with the latter.

5. Conclusions

Our results allow us to partially conclude on the hypothesis of improved overall performance through improved manure management. Indeed, Group IV farms implemented improved manure management practices and showed the best levels of CLI and productivity, as well as better livestock system efficiency. Specifically, the negative nutrient balance of the livestock systems was greatly reduced for Group IVp by the recycling of liquid manure. On the other hand, the performance was also related to the level of inputs on these farms, which were the highest, and which consequently led to intermediate levels of overall efficiency.
Our study confirms that agro-environmental performances are better in farming systems that reach a more intensive level of intensification, leading to increased resource use efficiency compared to traditional farming systems. This requires the development of an “ecological modernization” of livestock systems, as defined by Duru and Therond [49], which aims at improving performance while reducing negative externalities. Among its priorities, improving the recycling of nutrients through better management of livestock effluents is a major prospect.
Our work needs to be developed in order to analyse a wider range of biomass management practices. Data acquisition on Malagasy farms, still necessary to obtain sufficient reference data, can be sustained by modelling approaches as ecological network analysis to better understand the impact of recycling practices as CLI on global performances. The analysis of various biomass management scenarios, regarding both animal feeding and crop fertilization dimensions, would lead us towards the analysis of the practices that would appear to be the most promising.

Author Contributions

Conceptualization, T.B. and P.S.; methodology, T.B., M.L.F. and F.S.; data acquisition, M.L.F. and J.F.R.; formal analysis, M.L.F., F.S. and N.P.R.; writing—original draft preparation, T.B., F.S., M.L.F. and N.P.R.; writing—review and editing, all authors; project administration, T.B., T.R. and P.S.; funding acquisition, T.B. and P.S. All authors have read and agreed to the published version of the manuscript.

Funding

This research was supported by the African Union, under reference AURG II-1-075-2016 through financial supports and a post-doctoral grant to M.L. Fanjaniaina.

Institutional Review Board Statement

Not applicable.

Informed Consent Statement

Not applicable.

Data Availability Statement

Data were deposited on a figshare repository at the following DOI: 10.6084/m9.figshare.18394313 (Licence CC BY 4.0).

Acknowledgments

The authors are grateful to the nine farmers from the Vakinankaratra region who contributed, with their time and patience, to data collection. We are also thankful to M.P. Razafimanantsoa and A.H.D. Razafimahafaly (LRI, Antananarivo, Madagascar) for her technical assistance in the laboratory.

Conflicts of Interest

The authors declare no conflict of interest.

References

  1. Herrero, M.; Thornton, P.K.; Notenbaert, A.M.; Wood, S.; Msangi, S.; Freeman, H.A.; Bossio, D.; Dixon, J.; Peters, M.; van de Steeg, J.; et al. Smart investments in sustainable food production: Revisiting mixed crop-livestock systems. Science 2010, 327, 822–825. [Google Scholar] [CrossRef] [Green Version]
  2. Lemaire, G.; Franzluebbers, A.; de Faccio Carvalho, P.C.; Dedieu, B. Integrated crop-livestock systems: Strategies to achieve synergy between agricultural production and environmental quality. Agric. Ecosyst. Environ. 2014, 190, 4–8. [Google Scholar] [CrossRef]
  3. Powell, J.M.; Pearson, R.A.; Hiernaux, P.H. Crop–livestock interactions in the West African drylands. Agron. J. 2004, 96, 469–483. [Google Scholar] [CrossRef]
  4. Rufino, M.C.; Rowe, E.C.; Delve, R.J.; Giller, K.E. Nitrogen cycling efficiencies through resource-poor African crop–livestock systems. Agric. Ecosyst. Environ. 2006, 112, 261–282. [Google Scholar] [CrossRef]
  5. Adegbeye, M.J.; Reddy, P.R.K.; Obaisi, A.I.; Elghandour, M.M.M.Y.; Oyebamiji, K.J.; Salem, A.Z.M.; Morakinyo-Fasipe, O.T.; Cipriano-Salazar, M.; Camacho-Díaz, L.M. Sustainable agriculture options for production, greenhouse gasses and pollution alleviation, and nutrient recycling in emerging and transitional nations-An overview. J. Clean. Prod. 2020, 242, 118319. [Google Scholar] [CrossRef]
  6. Mottet, A.; de Haan, C.; Falcucci, A.; Tempio, G.; Opio, C.; Gerber, P. Livestock: On our plates or eating at our table? A new analysis of the feed/food debate. Glob. Food Sec. 2017, 14, 1–8. [Google Scholar] [CrossRef]
  7. Muscat, A.; de Olde, E.M.; de Boer, I.J.; Ripoll-Bosch, R. The battle for biomass: A systematic review of food-feed-fuel competition. Glob. Food Sec. 2020, 25, 100330. [Google Scholar] [CrossRef]
  8. Stoorvogel, J.J.; Smaling, E.M.A.; Windmeijer, P.N. Calculating soil nutrient balances in Africa at different scales. I. Supra-national scale. Fert. Res. 1993, 35, 227–235. [Google Scholar] [CrossRef] [Green Version]
  9. Chianu, J.N.; Chianu, J.N.; Mairura, F. Mineral fertilizers in the farming systems of sub-Saharan Africa. A review. Agron. Sustain. Dev. 2012, 32, 545–566. [Google Scholar] [CrossRef] [Green Version]
  10. Cobo, J.G.; Dercon, G.; Cadisch, G. Nutrient balances in African land use systems across different spatial scales: A review of approaches, challenges and progress. Agric. Ecosyst. Environ. 2010, 136, 1–15. [Google Scholar] [CrossRef]
  11. Haynes, R.J.; Mokolobate, M.S. Amelioration of Al toxicity and P deficiency in acid soils by additions of organic residues: A critical review of the phenomenon and the mechanisms involved. Nutr. Cycl. Agroecosyst. 2001, 59, 47–63. [Google Scholar] [CrossRef]
  12. Vanlauwe, B.; Giller, K.E. Popular myths around soil fertility management in sub-Saharan Africa. Agric. Ecosyst. Environ. 2006, 116, 34–46. [Google Scholar] [CrossRef]
  13. Sourisseau, J.M.; Rasolofo, P.; Bélières, J.F.; Guengant, J.P.; Ramanitriniony, H.K.; Bourgeois, R.; Razafimiarantsoa, T.T.; Andrianantoandro, V.T.; Ramarijaono, M.; Burnod, P.; et al. Diagnostic Territorial de la Région du Vakinankaratra à Madagascar; Agence Française de Développement: Paris, France, 2016. [Google Scholar]
  14. Franke, A.C.; Baijukya, F.; Kantengwa, S.; Reckling, M.; Vanlauwe, B.; Giller, K.E. Poor farmers-poor yields: Socio-economic, soil fertility and crop management indicators affecting climbing bean productivity in northern Rwanda. Exp. Agric. 2019, 55, 14–34. [Google Scholar] [CrossRef] [Green Version]
  15. Fanjaniaina, M.L.; Delarivière, J.L.; Salgado, P.; Tillard, E.; Rabeharisoa, L.; Becquer, T. Biomass harvesting leads to soil acidification: A study of mixed crop–livestock farming systems in Madagascar. Crop Pasture Sci. 2021, 72, 236–244. [Google Scholar] [CrossRef]
  16. Vayssières, J.; Rufino, M.C. Managing nutrient cycles in crop and livestock systems with green technologies. In Green Technologies in Food Production and Processing; Boye, J., Arcand, Y., Eds.; Food Engineering Series; Springer: Boston, MA, USA, 2012; pp. 151–182. [Google Scholar]
  17. Billen, G.; Aguilera, E.; Einarsson, R.; Garnier, J.; Gingrich, S.; Grizzetti, B.; Lassaletta, L.; Le Noë, J.; Sanz-Cobena, A. Reshaping the European agro-food system and closing its nitrogen cycle: The potential of combining dietary change, agroecology, and circularity. One Earth 2021, 4, 839–850. [Google Scholar] [CrossRef]
  18. Bonaudo, T.; Bendahan, A.B.; Sabatier, R.; Ryschawy, J.; Bellon, S.; Leger, F.; Magda, D.; Tichit, M. Agroecological principles for the redesign of integrated crop-livestock systems. Eur. J. Agron. 2014, 57, 43–51. [Google Scholar] [CrossRef]
  19. IUSS Working Group. World Reference Base for Soil Resources 2014. International Soil Classification System for Naming Soils and Creating Legends for Soil Maps; World Soil Resources Reports 106; Food and Agriculture Organization of the United Nations: Rome, Italy, 2014. [Google Scholar]
  20. Raminoarison, M.; Razafimbelo, T.; Rakotoson, T.; Becquer, T.; Blanchart, E.; Trap, J. Multiple-nutrient limitation of upland rainfed rice in ferralsols: A greenhouse nutrient-omission trial. J. Plant Nutr. 2020, 43, 270–284. [Google Scholar] [CrossRef]
  21. Kögel-Knabner, I.; Amelung, W.; Cao, Z.; Fiedler, S.; Frenzel, P.; Jahn, R.; Kalbitz, K.; Kölbl, A.; Schloter, M. Biogeochemistry of paddy soils. Geoderma 2010, 157, 1–14. [Google Scholar] [CrossRef]
  22. Penot, E.; Duba, G.; Salgado, P.; Dugué, P. Capacités d’adaptation des exploitations laitières des hautes terres de la province du Vakinankaratra à Madagascar: Impacts de la crise de 2009. Rev. Elev. Med. Vet. Pays Trop. 2016, 69, 19–31. [Google Scholar] [CrossRef] [Green Version]
  23. McGeehan, S.L.; Naylor, D.V. Automated instrumental analysis of carbon and nitrogen in plant and soil samples. Commun. Soil Sci. Plant Anal. 1988, 19, 493–505. [Google Scholar] [CrossRef]
  24. Okalebo, R.J.; Gathua, K.W.; Woomer, P.L. Laboratory Methods of Soil and Plant Analysis: A working Manual, 2nd ed.; Sacred Africa: Nairobi, Kenya, 2002. [Google Scholar]
  25. Murphy, J.; Riley, J.P. A modified single solution method for the determination of phosphate in natural waters. Anal. Chim. Acta 1962, 27, 31–36. [Google Scholar] [CrossRef]
  26. Stark, F.; Gonzalez-Garcia, E.; Navegantes, L.; Miranda, T.; Poccard-Chapuis, R.; Archimede, H.; Moulin, C.H. Crop-livestock integration determines the agroecological performance of mixed farming systems in Latino-Caribbean farms. Agron. Sustain. Dev. 2018, 38, 4. [Google Scholar] [CrossRef] [Green Version]
  27. Simon, J.C.; Grignani, C.; Jacquet, A.; Le Corre, L.; Pagès, J. Typologie des bilans d’azote de divers types d’exploitation agricole: Recherche d’indicateurs de fonctionnement. Agronomie 2000, 20, 175–195. [Google Scholar] [CrossRef]
  28. Latham, L.G. Network flow analysis algorithms. Ecol. Modell. 2006, 192, 586–600. [Google Scholar] [CrossRef]
  29. Manlay, R.J.; Ickowicz, A.; Masse, D.; Feller, C.; Richard, D. Spatial carbon, nitrogen and phosphorus budget in a village of the West African savanna—II. Element flows and functioning of a mixed-farming system. Agric. Syst. 2004, 79, 83–107. [Google Scholar] [CrossRef]
  30. Bisson, A.; Boudsocq, S.; Casenave, C.; Barot, S.; Manlay, R.J.; Vayssières, J.; Masse, D.; Daufresne, T. West African mixed farming systems as meta-ecosystems: A source-sink modelling approach. Ecol. Modell. 2019, 412, 108803. [Google Scholar] [CrossRef]
  31. Van den Bosch, H.; de Jager, A.; Vlaming, J. Monitoring nutrient flows and economic performance in African farming systems (NUTMON): II. Tool development. Agric. Ecosyst. Environ. 1998, 71, 49–62. [Google Scholar] [CrossRef]
  32. FAO. FAO Statistical Yearbook 2014: Africa Food and Agriculture; FAO Regional Office for Africa: Accra, Ghana, 2014. [Google Scholar]
  33. Gustafson, G.M.; Olsson, I. Partitioning of nutrient and trace elements in feed between body retention, faeces and urine by growing dairy-breed steers. Acta Agric. Scand. A Anim. Sci. 2004, 54, 10–19. [Google Scholar] [CrossRef]
  34. Iyengar, G.V. Elemental Composition of Human and Animal Milk; IAEA-TECDOC-269; International Atomic Energy Agency: Vienna, Austria, 1982. [Google Scholar]
  35. Ahmad, R.S.; Imran, A.; Hussain, M.B. Nutritional composition of meat. Meat Sci. Nut. 2018, 61, 10–5772. [Google Scholar]
  36. Alvarez, S.; Rufino, M.C.; Vayssières, J.; Salgado, P.; Tittonell, P.; Tillard, E.; Bocquier, F. Whole-farm nitrogen cycling and intensification of crop-livestock systems in the highlands of Madagascar: An application of network analysis. Agric. Syst. 2014, 126, 25–37. [Google Scholar] [CrossRef]
  37. Zingore, S.; Murwira, H.K.; Delve, R.J.; Giller, K.E. Influence of nutrient management strategies on variability of soil fertility, crop yields and nutrient balances on smallholder farms in Zimbabwe. Agric. Ecosyst. Environ. 2007, 119, 112–126. [Google Scholar] [CrossRef]
  38. Rufino, M.C.; Tittonell, P.; Reidsma, P.; López-Ridaura, S.; Hengsdijk, H.; Giller, K.E.; Verhagen, A. Network analysis of N flows and food self-sufficiency—A comparative study of crop-livestock systems of the highlands of East and southern Africa. Nutr. Cycl. Agroecosyst. 2009, 85, 169–186. [Google Scholar] [CrossRef] [Green Version]
  39. Stark, F.; Fanchone, A.; Semjen, I.; Moulin, C.H.; Archimede, H. Crop-livestock integration, from single-practice to global functioning in the tropics: Case studies in Guadeloupe. Eur. J. Agron 2016, 80, 9–20. [Google Scholar] [CrossRef]
  40. Tittonell, P.; Rufino, M.C.; Janssen, B.H.; Giller, K.E. Carbon and nutrient losses during manure storage under traditional and improved practices in smallholder crop-livestock systems: Evidence from Kenya. Plant Soil 2010, 328, 253–269. [Google Scholar] [CrossRef] [Green Version]
  41. Kuzyakov, Y.; Friedel, J.K.; Stahr, K. Review of mechanisms and quantification of priming effects. Soil Biol. Biochem. 2000, 32, 1485–1498. [Google Scholar] [CrossRef]
  42. Bernal, M.P.; Alburquerque, J.A.; Moral, R. Composting of animal manures and chemical criteria for compost maturity assessment. A review. Bioresour. Technol. 2009, 100, 5444–5453. [Google Scholar] [CrossRef]
  43. Parkinson, R.; Gibbs, P.; Burchett, S.; Misselbrook, T. Effect of turning regime and seasonal weather conditions on nitrogen and phosphorus losses during aerobic composting of cattle manure. Bioresour. Technol. 2004, 91, 171–178. [Google Scholar] [CrossRef]
  44. Larney, F.J.; Buckley, K.E.; Hao, X.; McCaughey, W.P. Fresh, stockpiled, and composted beef cattle feedlot manure: Nutrient levels and mass balance estimates in Alberta and Manitoba. J. Environ. Qual. 2006, 35, 1844–1854. [Google Scholar] [CrossRef]
  45. Vanlauwe, B.; Bationo, A.; Chianu, J.; Giller, K.E.; Merckx, R.; Mokwunye, U.; Ohiokpehai, O.; Pypers, P.; Tabo, R.; Shepherd, K.D.; et al. Integrated soil fertility management: Operational definition and consequences for implementation and dissemination. Outlook Agric. 2010, 39, 17–24. [Google Scholar] [CrossRef] [Green Version]
  46. Vanlauwe, B.; Wendt, J.; Giller, K.E.; Corbeels, M.; Gerard, B.; Nolte, C. A fourth principle is required to define conservation agriculture in sub-Saharan Africa: The appropriate use of fertilizer to enhance crop productivity. Field Crop. Res. 2014, 155, 10–13. [Google Scholar] [CrossRef]
  47. Molina-Herrera, S.; Romanya, J. Synergistic and antagonistic interactions among organic amendments of contrasted stability, nutrient availability, and soil organic matter in the regulation of C mineralisation. Eur. J. Soil Biol. 2015, 70, 118–125. [Google Scholar] [CrossRef]
  48. Palm, C.A.; Gachengo, C.N.; Delve, R.J.; Cadisch, G.; Giller, K.E. Organic inputs for soil fertility management in tropical agroecosystems: Application of an organic resource database. Agric. Ecosyst. Environ. 2001, 83, 27–42. [Google Scholar] [CrossRef]
  49. Duru, M.; Therond, O. Livestock system sustainability and resilience in intensive production zones: Which form of ecological modernization? Reg. Environ. Change 2015, 15, 1651–1665. [Google Scholar] [CrossRef]
Figure 1. The Vakinankaratra region in Madagascar (in gray) (A) and a detailed map showing the location of studied farms (B).
Sustainability 14 00984 g001
Figure 2. Common conceptual model performed to analyse and compare the farms studied.
Sustainability 14 00984 g002
Figure 3. Summary of methodological steps of conceptual and matrix modelling of the systems studied. According to Latham [28] convention, each farming system is characterized by the following elements: n, the number of compartments; H i and H j , the compartments i and j; x ˙ i and x ˙ j the states derivative for compartment i and j; f i j , the internal flows from compartment H j to compartment H i ; Y 0 i and Y 0 j , the outflow from compartment H i and H j to the external environment; and Z i 0 and Z j 0 , the inflow from the external environment to compartment H i and H j .
Sustainability 14 00984 g003
Figure 4. Average value of calculated indicators (Inputs, Outputs, CLI expressed in kg ha−1 (left axis) and Nutrient Use Efficiency (NUE) expressed in % (right axis) per nutrient (N, P, K) and per farm group.
Sustainability 14 00984 g004
Figure 5. Livestock nutrient loss (a) and percentage of livestock nutrient loss (b) for the livestock system.
Sustainability 14 00984 g005
Table 1. Main characteristics of the nine farms studied.
FarmF1F2F3F4F5F6F7F8F9
GroupIIIIIIIIIIIIIVIVIV
LocalisationVinaninkarenaVinaninkarenaAntsirabe IMandaniresakaAntsenakely-AndraikibaAndranomanelatraAntsirabe AmbonivohitraManandonaManandona
Farmer
Age553250537257475957
Main activityFarmerFarmerTown
hall employee
FarmerFarmerFarmerFarmerFarmerFarmer
Secondary activityNoneNoneFarmerState employeeNoneNoneNoneTeacherNone
Dependents324435932
Farm characteristics
Main FeaturesTraditional farmsSmall dairy farms with traditional biomass managementLarge dairy farms with traditional biomass managementSmall dairy farms with improved biomass management
Main cropsFood crops; Forage crops; Cash cropsFood crops; Forage cropsFood crops; Forage crops;
Cash crops
Food crops; Forage crops
LivestockDraft cattleDairy cattle; PoultryDairy cattle; Pigs; PoultryDairy cattle; Pigs; Poultry
Manure managementTraditional heapOpen-pitTraditional heapTraditional heapCovered heapTraditional heapOpen-pit + concrete pit (liquid manure)Manure compostingManure composting
Table 2. Indicators used to characterize flow balance and assess performances of farms studied for each nutrient (N, P, K).
Global performance indicators
 Total InputsΣ INIn_Liv + In_Cropkg ha−1
  Inputs to livestock systemsIn_LivIn_Conc + In_Forag + In_Anim + In_Grasskg ha−1
  Inputs to cropping systems In_CropIn_Ferti + In_Man + In_Seedkg ha−1
 Total Outputs Σ OUTOut_Liv +Out_Cropkg ha−1
  Outputs from livestock systemsOut_LivOut_Milk + Out_Meat + Out_Egg + Out_Mankg ha−1
  Outputs from cropping systemsOut_CropOut_Hous + Out_Soldkg ha−1
 Nutrient use efficiency (NUE)NUEΣ OUT/Σ IN%
 Crop-livestock integrationΣ CLICli_Liv + Cli_Cropkg ha−1
  CLI to livestock systemsCli_LivCli_Forag + Cli_Res + Cli_Conckg ha−1
  CLI to cropping systemsCli_CropCli_Man + Cli_Comp + Cli_Liqkg ha−1
Livestock performance indicators
 Total inflows to livestockTot_In_LivIn_Liv + Cli_Livkg ha−1
 Total outflows from livestockTot_Out_LivOut_Liv + Cli_Cropkg ha−1
 Livestock nutrient use efficiencyNUE_LivTot_Out_Liv/Tot_In_Liv%
 Livestock nutrient lossL_LivTot_In_Liv–Tot_Out_Livkg ha−1
 Percentage livestock nutrient lossR_LivL_Liv/(L_Liv + Tot_Out_Liv)%
CLI contribution to farming system functioning
 Rate of CLI in total inflowsR_CliΣ CLI/(Σ CLI + Σ IN)%
 CLI in animal feedingR_FeedCli_Liv/Tot_In_Liv%
 CLI in cropping system fertilizationR_FertiCli_Crop/(Cli_Crop + In_Man + In_Ferti)%
 Manure in animal productsR_Man(Cli_Crop + Out_Man)/Tot_Out_Liv%
The inputs for the livestock system corresponded to living animals (In_Anim), purchased fodder (In_Forag), fodder collected for free outside the farm in rangeland commons (In_Grass), and as purchased concentrates (In_Conc). The inputs for the cropping system corresponded to mineral fertilizers and amendments (In_Ferti), purchased manures used as organic fertilizers (In_Man), and other compounds such as seeds (In_Seed). The outputs are related to the sale of farm products or to household self-consumption, i.e., animal products in the form of milk (Out_Milk), meat (Out_Meat) and eggs (Out_Egg), manure sold (Out_Man), and crop products, consumed by household (Out_Cons) or sold (Out_Sold). CLI flows corresponded to cultivated tropical and temperate forages (Cli_Forag), crop residues (rice straw, maize residue, etc.) from cropping systems (Cli_Res), and farm-produced concentrate, i.e., grain of maize or manioc tuber (Cli_Conc). The Organic fertilization produced on the farm corresponded to non-processed manure (Cli_Man), compost (Cli-Comp), and liquid manure (Cli_Liq).
Table 3. Characterization of the structure of the cropping and livestock systems of the nine studied farms.
FarmF1F2F3F4F5F6F7F8F9
GroupIIIIIIIIIIIIIVIVIV
Cropping system
UAA (ha)0.340.541.000.802.5012.000.530.630.69
Food crops (ha)0.10.30.60.31.79.20.10.40.3
Rice in food crops (%)10042366666751006385
Forage crops (ha)0.00.10.10.10.62.00.50.050.2
Cash crops (ha)0.30.20.20.00.00.00.00.140.2
Others (ha) 10.00.00.20.40.20.70.00.00.0
Livestock system
TLU1.71.44.42.513.051.125.29.36.1
Dairy cattle0021415535
Draft cattle1100.26021
Pigs10204205039
Poultry00263111913535030
Animal carrying capacity
(TLU/ha)
5.02.64.43.15.24.247.614.78.9
1: Fruit trees, vegetables, fallow, etc.
Table 4. Characterization of the feeding system and crop fertilization of the nine farms studied.
FarmF1F2F3F4F5F6F7F8F9
GroupIIIIIIIIIIIIIVIVIV
Feeding system
Fodder collected (kg DM ha−1)2185406429930371946514951002671
Fodder purchased (kg DM ha−1)000014680377100
Concentrate purchased (kg DM ha−1)0017251501946396018671605735
Fodder produced (kg DM ha−1)22503356167579032325683826181858
Crop residues produced (kg DM ha−1)5227321708128134481000791879594
Crop fertilization
Mineral fertilizers purchased (kg ha−1)121892045060258195417
Organic fertilizers purchased (kg DM ha−1)003200040000342
Manure (kg DM ha−1)22541521138419625108263712,93100
Compost (kg DM ha−1)000000020181306
Liquid manure (kg DM ha−1)000000758700
Manure sold (kg DM ha−1)90950705234800000
Table 5. Indicators calculated to characterize flows balance and assess performances of farms studied for each group of farms and each nutrient (N, P, K).
GIGIIGIIIGIV
NPKNPKNPKNPK
Global Performances Indicators
Σ Inkg ha−185.927.986.942.513.243.589.222.235.5283.856.2207.1
In_Livkg ha−171.07.071.636.55.636.584.420.232.5200.122.8181.7
In_Cropkg ha−114.920.915.35.97.77.04.82.03.183.733.525.3
Σ OUTkg ha−115.13.110.558.89.017.160.110.118.0221.233.061.8
Out_Livkg ha−17.71.36.325.84.27.934.06.111.5165.121.440.4
Out_Cropkg ha−17.31.84.233.04.79.226.14.06.556.011.621.3
NUE%17.811.512.4146.067.939.766.857.182.277.765.531.3
Σ CLIkg ha−116.93.114.0140.019.7100.2175.437.8215.4378.569.8506.9
Cli_Livkg ha−14.00.93.693.59.766.1107.620.6165.2223.429.2288.4
Cli_Cropkg ha−112.82.210.546.510.034.167.817.250.2155.140.6218.5
Livestock performance indicators
Tot_In_Livkg ha−175.17.975.2130.115.3102.6192.040.8197.7423.552.0470.1
Tot_Out_Livkg ha−120.63.516.872.314.242.0101.723.361.7320.261.9259.0
NUE_Liv%27.043.822.158.293.243.854.853.431.567.8107.848.8
L_Livkg ha−154.54.458.457.81.160.790.217.5136.0103.3−10.0211.2
R_Liv%72.655.777.744.46.959.147.042.968.824.4−19.244.9
Contribution of CLI
R_Cli%16.710.114.276.057.262.064.157.182.247.945.558.9
R_Feed%5.911.95.271.864.256.252.645.179.744.946.650.8
R_Ferti%46.39.440.786.352.776.292.583.590.855.447.573.6
%100.0100.0100.066.873.082.570.476.085.650.068.884.1
Publisher’s Note: MDPI stays neutral with regard to jurisdictional claims in published maps and institutional affiliations.

