The data investigation, the survey outcomes, and the managerial discussions of this study are precisely summarized in the ensuing section.
5.1. Primary Characteristics of the Sample
The primary profile of sample respondents is portrayed in
Table 1, and the classification of sample respondents is also described as follows:
In view of sample respondents based on gender, 65.7 percent are male, and 34.3 are female. In regard to the age of the sample respondents, 41.0 percent fall under the age group of 30–40 Yrs., 28.0 percent belong to the age group of 41–50 Yrs., 17.2 percent are in the age group of Above 50 Yrs., 13.8 percent fall under the age group of less than 30 Yrs. Breakdown of the sample respondents based on marital status indicates that a large proportion (47.8 percent) are married, 21.6 percent are unmarried, 17.9 percent are divorced/separated, and 12.7 percent are widowed. With respect to education level, 27.2 percent of sample respondents have completed secondary education, 23.1 have qualified higher secondary/diploma, 19.8 percent have completed primary education, 15.7 percent are graduates, and 14.2 percent are illiterate.
In view of the sample respondents based on monthly income level, 35.8 percent fall under the monthly income category of Rs.10,000–Rs.15,000, 27.2 percent belong to the monthly income level of Rs.15,001–Rs.20,000, 19.4 percent are in the monthly income level of below Rs.10,000, and 17.5 percent are in the monthly income level of more than Rs.20,000. A majority of the respondents have taken Pradhan Mantri Jan Dhan Yojana (PMJDY) (46.3 percent), 17.9 percent have taken Atal Pension Yojana (APY), 12.7 percent have taken PM Jeevan Jyoti Bima Yojana (PMJJBY), 10.4 percent have taken PM Suraksha Bima Yojana (PMSBY), 8.2 percent have taken Sukanya Samriddhi Yojana (SSY), and the remaining 4.5 percent have taken other financial inclusive schemes.
Table 1.
The primary profile of the sample respondents.
Table 1.
The primary profile of the sample respondents.
| Primary Profile | Category | N | Frequency | Percentage (%) |
|---|
| 1. Gender | Male | 268 | 176 | 65.7 |
| Female | 268 | 92 | 34.3 |
| 2. Age (Completed Years) | Less than 30 Yrs. | 268 | 37 | 13.8 |
| 30–40 Yrs. | 268 | 110 | 41.0 |
| 41–50 Yrs. | 268 | 75 | 28.0 |
| Above 50 Yrs. | 268 | 46 | 17.2 |
| 3. Marital Status | Married | 268 | 128 | 47.8 |
| Unmarried | 268 | 58 | 21.6 |
| Divorced/separated | 268 | 48 | 17.9 |
| Widow | 268 | 34 | 12.7 |
| 4. Education Level | Illiterate | 268 | 38 | 14.2 |
| Primary school | 268 | 53 | 19.8 |
| Secondary school | 268 | 73 | 27.2 |
| Higher secondary/diploma | 268 | 62 | 23.1 |
| Graduate | 268 | 42 | 15.7 |
6. Monthly income
(INR) | Below Rs.10,000 | 268 | 52 | 19.4 |
| Rs.10,000–Rs.15,000 | 268 | 96 | 35.8 |
| Rs.15,001–Rs.20,000 | 268 | 73 | 27.2 |
| More than Rs.20,000 | 268 | 47 | 17.5 |
| 7. Financial Inclusion Schemes | 1. Pradhan Mantri Jan Dhan Yojana (PMJDY) | 268 | 124 | 46.3 |
| 2. PM Jeevan Jyoti Bima Yojana (PMJJBY) | 268 | 34 | 12.7 |
| 3. PM Suraksha Bima Yojana (PMSBY) | 268 | 28 | 10.4 |
| 4. Atal Pension Yojana (APY) | 268 | 48 | 17.9 |
| 5. Sukanya Samriddhi Yojana (SSY) | 268 | 22 | 8.2 |
| 6. Others | 268 | 12 | 4.5 |
5.2. Exploratory Factor Study and Key Findings
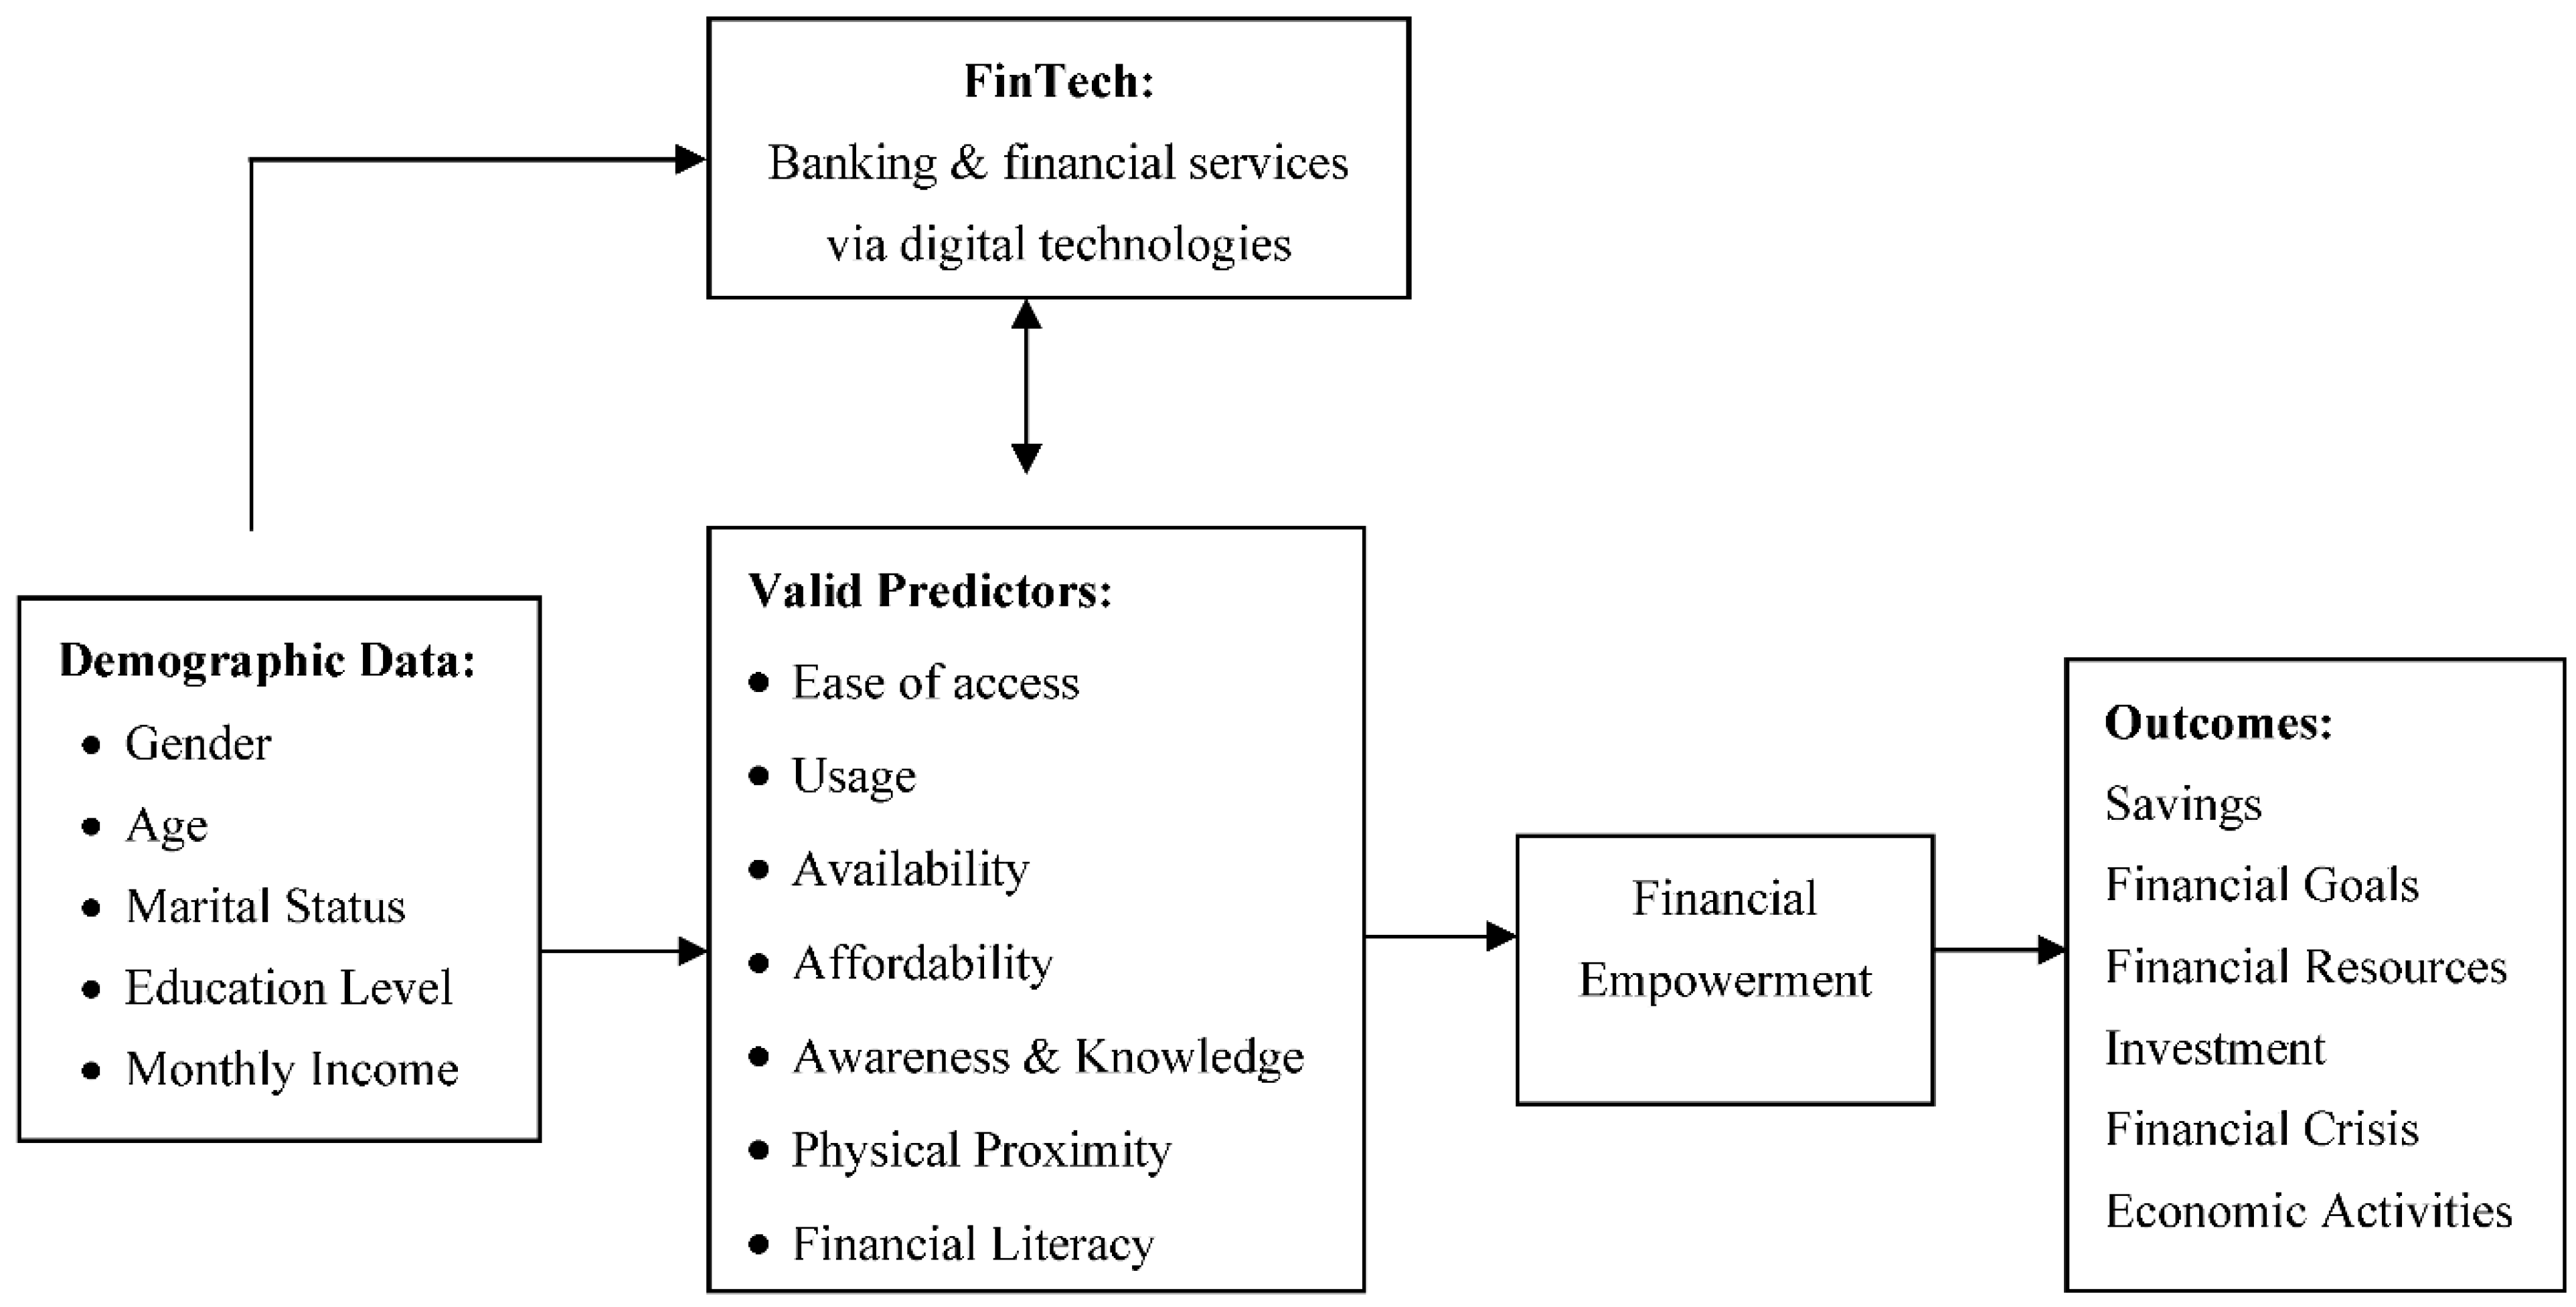
The nitty-gritty of this pragmatic study is to develop and validate the measurement constructs for financial inclusion in the context of sustainability. In order to accomplish this purpose, an exploratory factor study was performed by applying the latest SPSS Version 22.0. The step-by-step PCA (Principal Component Analysis) with varimax rotation has been employed to explore the underlying constructs that underpin the financial inclusion of blue-collar migrant workers. Total of 50 statements that best reflect the acumens of blue-collar migrant workers on financial inclusion have been exposed to the multivariate data analysis technique to reduce them to a few uncorrelated constructs. Initially, all 50 measurement items were subjected to an exploratory factor study, which effectively mined nine factors. This analysis clarifies that some measurement indicators were not appropriately loaded on any one of the paradigm constructs, and some measurement indicators were replicating. Hence, nine measurement indicators have been removed from the original list. One more exploratory factor analysis was performed with 41 measurement items, and eight construct factors were experimentally observed with eigenvalues higher than 1.
To test the appropriateness of sample data for the exploratory factor study, the relationship matrix was calculated, exposing enough correlations to advance with the exploratory factor study. The Anti-Image Correlation Matrix (AICM) was computed and indicated that the partial correlations were low by enlightening true constructs in the sample data. The Kaiser–Meyer–Olkin—Measure of Sampling Adequacy (KMO-MSA) was effectively employed for every research construct from the diagonals of PCM, the Partial Correlation Matrix. The PCM was observed to be reasonably high for every research construct. The inclusive MSA has been consistently computed to determine whether the sample size remained adequate for sampling.
Bartlett’s Test of Sphericity (BTS) has been applied effectively to exemplify whether the number of correlations between research constructs is highly significant. The overall KMO-MSA has been calculated (KMO-MSA = 0.857), and the BTS was statistically significant (χ
2 = 36,662.770, df = 820,
p-value = 0.000), signifying the appropriateness of sample research data for exploratory factor study. Therefore, all of these investigations showed that the data was suitable for exploratory factor analysis. The PCA has been applied for mining and extracting underlying constructs. The number of constructs extracted was categorically absolute based upon the “Latent Root Criterion (LRC)” (
Table 2). Indeed, all component loadings higher than 0.50 (ignoring positive or negative signs) were subjected to study analysis. The guiding principles for determining significant component loadings based on the study sample size of 350 or more consider the factor loading of 0.30 [
27].
Eigenvalues for the factors 1 to 8 are 7.153, 5.549, 5.446, 4.397, 3.869, 3.527, 3.269, and 3.160, as shown by the first and foremost column of
Table 3. The proportion of the significant Variance described by individual constructs is portrayed in the subsequent column of
Table 3. From the analysis, it is obvious that the proportion of the Variance explicated by underlying constructs 1 to 8 is 17.447, 13.533, 13.283, 10.725, 9.437, 8.602, 7.972, and 7.707, respectively. The reliability of the underlying and fundamental constructs was effectively tested by Cronbach’s alpha (α). The internal consistency valuation of scale measurements was assessed using Cronbach’s alpha for every construct and wide-ranging constructs. The ICA of the sample data was carried out to test appropriate reliability and to fit the consistent validity of the scale indicators. Cronbach’s alpha was computed to investigate the internal consistency of the factor construct and its appropriate reliability (
Table 4).
Cronbach’s alpha (α) of 0.70 is the minimum recommended reliability coefficient (Nunnally, 1978). It is applied here to assess the consistent validity and appropriate reliability of every construct of financial inclusion. The outcoming results are shown in
Table 3. Thus, the reliability test was considered highly satisfactory as Cronbach’s alpha (α) is observed to be higher than 0.70 for all research constructs. Thus, alpha (α) values for mined and extracted constructs such as Ease of Access, Usage, Availability, Affordability, Physical Proximity, Awareness and Knowledge, Financial Literacy, and Financial Empowerment are 0.984, 0.968, 0.924, 0.864, 0.843, 0.921, 0.882, and 0.824, respectively.
Table 2.
Statistics for construct validity of financial inclusion.
Table 2.
Statistics for construct validity of financial inclusion.
| KMO Measure of Sampling Adequacy | Bartlett’s Test of Sphericity (BTS) |
|---|
| Approx. χ2 | df | p-Value |
|---|
| 0.857 | 36,662.8 | 820 | 0 |
Table 3.
Total Variance Explained for the Underlying Constructs of Financial Inclusion.
Table 3.
Total Variance Explained for the Underlying Constructs of Financial Inclusion.
| Factors | 1 | 2 | 3 | 4 | 5 | 6 | 7 | 8 |
|---|
| Initial Eigenvalues | Total | 7.153 | 5.549 | 5.446 | 4.397 | 3.869 | 3.527 | 3.269 | 3.160 |
| % of Variance | 17.447 | 13.533 | 13.283 | 10.725 | 9.437 | 8.602 | 7.972 | 7.707 |
| Cumulative % | 17.447 | 30.980 | 44.263 | 54.988 | 64.425 | 73.028 | 81.000 | 88.707 |
| Extraction Sums of Squared Loadings | Total | 7.153 | 5.549 | 5.446 | 4.397 | 3.869 | 3.527 | 3.269 | 3.160 |
| % of Variance | 17.447 | 13.533 | 13.283 | 10.725 | 9.437 | 8.602 | 7.972 | 7.707 |
| Cumulative % | 17.447 | 30.980 | 44.263 | 54.988 | 64.425 | 73.028 | 81.000 | 88.707 |
| Rotation Sums of Squared Loadings | Total | 6.989 | 5.433 | 5.339 | 4.416 | 3.825 | 3.641 | 3.527 | 3.201 |
| % of Variance | 17.046 | 13.252 | 13.022 | 10.770 | 9.328 | 8.880 | 8.601 | 7.807 |
| Cumulative % | 17.046 | 30.298 | 43.320 | 54.090 | 63.418 | 72.298 | 80.900 | 88.707 |
Table 4.
Underlying construct loadings, % of variance explained, and Cronbach’s alpha for extracted construct for financial inclusion.
Table 4.
Underlying construct loadings, % of variance explained, and Cronbach’s alpha for extracted construct for financial inclusion.
| | Underlying Construct | Indicators | Construct Loadings | % of Variance Explained | Cronbach’s alpha (α) |
|---|
| 1 | Ease of Access (EA) | EA1: Availing of bank loans through FI schemes (e.g., PMJDY) is easy. | 0.948 | 17.447 | 0.984 |
| EA2: Accessing the bank account via FI schemes is easy. | 0.926 |
| EA3: It is easy to avail of banking services through FI schemes. | 0.875 |
| EA4: Opening no-frills (zero-balance) accounts under FI schemes is easy | 0.911 |
| EA5: I can easily get a credit facility from the Bank via FI schemes. | 0.953 |
| EA6: Availing micro-credit is easier through FI schemes. | 0.931 |
| EA7: Bank employees are easily accessible for availing banking services. | 0.932 |
| EA8: The bank branch is conveniently located for easy access. | 0.877 |
| 2 | Usage (U) | U1: I often visit the bank branch for money transfers/withdrawals/deposits. | 0.880 | 13.533 | 0.968 |
| U2: I habitually use an ATM/debit card for money withdrawals and deposits. | 0.928 |
| U3: I often visit the bank branch to enquire about financial inclusion schemes. | 0.931 |
| U4: I visit a bank branch to avail bank loans. | 0.946 |
| U5: I visit the bank branch frequently to repay the bank loan. | 0.923 |
| U6: Bank employees are always cooperative and friendly in doing my transactions. | 0.951 |
| 3 | Availability (AV) | AV1: Bank loans offered via FI schemes are quickly available. | 0.869 | 13.283 | 0.924 |
| AV2: Bank personnel are available to fill the withdrawal form/deposit form | 0.872 |
| AV3: Bank employees are always accessible to obtain guidelines about new FI schemes | 0.895 |
| AV4: The step-step procedure is less demanding for getting a bank loan under FI schemes. | 0.882 |
| AV5: A credit counseling facility is available in my bank branch. | 0.903 |
| 4 | Affordability (AF) | AF1: The interest rates on all bank loans are affordable under FI schemes. | 0.715 | 10.725 | 0.864 |
| AF2: The charge of opening the bank account under FI schemes is affordable. | 0.713 |
| AF3: The requirement of a minimum balance is affordable to maintain a bank account. | 0.720 |
| AF4: Usage cost is affordable for banking services/ATM card/debit card is | 0.708 |
| 5 | Physical Proximity (PP) | PP1: Proximity to a bank branch | 0.629 | 9.437 | 0.843 |
| PP2: Proximity to ATMs | 0.646 |
| PP3: Proximity to post office | 0.654 |
| PP4: Proximity to cooperative banks | 0.623 |
| 6 | Awareness & Knowledge (A&K) | A&K1: I am aware of various FI schemes offered by the Government. | 0.887 | 8.602 | 0.921 |
| A&K2: I participate in awareness campaigns on FI schemes conducted by banks. | 0.873 |
| A&K3: I know about various benefits of FI schemes provided by the Government. | 0.853 |
| A&K4: I am aware of FI schemes via advertisements given by the Government. | 0.884 |
| 7 | Financial Literacy (FL) | FL1: I have basic knowledge of accessing banking services. | 0.813 | 7.972 | 0.882 |
| FL2: The adoption of banking technology is easy. | 0.749 |
| FL3: I have skills in accessing e-banking services. | 0.807 |
| FL4: I am technically sound in accessing online banking services. | 0.746 |
| 8 | Financial Empowerment (FM) | FM1: I save money in my savings account at the bank regularly. | 0.745 | 7.707 | 0.824 |
| FM2: I can set my long-term/short-term financial goals periodically. | 0.698 |
| FM3:I can manage my financial resources effectively. | 0.856 |
| FM4: I have regularly invested a portion of my earnings in financial assets. | 0.765 |
| FM5: I am confident in coping with my financial crisis. | 0.635 |
| FM6:I can effectively participate in the economic activities of my house | 0.678 |
5.4. Multiple Regression Analysis
A multiple linear regression equation is performed to examine the influence of underlying constructs of financial inclusion on the financial empowerment of the sample respondents. Here the financial empowerment as a dependent variable and the underlying constructs of financial inclusion as predictor variables and these study variables are expressed in the following designated multiple linear regression equation:
Financial Empowerment (FE) = Constant + B1 Ease of Access (EA) + B2 Usage (U) + B3 Availability (A) + B4 Affordability (A) + B5 Awareness and Knowledge (A&K) + B6 Physical Proximity (PP) + B7 Financial Literacy (FL) + ε.
For critically examining the influence of underlying constructs on financial empowerment, entering all underlying constructs of the financial inclusion in the unique block model, the researchers identified that the regression model proposed for this study clearly explained a significant part of Variance in Financial Empowerment (FE).
Table 5 portrays that 91.2% of observed Variance in Financial Empowerment (FE) is evidently manifested by seven predictive research variables (R
2 = 0.912, Adjusted R
2 = 0.908).
In order to examine the null hypothesis of this study that there was no linear statistical relationship in the study population between a dependent variable and predictive variables of this model, the ANOVA
Table 6 has been considered and used. The statistical outcomes from
Table 6 clearly indicated that the proportional ratio of the two mean squares (F) was 416.534 (F-value = 416.534,
p < 0.05). Meanwhile, the observed probability value (
p-value) of the model was deemed to be less than 0.001; the seven predictive research variables positively influenced the financial empowerment of the sample respondents.
Table 5.
Summary of outcome of multiple regression model.
Table 5.
Summary of outcome of multiple regression model.
| Study Model | Multiple R | R2 | Adjusted R2 | Std. Error of the Estimate |
|---|
| 1 | 0.934 a | 0.912 | 0.908 | 0.312 |
Table 6.
Summary of Outcome of ANOVA b.
Table 6.
Summary of Outcome of ANOVA b.
| Study Model | Sum of Squares (SOS) | df | Mean Square (MS) | F Ratio | p-Value |
|---|
| 1 | Regression | 773.365 | 7 | 110.481 | 416.534 | 0.000 a |
| Residual | 142.698 | 538 | 0.265 |
| Total | 916.063 | 545 | | | |
For examining the null hypothesis of this study, that the partial regression coefficient of the study population for the research variables is zero, the t-statistic of this model and its pragmatic significance level were effectively applied and used for drawing statistical inference about the study. The resultant outcomes are shown in
Table 7. The outcomes from
Table 7 indicated that the researchers can safely reject null hypothesis (H
0) that the beta coefficients for underlying constructs of financial inclusion such as availability (β = 0.367, t = 5.624,
p < 0.05), ease of access (β = 0.284, t = 3.695,
p < 0.05), usage (β = 0.276, t = 3.826,
p < 0.05), awareness and knowledge (β = 0.185, t = 2.869,
p < 0.05), financial literacy (β = 0.165, t = 2.369,
p < 0.05), physical proximity (β = 0.158, t = 2.321,
p < 0.05), and affordability (β = 0.129, t = 2.102,
p < 0.05) and were deemed to be less than 0.05.
The β weights indicated that the research variable availability (β = 0.367) has a strong positive significant impact on financial empowerment. Similarly, the β weights showed that ease of access (β = 0.284), usage (β = 0.276), awareness and knowledge (β = 0.185), financial literacy (β = 0.165), physical proximity (β = 0.158), and affordability (β = 0.129) have also a strong positive significant impact on financial empowerment.
Practical Implications
The outcome of this pragmatic study facilitates researchers to use and ratify the research constructs developed and validated by this study in the fertile areas of social sciences. This study also provides the policymakers and providers of financial inclusion services with a wide spectrum of reliable and valid constructs underpinning financial inclusion. This study will help commercial banks, financial institutions, and the government design and provide financial and banking services based upon the underlying constructs of financial inclusion.
The measurement instrument identified and validated in this study will provide the Government of India (GoI) with the practical implications of offering banking and financial services and products easily accessible by blue-collar migrant workers. Moreover, researchers, research scholars, academicians, and practitioners from other geographical areas of India can apply the validated and reliable underlying constructs in future research in the financial inclusion domain. Compared to other measurement scales, this measurement scale is easier to administer, and the response rate would be better and more reliable.


 ,
, 

