Abstract
By structural equation modeling (SEM), this paper analyzes and explores the four Potential Characteristics of the supervisory board. They are: Individual Heterogeneity of the Supervisory Member (Internal Heterogeneity), Organization Size of the Supervisory Board (Organization Size), Structural Characteristics of the Supervisory Board (Structural Characteristics) and Identity Background of the Supervisory Board (Identity Background). Then, it constructs a path analysis and theoretical model of the influence of supervisory board heterogeneity on corporate irregularities, and verifies each influencing factor and observation index. The results show that individual factor Professional heterogeneity is the most effective indicator of Internal Heterogeneity, but such Internal Heterogeneity has a very limited effect on the occurrence of corporate irregularities. Organization Size has a significant impact on corporate misbehavior, and Number of people is an important factor in constructing Organization Size, yet the frequency of staff Turnover is not significant. Although the Average Age, Party Member Ratio, and Female Ratio can well conceptualize the Structural Characteristics, their effects on supervision performance are not obvious. Identity Background, including factors such as Average Education, Government/University Experience, or External Supervisors, does not improve supervisory performance and reduce the occurrence of irregularities. The above findings provide a foundation for further analysis and integration of multiple heterogeneous factors, as well as further study of the “combined effectiveness” of the supervisory board, and deeper investigation of the actual impact of the supervisory board on irregularities.
1. Introduction and Literature Review
Supervisory board heterogeneity is closely related to supervisory effectiveness, and the different nature of supervisory boards can lead to different behavioral consequences and have different impacts [1,2]. Regarding the study of supervisory board heterogeneity, Dahya et al. [3] classify supervisory boards in terms of governance functions as supervisory boards that do not act, supervisory boards that merely provide opinions, supervisory boards that monitor but do not provide information and data and supervisory boards that both monitor and provide data. Agrawal and Chadha [4] demonstrate in their research that Corporate Earnings Management is not significantly related to the independence of the board of directors and the board of supervisors, but is affected by the professional background of independent directors and supervisors. Wu [5] investigates the impact of three traits: supervisory board members’ shareholding, professional characteristics and part-time employment on the performance of the supervisory board.
Existing studies on the measurement of heterogeneity in supervisory boards are not common, and in a study by Li et al. [6], the elements of heterogeneity are divided into two types: occupational heterogeneity and social heterogeneity. Occupational heterogeneity includes occupational experience, career duration and educational experience, which are variables that determine the different positions and perspectives of members and thus shape their decision-making process [7]; social heterogeneity includes elements such as gender, age and ethnicity, which are often considered to eliminate stereotypes and reduce conflicts [8].
Regarding indicators of supervisory board heterogeneity, researchers usually select or classify them according to different research needs, theoretical foundations and variable characteristics, and the conclusions are complicated and difficult to unify, but no matter how they are selected, they are based on relevant theories and supported by corresponding criteria and dimensions. Hambrick [9] argues that the demographic characteristics of executive teams (e.g., age, gender, ethnicity and tenure, etc.) reflect the experience, skills, perceptions and values of team members, and this demographic heterogeneity of member characteristics may have an impact on decision-making and, consequently, on firm performance [10,11,12]. Most of the many current studies have selected demographic background characteristic heterogeneity as a key measurement, and the most frequently selected are age heterogeneity [13,14], gender heterogeneity [15], professional background heterogeneity [16,17,18], educational background heterogeneity [19,20] and tenure heterogeneity [21,22,23]; these heterogeneous characteristics are often selected simultaneously.
Although many studies have been conducted to demonstrate the effects of corporate governance structures such as board structure [24,25], independent directors [26], executive background [27] and disclosure of management information [28] on irregularities of listed companies, the relationship between irregularities and supervisory board monitoring performance has not been studied deeply enough. Based on the perspective of corporate violations, Zhou et al. [29] conducted an empirical study on the relationship between economic independence and the governance function of the supervisory board, which provides new ideas for improving the supervisory board system of listed companies and provides a reference for this paper’s research.
The possible contributions of this article are mainly reflected in two aspects:
At the theoretical level, the governance of supervisory boards is actually a complex and controversial system, and a single theory or evaluation cannot interpret and judge its operational effectiveness [30]. The Chinese Supervision Mechanism has a unique social environment and development context, and there is still a need for reform, as well as great space for reform [31,32]. This paper broadens the research field of the heterogeneity of the board of supervisors, finds and demonstrates that there are great differences in legal systems and employment mechanisms between common law and civil law countries, and the functions of the board of supervisors and enterprise executives are also very different. The theories and tools that have been verified in much of the foreign literature are not necessarily applicable to the measurement and analysis of the heterogeneity of Chinese corporate supervisory boards.
At the practical level, designing and managing a small team is the basis for planning and leading the healthy development of the company. This study preliminarily selected and determined the heterogeneity dimensions and indicators by referring to the research status and results of the heterogeneity of senior management teams, then collected relevant data of Chinese listed companies with extreme differences (CSI 300 and ST companies) from 2015 to 2019. Subsequently, the Structural Equation Model (SEM) was used to verify the explanatory power of more important heterogeneous factors and observation indicators, to depict and analyze the potential characteristics of the supervisory board further, while, providing an important practical basis and data basis for selecting the team of the supervisory board and improving the supervision system, so as to reduce the loss of violations and improve efficiency and level of supervision. Finally, the paper demonstrates the rationality of measuring supervisory board performance by corporate irregularities, and explores the paths of supervisory boards in affecting irregularities, linking supervisory board heterogeneity to corporate irregularities, extending the research on corporate violation risk and laying the foundation for further research to assess supervisory board monitoring performance.
2. Theoretical Framework and Hypotheses
2.1. Reasonableness Demonstration of Measuring the Performance of the Supervisory Board by Corporate Irregularities
The governance performance of the supervisory board is reflected in at least two aspects: external governance efficiency is the supervisory effect that the supervisory board can achieve, which is expressed in terms of supervisory efficiency, efficiency in revealing irregularities, efficiency in information disclosure, etc.; internal governance efficiency is the efficiency of the operation of the supervisory board, which is reflected in terms of team allocation efficiency and operational efficiency [33]. From the perspective of the operation mechanism of the supervisory board, the impact of the governance of the supervisory board on the performance of the company is indirect. The governance performance of the supervisory board cannot be directly equated with the company’s operating performance. The basic function and primary goal of the supervisory board is to exercise the right of supervision, and its governance performance should be reflected in the supervision of the company’s operation and the correction of the company’s violations in everyday management. Conversely, the irregularities and the current situation of listed companies can also reflect the governance effectiveness and supervision level of the supervisory board [33]. Logically, if the supervisory committee diligently performs its supervisory function, effectively supervises the behavior of directors and executives in performing their duties, corrects behaviors that harm the company’s interests in a timely manner, and questions and investigates the abnormal operation of the company, then the probability of violations of listed companies should gradually decrease. On the contrary, if violations occur frequently but the supervisory board is silent, then the supervisory board’s supervisory duties will not only be questioned but may even be considered as a co-conspirator of violations [34]. Therefore, the selection of irregularities of listed companies as an important indicator to measure the governance performance of the supervisory board should have certain validity and scientificity.
2.2. Theoretical Basis for Measuring the Performance of the Board of Supervisors
According to Social Identity Theory, heterogeneity can lead to team fragmentation, reduce cohesion and hinder corporate performance development [35]. In contrast, Information Decision Theory suggests that decisions are based on information, so attention should be paid to individual differences in teams, and heterogeneity facilitates access to different information that can be complementary [36].
Besides, according to the Threshold Effect Theory, the size of the team will have different effects on team performance: when the number of people is below a certain number, expansion of size will have a positive impact on the company, while after the size reaches a certain number, the continued expansion of the team will increase the agency costs and the positive benefits will be weakened [37].
In addition, fewer changes, maintaining long-term cooperation and co-working experience could help to establish good cooperative relationships, stable communication mechanisms, shared values and consistent behavior patterns, which eventually make the team as a whole have strong cohesion and stability and play an important role in the formation of dedicated human capital [38,39]. From the perspective of rapport, the strength of heterogeneity within the supervisory board directly affects internal stability and work efficiency. A low-heterogeneity supervisory board objectively reduces internal conflicts and maintains a stable atmosphere of mutual recognition and respect between each other, resulting in stable personnel; conversely, a strong heterogeneity results in a high turnover of personnel.
Furthermore, the term External Supervisor refers to a supervisor who is an outsider of the company, emphasizing the supervision from external forces not directly related to the company’s operation. An external supervisor can usually be confused with the concept of independent supervisor, except that external supervisors are more prominent in “professionalism” and most of them are social professionals, which helps to balance the overly disparate power in control [40] and prevents controlling shareholders from seeking private interests [41]. Theoretically, external supervisors should be less susceptible to interference and influence from directors or managers, avoiding collusion to create new insider control and reducing the occurrence of irregularities.
2.3. Path of Action of the Model and the Underlying Hypothesis
In this paper, heterogeneity is divided into Team Heterogeneity (supervisory board characteristics) at the overall level and Member Heterogeneity (individual attributes) at the micro level. At the individual level, heterogeneity refers to the differentiation of members within the supervisory board, which corresponds to the homogeneity of demographic characteristics and values among members; such differences in experience, skills, perceptions, and values among members [42,43] may have an impact on decision-making and, consequently, on the firm’s performance [44]. At the level of supervisory board team, overall heterogeneity is a state where heterogeneity refers to the degree to which the team characteristics of a particular item differ from other similar teams, including individual demographic heterogeneity factors and interrelationships, as well as some characteristic factors of the team as a whole, such as: structural characteristics, organizational characteristics or independence characteristics presented in the supervisory board team [45].
Path 1: Internal Heterogeneity → Corporate Irregularities
Age Heterogeneity is an important variable that affects the communication of the team and affects team stability when the heterogeneity level is high [46]. Income Difference can lead to discord and feelings of unfairness that are detrimental to performance [47]. Educational Difference implies differences in education levels and diversity in educational backgrounds, which can enable members to analyze complex problems from different perspectives and facilitate and improve the quality of corporate decisions [48]. Professional Heterogeneity can show different training methods and ways of thinking under different professional fields, thus influencing the personality traits, thinking habits and career plans of individuals [49]. The greater the Background Difference, the better the advisory role can be played [50], considering that the complexity of the background of service makes the supervisors’ respect diminish in marginal utility; the heterogeneity index of supervisor background can be obtained by referring to the formula of Gini Coefficient [51,52].
The combination of the above differences creates Internal Heterogeneity, which increases the intensity of internal heterogeneity and has an impact on supervisory performance, which in turn corresponds to corporate irregularities. The above analysis leads to the following hypothesis:
Hypothesis 1.
Internal Heterogeneity has an impact on Corporate Irregularities.
Path 2: Internal Heterogeneity → Organization Size → Corporate Irregularities
Organization Size includes not only the static number of personnel, but also the dynamic turnover of personnel. The Number of Supervisory Board Members can represent the size of the supervisory board, and this characteristic directly affects the professional, experience and skill pool and overall effectiveness of the supervisory board, so that larger supervisory boards are able to cover more diverse professions and richer knowledge and information to perform the supervisory duty more effectively [53]; conversely, a smaller supervisory board may be one of the main reasons for loss of control in monitoring the quality of accounting information [54]. However, when the size of the supervisory board exceeds a certain number, continued expansion will significantly increase agency costs and subsequently the positive benefits will continue to diminish [55]. Cui and Wang [56] find that a large supervisory board can represent the interests of more interested parties and alleviate the problem of “one share is too big”, but the study verifies the hypothesis that the size of the supervisory board is negatively related to the violations of listed companies. In addition, Frequency of Staff Replacement refers to the change of staff during one term of the supervisory board.
Combining the above analysis, the following hypotheses are proposed:
Hypothesis 2a.
The strength of Internal Heterogeneity is positively related to team stability, which in turn is positively related to Organization Size.
Hypothesis 2b.
Organization Size has an impact on Corporate Irregularities.
Path 3: Structural Characteristics → Corporate Irregularities
Structural Characteristics show the external visible state and characteristics of the supervisory board team. According to Li et al. [57], age is an obvious personal characteristic, and older executives are more likely to accumulate political capital and social resources [58]. Gender Differences can have an impact on risk preferences, inefficient investments [59] and interpersonal relationships [60]. Lu [61] also demonstrates that female executives are significantly and negatively associated with the probability of corporate irregularities because women are more risk-averse and more reputation-valued. To a certain extent, the Party Membership Ratio reflects the effectiveness of the party organization’s participation in corporate governance, and moderate “two-way entry”, which is conducive to enhancing and improving corporate governance [62].
The above analysis shows that Average Age, Percentage of Women and Percentage of Party Members can influence Structural Characteristics. The more pronounced the structural characteristics are, the better the supervisory performance should be, thus reducing the occurrence of irregularities. Therefore, the following hypothesis is proposed:
Hypothesis 3.
The more pronounced Structural Characteristics, the more significant the negative effect on Corporate Irregularities.
Path 4: Identity Background → Corporate Irregularities
Identity Background can include components such as average education, proportion of external supervisors, and proportion of members with government or college experience, showing the educational background and professional identity of the team.
Education level is a manifestation of individual cognitive ability, and Average Education is also positively related to the team’s communication frequency, which has a positive impact on corporate performance [63]. The term Government/College Experience refers to working experience in government or colleges. Managers with academic backgrounds are considered to have a significant impact on their supervisory functions in terms of their knowledge and professional expertise, as well as their consulting skills, intangible reputational resources and tangible social resources [64], while the value of managers with an official background in government is mainly reflected in resource acquisition [65]. External Supervisor refers to a supervisor who is an outsider of the company.
It is commonly believed that Identity Background enables supervisory board members to gain more political status, supervisory experience, policy information and broader perspective, and to some extent also to have an incentive effect to perform their supervisory duties more proactively, thus enhancing supervisory performance and reducing the occurrence of irregularities. Therefore, the following related hypothesis is proposed:
Hypothesis 4.
The more pronounced Identity Background, the more significant the negative effect on Corporate Irregularities.
In summary, Organization Size, Identity Background, Structural Characteristics and Internal Heterogeneity are jointly defined as the Potential Characteristics of the supervisory board. The analysis of the heterogeneous characteristics of the supervisory board, supervisory performance and irregularities should basically follow the following path (Figure 1, where the symbol → indicates the direction of the path and the corresponding theoretical basis is indicated above, and the symbol + indicates a positive influence and the symbol—indicates a negative influence, the symbol ↔ indicates a correlation).
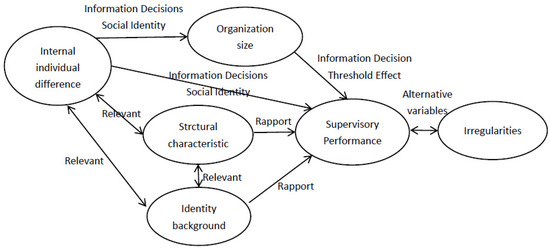
Figure 1.
Model of the effect of supervisory board heterogeneity on corporate irregularities.
3. Data Selection, Design and Analysis
3.1. Data Sources for Selecting Heterogeneity Indicators for Supervisory Boards
In this paper, a total of 18 indicators showing the heterogeneity of the supervisory board were selected (see Table 1). When selecting the samples, the external performance of the supervisory board’s supervision performance was considered, and the CSI 300 companies and ST companies were actively distinguished. The CSI 300 index reflects representative stocks with strong liquidity and large scale, which can usually cover about 60% of the market capitalization of the Shanghai and Shenzhen markets, with good market representation and better corporate profitability. Thus, their supervision should be more effective. Conversely, ST companies are listed companies with abnormal financial or other conditions, with risks in investment or even delisting. The sample covered the latest supervisory boards of companies in CSI 300 (300 companies) and ST companies (141 companies) between 2015 and 2019, with data obtained from the WIND database, and individual data obtained from publicly announced information and manual calculations.

Table 1.
Measurements and descriptive statistics of heterogeneity indicators of supervisory boards.
The Herfindahl index (also known as Blau index, calculated as , and is the proportion of class members to the total number of team members) was used to find the heterogeneity coefficient, and the larger the heterogeneity coefficient, the higher the degree of heterogeneity and the more likely to form a dominant ranking. The degree of heterogeneity for employment background (including 2 factors: executive background and government or university experience) was calculated by the “Co-variance formula method” [66], calculated as . is the number of the no. i supervisor’s tenure backgrounds and requires ranking in the order of (must be ranked from small to large to make the Gini coefficient valid, otherwise there will be negative values); i represents the ranking according to the weight of each supervisor’s background; n is the number of supervisors; is the average number of supervisors on the supervisory board; represents the covariance withand i, measuring the overall deviation of the two variables, and can be measured directly by Excel.
3.2. Data Sources for Selecting Indicators for Corporate Irregularities
In recent years, the compliance risk of listed companies has been rising and the number of violations has been increasing [67,68]. According to the WIND database and the information and data announced by companies, there were a total of 8674 violations by domestic A-share companies during the five years from 2015 to 2019, of which there were 2085 violations in 2019, 2197 violations in 2018, 1368 violations in 2017, 2562 violations in 2016 and 462 in 2015 (see Figure 2); especially in 2018, the number of violations increased by 60.6% compared with the previous year. The number of violations peaked in 2016, and then declined and leveled off due to the fact that the violations in that year were basically concentrated in banking companies. The CBRC promulgated “Guidelines for Comprehensive Risk Management of Banking Financial Institutions” in 2016 to guide the banking industry to establish comprehensive risk management awareness, establish a sound comprehensive risk management system, strengthen external supervision and take timely measures to respond to problems when they were identified, which was transmitted to the capital and securities markets [68,69], as evidenced by the increase in the number of violations and the timely disclosure and disposal of information on violations.
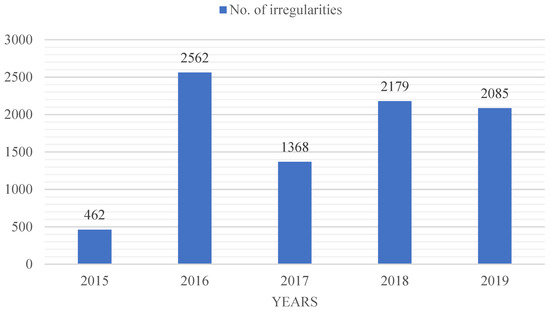
Figure 2.
Statistics on the number of violations by A-share Listed Companies from 2015–2019.
In this paper, evaluation and measurement of corporate violations are based on two indicators: Whether Irregularity and Number of Irregularity (see Table 2). Regarding Number of Irregularities, it should be noted that 441 sample companies violated the law 5486 times in five years, including 4901 times for CSI 300 companies and 585 times for ST companies; there were 24 commercial banks among CSI 300 companies, with a total of 4563 violations in five years, among which Agricultural Bank’s total violations reached the maximum number of 882 times in the five years.
Table 2.
Measurements and descriptive statistics of violations.
3.3. Structural Equation Modeling (SEM)-Based Research and Analysis
This paper hypothesizes that the supervisory board affects the supervisory performance through four Potential Characteristics: Internal Heterogeneity, Identity Background, Structural Characteristics and Organization Size. The four Potential Characteristics of the supervisory board influence supervisory performance, and Corporate Irregularities is used as a proxy for the supervisory performance. Structural equation modeling (SEM) was used to test the causal relationship between heterogeneous indicators and potential variables. Factor loadings between each factor were obtained using AMOS software, measuring the degree of importance of each factor, as well as the combined confidence of the potential variables and the discernment of the intrinsic quality of the model. In the constructed SEM, e10 and e11, and e11 and e15 are set as co-variates. The actual meaning indicates that there is a correlation between the indicator variables Average Age and Government/College Experience, Government/College Experience and Whether or not Irregularity, and this correlation does not contradict the rule of thumb and theoretical assumptions. The model diagram after two corrections is as follows (Figure 3):
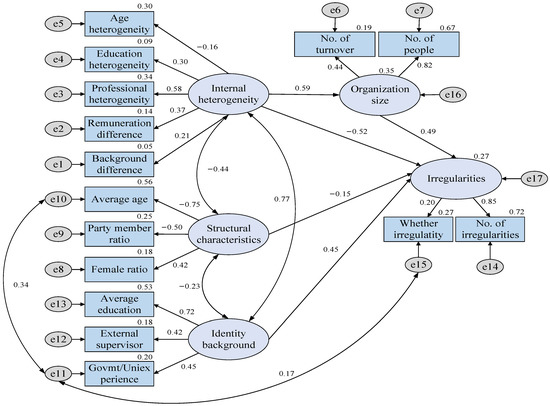
Figure 3.
Structural equation model of the influence of heterogeneous factors of the supervisory board on violations.
First, the fitted values of the main fitness indicators derived from the test are all within the range of the given recommended values (Table 3), and the chi-squared freedom ratio (X2/df) is 1.7 < 3, which can be fit; the RMSEA is 0.04 < 0.08, which can be fit; the GFI, AGFI, IFI and CFI of each indicator are all greater than 0.9, and the PNFI and PCFI are greater than 0.5, which are well fit. The theoretical model can be accepted.
Table 3.
Table of overall fitting coefficients.
Next, validity and reliability tests of the model were conducted (Table 4). The usual standardized factor loadings should be between 0.50 and 0.95, indicating a good basic fit of the model, and larger factor loading values indicate that the indicator variables effectively reflect the conformational traits they are intended to measure. In this paper, five of the fifteen measures of the five constructs have standardized factor values greater than the critical value of 0.5, indicating that these indicators (Professional Heterogeneity, Number of People, Average Age, Average Education and Number of Irregularities) are effective in reflecting the characteristics of the potential variables.
Table 4.
Validity and reliability analysis of the measurement model.
The variance ratio (R2) of the measured variables can be used as the reliability coefficient of individual variables. Four of the measured variables in this paper passed the 0.5 criterion, indicating that the intrinsic quality of these variables (Number of Irregularities, Average Education, Average Age and Number of People) in the model was tested well, the reliability of variables that did not meet the criterion needed improvement and further in-depth examination of other factors was required. The reliability of the combination of potential variables is one of the criteria for distinguishing the intrinsic quality of the model, and a value of 0.60 or higher indicates that the intrinsic quality of the model is ideal. The two conformational features of this paper, Organization Size (0.5823) and Structural Characteristics (0.58), are very close to 0.60.
The average variance extracted (AVE value) is an indicator of convergent validity, and the larger its value, the more effectively the measure reflects the potential qualities of its common factor conceptualization, and the general discriminant should be greater than 0.50. The experimental model in this paper does not have good convergent validity.
Again, the theoretical relationships established in the conceptualization phase were tested for support by the data through further analysis, which included the directionality and magnitude of the estimated parameters. The results in Table 5 show that the standardized regression weights are the standardized regression coefficient values (β coefficients), and the positive and negative signs of the β coefficient values can indicate the direction of influence of the original theoretical hypothesis model. In this paper, Organization Size and Identity Background positively influence the probability of irregularities and the number of irregularities, while Internal Heterogeneity and Structural Characteristics negatively influence the Irregularities. Internal Heterogeneity, Organization Size, Structural Characteristics and Identity Background have a direct effect on the probability and number of irregularities. The direct effect values of Irregularities are 0.521, 0.486, 0.154 and 0.446, respectively, only the regression coefficient of Organization Size implies significance in the model, and the absolute values of the regression coefficients (t-values) of Internal Heterogeneity and Structural Characteristics are less than 1.96, indicating that these two characteristics are not significant in the model.
Table 5.
Hypothesis testing results.
In summary, since the usual questionnaire method was not used to obtain data in this paper, the use of structural equations results in less than perfect validation conclusions, but according to Huber [70], “for generalized SEM, the focus is on detecting whether the theoretical hypothesis is valid, and thus the structural model is the main object of testing, and using strict thresholds would prevent the structural model from passing the criteria and create problems for interpretation”, so the current data analysis is acceptable only as a tool to validate the theory.
4. Research Conclusions and Implications
4.1. Research Conclusions
The governance performance of the board of supervisors cannot be directly equivalent to the company’s operating performance, but should be a comprehensive evaluation system, which should reflect not only the work efficiency and organizational efficiency of the board of supervisors, but also the role and efficiency of supervision. Therefore, this paper first demonstrates the rationality of the correlation between violations and supervision performance, selects listed Corporate Irregularities as a substitute indicator to measure the governance performance of the board of supervisors, obtains the conceptual model of the impact mechanism through research and analysis of the theoretical basis, uses the Structural Equation Model to verify the theoretical assumptions, and obtains an acceptable model through the calculation of AMOS software. The results show that there are 13 key heterogeneity factors of the board of supervisors that affect the supervision performance, and the action paths are:
- (1)
- Age Difference, Income Difference, Educational Difference, Professional Heterogeneity, Background Difference → Internal Heterogeneity → Corporate Irregularities
- (2)
- Internal Heterogeneity → Organization Size → Corporate Irregularities
- (3)
- Number of Supervisors, Staff Turnover → Organization Size → Corporate Irregularities
- (4)
- Female Percentage, Average Age, Percentage of Party Members → Structural Characteristics → Corporate Irregularities
- (5)
- Government/College Experience, External Supervisor, Average Education → Identity Background → Corporate Irregularities
Through the research, it was found that Professional Heterogeneity can best reflect the level of individual heterogeneity within the board of supervisors with a factor loading of 0.583, but this Internal Heterogeneity has very limited effect on the occurrence of Corporate Irregularities. The direct effect of Internal Heterogeneity on corporate misbehavior is not significant, so this paper considers whether there are other mediating paths and finds that Internal Heterogeneity has a strong positive relationship with Organizational Size.
Organizational Size has a significant impact on Irregularities, and the Number of Supervisors is an important factor in building the characteristics with factor loadings of 0.821. Although a larger supervisory board can cover more diverse expertise and information, it also means more complex relationships, increased agency costs and reduced stability that lead to lower internal performance. At the same time, higher Staff Turnover means more instability in the organization, lower performance and higher probability of irregularities, which also verifies the positive effect of Organization Size on Irregularities.
Structural Characteristics are conducive to reducing violations, but their influence is very weak. Female Percentage has the factor loading 0.422, which verifies the conclusion of Lu [61] that female executives can inhibit corporate disclosure violations and are significantly and negatively related to the probability of corporate violations. Average Age is the largest and has a negative effect (−0.747), indicating that the lower the average age is, the more effective it is in reflecting the conceptual characteristics of Structural Characteristics, so the conclusion is drawn that the Average Age factor is negatively related to irregularities. Therefore, it can be seen that although the Average Age and the Percentage of Party Members can well conceptualize the Structural Characteristics, the effect on the monitoring performance is not significant, which might indicate that the relationship between the governance of the supervisory board and irregularities is influenced by many other factors, such as information disclosure, industry nature, and shareholding structure, when the overall context of irregularities is examined.
The significance probability values of External Supervisor and Average Education are less than 0.001, which indicates that the relevant variables can significantly reflect the characteristics of Identity Background. The factor loadings of Government/College Experience and External Supervisor are close to 0.5, and the factor loading of Average Education is 0.725, which indicates that the higher the education is, the more effectively it can reflect the conceptual quality of Identity Background. Whether based on Social Identity Theory or Informational Decision Theory, Identity Background should be beneficial in improving supervision performance and reducing irregularities. However, the validation results of the model do not support the hypothesis that the Identity Background does not have a negative impact on Corporate Irregularities. The reason might be that the Behavioral Integration Theory is probably ignored in the objective reality.
According to Yao and Sun [18], Behavioral Integration is a process in which members actively share information and resources and actively participate in decision-making, which is the core of the team operation process and reflects the effectiveness of teamwork. Communication Frequency is a mediating variable between executive team composition and organizational performance: male ratio, average education and average tenure are positively related to communication frequency, while average age is negatively related to communication frequency, and communication frequency is significantly positively related to organizational performance. The mediating role of communication frequency is not considered in this paper, but according to the above findings, if communication frequency helps to improve supervisory performance, then it can be inferred that Identity Background, although representative of the supervisory board’s incumbency and overall level of competence, may not be conducive to team communication and exchange.
In order to verify the negative correlation between the three factors of External Supervisor, Government/College Experience and Average Education, and Communication Frequency, this paper selects Number of Meetings (logarithm of the actual number of meetings held during the latest supervisory board) as a proxy variable for Communication Frequency and measures the Pearson correlation between several variables using SPSS software. The results (Table 6) show that although the correlations are weak, the correlation coefficients are all negative, demonstrating the negative correlation between the three factors representing the characteristics of Identity Background and Communication Frequency.
Table 6.
Pearson correlation analysis.
4.2. Implications and Further Research
In terms of theoretical research, the current research on the board of supervisors is still very limited and prejudiced in China. Compared with the board of directors system and the independent director system, the organizational structure of the supervisor board is relatively simple as well. Therefore, it is difficult to collect cases and documents. Meanwhile, the vast majority of supervisor boards are still composed of equity supervisors and employee supervisors. There are no independent supervisors or external supervisors. Some enterprise boards of supervisors are mainly part-time; they often lack sufficient energy and time to conduct comprehensive and detailed supervision and inspection of enterprises. On the other hand, many studies have focused on the causes, mechanisms or harms of violations in the past [71], but few have taken irregularities as performance indicators. This paper links the heterogeneity of the supervisor board with corporate irregularities and, furthermore, demonstrates the rationality of measuring the performance of the board of supervisors by corporate irregularities. This work enriches the research on the risk of company violations and irregularities, and also lays a foundation for further research and evaluation of the supervisory performance of the board of supervisors.
In terms of practical implications, it is found that the supervisory board as a whole has a comprehensive coordination role for individual supervisors; even if each supervisor has different individual characteristics and represents different interests, the supervisory board will absorb the different voices and resolve the contradictions between interests. Therefore, with the heterogeneity dimensions and indicators of the supervisor board as the starting point, the research on micro individuals has gradually expanded to team relations and comprehensive evaluation. However, the sample selection has limitations that require more in-depth research. When collecting sample data, this paper selects the information of 441 members of the supervisor boards of Shanghai Shenzhen 300 companies and ST companies, and makes preliminary comparative observation in the process of statistical analysis, so as to highlight the differences in company size, asset quality and internal governance structure. Although the sample can represent the two extremes of asset scale and operating performance, it cannot further distinguish industries and regions, which affects the statistical validity of the empirical analysis conclusions to a certain extent.
At the same time, the endogeneity of the model is not considered. When using Irregularities Behavior as an alternative variable of supervision performance, the sample selection deviation will be caused by the lack of information disclosure. Considering that the statistics on Irregularities of Listed Companies are actually based on the probability set of two events, Irregularities of listed companies and Disclosure by regulatory authorities, that means not all irregularities are the result of random selection, e.g., companies that have not been found or have not disclosed violations are assigned a value of 0, just as with companies that have disclosed no violations. Therefore, only using disclosed violations to examine influencing factors will lead to sample selection bias. In order to solve this problem, the two-stage model method proposed by Heckman could be used in future research.
Author Contributions
Conceptualization, Y.C. and J.X.; methodology, Y.C.; software, Y.C.; validation, J.X.; formal analysis, Y.C.; investigation, J.X.; resources, Y.C.; data curation, Y.C.; writing—original draft preparation, Y.C.; writing—review and editing, Y.C.; visualization, Y.C.; supervision, Y.C.; project administration, Y.C. and J.X. All authors have read and agreed to the published version of the manuscript.
Funding
This research received no external funding.
Institutional Review Board Statement
Not applicable.
Informed Consent Statement
Not applicable.
Data Availability Statement
The data that support the conclusion of this research are available upon request from the corresponding author.
Conflicts of Interest
The authors declare no conflict of interest.
References
- Bassen, A.; Schiereck, D.; Thamm, C. Activist shareholders and the duration of supervisory board membership: Evidence for the German aufsichtsrat. Corp Own. Control 2016, 13, 521–531. [Google Scholar] [CrossRef]
- Dienes, D.; Velte, P. The impact of supervisory board composition on CSR reporting. Evidence from the German two-tier system. Sustainability 2016, 8, 63. [Google Scholar] [CrossRef]
- Dahya, J.; Karbhari, Y.; Xiao, J.Z. The supervisory board in Chinese listed companies: Problems, causes, consequences and remedies. Asia Pac. Bus. Rev. 2002, 9, 118–137. [Google Scholar] [CrossRef]
- Agrawal, A.; Chadha, S. Corporate governance and accounting scandals. J. Law Econ. 2005, 48, 371–406. [Google Scholar] [CrossRef]
- Wu, H.Y. Correlation analysis of supervisory board members’ traits and supervisory board governance performance. Commun. Financ. Account. 2013, 21, 72–75. [Google Scholar] [CrossRef]
- Lin, Y.F.; Yeh, Y.M.C.; Yang, F.-M. Supervisory quality of board and firm performance: A perspective of board meeting attendance. Total Qual. Manag. Bus. Excell. 2014, 25, 264–279. [Google Scholar] [CrossRef]
- Simons, T.; Pelled, L.H.; Smith, K.A. Making use of difference: Diversity, debate, and decision comprehensiveness in top management teams. Acad. Manag. J. 1999, 42, 662–673. [Google Scholar]
- Pelled, L.H.; Eisenhardt, K.M.; Xin, K.R. Exploring the black box: An analysis of work group diversity, conflict and performance. Adm. Sci. Q. 1999, 44, 1–28. [Google Scholar] [CrossRef]
- Hambrick, D.C. Upper echelons theory: An update. Acad. Manag. Rev. 2007, 32, 334–343. [Google Scholar] [CrossRef]
- Utomo, M.N.; Rahayu, S.; Kaujan, K.; Irwandi, S.A. Environmental performance, environmental disclosure, and firm value: Empirical study of non-financial companies at Indonesia Stock Exchange. Green Financ. 2020, 2, 100–113. [Google Scholar] [CrossRef]
- Yang, R.; Zhang, R. Environmental Pollution Liability Insurance and Corporate Performance: Evidence from China in the Perspective of Green Development. Int. J. Environ. Res. Public Health 2022, 19, 12089. [Google Scholar] [CrossRef]
- Junaid, M.; Xue, Y.; Syed, M.W.; Ziaullah, M.; Riffat, N. Corporate governance mechanism and performance of insurers in Pakistan. Green Financ. 2020, 2, 243–262. [Google Scholar] [CrossRef]
- Wu, C.S.; Shao, X.S.; Xu, H.; Guo, K.C. TMT’s age heterogeneity, overconfidence and enterprise growth: Based on experience data of A-share listed manufacturing companies. Sci. Decis. 2017, 5, 1–18. Available online: https://kns.cnki.net/kcms/detail/detail.aspx?dbcode=CJFD&dbname=CJFDLAST2017&filename=KXJC201705001&uniplatform=NZKPT&v=hzTEpWMxxAes7tGl3T15_O4xLA1Jsi1ys-IErweHRsNzknugukKXmVnaK-TO724i (accessed on 25 August 2022).
- Zheng, M.L.; Cheng, D. Research on the impact of heterogeneity of independent director team on accounting information quality. J. Zhejiang Univ. Technol. Soc. Sci. Ed. 2012, 11, 320–325. [Google Scholar]
- Boden, R.J.; Nucci, A.R. On the survival prospects of men’s and women’s new business ventures. J. Bus. Ventur. 2000, 15, 347–362. [Google Scholar] [CrossRef]
- Manouchehrabadi, B.; Letizia, P.; Hendrikse, G. Governance of collective entrepreneurship. J. Econ. Behav. Organ. 2021, 185, 370–389. [Google Scholar] [CrossRef]
- Kok, S.K.; Giorgioni, G.; Farquhar, S. The trade-off between knowledge accumulation and independence: The case of the Shariah supervisory board within the Shariah governance and firm performance nexus. Res. Int. Bus. Financ. 2022, 59, 101549. [Google Scholar] [CrossRef]
- Yao, Z.; Sun, H. Research on the relationship between executive team composition characteristics and behavioral integration. Nankai Bus. Rev. 2010, 13, 15–22. [Google Scholar]
- Miller, T.; del Carmen Triana, M. Demographic diversity in the boardroom: Mediators of the board diversity–firm performance relationship. J. Manag. Stud. 2009, 46, 755–786. [Google Scholar] [CrossRef]
- Kim, K.-H.; Rasheed, A.A. Board heterogeneity, corporate diversification and firm performance. J. Manag. Res. 2014, 14, 121. [Google Scholar]
- Anderson, R.C.; Reeb, D.M.; Upadhyay, A.; Zhao, W. The economics of director heterogeneity. Financ. Manag. 2011, 40, 5–38. [Google Scholar] [CrossRef]
- Levy, O.; Reiche, B.S. The politics of cultural capital: Social hierarchy and organizational architecture in the multinational corporation. Hum. Relat. 2018, 71, 867–894. [Google Scholar] [CrossRef]
- Du, X.Q.; Yin, J.W.; Lai, S.J. On seniority, CEO tenure and dissenting behavior of independent directors. China Ind. Econ. 2017, 12, 151–169. [Google Scholar] [CrossRef]
- Alkhataybeh, A.; AlSmadi, S.A.; Shakhatreh, M.Z.; Khataybeh, M.A. Government Ownership and Corporate Cash Holdings: Empirical Evidence from the Amman Stock Exchange. Sustainability 2022, 14, 11168. [Google Scholar] [CrossRef]
- Black, B.; Kim, W.; Nasev, J. The Effect of Board Structure on Firm Disclosure and Behavior: A Case Study of Korea and a Comparison of Research Designs. J. Empir. Leg. Stud. 2021, 18, 328–376. [Google Scholar] [CrossRef]
- Uzun, H.; Szewczyk, S.H.; Varma, R. Board composition and corporate fraud. Financ. Anal. J. 2004, 60, 33–43. [Google Scholar] [CrossRef]
- He, X.G.; Deng, H.; Wu, S.Y.; Liang, P. Catch-up pressure and firms’ defeat behavior—An analysis of data from Chinese listed companies. Manag. World 2015, 9, 104–124. [Google Scholar] [CrossRef]
- Engel, P.J.; Hack, A.; Stanley, L.J.; Kellermanns, F.W. Voluntary disclosure of individual supervisory board compensation in public family firms. J. Bus. Res. 2019, 101, 362–374. [Google Scholar] [CrossRef]
- Zhou, Z.; Ma, J.; Hu, L. Can economic independence promote the governance function of supervisory boards—Empirical evidence based on the per-spective of corporate violations. Nankai Bus. Rev. 2019, 22, 62–76. [Google Scholar]
- Wu, H.; Hao, Y.; Ren, S. How do environmental regulation and environmental decentralization affect green total factor energy efficiency: Evidence from China. Energy Econ. 2020, 91, 104880. [Google Scholar] [CrossRef]
- Iwedi, M.; Anderson, O.E.; Barisua, P.S.; Zaagha, S.A. Enterprise risk management practice and shareholders value: Evidence from selected quoted firms in Nigeria. Green Financ. 2020, 2, 197–211. [Google Scholar] [CrossRef]
- Syed, M.W.; Li, J.; Junaid, M. Relationship between human resource management practices, relationship commitment and sustainable performance. Green Financ. 2020, 2, 227–242. [Google Scholar] [CrossRef]
- Ren, S.; Hao, Y.; Wu, H. Government corruption, market segmentation and renewable energy technology innovation: Evidence from China. J. Environ. Manag. 2021, 300, 113686. [Google Scholar] [CrossRef]
- Zhang, R.G.; Yang, R.Z.; Huang, Y. Does the marketization of land use transfer have an impact on carbon emissions? Evidence from China. Front. Environ. Sci. 2022. [Google Scholar] [CrossRef]
- Wang, X.; Ma, L.; Wang, Y. The impact of executive team functional background on corporate performance: An example of listed companies in China’s information technology industry. Nankai Bus. Rev. 2013, 16, 80–93. [Google Scholar]
- Han, L.F.; Wang, C.M.; Xu, Z.W. Theoretical Review on the Study of Group Diversity: Reflection on the theory of group fault. Adv. Psychol. Sci. 2010, 18, 374–384. [Google Scholar]
- Zhang, R.G.; Zhang, H. Directors’ liability insurance, board size and litigation risk. Wuhan Financ. 2019, 11, 60–65. Available online: https://kns.cnki.net/kcms/detail/detail.aspx?dbcode=CJFD&dbname=CJFDLAST2019&filename=YHQY201911009&uniplatform=NZKPT&v=vSGS1iikrxSZ4A2vt6OLd65Z_eiYWlbZ4P_FEwdD3Urdc4Brin5_0ioSEQLPo1UB (accessed on 25 August 2022).
- Liu, X.M.; Wang, L.; Wu, S.J. General manager turnover, management shareholding and executive team rebuilding: Empirical evidence based on listed companies. J. Tech. Econ. Manag. 2011, 5, 55–59. Available online: https://kns.cnki.net/kcms/detail/detail.aspx?dbcode=CJFD&dbname=CJFD2011&filename=JXJG201105014&uniplatform=NZKPT&v=EyaIpqD9jDFmLhQvGaGHDKHmzwozi35qemPmSbYUDJt44AjRr1YSHLoDu60_LXdQ (accessed on 25 August 2022).
- Michel, J.G.; Hambrick, D.C. Diversification posture and top management team characteristics. Acad. Manag. J. 1992, 35, 9–37. [Google Scholar] [CrossRef]
- Wang, S.; Yang, C.; Li, Z. Green Total Factor Productivity Growth: Policy-Guided or Market-Driven? Int. J. Environ. Res. Public Health 2022, 19, 10471. [Google Scholar] [CrossRef]
- Wang, S.Q.; Song, H.Y. Should listed companies implement an independent supervisory system?—Evidence from the Chinese securities market. Account. Res. 2011, 10, 69–76, 97. Available online: https://kns.cnki.net/kcms/detail/detail.aspx?dbcode=CJFD&dbname=CJFD2011&filename=KJYJ201110012&uniplatform=NZKPT&v=Mxv4akbuWn4EM3lmXIO8YtA8mSzvGsNzFCuiBBVfN2inDHWFtAx171ZBXu5cV4Yp (accessed on 25 August 2022).
- Li, F.; Yang, C.; Li, Z.; Failler, P. Does geopolitics have an impact on energy trade? Empirical research on emerging countries. Sustainability 2021, 13, 5199. [Google Scholar] [CrossRef]
- Ren, S.; Li, L.; Han, Y.; Hao, Y.; Wu, H. The emerging driving force of inclusive green growth: Does digital economy agglomeration work? Bus. Strategy Environ. 2022, 31, 1656–1678. [Google Scholar] [CrossRef]
- Gazzaroli, D.; Gozzoli, C.; Sánchez-Gardey, G. The living and working together perspective on creativity in organizations. Front. Psychol. 2019, 10, 2733. [Google Scholar] [CrossRef] [PubMed]
- Nielsen, S. Top management team diversity: A review of theories and methodologies. Int. J. Manag. Rev. 2010, 12, 301–316. [Google Scholar] [CrossRef]
- Li, W.; Wu, D. A study on the relationship between dominant characteristics of new CEOs and business performance based on the moderating effect of TMT age and tenure heterogeneity. Chin. J. Manag. 2014, 11, 1158–1167. [Google Scholar]
- Eesley, C.E.; Hsu, D.H.; Roberts, E.B. The contingent effects of top management teams on venture performance: Aligning founding team composition with innovation strategy and commercialization environment. Strateg. Manag. J. 2014, 35, 1798–1817. [Google Scholar] [CrossRef]
- Xiao, T. Executive team characteristics, service innovation and performance of manufacturing firms. Sci. Res. Manag. 2016, 37, 142–149. [Google Scholar]
- Jackson, S.E.; Joshi, A. Diversity in social context: A multi-attribute, multilevel analysis of team diversity and sales performance. J. Organ. Behav. Int. J. Ind. Occup. Organ. Psychol. Behav. 2004, 25, 675–702. [Google Scholar] [CrossRef]
- Homberg, F.; Bui, H.T. Top management team diversity: A systematic review. Group Organ. Manag. 2013, 38, 455–479. [Google Scholar] [CrossRef]
- He, J.; Huang, Z. Board informal hierarchy and firm financial performance: Exploring a tacit structure guiding boardroom interactions. Acad. Manag. J. 2011, 54, 1119–1139. [Google Scholar] [CrossRef]
- Xie, Y.; Zhang, Y.; Zhang, H.; Zhen, Y. The effect of formal and informal board structure on the frequency of board meetings—The moderating effect of informal communication on the intensity of board behavior. Foreign Econ. Manag. 2015, 37, 15–28. [Google Scholar]
- Gao, F.; Li, K.; Wang, S.Q. Grey correlation analysis of influencing factors of Board of Supervisors governance. J. Northeast Univ. Nat. Sci. 2009, 30, 1205–1207, 1212. Available online: https://kns.cnki.net/kcms/detail/detail.aspx?dbcode=CJFD&dbname=CJFD2009&filename=DBDX200908036&uniplatform=NZKPT&v=EZtlMccgGEOWnBClHBFEmjql3WQVeCLmZ5z1pBZ5ETJVxDSu9Bb9hpJkO3pxc3Aq (accessed on 25 August 2022).
- Xue, Z.; Huang, T. Board of directors, supervisory board institutional characteristics and accounting information quality—An empirical analysis from the Chinese capital market. Theory Pract. Financ. Econ. 2004, 25, 84–89. [Google Scholar]
- Hao, Y.; Huang, J.; Guo, Y.; Wu, H.; Ren, S. Does the legacy of state planning put pressure on ecological efficiency? Evidence from China. Bus. Strategy Environ. 2022. [Google Scholar] [CrossRef]
- Cui, Y.; Wang, Y.S. An empirical study on the correlation between institutional characteristics of supervisory boards and violations in listed companies. Product. Res. 2010, 9, 208–210. [Google Scholar] [CrossRef]
- Li, S.H.; Jiang, X.F.; Song, X.Z. Executive age and compensation incentives: Theoretical path and empirical evidence. China Ind. Econ. 2015, 326, 122–134. [Google Scholar] [CrossRef]
- Liu, Y.; Yu, L.; Yang, C.; Li, Z. Heterogeneity of the Impact of Geopolitical Events on Energy Trade: An Empirical Study Based on Regression Discontinuity Design. Front. Environ. Sci. 2021. [Google Scholar] [CrossRef]
- Su, L.J. Female executives, internal control quality, and inefficient investment. Commun. Financ. Account. 2019, 36, 39–42. [Google Scholar] [CrossRef]
- Manner, M.H. The impact of CEO characteristics on corporate social performance. J. Bus. Ethics 2010, 93, 53–72. [Google Scholar] [CrossRef]
- Lu, J. Do female executives inhibit violations in listed companies?—Empirical evidence from the Chinese capital market. China Econ. Stud. 2015, 292, 66–81. [Google Scholar] [CrossRef]
- Ma, L.F.; Wang, Y.F.; Shen, X.X. Research on the Governance Effect of Party Organizations in Chinese State-owned Enterprises—Based on the Perspective of “Insiders Control”. China Ind. Econ. 2012, 8, 82–95. [Google Scholar] [CrossRef]
- Sun, K.; Liu, X.; Xie, B. Executive team characteristics, pay gap and entrepreneurial firm performance. Sci. Res. Manag. 2019, 40, 116–125. [Google Scholar] [CrossRef]
- Li, L.; Lv, C.; Yu, J. Independent Directors of Colleges and Universities and the Performance of Private Listed Companies—“Acting Supervisor” and “Assisting the Public”. Manag. Rev. 2018, 30, 98–117. [Google Scholar]
- Ye, Q.; Zhao, L.; Liu, S. An investigation of independent directors’ “political and business revolving door”: A study based on natural experiments. Econ. Res. J. 2016, 51, 87–113. [Google Scholar]
- Xi, M.; Hong, X.J. A simple method of calculating the Gini coefficient—The covariance formula. Stat. Decis. 2007, 21, 161–162. Available online: https://kns.cnki.net/kcms/detail/detail.aspx?dbcode=CJFD&dbname=CJFD2007&filename=TJJC200721061&uniplatform=NZKPT&v=CF6ypZH5eazD07MTGM4fwOP7sOXnrArUuRBZL6646yB_lZtiCcwyHeUjqI6K-jMi (accessed on 25 August 2022).
- Li, Z.; Yang, C.; Huang, Z. How does the fintech sector react to signals from central bank digital currencies? Financ. Res. Lett. 2022, 50, 103308. [Google Scholar] [CrossRef]
- Yang, X.; Wang, J.; Cao, J.; Ren, S.; Ran, Q.; Wu, H. The spatial spillover effect of urban sprawl and fiscal decentralization on air pollution: Evidence from 269 cities in China. Empir. Econ. 2022, 63, 847–875. [Google Scholar] [CrossRef]
- Su, Y.; Li, Z.; Yang, C. Spatial interaction spillover effects between digital financial technology and urban ecological efficiency in China: An empirical study based on spatial simultaneous equations. Int. J. Environ. Res. Public Health 2021, 18, 8535. [Google Scholar] [CrossRef]
- Huber, C. Generalized structural equation modeling using stata. In Proceedings of the Italian Stata Users Group Meeting, Florence, Italy, 14–15 November 2013; pp. 14–15. [Google Scholar]
- Xu, S.; Yang, C.; Huang, Z.; Failler, P. Interaction between Digital Economy and Environmental Pollution: New Evidence from a Spatial Perspective. Int. J. Environ. Res. Public Health 2022, 19, 5074. [Google Scholar] [CrossRef]


Publisher’s Note: MDPI stays neutral with regard to jurisdictional claims in published maps and institutional affiliations. |
© 2022 by the authors. Licensee MDPI, Basel, Switzerland. This article is an open access article distributed under the terms and conditions of the Creative Commons Attribution (CC BY) license (https://creativecommons.org/licenses/by/4.0/).